1. Introduction
Wood is the only renewable resource with carbon sequestration properties among the world’s four basic materials (steel, cement, plastic, and wood) [
1,
2]. While carbon peaking and carbon neutrality are becoming a global consensus, scientific and innovative wood applications have ushered in a new period of development opportunities. Wood scrimber (WS) is a novel engineered wood-based structural material processed by laminating wood fiber bundles (WFB) impregnated with resin under hot pressing [
3,
4]. WS has the following remarkable characteristics:
The mechanical properties of WS [
5] are comparable to high-quality hard broad-leaved wood [
6], including high density, high strength, high hardness, and good bending resistance;
WS can balance mechanical properties and special functions because modified liquids can be impregnated while impregnating the resin. Therefore, a series of special-function WS has been invented, such as fire prevention [
7,
8], mildew resistance [
9], hydrophobicity, and dimensional stability [
10];
WS has low internal stress and strong material consistency and stability [
11];
WS uses fast-growing forest wood as raw material; thus, it can realize the large-dimension use of small-dimension wood and the superior use of inferior wood, and solve the problem of the shortage of high-quality structural wood resources [
12].
The enhanced performance of WS is closely related to the specific structure of WFB, characterized by a controlled cracking pattern where the longitudinal fibers remain intact, and the transverse fibers are partially connected [
13], thereby improving permeability and adhesion. Therefore, the quantitative evaluation and online regulation of the cracking degree (CD), such as the use of machine vision and CT [
14,
15], could help improve and stabilize the quality of WFB. As the production quality of WFB becomes more stable and controllable, the microstructure of WS will be more controllable, uniform, and orderly. Therefore, the quality of WS will be improved significantly. Meanwhile, with the quantitative evaluation and online regulation of the cracking degree, refining the production processes of WS could be achieved, such as reducing impregnation time to increase productivity and reducing impregnation concentration to reduce production costs and carbon emissions [
16,
17]. However, the current methods for the quantitative evaluation of the quality of WFB in engineering practice and scientific research mainly rely on spot checks of their water absorption rate (WAR) or subjective visual observations based on personal feelings. The evaluation results have not been quantitatively graded or discussed in depth, and the water absorption rates obtained from spot checks remain merely rough adjustments to the process flow and process parameters based on expert experience. It is against this backdrop that this study attempted to explore methods for the online evaluation of WFB quality, hoping to provide a reference for future research.
Theoretically, the most accurate quantitative characterization of CD is the specific surface area of WFB. Still, the specific surface area cannot be directly and effectively measured in practice. Therefore, previous studies have indirectly characterized the CD by soaking the water absorption of WFB in 5–10 min [
12,
13,
18]. Although this method can classify the CD, the non-online grading judgment process can only be used for sampling checks. What is worse is it is destructive because water-soaked and dry WFBs show different adsorption properties for adhesives and modified liquids. To address these challenges, this study proposed a machine learning method to predict the water absorption rate of WFB through the image characteristics of cracks and then to evaluate the CD.
Therefore, to fully exploit the morphological features of the cracks, an efficient algorithm (
Supplementary Materials Figure S1) for the crack extraction of WFB was designed in this study, and CD quantitative characterization parameters were built for the first time in the analysis of WFB images. Furthermore, WFBs made from poplar wood were chosen as the experimental material in this study [
19] because poplar wood is the most popular raw material for WS preparation in northern China; compared with other woods, poplar wood has significant advantages such as fast growth speed, a large artificial planting area, and low raw material cost. Meanwhile, a gradient of one to three roller-cracking times was established to investigate the dynamic changes in CDs under controlled roller-cracking conditions and to analysis the distribution of CDs across each gradient [
20,
21,
22]. Specifically, this study aimed to:
- (1)
Obtain the WAR and calculate the CD quantitative characterization parameters of WFB specimens.
- (2)
Refine the parameter combination, select the best feature descriptor generation method, and obtain a CD feature descriptor.
- (3)
Evaluate the segmented prediction model generated by polynomial fitting based on principal component analysis (PCA) dimensionality reduction [
23].
- (4)
Refine the prediction model based on the proportion of sapwood and wetwood.
- (5)
Integrate segmented models and evaluate the performance.
2. Materials and Methods
2.1. Materials
Over 200 tree trunks of plantation poplar (Populus tomentosa Carr.), aged over 5 years and with a diameter of 30–35 cm, were obtained from Linyi, Shandong, China (35.0° N, 118.3° E, a temperate monsoon climate with annual average precipitation of 800 mm and an annual average temperature of 14 ℃).
2.2. Preparation of Wood Fiber Bundles
After debarking, the log with a length of 2 m was rotary cut into veneers with a thickness of 6 mm. Afterward, the veneers were cut into strips with a width of 100 mm. Then, the veneers were entered into the custom-made roller-cracking machine (
Figure 1) to induce cracking 1–3 times (three levels of cracking: cracking once (C1), cracking twice (C2), and cracking three times (C3)) to obtain the WFBs. To ensure the randomness of the sampling, this study randomly selected 20 pieces every half hour from the WFB pile. Finally, the WFBs were sawn into rectangular specimens with a height of 200 mm and naturally air-dried to a moisture content (MC) between 6.5% and 8.8%.
2.3. Water Adsorption Rate Assay
The experimental conditions were maintained at a room temperature (RT) of 23 ± 1 ℃ and relative humidity (%RH) of 31% ± 4%. Distilled water was prepared, and an electronic balance with an accuracy of 0.01 g (Model YP10002B, Lichen, Shanghai, China) was used for weighing. The formula for calculating the WAR is given in Equation (1):
where
is the WAR,
is the dry weight of the specimens,
is the wet weight of 300 s of soaking, and
is the wet weight of 600 s of soaking.
2.4. Extracting and Quantifying Surface Crack Features from Images
The crack images of the specimens were taken by a custom-made machine vision system, which was composed of a workbench, two white strip light sources (JH-LS30050-W, JuHui Photoelectric Co., Guangdong, China), and a color area scan camera with a SA25220M-10MP lens (Manta G-235, Allied Vision, Stadtroda, Germany), captured by Vimbar_v6.0_Windows software and processed by Python language 3.11.4.
Quantitatively characterizing feature parameters is the process of digitizing the CD. There were four CD quantitative characterization parameters defined (
M is the image’s height, and
N is the image’s width): cracking density (
) is the ratio of the number of crack pixels in the row statistics to the number of row pixels (
Figure 2); coherence degree (
) is the ratio of the number of crack pixels in the column statistics to the number of column pixels; count of cracks (
, CC) is counting the number of cracks obtained line by line; and average width (
, AW) is the ratio of the number of crack pixels in the row statistics to the count of cracks. Their calculation formula is expressed in Equation (2):
where
is the binary image of crack segmentation,
is the vector with all elements of 1,
,
is the row index,
is the column index, and
is the convolutional operation.
2.5. Statistical Analysis Methods for Cracking Degree Quantitative Characterization Parameters
The multivariate statistical analysis method [
24,
25] was applied to analyze defined CD quantitative characterization parameters by R language 4.3.2 and Origin 2021 software, including the principal component analysis, cluster analysis, canonical correlation analysis, discriminant analysis, etc.
For the principal component analysis, the first two principal components were visualized. For the cluster analysis, Ward [
26,
27] was chosen as the clustering method, Euclidean was chosen as the distance type, the number of clusters was set to 3, and the minimum sum of distances within each category was chosen as the basis for finding the cluster center point. For the canonical correlation analysis [
28], the data visualization and exploration were performed using the “ggpairs” function from the “GGally” package. For the discriminant analysis, heteroscedasticity was set as the discriminant function, a prior probability was set to adjust the proportion based on group size, and the classification accuracy of the selected feature in terms of cracking level under the specific feature descriptor generation method was defined as the discrimination error.
2.6. Feature Descriptor Generation Methods
This study proposed two methods for generating CD feature descriptors: Feature Integration (FI) and Feature Splicing (FS). The core idea of FI is producing the vectors of row and column statistics to construct a feature matrix, which transforms the process of generating features into a weighted sum operation of feature matrices; the mathematical definition is expressed in Equation (3). As for FS, it is to connect the vectors of row and column statistics sequentially, forming a higher dimensional feature vector. The process of generating features is transformed into the operation of feature vector weighted concatenation, and the mathematical definition is expressed in Equation (4):
where
is the weight,
is the CD feature descriptor, and
T is the transpose operation.
2.7. Predictive Modeling Method
Polynomial regression prediction based on PCA dimensionality reduction, as a machine learning approach [
29], was applied to describe the relationship between the WAR and CD feature descriptor quantitatively [
30,
31]; the mathematical definition is expressed in Equation (5):
where
is the number of CD feature descriptors,
is the PCA dimensionality reduction operation,
is the dimensionality of PCA dimensionality reduction,
is the order of polynomial fitting, and
is the weight.
What is more, the prediction accuracy was assessed by the average mean squared error (Average MSE) using the different settings of the dimensionality of PCA dimensionality reduction and the order of polynomial fitting under different random sampling seeds and selecting the optimal combination of the prediction parameters. The mathematical definition is expressed in Equation (6):
where
is the number of specimens,
is the sample size,
is the identity of the random sampling seed,
is the number of random sampling seeds,
is the specimen, and
is the actual measured value of the WAR.
2.8. Model Refinement Method
Poplar trees are originally sapwood species, but due to the influence of external environmental factors and biological factors, their heartwood changes, causing the heartwood to display a distinct red color different from the sapwood, and the moisture content of the heartwood is higher than that of the sapwood. This type of heartwood is commonly referred to as wetwood [
32,
33]. The wetwood phenomenon is an important problem that affects the normal growth and effective utilization of poplar, and the incidence of wetwood in poplar is as high as 100% [
34]. And the wetwood phenomenon has been reported in plantation poplar trees with a diameter of <30 cm [
35].
Therefore, this study proposed to refine the prediction model based on the proportion of sapwood and wetwood, which can be distinguished by grayscale value distribution statistics in the
R channel (the sapwood of poplar wood is primarily white to light yellow, while the wetwood is red–brown to brown). The mathematical definition is expressed in Equation (7):
where
is the grayscale value point by point,
is the lower bound of statistical grayscale values,
is the upper bound of statistical grayscale values,
is the differentiation threshold of sapwood,
is the differentiation threshold of wetwood,
is the corrected predicted value of water absorption,
is the correction coefficient for sapwood,
is the correction coefficient for wetwood, and
is the correction coefficient for mixed sapwood and wetwood.
3. Results
3.1. Water Absorption Rate Profiles
Figure 3 shows that the WAR distribution of C1–C3 covered a range of 30%–100%, 50%–160%, and 80%–160%. The three-level data showed a bell-shaped distribution with high middle and low sides, where the central mean peaks of C1 and C3 were relatively significant, located in the range of approximately 60%–70% and 110%–120%, respectively. The distribution range of C2 had a large span and no significant fluctuations. Combined with the mean value and standard deviation of the three-level specimens in
Table 1, as the level of cracking increased, the average WAR of the specimen continued to increase, with the average values being 62.70%, 105.94%, and 119.29%, respectively. However, the increase showed a saturation characteristic, with the increase values being 43.24% and 13.35%, respectively. The standard deviation of the WAR first increased and then decreased, and the maximum standard deviation during C2 was 23.67%. From the above analysis, it can be inferred that the cracking of the specimens during the roller-cracking process was uneven. With the increase in cracking times, the overall degree of cracking increased, but its increment continued to decrease. At the same time, with the increase in cracking times, the uniformity of the actual CD of the specimens also improved.
3.2. Feature Descriptor Selection Based on Discriminant Analysis
The discrimination error is the classification accuracy of the selected feature regarding cracking level under the specific feature descriptor generation method. When all the weights
k are selected as 1 (Equations (3) and (4)), there were four feature selection methods: Base (selecting cracking density and coherence degree), Base_CC (selecting Base and CC), Base_AW (selecting Base and AW), and Base_AW_CC (selecting Base, AW, and CC). Therefore, there were eight types of feature descriptors (two feature descriptor generation methods × four feature selection methods). As shown in
Figure 4, both feature descriptor generation methods (FI and FS) achieved the minimum accumulative relative error when selecting the feature Base (sum of the relative errors of C1–C3 under the same feature selection method), the maximum accumulative relative error when selecting the feature Base_AW, and the relative errors of different cracking levels were very close at Base_AW_CC and Base_CC. In addition, when selecting the feature Base, the accumulative relative error of FS was the most minor at <0, indicating a decrease in overall relative discrimination error. As for the accumulative relative error of FI, it was also very close to 0, but that of FI was higher than that of FS. Therefore, this study chose FS + Base to obtain the feature descriptor.
3.3. Generation and Evaluation of Segmented Prediction Model without Refinement
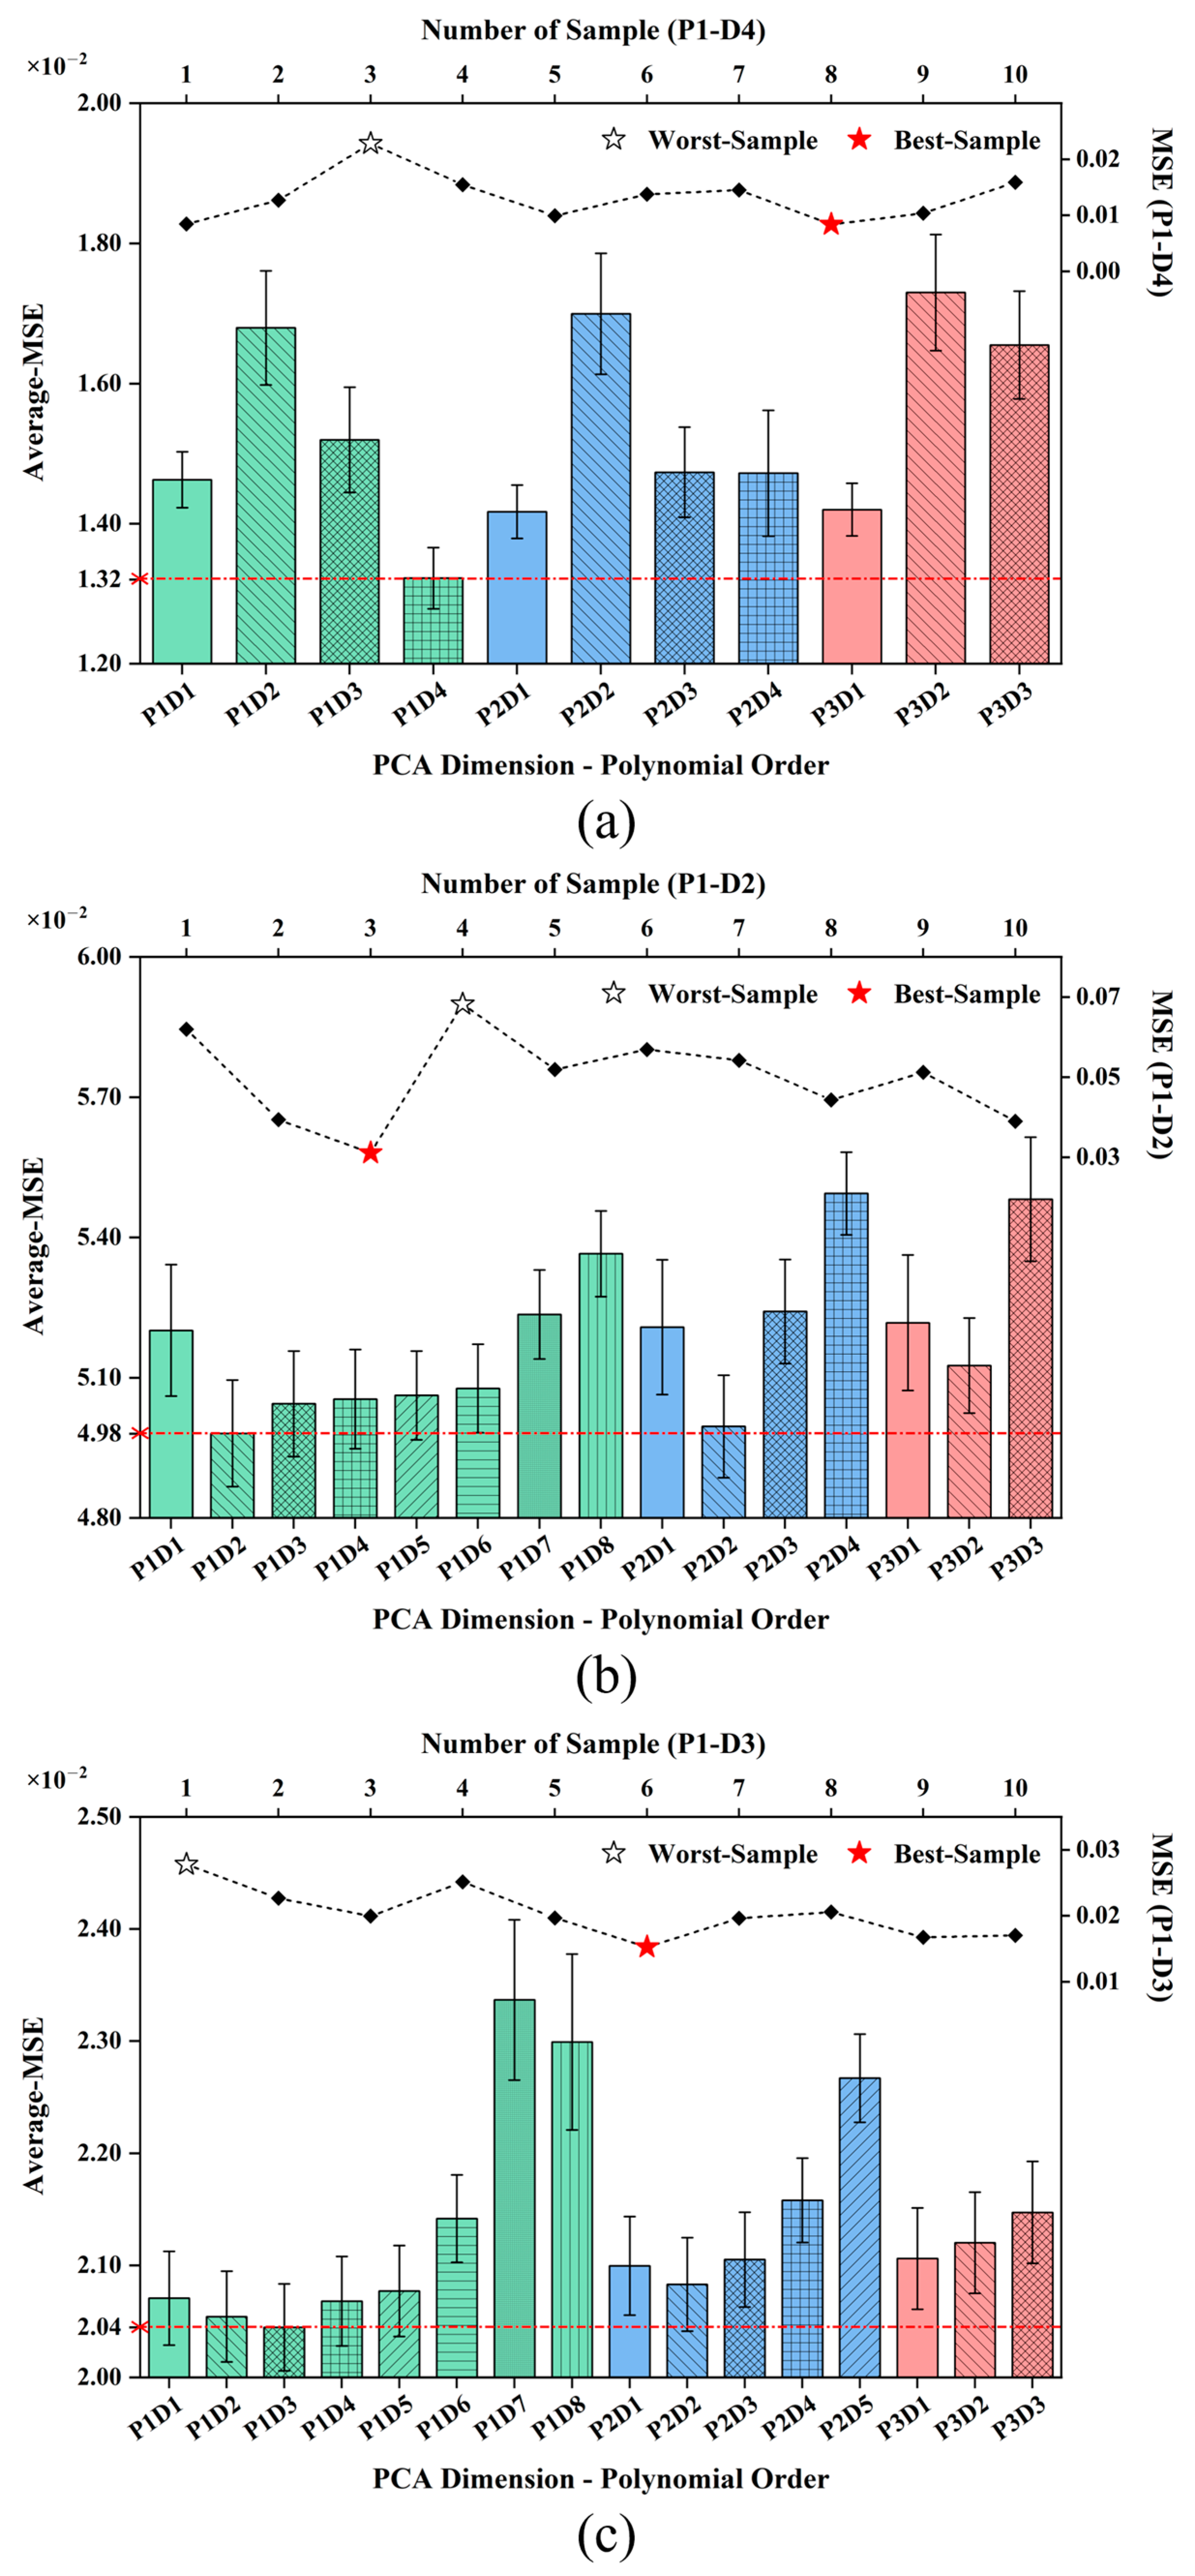
To find the model with the most robust predictive ability, this study used tenfold cross-validation by dividing the training and testing sets, that is, selecting fixed ten random seeds to shuffle the index of the samples. Each time, the first 20% of the index was fixed as the test set, and the last 80% was selected as the training set. At the same time, all segmented predictive models from C1 to C3 with PCA dimensionality reduction dimensions of one to three and polynomial fitting orders of 1 to 10 were traversed. In each segmented prediction model from C1 to C3, using
as the independent variable, the Average MSE of ten random samples was obtained and then sorted by the independent variable to obtain
Figure 5.
For cracking once (
Figure 5a), when PCA dimensionality reduction = 1 (P1) and polynomial fitting order = 4 (D4), the Average MSE of ten samples was taken as the minimum value 0.0132, and the upper bound of the error was still lower than the Average MSE of other independent variables. Therefore, P1D4 was selected as the C1 stage prediction model parameter. During the ten prediction processes of the P1D4 parameter, the MSE value of the prediction results with random sampling seed identity 8 (S8) was the smallest and most accurate; the MSE value of the prediction results with random sampling seed identity 3 (S3) was the highest and the least accurate. The range of MSEs between random samplings approached 0.015. Similarly, if P1D2 was selected as the parameter for the C2 stage prediction model (
Figure 5b), the prediction results with random sampling seed identity 3 (S3) were the most accurate, while the prediction results with random sampling seed identity 4 (S4) were the least accurate. The range of MSEs between random samplings approached 0.037. Selecting P1D3 as the parameter for the C3 stage prediction model (
Figure 5c), the prediction results with random sampling seed identity 6 (S6) were the most accurate, while the prediction results with random sampling seed identity 1 (S1) were the least accurate. The range of MSEs between random samplings approached 0.013.
3.4. Prediction Model Refinement and Accuracy Comparison
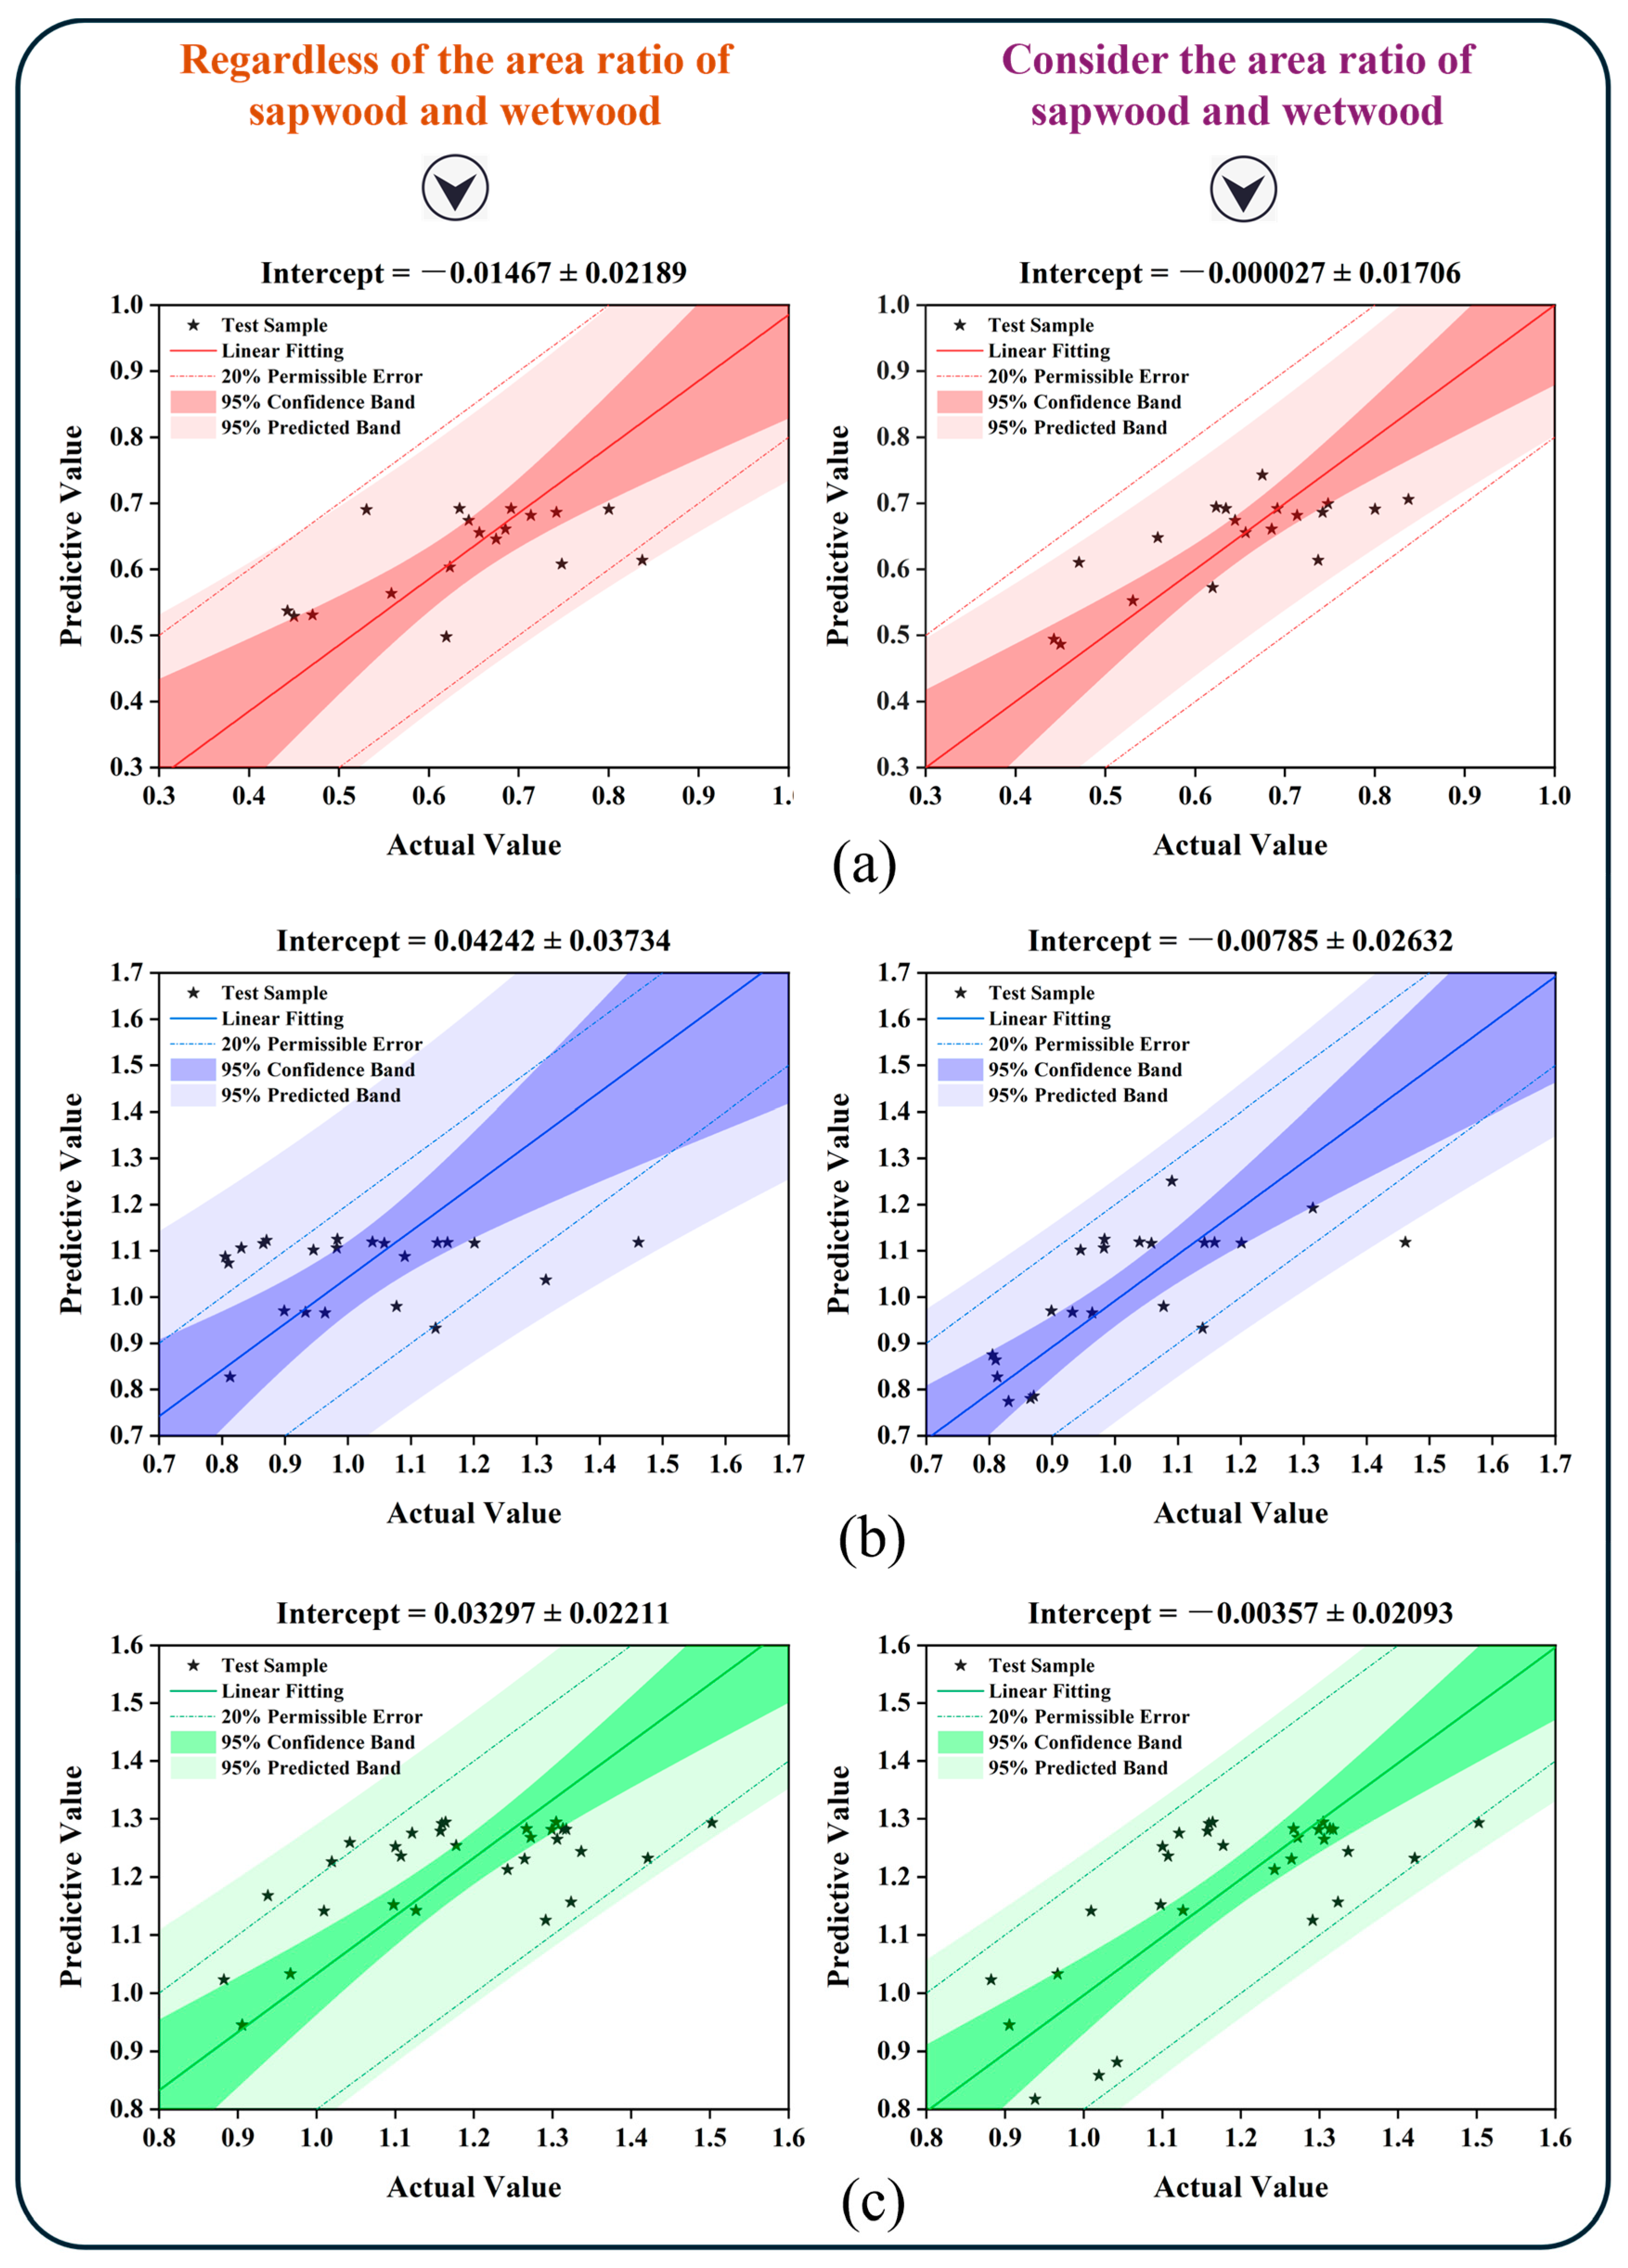
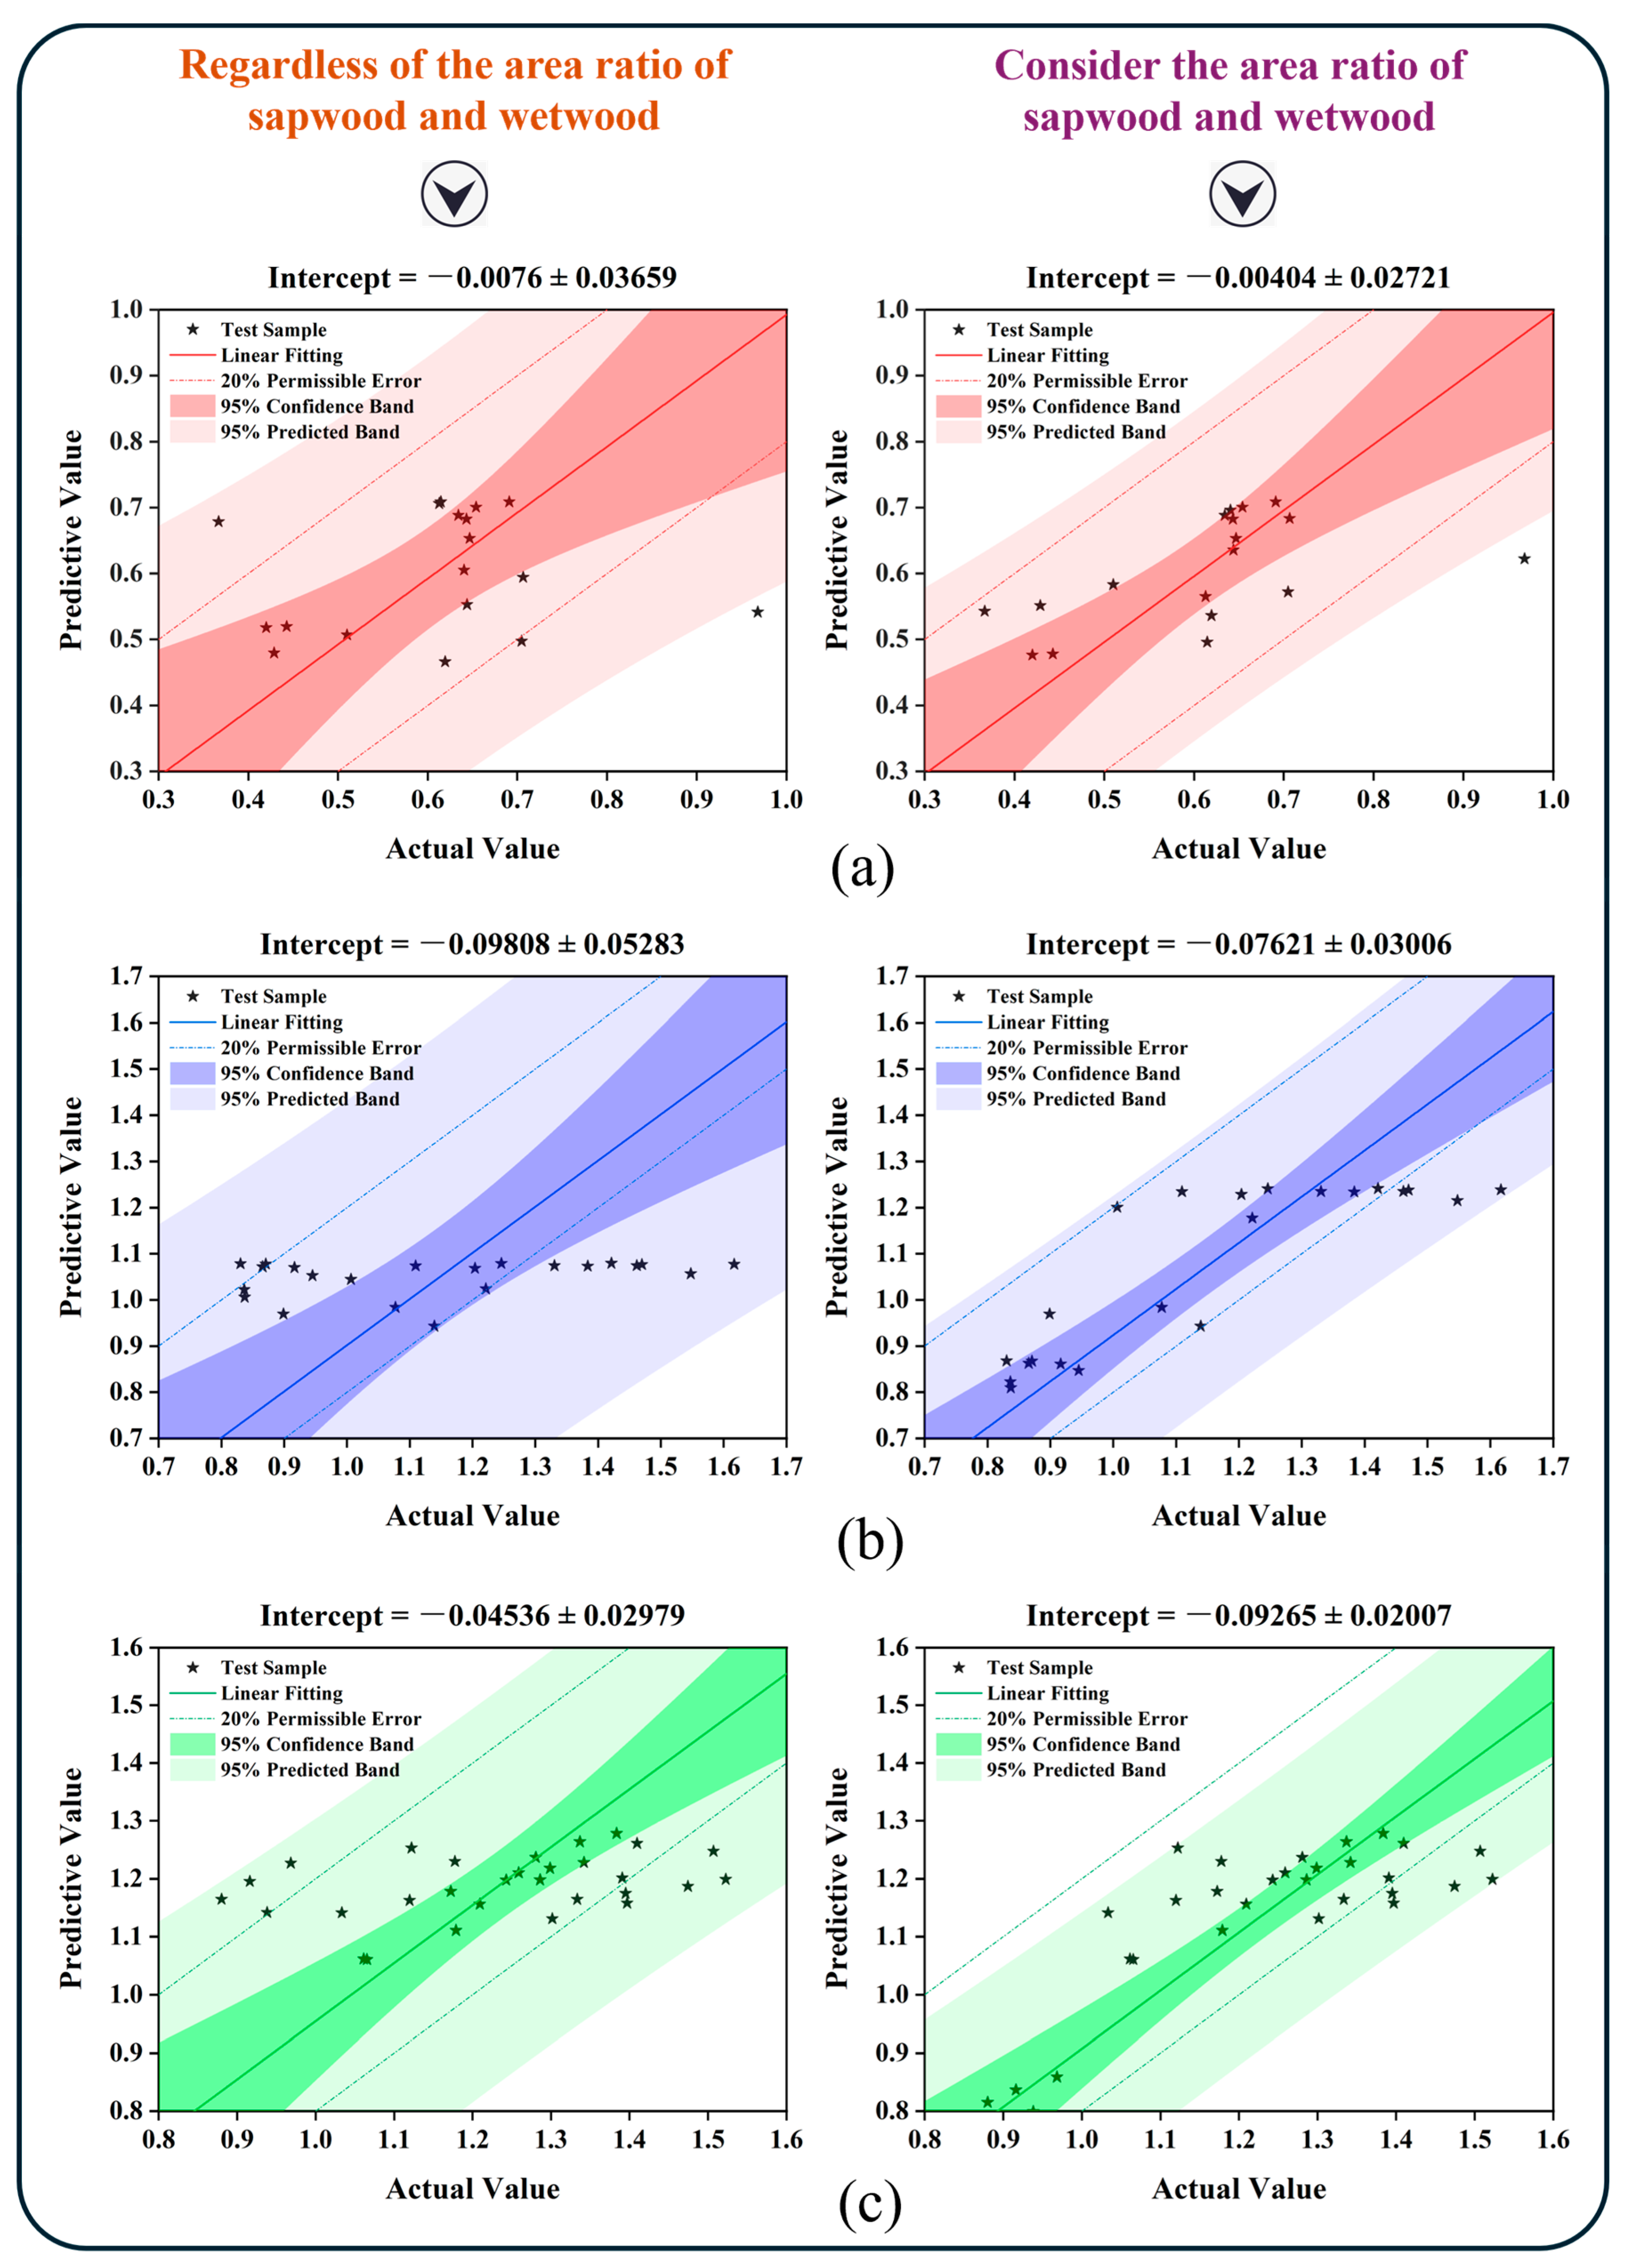
This study used FS + Base as the CD feature descriptor and the segmented prediction model built earlier to predict the water absorption during the C1 to C3 process. As shown in
Figure 6 and
Figure 7, without considering the proportion of sapwood and wetwood areas (i.e., without using
,
, and
), the 95% predicted bandwidth of the prediction model from C1 to C3 was approximately ± 23% (C1S8), ±38% (C1S3), ±45% (C2S3), ±48% (C2S4), ±31% (C3S6), and ±32% (C3S1), respectively. The 95% confidence bandwidth of the prediction model was approximately ± 13% (C1S8), ±19% (C1S3), ±20% (C2S3), ±12% (C2S4), and ±17% (C3S6). The value of ±12% (C3S1), the error between the predicted WAR and the measured value, was mainly within the ±20% error band. Therefore, when the prediction error was acceptable at 20%, the direct prediction accuracy was 94.4% ≥ C1 ≥ 83.4%, 63.7% ≥ C2 ≥ 54.5%, and 86.7% ≥ C3 ≥ 70.0%.
When the , , and , the 95% predicted bandwidth of the prediction model decreased sequentially from C1 to C3 as follows: 3% (C1S8), 9% (C1S3), 16% (C2S3), 23% (C2S4), 5% (C3S6), and 14% (C3S1). The 95% confidence bandwidth of the prediction model decreased sequentially as follows: 2% (C1S8), 4% (C1S3), 10% (C2S3), 8% (C2S4), 5% (C3S6), and 10% (C3S1). When the prediction error was 20% acceptable, the prediction accuracy was as follows: 100% ≥ C1 ≥ 94.4%, 90.9% ≥ C2 ≥ 81.8%, and 96.7% ≥ C3 ≥ 83.3%. When the prediction error was 10% acceptable, the prediction accuracy of C1 to C3 was all ≥50%, indicating a significant improvement in the certainty and accuracy of the prediction model.
3.5. Model Integration and Releasing
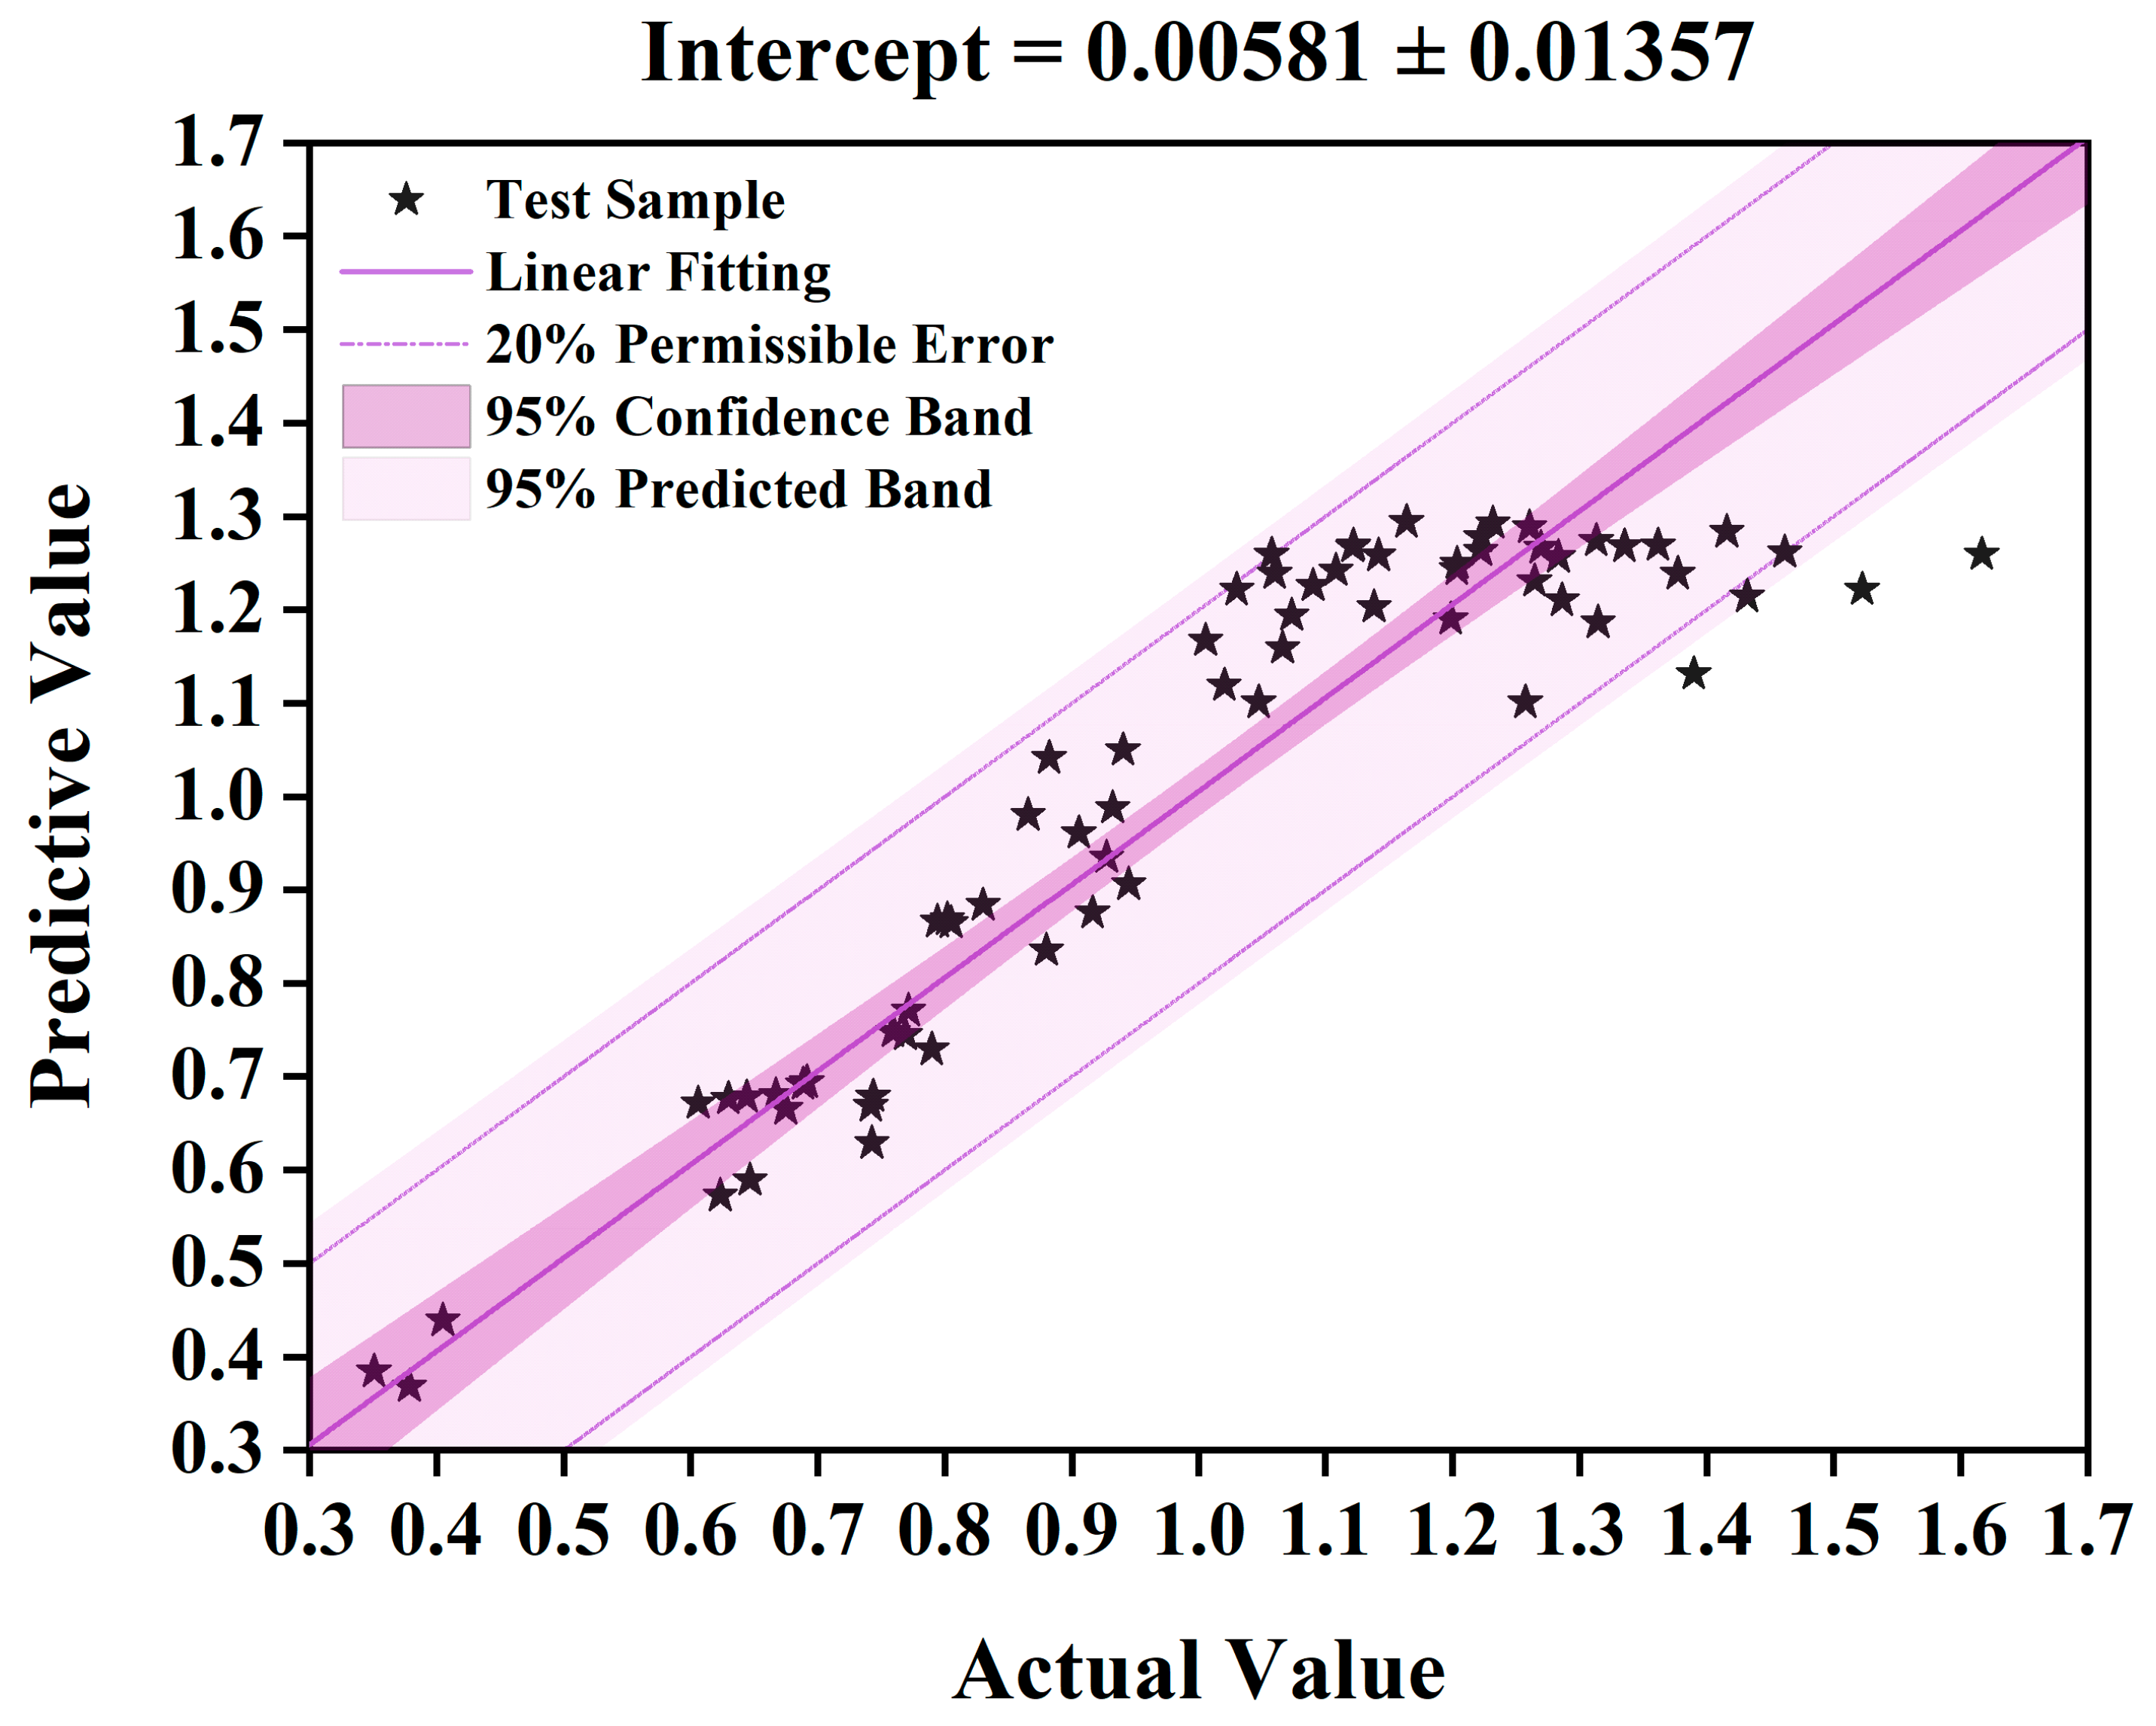
The release version model could be obtained by integrating the segmentation process from C1 to C3 into a comprehensive prediction model. The results of when the P1D4 was selected as every segmented fitting parameter and the S5 sampling was used to assess the released model are shown in
Figure 8. There were 70 test data, in which C1 = 18, C2 = 22, and C3 = 30. The 95% prediction bandwidth of the model was ± 25%, and the 95% confidence bandwidth was ± 9%. When the prediction error was 20% acceptable, the prediction accuracy was 94.3%, and when the prediction error was 10% acceptable, the prediction accuracy was 67.1%.
4. Discussion
The current study established predictive models and provided an acceptable correlation to quantitatively describe the relationship between WAR and the CD of poplar WFB specimens based on surface crack image characteristics. The results provide valuable insights into the adsorption property modeling of WFB and the prediction of roller-cracking mechanisms.
4.1. Ideal Model between Cracking Degree and Water Absorption Rate
As analyzed in
Section 3.1., the cracking level was positively related to the water absorption ranking, and the WAR had saturation characteristics. This saturation characteristic was consistent with the variation pattern of the MC during wood drying [
36]. During the drying process, when the exposed surface area of the wood remains constant, the rate of moisture content reduction in the wood slows down as its moisture content decreases. Since the absorption and desorption of water in wood are reversible processes, naturally, the rate of moisture content increase during the absorption process will slow down as its moisture content increases. In summary, the migration of free water in wood is subject to negative feedback regulation by its moisture content. Concurrently, existing research indicates that the micro process of wood moisture absorption can be divided into two stages: the moisture absorption process before the fiber saturation point, dominated by capillary absorption within the cell wall, and the moisture absorption process after the fiber saturation point, dominated by capillary absorption in tubular structures such as vessels, wood fibers, and rays [
37]. Roller-cracking loosens the wood, increasing the contact area between wood and water, which significantly accelerates the speed of fiber saturation. Given that the rate of fiber saturation is inherently rapid, the changes in the WAR studied in this research primarily occurred during the free water migration process after the fiber saturation point. Therefore, the occurrence of saturation characteristics was the result of negative feedback regulation of free water migration.
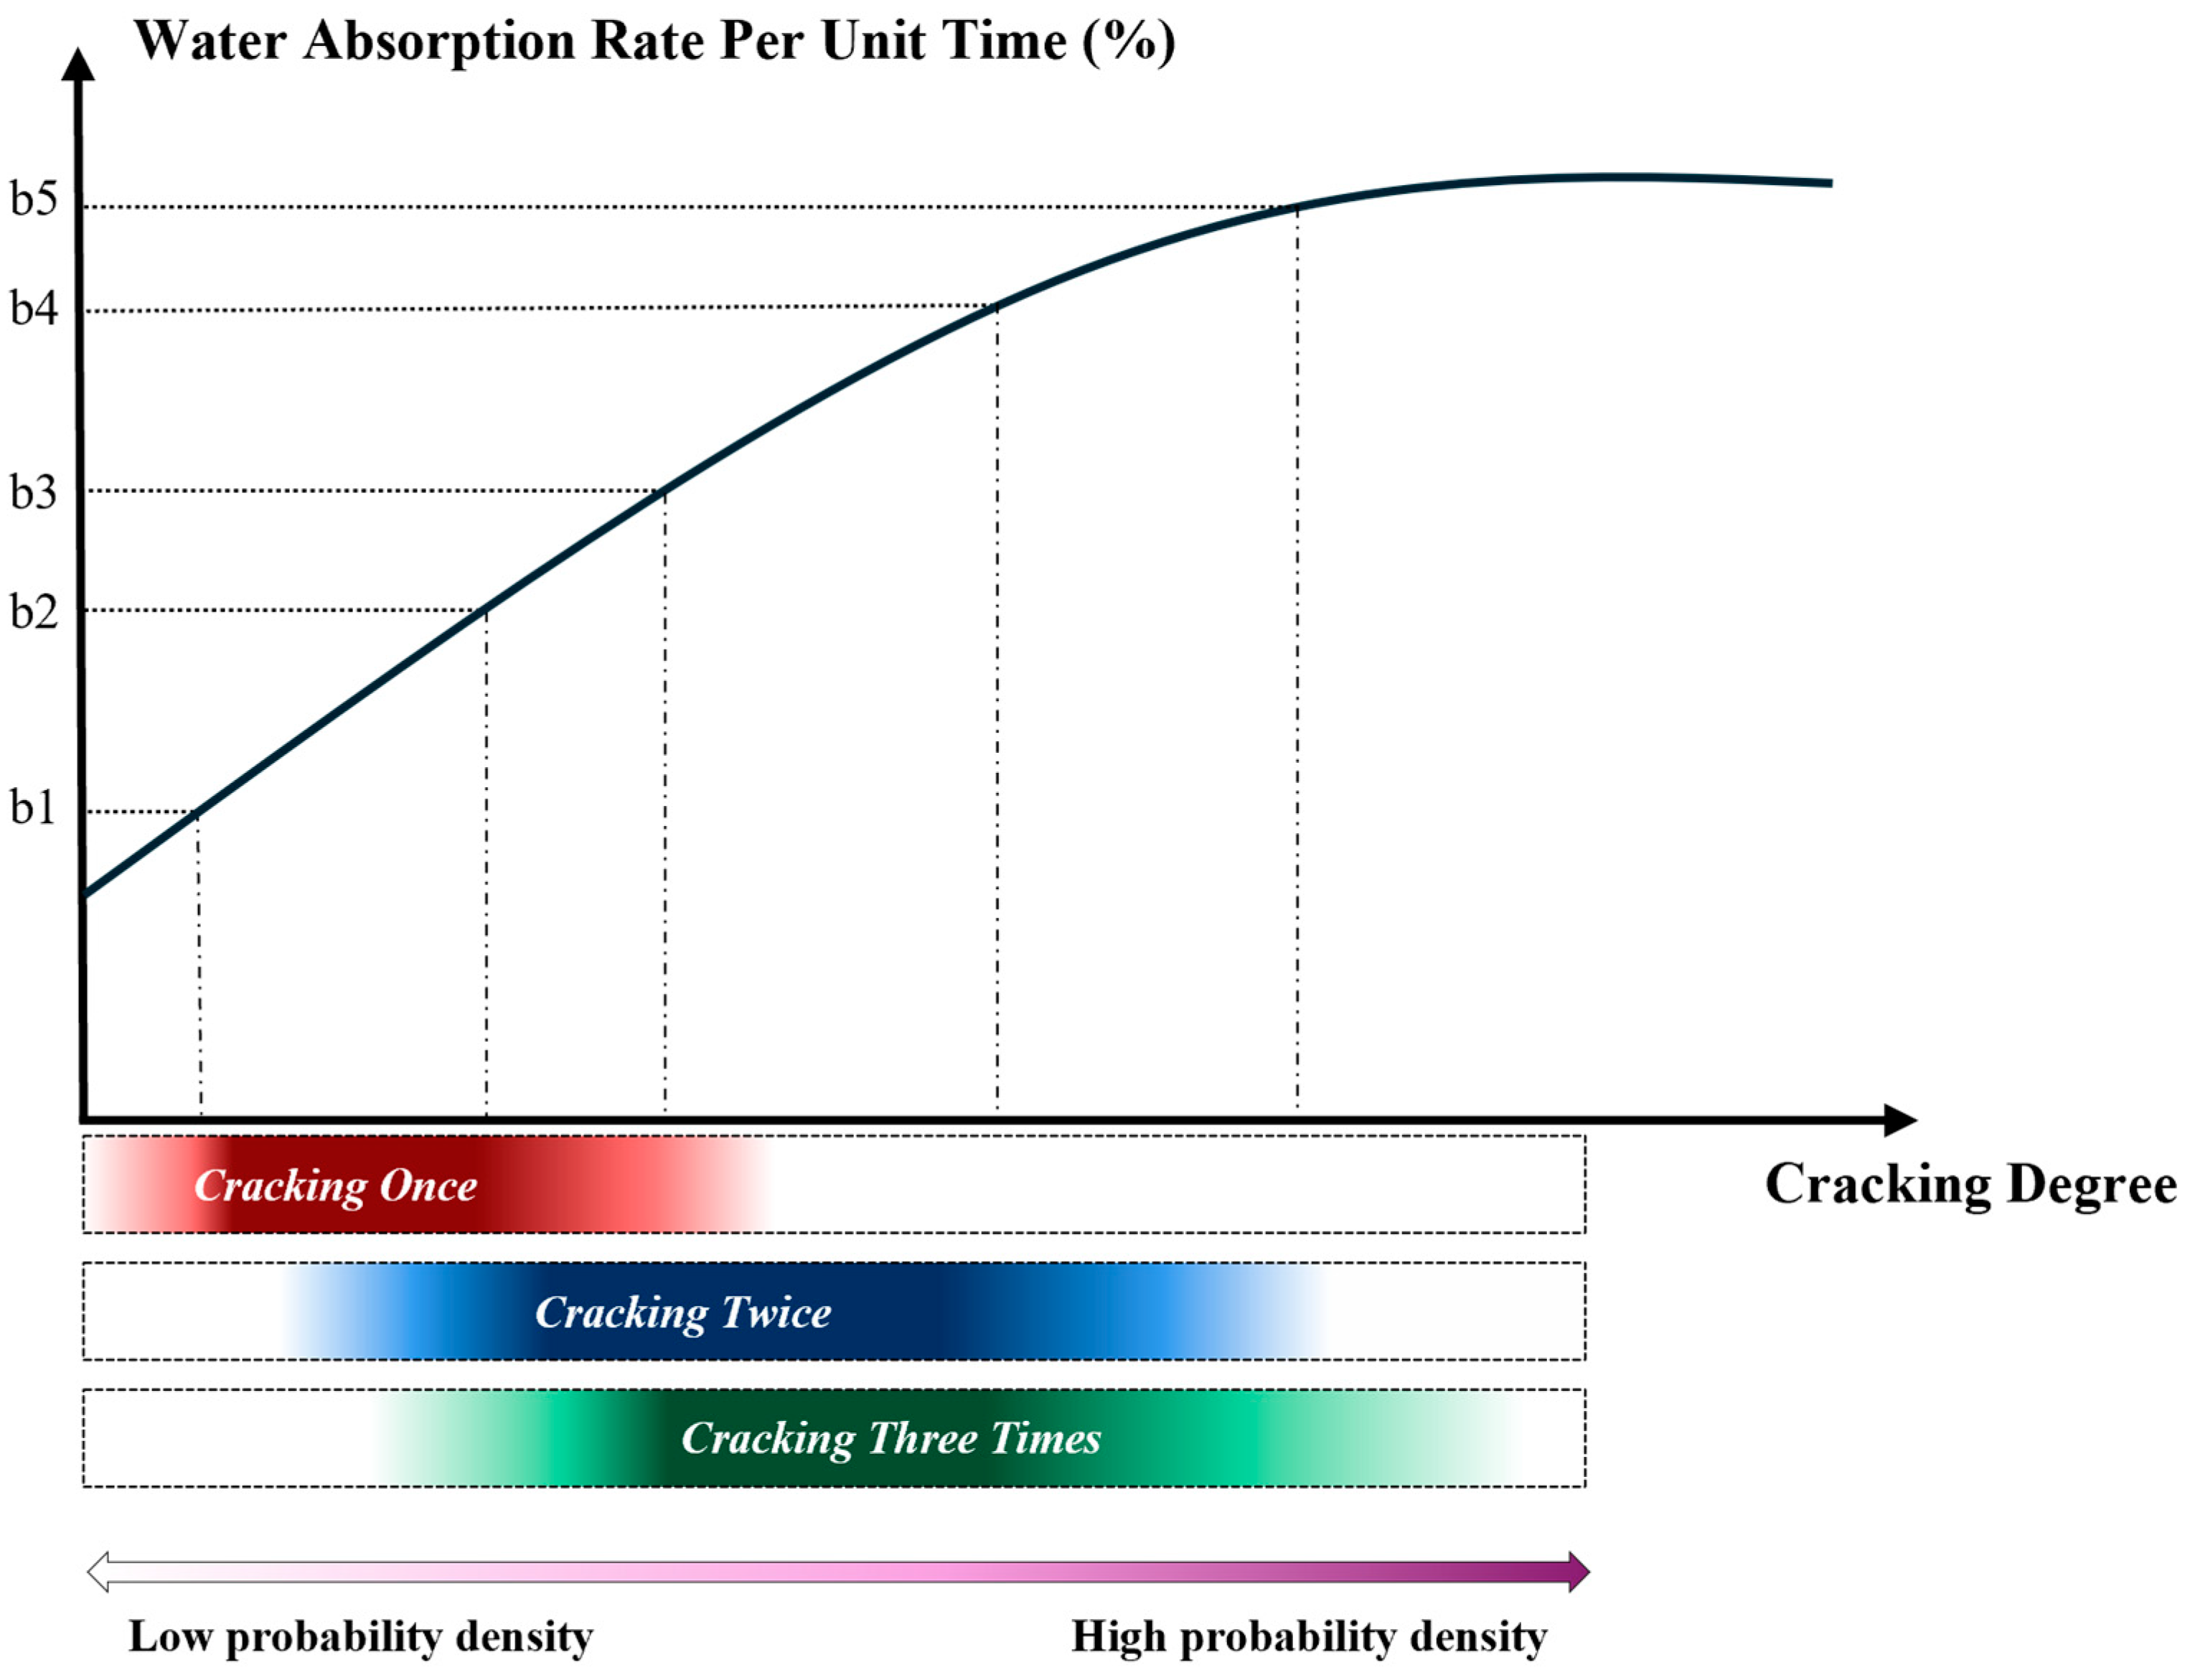
Meanwhile, the degree of mechanical rolling cracking maintains a nonlinear relationship with the cracking level, but the cracking level can express the cracking degree statistically. Therefore, regarding the wood specimen as an ideal material (neglecting the influence of material properties) and considering the randomness of roller cracking, the ranking of the water absorption rate is equivalent to the cracking degree. The ideal model between the cracking degree and the WAR was built in
Figure 9. Thus, a method for evaluating the quality of WFB using the WAR can be established based on the distribution pattern of WAR specimens at different cracking levels. For example, the C1 mainly distributed in the range of b1–b2; if b1 is selected as the lower boundary and b2 is chosen as the upper boundary, the specimens in the C1 category can achieve three classifications, where <b1 is defined as a defect, ≥b1 and <b2 are defined as a qualified product, and ≥b2 is defined as excellent. As for C2, where <b2 is defined as a defect, ≥b2 and <b4 are defined as a qualified product, and ≥b4 is defined as excellent. For C3, where <b3 is defined as a defect, ≥b3 and <b5 are defined as a qualified product, and ≥b5 is defined as excellent. The specimens mentioned previously in this study were as follows: b1 = 40, b2 = 80, b3 = 100, b4 = 130, and b5 = 140. Under these conditions, both the defect rate and the excellent product rate were approximately 10%, with the qualified product rate being 80%.
4.2. Apparent Distribution and Role of Feature Parameters
Shown in
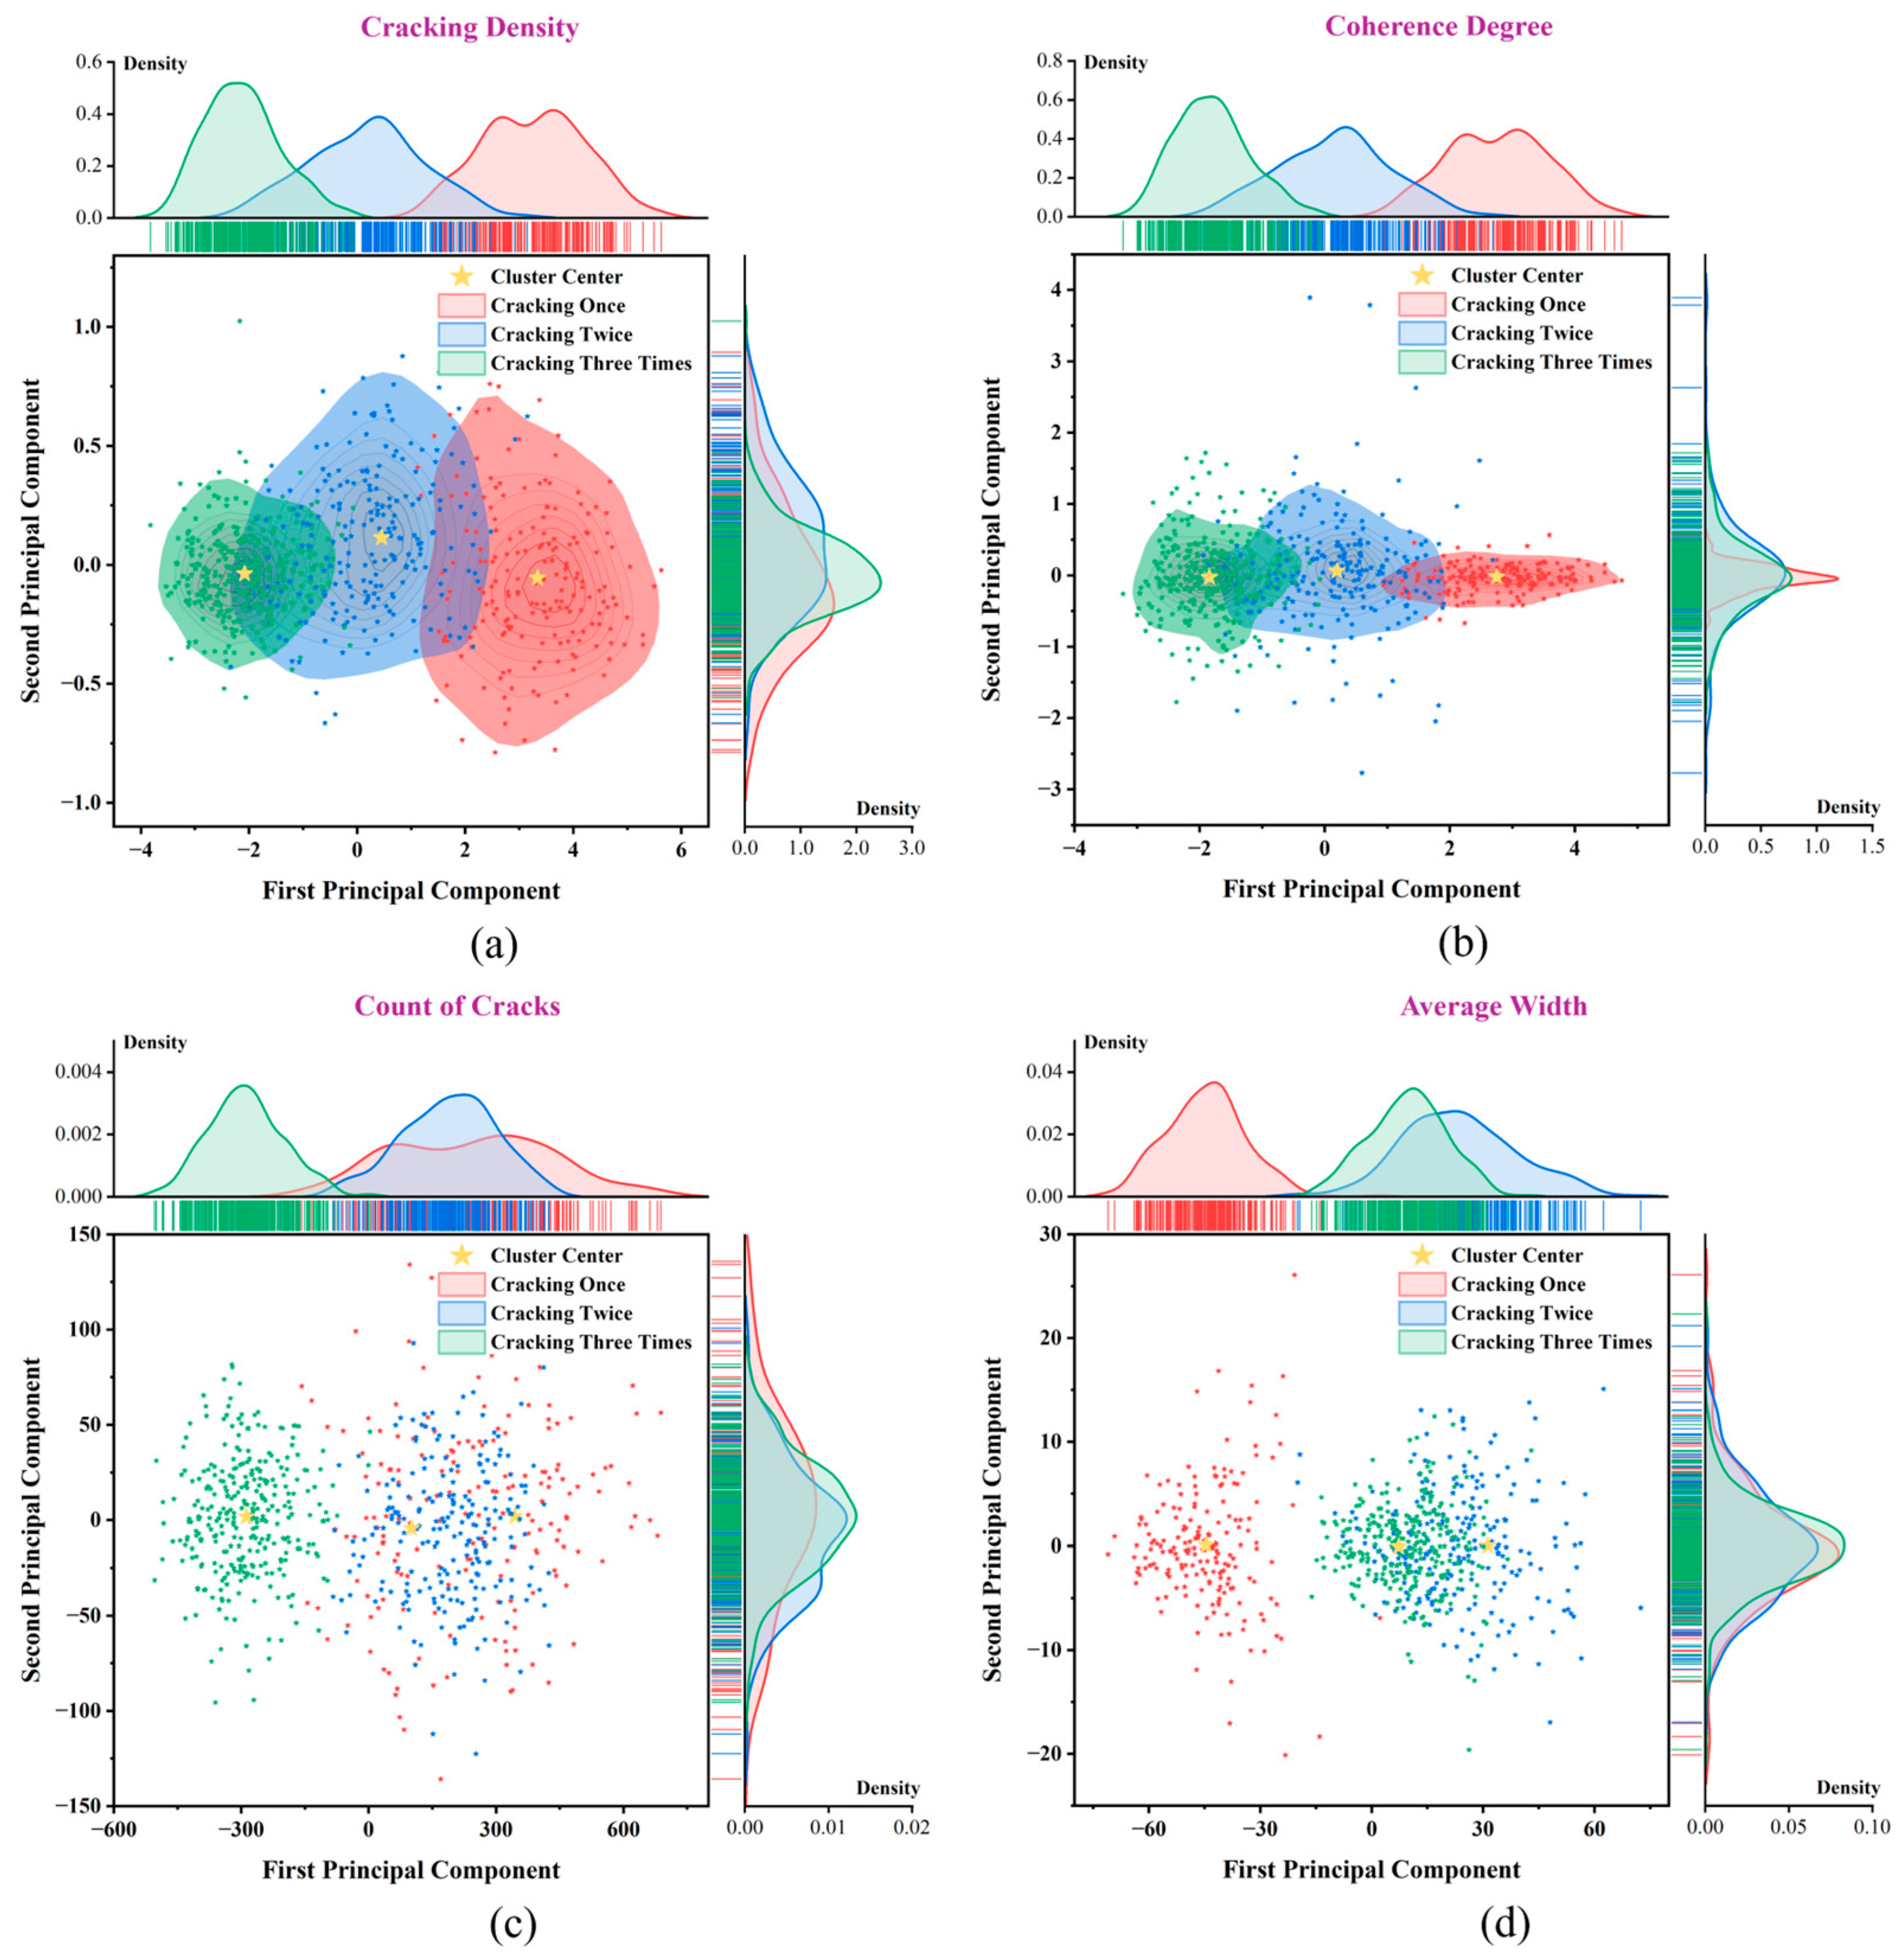
Figure 10a–d are visualizations for independent parameters (treat the parameters extracted from the front and back sides of a specimen as independent of each other,
front and
back) by PCA (only retaining the first and second principal components). In the visualization results of independent parameters, both cracking degree and coherence degree exhibited similar distribution density characteristics for the first principal component, as shown in
Figure 3, and the parameters showed significant differences between specimens at different cracking levels. The specimens had good cohesion at the same cracking level, indicating that the above two parameters were fundamental in describing the cracking degree.
For the first principal component of the count of cracks, there was a large overlap between the C1 and C2 intervals, and C3 had a significant degree of discrimination from C1 and C2. For the first principal component of the average width, there was a large overlap between the intervals of C2 and C3, and there was significant discrimination between C1 and C2 and C3. Overall, these two parameters played a complementary role in describing the cracking degree, and their distribution patterns also indicated that the increase in water absorption from C1 to C2 was mainly due to the increase in average width, while the increase in water absorption from C2 to C3 was mainly due to the increase in the count of cracks.
The progression from stages C1 to C3 were characterized by increased cracking density and coherence degree. Concurrently, the CC remained constant from C1 to C2 but experienced a significant rise from C2 to C3. Macroscopically, this progression manifested as follows (refer to
Figure 2): The C1 stage initiated a crack at a point, yet the extent of the cracking remained relatively minimal. During the C2 stage, the existing cracks extended, increasing the depth and width of the cracks; however, the quantity of crack initiation points did not significantly increase and might have even merged as the cracks extended. The C3 stage saw a secondary proliferation of crack initiation points, intensifying the cracking within the pre-existing cracks, thereby achieving a more uniform distribution.
This phenomenon was attributed to the tendency of fiber cracking to align with the direction of maximum stress. In the C1 stage, a crack initiated at the point of maximum stress and extended marginally. During the C2 stage, cracks propagated further along the longitudinal direction, accompanied by numerous instances of failure fractures. In the C3 stage, new crack initiation points emerged in areas of previous failures and fractures. These new cracks were influenced by the pre-existing cracks, leading to a gradual homogenization of the cracking pattern [
38].
The four parameters on the second principal component showed relatively consistent overlap characteristics between specimens at different cracking levels. This indicated that the first principal component of each quantitative characterization parameter PCA contained the most feature information. This suggested using PCA dimensionality reduction to reduce the feature descriptors to one dimension (scalar) for regression analysis may be enough. Therefore, in
Section 3.3., this study only considered PCA dimensions of 1–3.
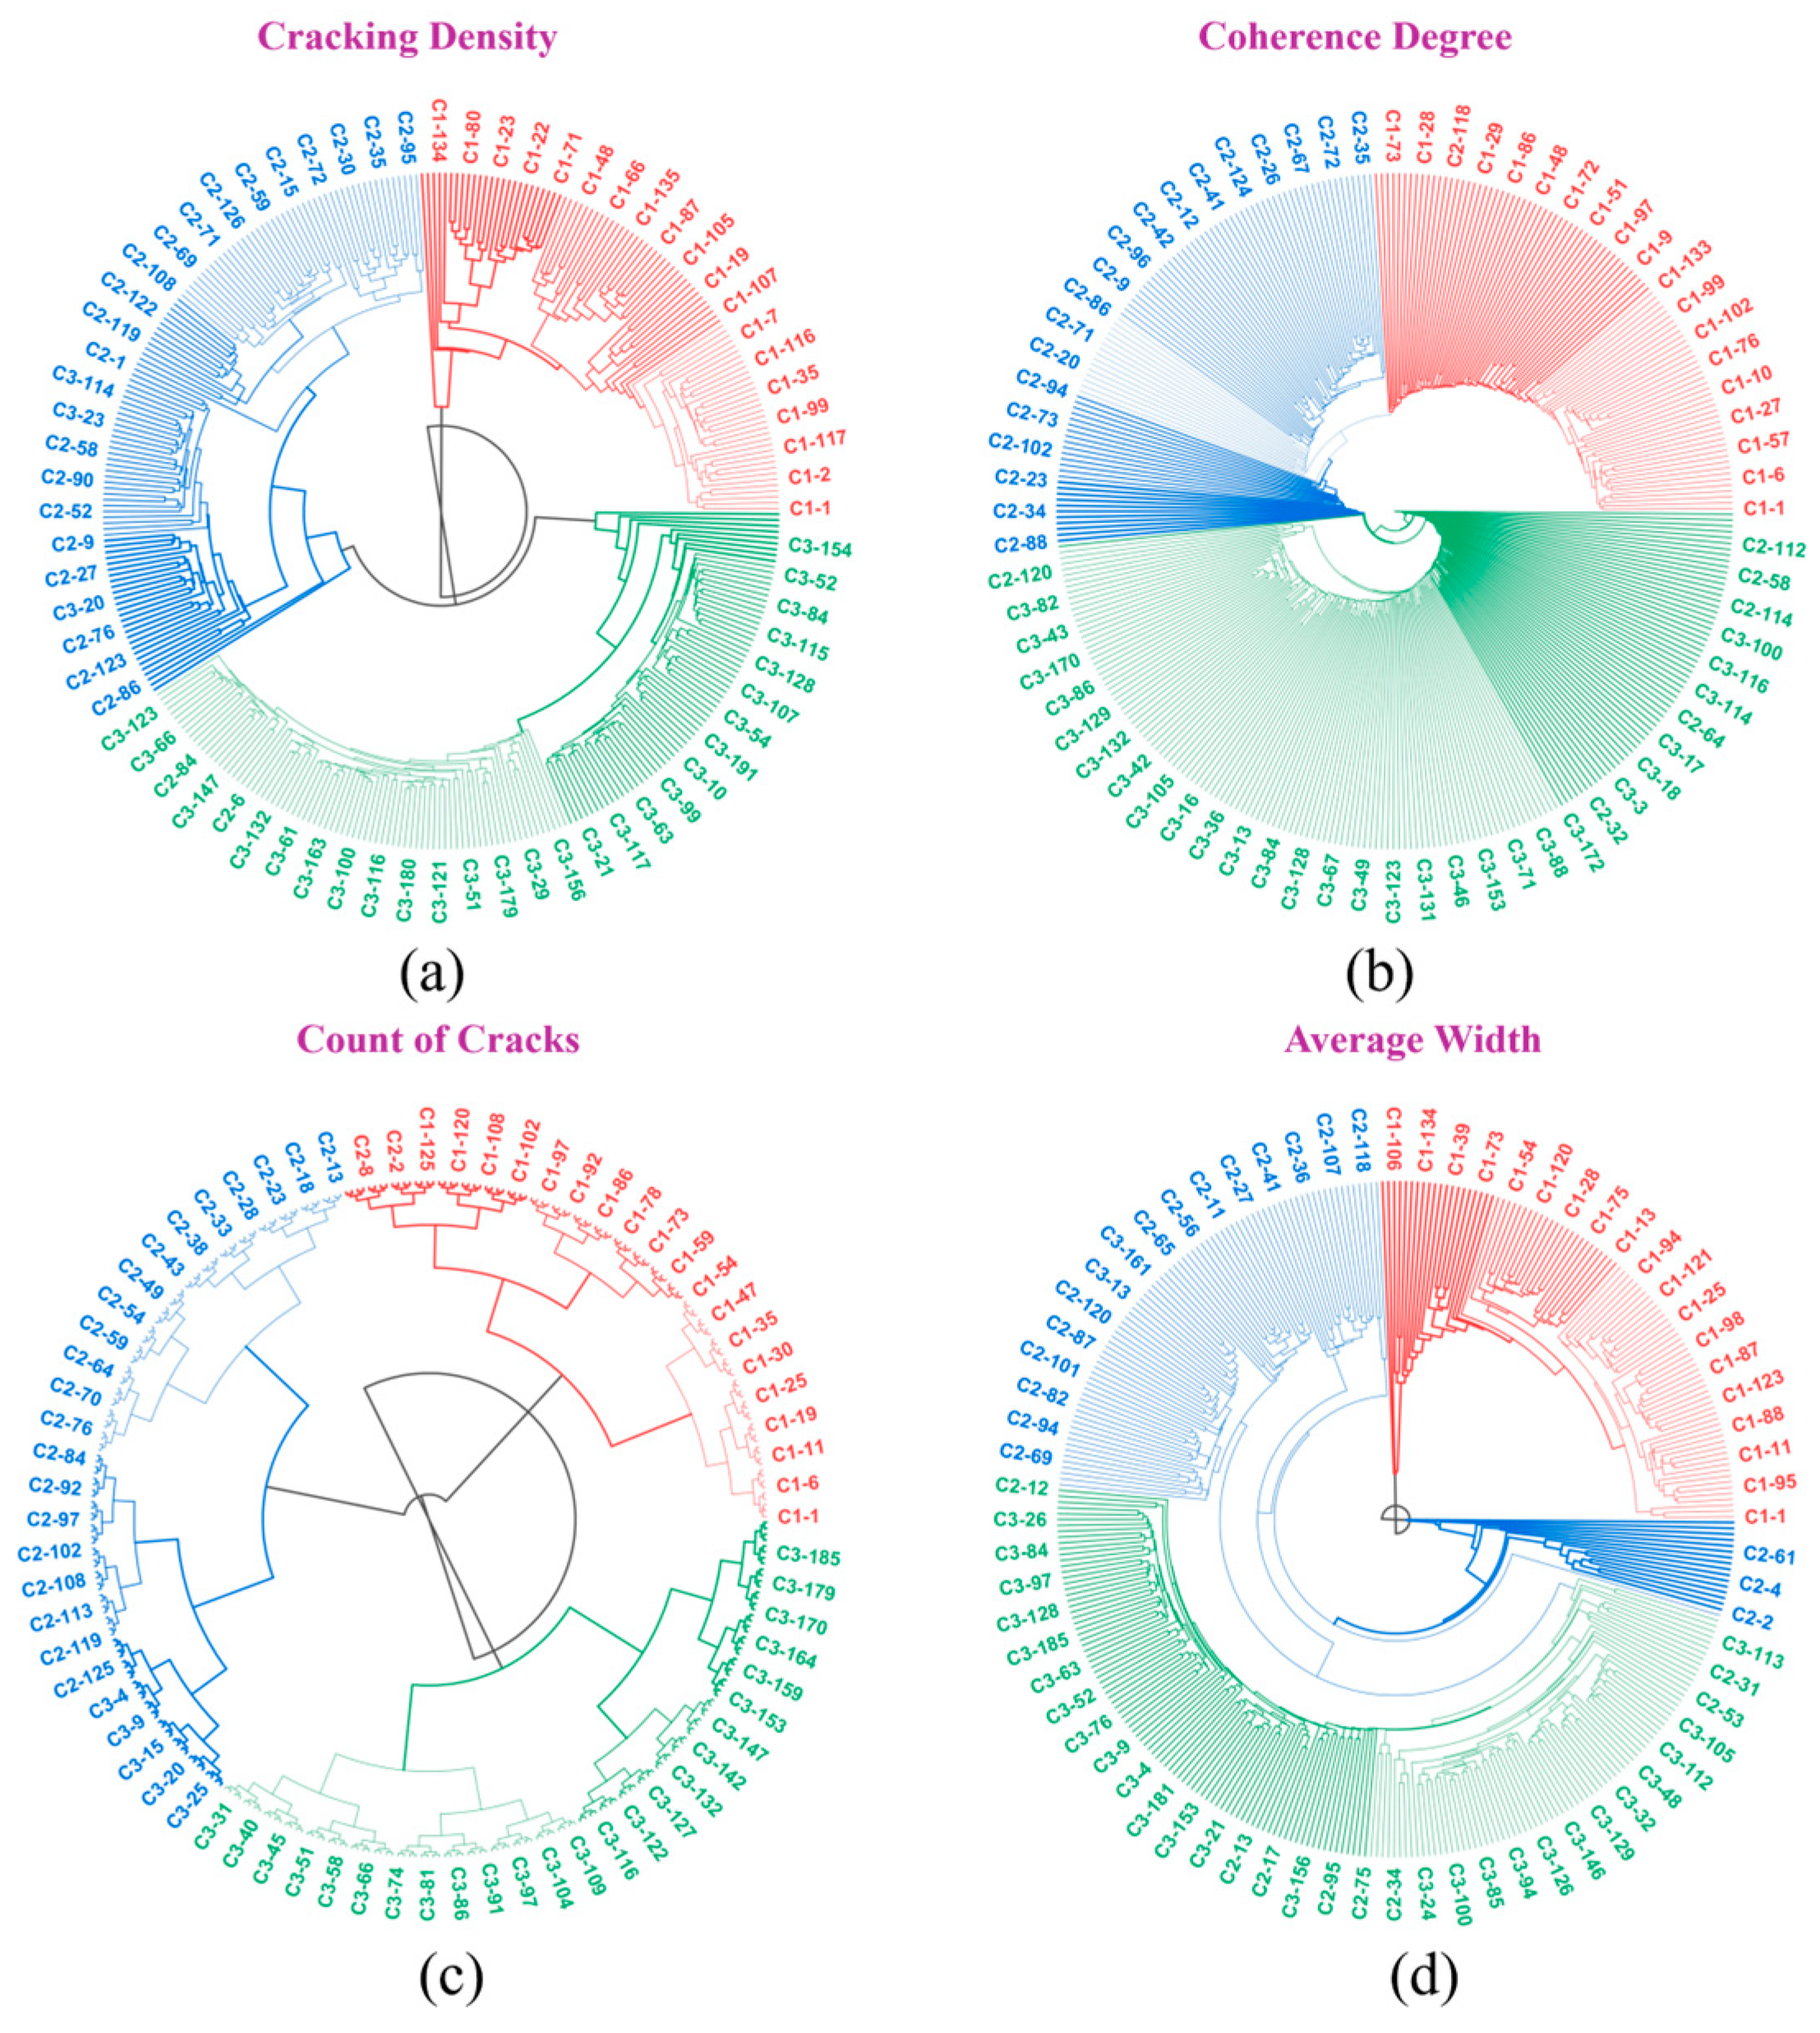
The analysis of the clustering results of joint parameters (treat the parameters extracted from the front and back sides of a specimen as a whole,
), as shown in
Figure 11a–d, showed that specimens with a reasonable number of clustering categories could achieve approximate classification with different cracking levels. However, due to extreme outliers in the data, relying directly on three-center clustering within the four joint parameters to achieve specimen classification was still a very challenging task. Therefore, it was necessary to construct advanced feature descriptors.
4.3. Quantitative Characterization Parameter Feature Selection Mechanism
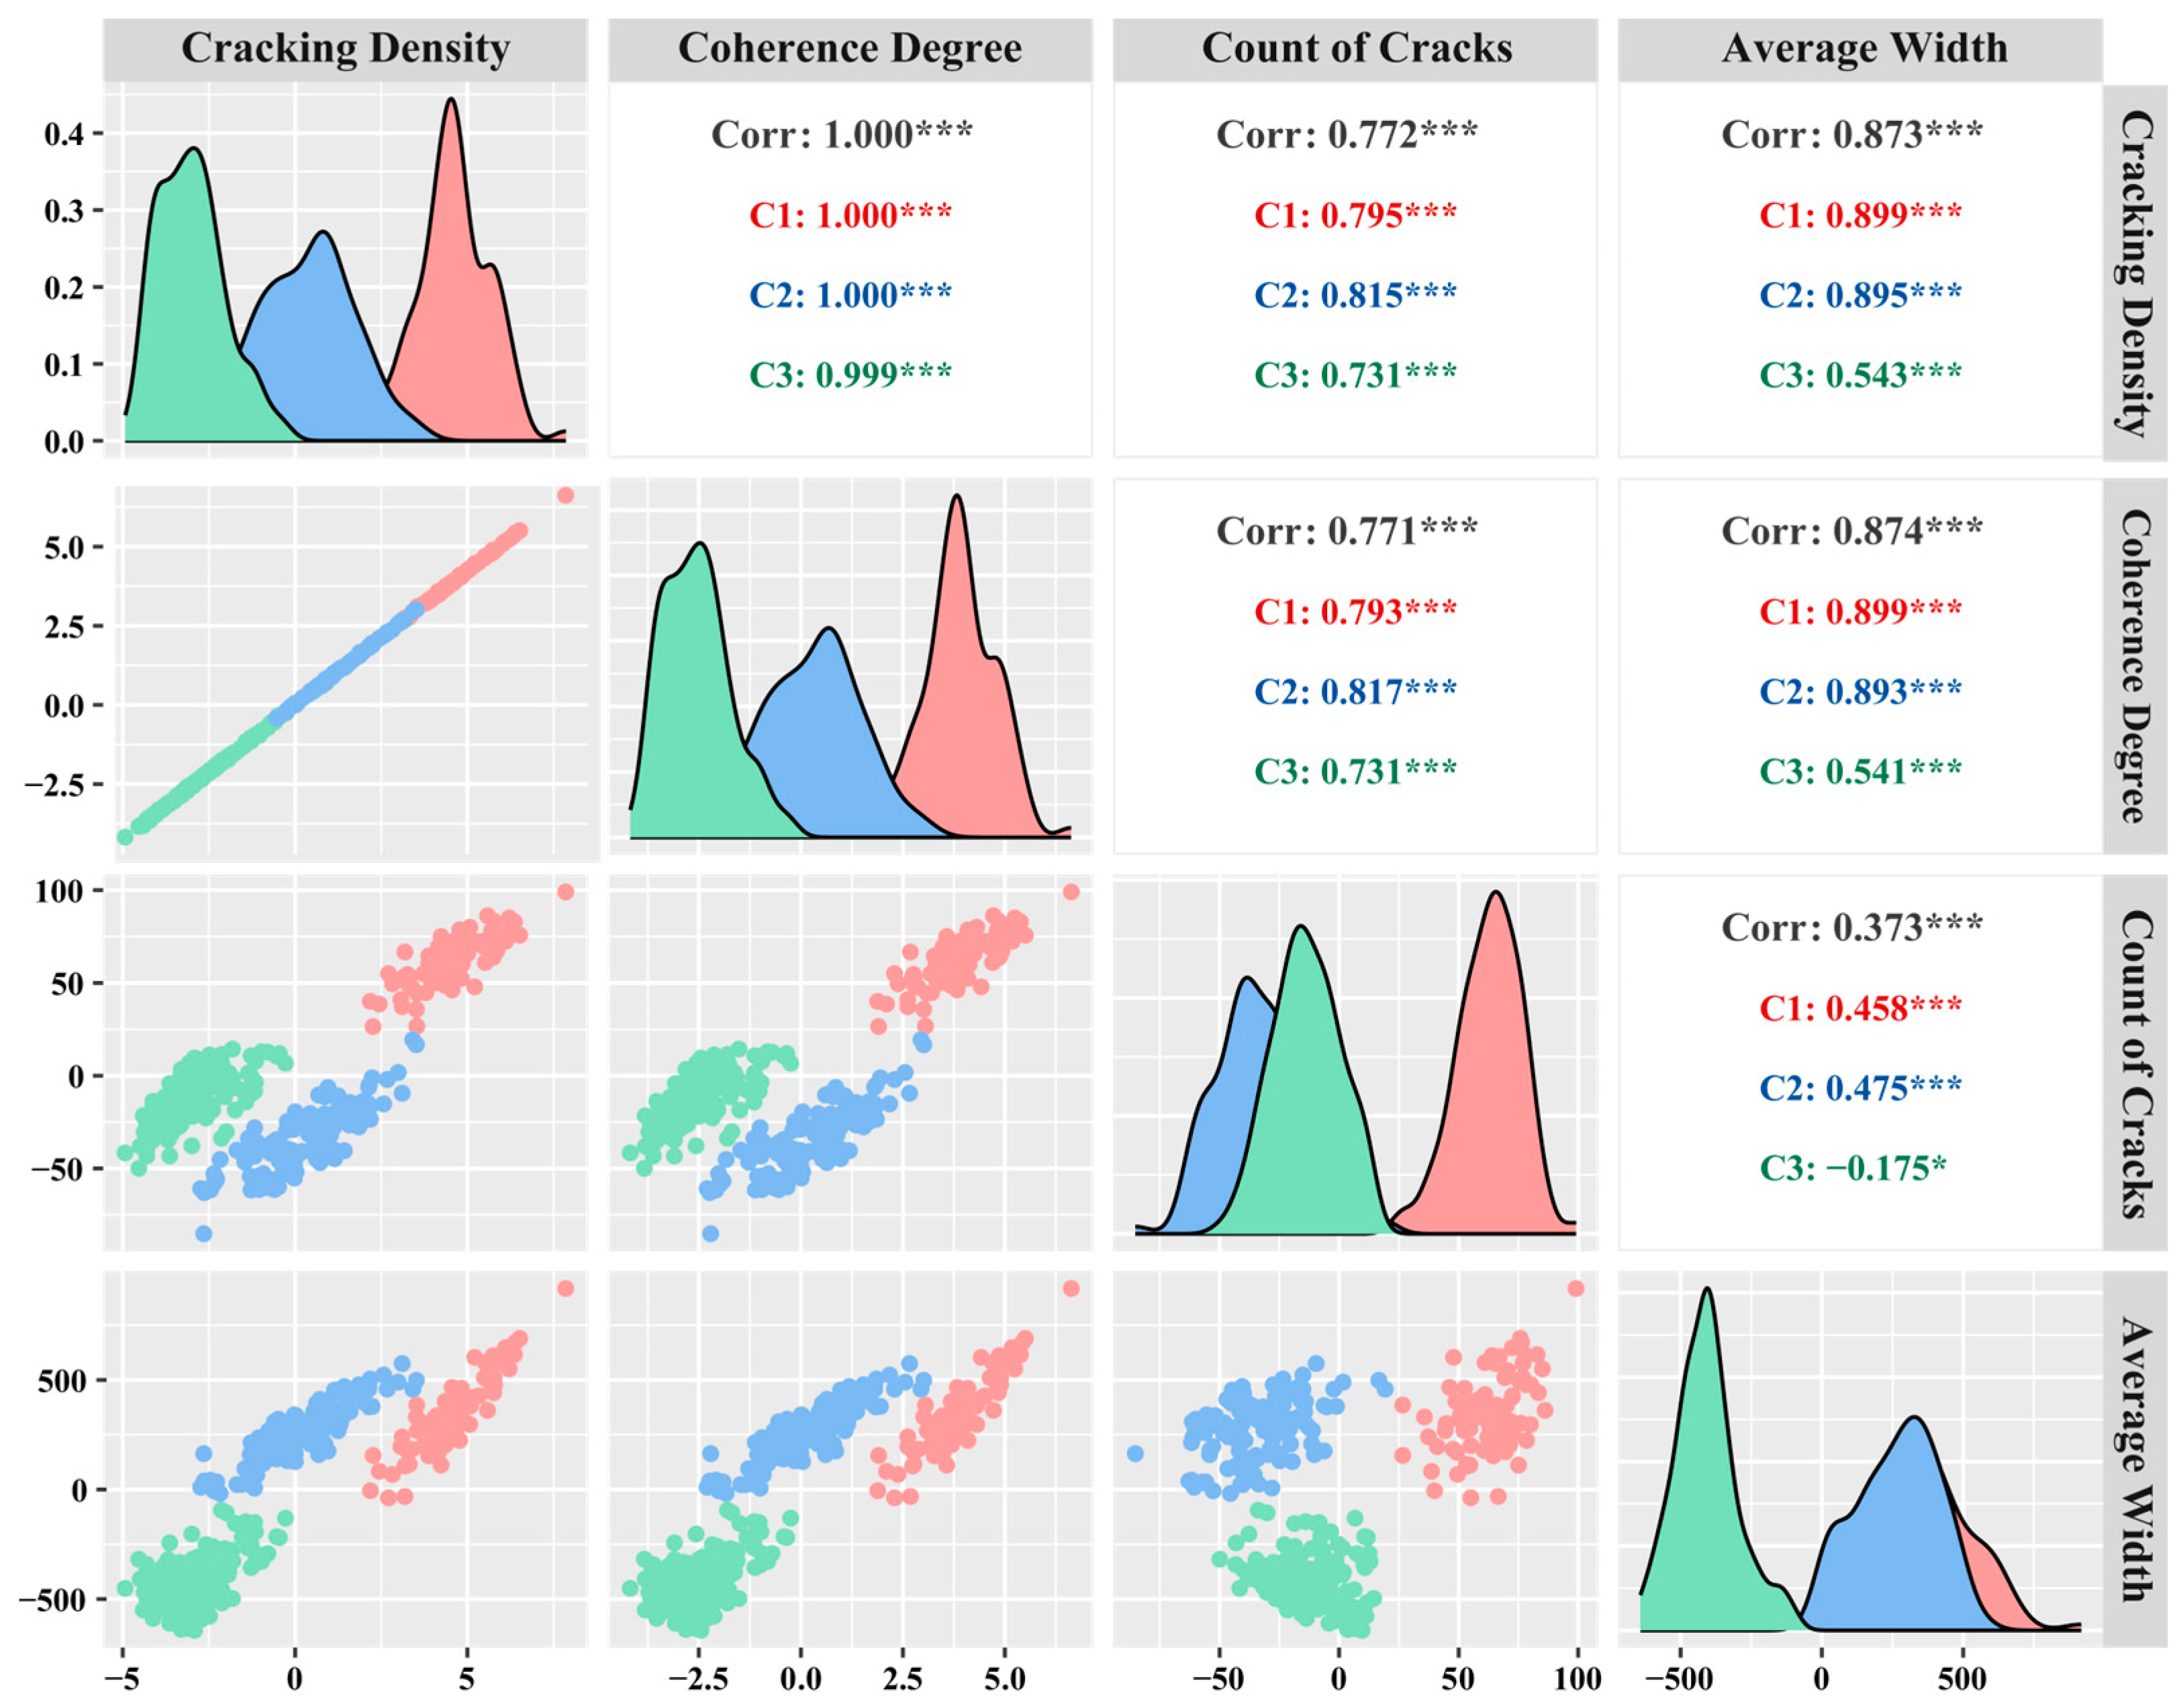
According to the typical correlation analysis of the four joint parameters (
Figure 12), the correlation coefficients between the cracking degree and coherence degree, count of cracks, and average width were 1.000, 0.772, and 0.873, respectively. The correlation coefficients of the coherence degree with count of cracks and average width were 0.771 and 0.874, respectively. The correlation coefficient between the count of cracks and average width was 0.373. Therefore, it was determined that the cracking degree and coherence degree should be retained during feature selection for feature enhancement. In addition, the above two parameters could also be used as two baseline feature descriptors in a discriminative analysis to evaluate the effect of feature parameter selection (
Section 3.2). The specific process was to use the selected feature parameters to obtain the discrimination errors at different cracking levels and subtract the discrimination errors of the above two parameters at different cracking levels to serve as the relative error.
When paying attention to the correlation between the four joint parameters on different cracking levels, it can be found that the correlation between any two parameters on C3 was significantly lower than that of the same parameter on the other two levels, while the correlation between the two same parameters on C1 and C2 was very close. This indicated that as the cracking level increased, the disorder of surface cracks on the specimen increased.
4.4. The Mechanism of the Model Refinement Method
An ideal model for fragmentation and water absorption was established in
Section 4.1; however, it is known that the water absorption rate of wood specimens per unit of time is influenced by both the properties of the original wood material (wood is an anisotropic and heterogeneous natural material, and the water absorption performance of the sapwood is more robust than that of the wetwood) [
39,
40] and the degree of mechanical rolling cracking. To enhance the accuracy of the prediction model, the effect of material properties should be considered, since the impact of material properties is always considered static. In contrast, the impact of roller cracking is dynamic. Therefore, the properties of the original wood material could be assumed as a series of constant correction coefficients of the cracking degree (
Section 3.4 proved that the hypothesis is effective). While taking the same constant correction coefficients, the water absorption rate of the specimen was only positively correlated with the cracking degree.
The methodology has practical implications. For the wood processing industry, the predictive models can guide WS’s process control and property tailoring by adjusting cracking conditions based on desired performance targets.
However, there are also limitations. Only poplar wood was investigated in the current study without considering variations across different wood species. In addition, the effect of wood extracts on moisture absorption was not considered. Finally, feature extraction only considered the surface cracking image features and did not fully utilize techniques such as CT to extract internal structural features.
Several aspects can be improved in future research. First, advanced machine learning algorithms like deep learning may further refine predictive performance. Second, material testing under controlled cracking conditions is necessary to validate models against experimental data. Third, multi-scale modeling linking microstructures to macroscopic properties could be developed.
In summary, this study provides a novel approach for predictive modeling and property design of wood materials. While limitations exist, the methodology established here lays a foundation for more comprehensive modeling and deeper mechanistic understanding.
5. Conclusions
This study proposed a machine learning approach based on surface crack image features of wood fiber bundles to quantitatively evaluate and predict their water absorption rate. The main conclusions are:
(1) The experiments were designed to establish gradients of controlled roller-cracking degrees, and water absorption rate data of wood fiber bundles under different cracking levels were obtained. The results showed that the water absorption rate increased first and then saturated with an increase in cracking level, but the growth amplitude gradually decreased.
(2) Four quantitative characterization parameters describing the cracking degree were proposed, and a discriminant analysis was used to select the basic parameter combination as the feature descriptor. The results demonstrated that the basic parameter combination could effectively describe the cracking degree.
(3) Segmented prediction models based on principal component analysis dimensionality reduction and polynomial fitting were established, and the model parameters were refined through cross-validation. The results showed that the models could well predict the water absorption rate under different cracking levels.
(4) A model refinement method based on the proportion of sapwood and wetwood was proposed. The results showed that the prediction accuracy and reliability of the refined model were significantly improved.
(5) An integrated global prediction model was constructed by combining the segmented models. The results showed that the prediction accuracy within an error of 20% could reach 94.3%.
(6) The distribution characteristics and correlation of quantitative parameters were analyzed, explaining the mechanism of parameters in describing the cracking degree.
(7) An ideal model of the relationship between cracking degree and water absorption rate was summarized and proposed to provide a reference for wood quality evaluation.
This study established a machine learning approach based on image features to quantitatively evaluate and predict the water absorption rate of wood fiber bundles. The results can provide a reference for the process control and property design of wood structural materials. Future research directions include considering more wood species, extracting internal structural features using CT, further improving the prediction accuracy with deep learning algorithms, and model validation through controlled experiments.
The research findings lay the foundation for the quantitative evaluation and prediction of wood material properties, provide insights for the in-depth exploration of micro-mechanisms, and are of great significance to the wood processing industry.
Author Contributions
Conceptualization, Z.C., Y.Y. and J.Y.; methodology, Z.C.; software, Z.C. and H.G.; validation, H.G.; formal analysis, Z.C. and H.L.; investigation, H.L.; resources, J.Y.; data curation, H.G.; writing—original draft preparation, Z.C.; writing—review and editing, Z.C., J.X., Y.Y. and J.Y.; visualization, Z.C. and J.X.; supervision, J.X.; project administration, J.Y.; funding acquisition, J.Y. All authors have read and agreed to the published version of the manuscript.
Funding
This research was supported by the Central Level Public Welfare Research Institutes Basic Research Fund, China (Grant No. CAFYBB2021ZX001).
Data Availability Statement
The data sets generated during and/or analyzed during the current study are available from the corresponding author upon request.
Acknowledgments
The author wishes to convey heartfelt thanks to Zhang Leping for her outstanding guidance in the field of data visualization. Additionally, heartfelt appreciation is extended to Feng Haiyun, Chen Sihan, and Liu Zixin for their unwavering support and invaluable help throughout the process of writing this paper.
Conflicts of Interest
The authors declare no conflicts of interest.
References
- Wu, Y. Newly advances in wood science and technology. Cent. South Univ. For. Technol. 2021, 41, 1–28. [Google Scholar] [CrossRef]
- Zhu, A.; Hong, Y.; Zhang, X.; Yu, H.; Wang, H.; Wang, Y.; Yu, W. Research Progress on Carbon Footprint of Wood/Bamboo Products Based on the Life Cycle. China For. Prod. Ind. 2023, 60, 83–87. [Google Scholar] [CrossRef]
- Sun, X.; He, M.; Liang, F.; Li, Z.; Wu, L.; Sun, Y. Experimental Investigation into the Mechanical Properties of Scrimber Composite for Structural Applications. Constr. Build. Mater. 2021, 276, 122234. [Google Scholar] [CrossRef]
- Sun, Z.; Xu, Y.; Bao, M.; Wei, J.; Liu, S.; Yu, W. Effect of Resin Content on the Water-Resistant, Mechanical, and Thermal Properties of Scrimber Made from Radiata Pine Wood (Pinus Radiata D. Don). Wood Mater. Sci. Eng. 2024, 1–9. [Google Scholar] [CrossRef]
- Zhang, Y.; Huang, Y.; Qi, Y.; Yu, W. Novel Engineered Scrimber with Outstanding Dimensional Stability from Finely Fluffed Poplar Veneers. Measurement 2018, 124, 318–321. [Google Scholar] [CrossRef]
- Yu, W. Current Status and Future Trend of Science and Technology for Reconstituted Materials in China. Chin. J. Wood Sci. Technol. 2023, 37, 1–7. [Google Scholar]
- Gao, Q.; Lin, Q.; Huang, Y.; Hu, J.; Yu, W. High-Performance Wood Scrimber Prepared by a Roller-Pressing Impregnation Method. Constr. Build. Mater. 2023, 368, 130404. [Google Scholar] [CrossRef]
- Chen, W.; Li, X.; Yuan, G.; Ji, Y.; Chen, M.; Fu, B. Preparation and characterization of flame retardant bamboo-wood hybrid scrimber. New Chem. Mater. 2015, 43, 93–95. [Google Scholar]
- Gao, Q.; Lin, Q.; Gan, J.; Yu, W. Punctated Microcracked Structure to Enhance the Mildew Resistance of Wood Scrimber. Constr. Build. Mater. 2024, 416, 135237. [Google Scholar] [CrossRef]
- Liu, S.; Lin, Q.; Yu, Y.; Yu, W. Preparation and Characterization of Wood Scrimber Based on Eucalyptus Veneers Complexed with Ferrous Ions. Polymers 2022, 14, 4217. [Google Scholar] [CrossRef]
- Huang, Y.; Lin, Q.; Fu, F.; Lin, L.; Yu, W. Scalable High-Performance Wood-Based Composites Prepared by Hydro-Mechanical Treatment. Compos. Part B Eng. 2023, 267, 111041. [Google Scholar] [CrossRef]
- Zhang, Y.; Qi, Y.; Huang, Y.; Yu, W. Manufacturing Technology, Application and Future Development of High-performance Wood Scrimber in China. China Wood Ind. 2018, 32, 14–17. [Google Scholar] [CrossRef]
- Wei, J.; Rao, F.; Zhang, Y.; Li, C.; Yu, W. Effect of Veneer Crushing Process on Physical and Mechanical Properties of Scrimbers Made of Pinus radiata and Populus tomentosa. China Wood Ind. 2019, 33, 51–54. [Google Scholar] [CrossRef]
- Kobayashi, K.; Hwang, S.-W.; Okochi, T.; Lee, W.-H.; Sugiyama, J. Non-Destructive Method for Wood Identification Using Conventional X-Ray Computed Tomography Data. J. Cult. Herit. 2019, 38, 88–93. [Google Scholar] [CrossRef]
- Wu, J.; Zhang, Y.; Yu, W. Influence mechanism of roller-press impregnation on the dimensional stability of eucalyptus scrimber. J. Beijing For. Univ. 2024, 46, 141–151. [Google Scholar] [CrossRef]
- He, M.-J.; Zhang, J.; Li, Z.; Li, M.-L. Production and Mechanical Performance of Scrimber Composite Manufactured from Poplar Wood for Structural Applications. J. Wood Sci. 2016, 62, 429–440. [Google Scholar] [CrossRef]
- Lin, Q.; Zhang, Y.; Yu, W. Improvement of dimensional stability of poplar scrimber by pre-compression treatment gluing technology. J. For. Eng. 2021, 6, 58–67. [Google Scholar] [CrossRef]
- Zhang, Y.; Wei, Y.; Yu, W. Effect of Crushed Veneer Thickness on Poplar Scrimber Properties. China Wood Ind. 2017, 31, 46–49. [Google Scholar] [CrossRef]
- Sirui, Y.; Jinzhang, L.; Yunkui, Z.; Zhenxue, L.; Mingjie, G. Study on Dimensional Stability and Microscopic Characterization of Bonding Interface of Blue-Stained Poplar Scrimber. J. Cent. South Univ. For. Technol. 2018, 38, 136–141. [Google Scholar] [CrossRef]
- Yingfeng, Z.; Yiqiang, W.; Junhua, X.; Xianjun, L.; Kequan, L. Effect of Preparation Technology on Mechanical Properties of Reconstituted Bamboo. J. Southwest For. Univ. 2016, 32, 132–135. [Google Scholar]
- Zhang, Y.; Meng, F.; Yu, W. Crushing Effectiveness on Properties of Crushed Bamboo-Mat Composites. China Wood Ind. 2011, 25, 1–4. [Google Scholar] [CrossRef]
- Yu, X.; Yu, W. Performance Research on Crushed Bamboo Veneer for Bambusa distegia. J. Northeast For. Univ. 2013, 41, 74–76. [Google Scholar] [CrossRef]
- Jolliffe, I.T.; Cadima, J. Principal Component Analysis: A Review and Recent Developments. Philos. Trans. R. Soc. 2016, 374, 20150202. [Google Scholar] [CrossRef] [PubMed]
- Hair, J.F.; Anderson, R.E.; Babin, B.J.; Black, W.C. Multivariate Data Analysis; Prentice Hall: Upper Saddle River, NJ, USA, 2009; ISBN 978-0-13-813263-7. [Google Scholar]
- Johnson, R.A.; Wichern, D.W. Applied Multivariate Statistical Analysis; Pearson: London, UK, 2007; ISBN 978-93-325-4955-5. [Google Scholar]
- Dalmaijer, E.S.; Nord, C.L.; Astle, D.E. Statistical Power for Cluster Analysis. BMC Bioinform. 2022, 23, 205. [Google Scholar] [CrossRef] [PubMed]
- Batagelj, V. Generalized Ward and Related Clustering Problems. Classification and Related Methods of Data Analysis; Edvard Kardelj University: Ljubljana, Yugoslavia, 1988. [Google Scholar]
- Yang, X.; Liu, W.; Liu, W.; Tao, D. A Survey on Canonical Correlation Analysis. IEEE Trans. Knowl. Data Eng. 2021, 33, 2349–2368. [Google Scholar] [CrossRef]
- Bertolini, M.; Mezzogori, D.; Neroni, M.; Zammori, F. Machine Learning for Industrial Applications: A Comprehensive Literature Review. Expert Syst. Appl. 2021, 175, 114820. [Google Scholar] [CrossRef]
- Joshi, K.; Patil, B. Prediction of Surface Roughness by Machine Vision Using Principal Components Based Regression Analysis. Procedia Comput. Sci. 2020, 167, 382–391. [Google Scholar] [CrossRef]
- Elmaz, F.; Yücel, Ö.; Mutlu, A.Y. Predictive Modeling of Biomass Gasification with Machine Learning-Based Regression Methods. Energy 2020, 191, 116541. [Google Scholar] [CrossRef]
- Chang, D.; Li, J.; Dong, R. Decoloring Stain of Populus Wet Wood. J. Northeast For. Univ. 2005, 27–28, 82. [Google Scholar]
- Moya, R.; Muñoz, F.; Jeremic, D.; Berrocal, A. Visual Identification, Physical Properties, Ash Composition, and Water Diffusion of Wetwood in Gmelina arborea. Can. J. For. Res. 2009, 39, 537–545. [Google Scholar] [CrossRef]
- Li, M.; Duan, H.; Wu, Z.; Li, X.; Qiu, J. Chemical Composition of the Wetwoods of Two Kinds of Poplar Species. J. Northwest For. Univ. 2018, 33, 211–214. [Google Scholar]
- Liu, X.; Wang, X.; Jiang, Z.; Ren, H.; Fei, B. Effects of planting density on tree growth and wood quality and modeling the wood quality of Populus × xiaohe. J. Beijing For. Univ. 2007, 29, 161–166. [Google Scholar]
- Yamamoto, H.; Sakagami, H.; Kijidani, Y.; Matsumura, J. Dependence of Microcrack Behavior in Wood on Moisture Content during Drying. Adv. Mater. Sci. Eng. 2013, 2013, e802639. [Google Scholar] [CrossRef]
- Thybring, E.E.; Kymäläinen, M.; Rautkari, L. Experimental Techniques for Characterising Water in Wood Covering the Range from Dry to Fully Water-Saturated. Wood Sci. Technol. 2018, 52, 297–329. [Google Scholar] [CrossRef]
- Ma, Y.; Xu, Q.; Yang, C. Cutting principle and mechanical analysis of scrimber rolling fluffer. Wood Process. Mach. 2016, 27, 1–4. [Google Scholar] [CrossRef]
- Cao, H.; Huang, S.; Yin, F.; Gao, Y.; Liao, X.; Yi, S.; Zhou, Y. Water Uptake of Radiata Pine Wood after Microwave and Superheated Steam Treatments: Sapwood vs. Heartwood. Eur. J. Wood Prod. 2023, 81, 1–12. [Google Scholar] [CrossRef]
- Thybring, E.E.; Fredriksson, M.; Zelinka, S.L.; Glass, S.V. Water in Wood: A Review of Current Understanding and Knowledge Gaps. Forests 2022, 13, 2051. [Google Scholar] [CrossRef]
Figure 1.
The schematic diagram for the preparation of wood fiber bundles (WFB).
Figure 1.
The schematic diagram for the preparation of wood fiber bundles (WFB).
Figure 2.
Diagram of crack extraction from WFB specimens between different cracking levels and definition methods of cracking degree (CD) quantitative characterization parameters.
Figure 2.
Diagram of crack extraction from WFB specimens between different cracking levels and definition methods of cracking degree (CD) quantitative characterization parameters.
Figure 3.
Water absorption rate (WAR) distribution histogram.
Figure 3.
Water absorption rate (WAR) distribution histogram.
Figure 4.
Relative discrimination error bar charts for three levels (C1–C3) of CD under different feature selection methods. Accumulative relative discrimination error line charts for two feature descriptor generation methods (FI and FS): (a) selecting only the Cracking Density as the feature descriptor, which served as the baseline (0 references); (b) selecting only the coherence degree as the feature descriptor, which served as the baseline.
Figure 5.
Bar diagram with error lines for the average mean squared error (MSE) of ten random sampling seeds across different prediction model parameters. Line chart of MSE changes for each r random sampling seed under the minimum average MSE prediction model parameter: (a) cracking once; (b) cracking twice; (c) cracking three times.
Figure 6.
Prediction result scatter plots between different CDs: (a) C1S8; (b) C2S3; (c) C3S6 (prediction models: C1: P1D4, C2: P1D2, C3: P1D3).
Figure 6.
Prediction result scatter plots between different CDs: (a) C1S8; (b) C2S3; (c) C3S6 (prediction models: C1: P1D4, C2: P1D2, C3: P1D3).
Figure 7.
Prediction result scatter plots between different CDs: (a) C1S3; (b) C2S4; (c) C3S1 (prediction models: C1: P1D4, C2: P1D2, C3: P1D3).
Figure 7.
Prediction result scatter plots between different CDs: (a) C1S3; (b) C2S4; (c) C3S1 (prediction models: C1: P1D4, C2: P1D2, C3: P1D3).
Figure 8.
Comprehensive prediction results from the data obtained by S5 sampling scatter plots.
Figure 8.
Comprehensive prediction results from the data obtained by S5 sampling scatter plots.
Figure 9.
Ideal model diagram of the relationship between CD and WAR.
Figure 9.
Ideal model diagram of the relationship between CD and WAR.
Figure 10.
Sample distribution patterns and clustering result images based on CD quantitative characterization parameters (the front and back sides of the WFB are considered as two independent samples): (a) based on cracking density; (b) based on coherence degree; (c) based on count of cracks; (d) based on average width.
Figure 11.
Sample distribution patterns and clustering result images based on CD quantitative characterization parameters (the front and back sides of the WFB are considered as one sample): (a) based on cracking density; (b) based on coherence degree; (c) based on count of cracks; (d) based on average width.
Figure 12.
Correlation analysis diagram among four quantitative characterization parameters for cracks in the WFB. (“*” and “***“ as placeholders to ensure the consistency of formatting of data visualization results).
Figure 12.
Correlation analysis diagram among four quantitative characterization parameters for cracks in the WFB. (“*” and “***“ as placeholders to ensure the consistency of formatting of data visualization results).
Table 1.
Water absorption rate (WAR) among the different cracking levels of specimens.
Table 1.
Water absorption rate (WAR) among the different cracking levels of specimens.
| Parameter Name | C1 | C2 | C3 |
|---|
| Sample Size | 94 | 113 | 154 |
| Mean Value/% | 62.70 | 105.94 | 119.29 |
| Standard Deviation/% | 13.71 | 23.67 | 17.23 |
| Disclaimer/Publisher’s Note: The statements, opinions and data contained in all publications are solely those of the individual author(s) and contributor(s) and not of MDPI and/or the editor(s). MDPI and/or the editor(s) disclaim responsibility for any injury to people or property resulting from any ideas, methods, instructions or products referred to in the content. |
© 2024 by the authors. Licensee MDPI, Basel, Switzerland. This article is an open access article distributed under the terms and conditions of the Creative Commons Attribution (CC BY) license (https://creativecommons.org/licenses/by/4.0/).


