
Seasonal Photosynthetic Activity in the Crown Compartments of European Ash (Fraxinus excelsior)

Abstract
:1. Introduction
2. Material and Methods
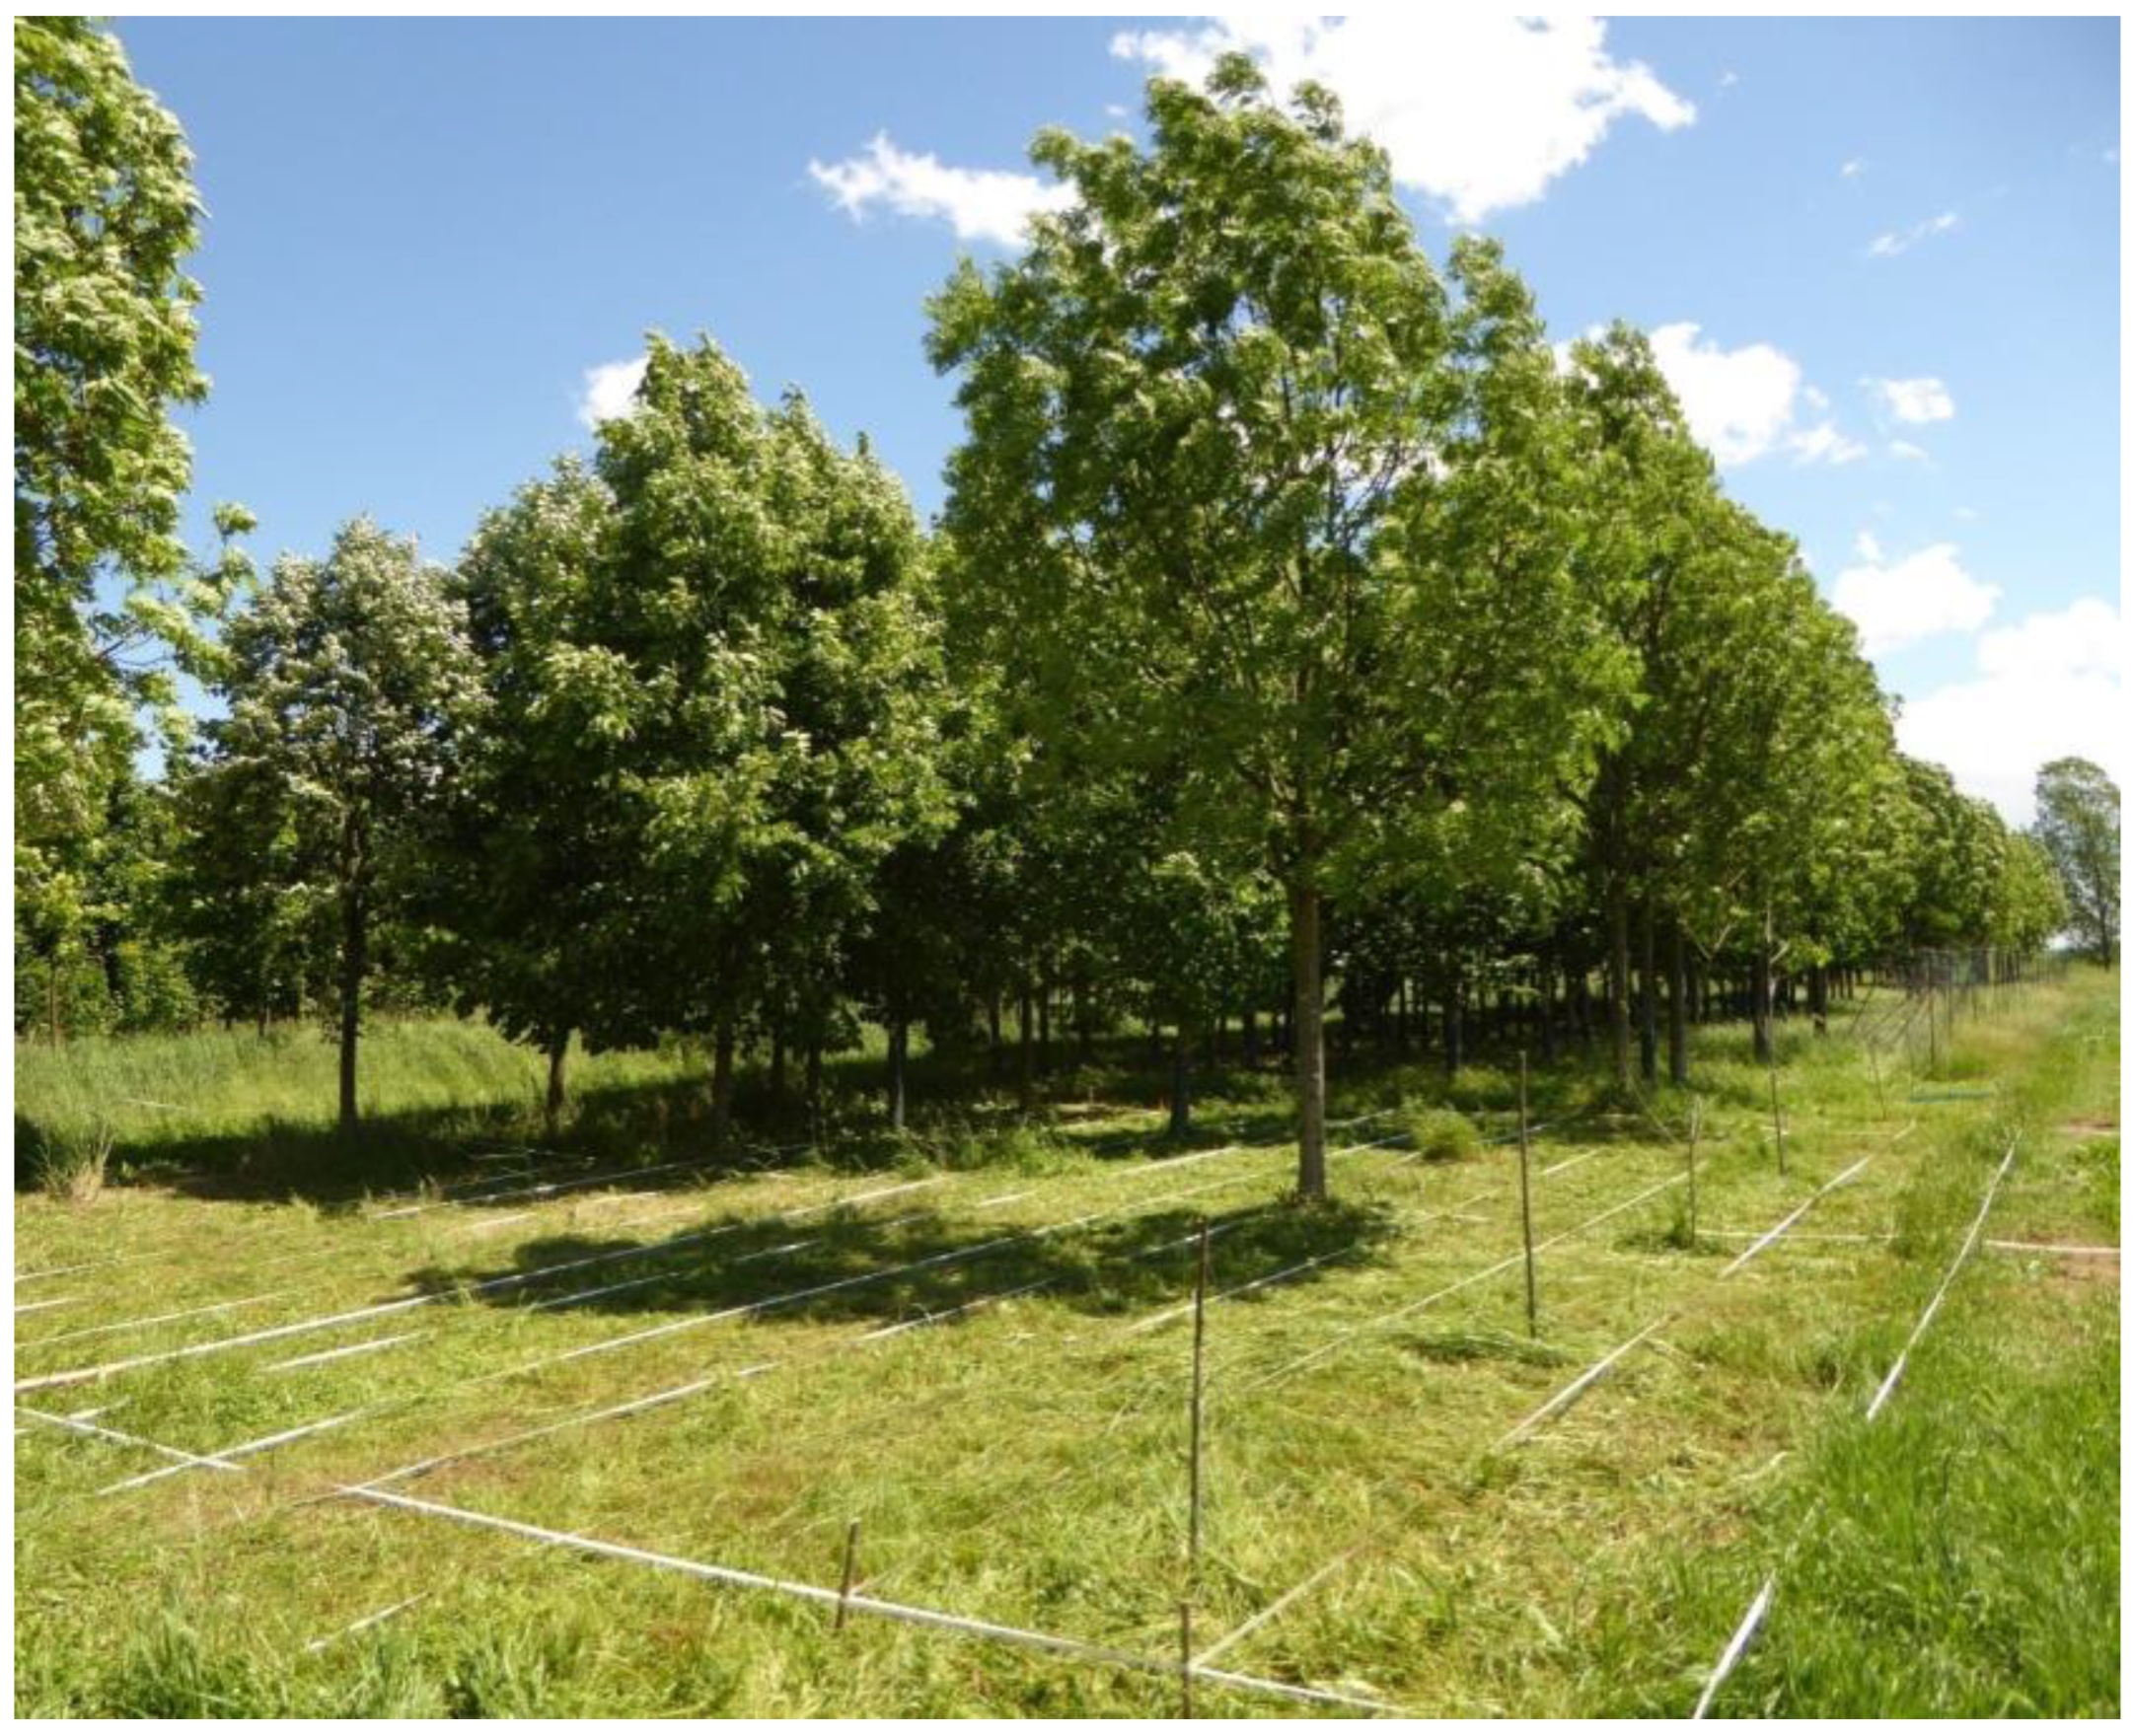
2.1. Site Description
2.2. Experimental Trees and Measuring Periods
2.3. Gas Exchange Measurements
2.4. Biometric Measurements
2.5. Physiological Data Processing
2.6. Statistical Analysis
3. Results
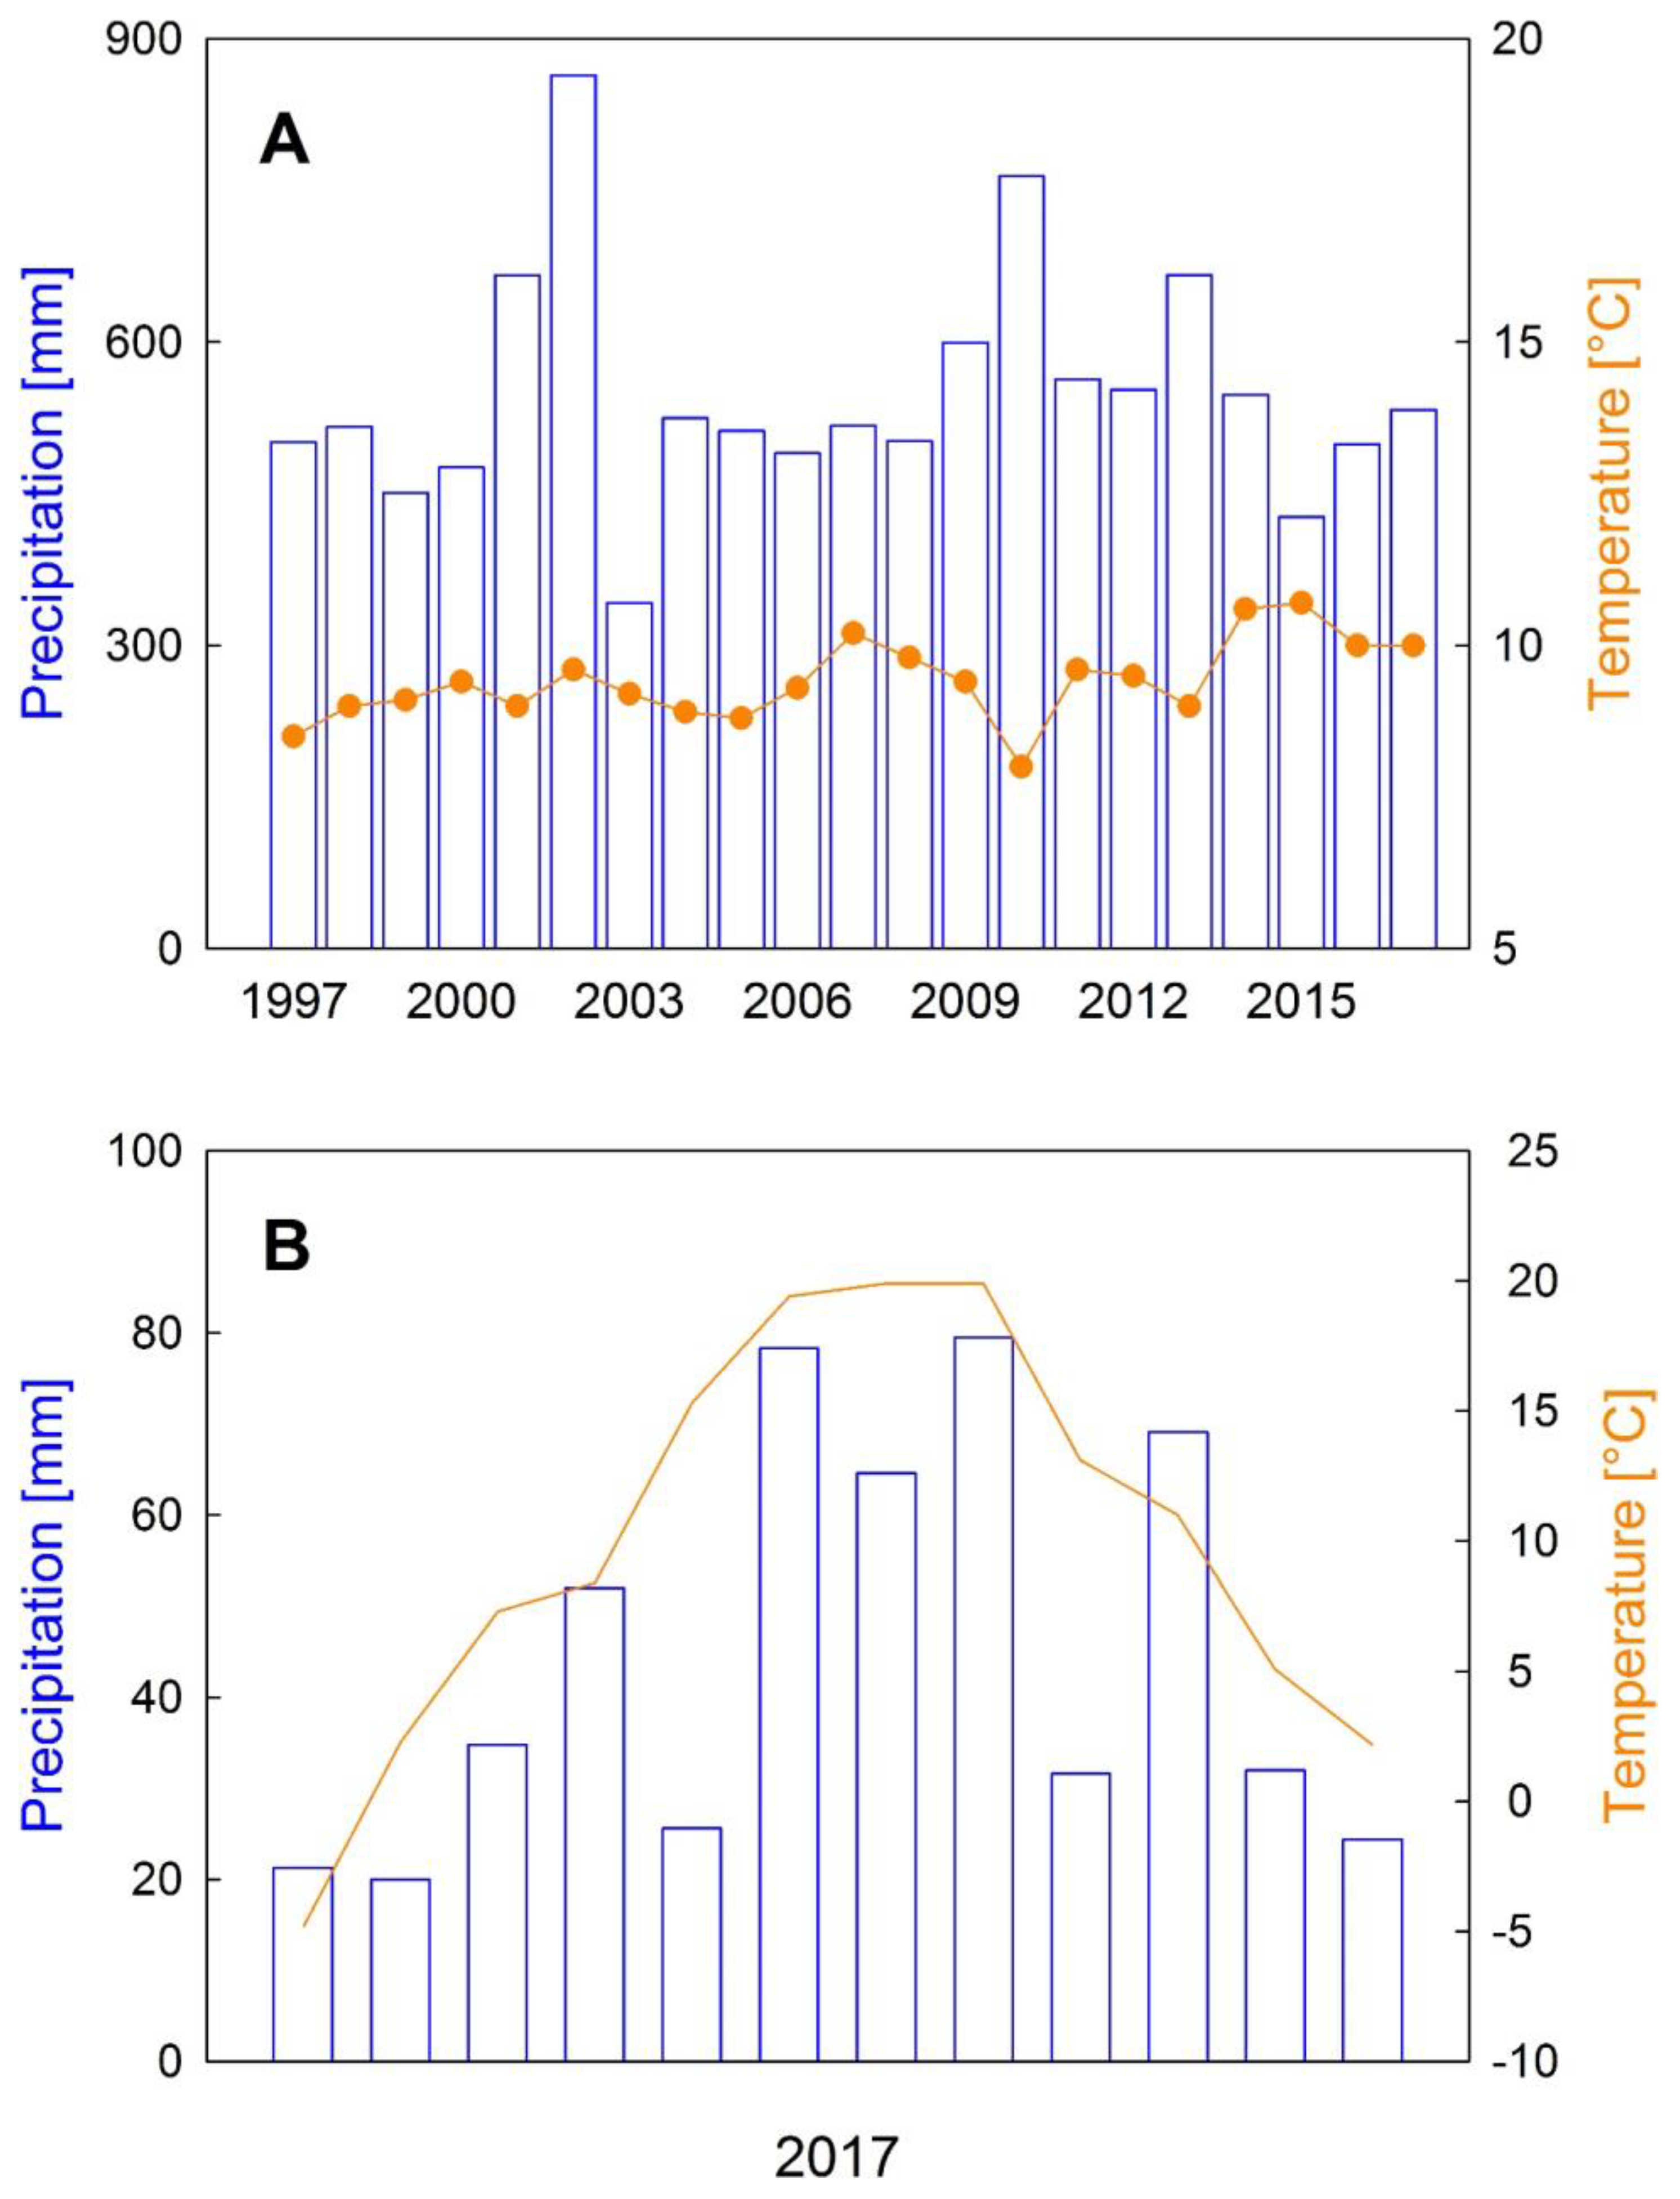
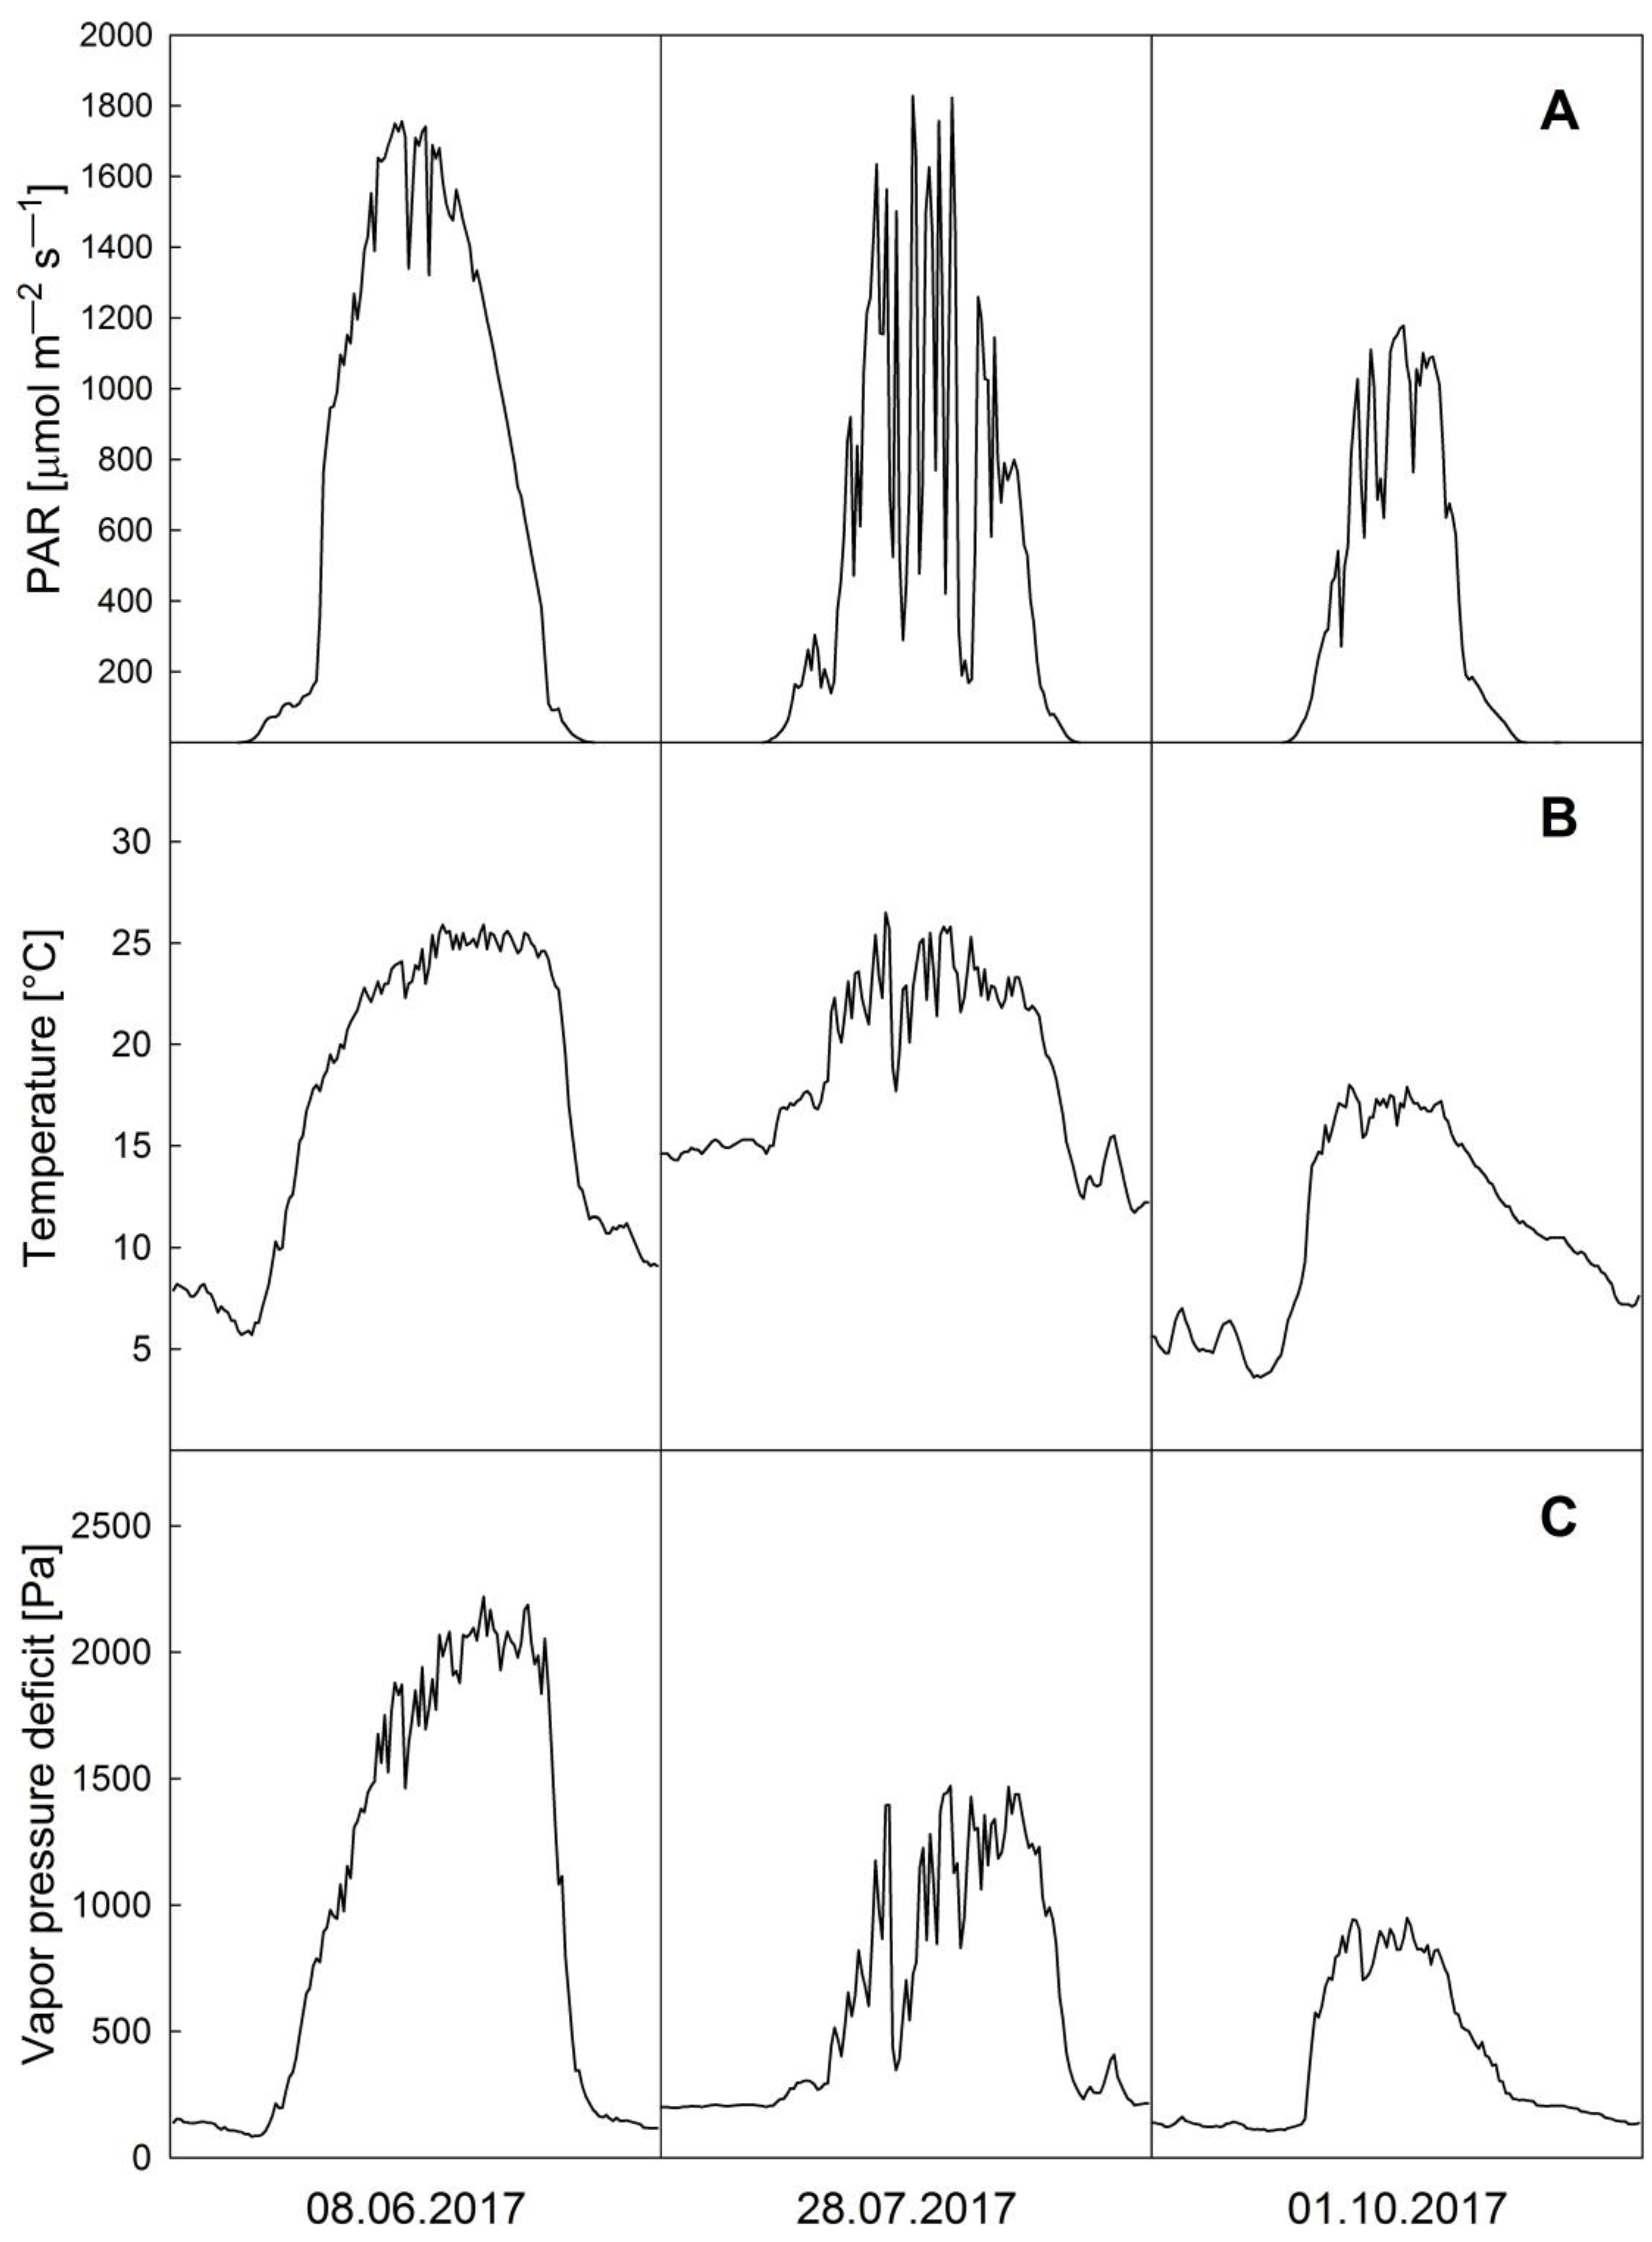
3.1. Microclimate
3.2. Crown and Leaf Biometry
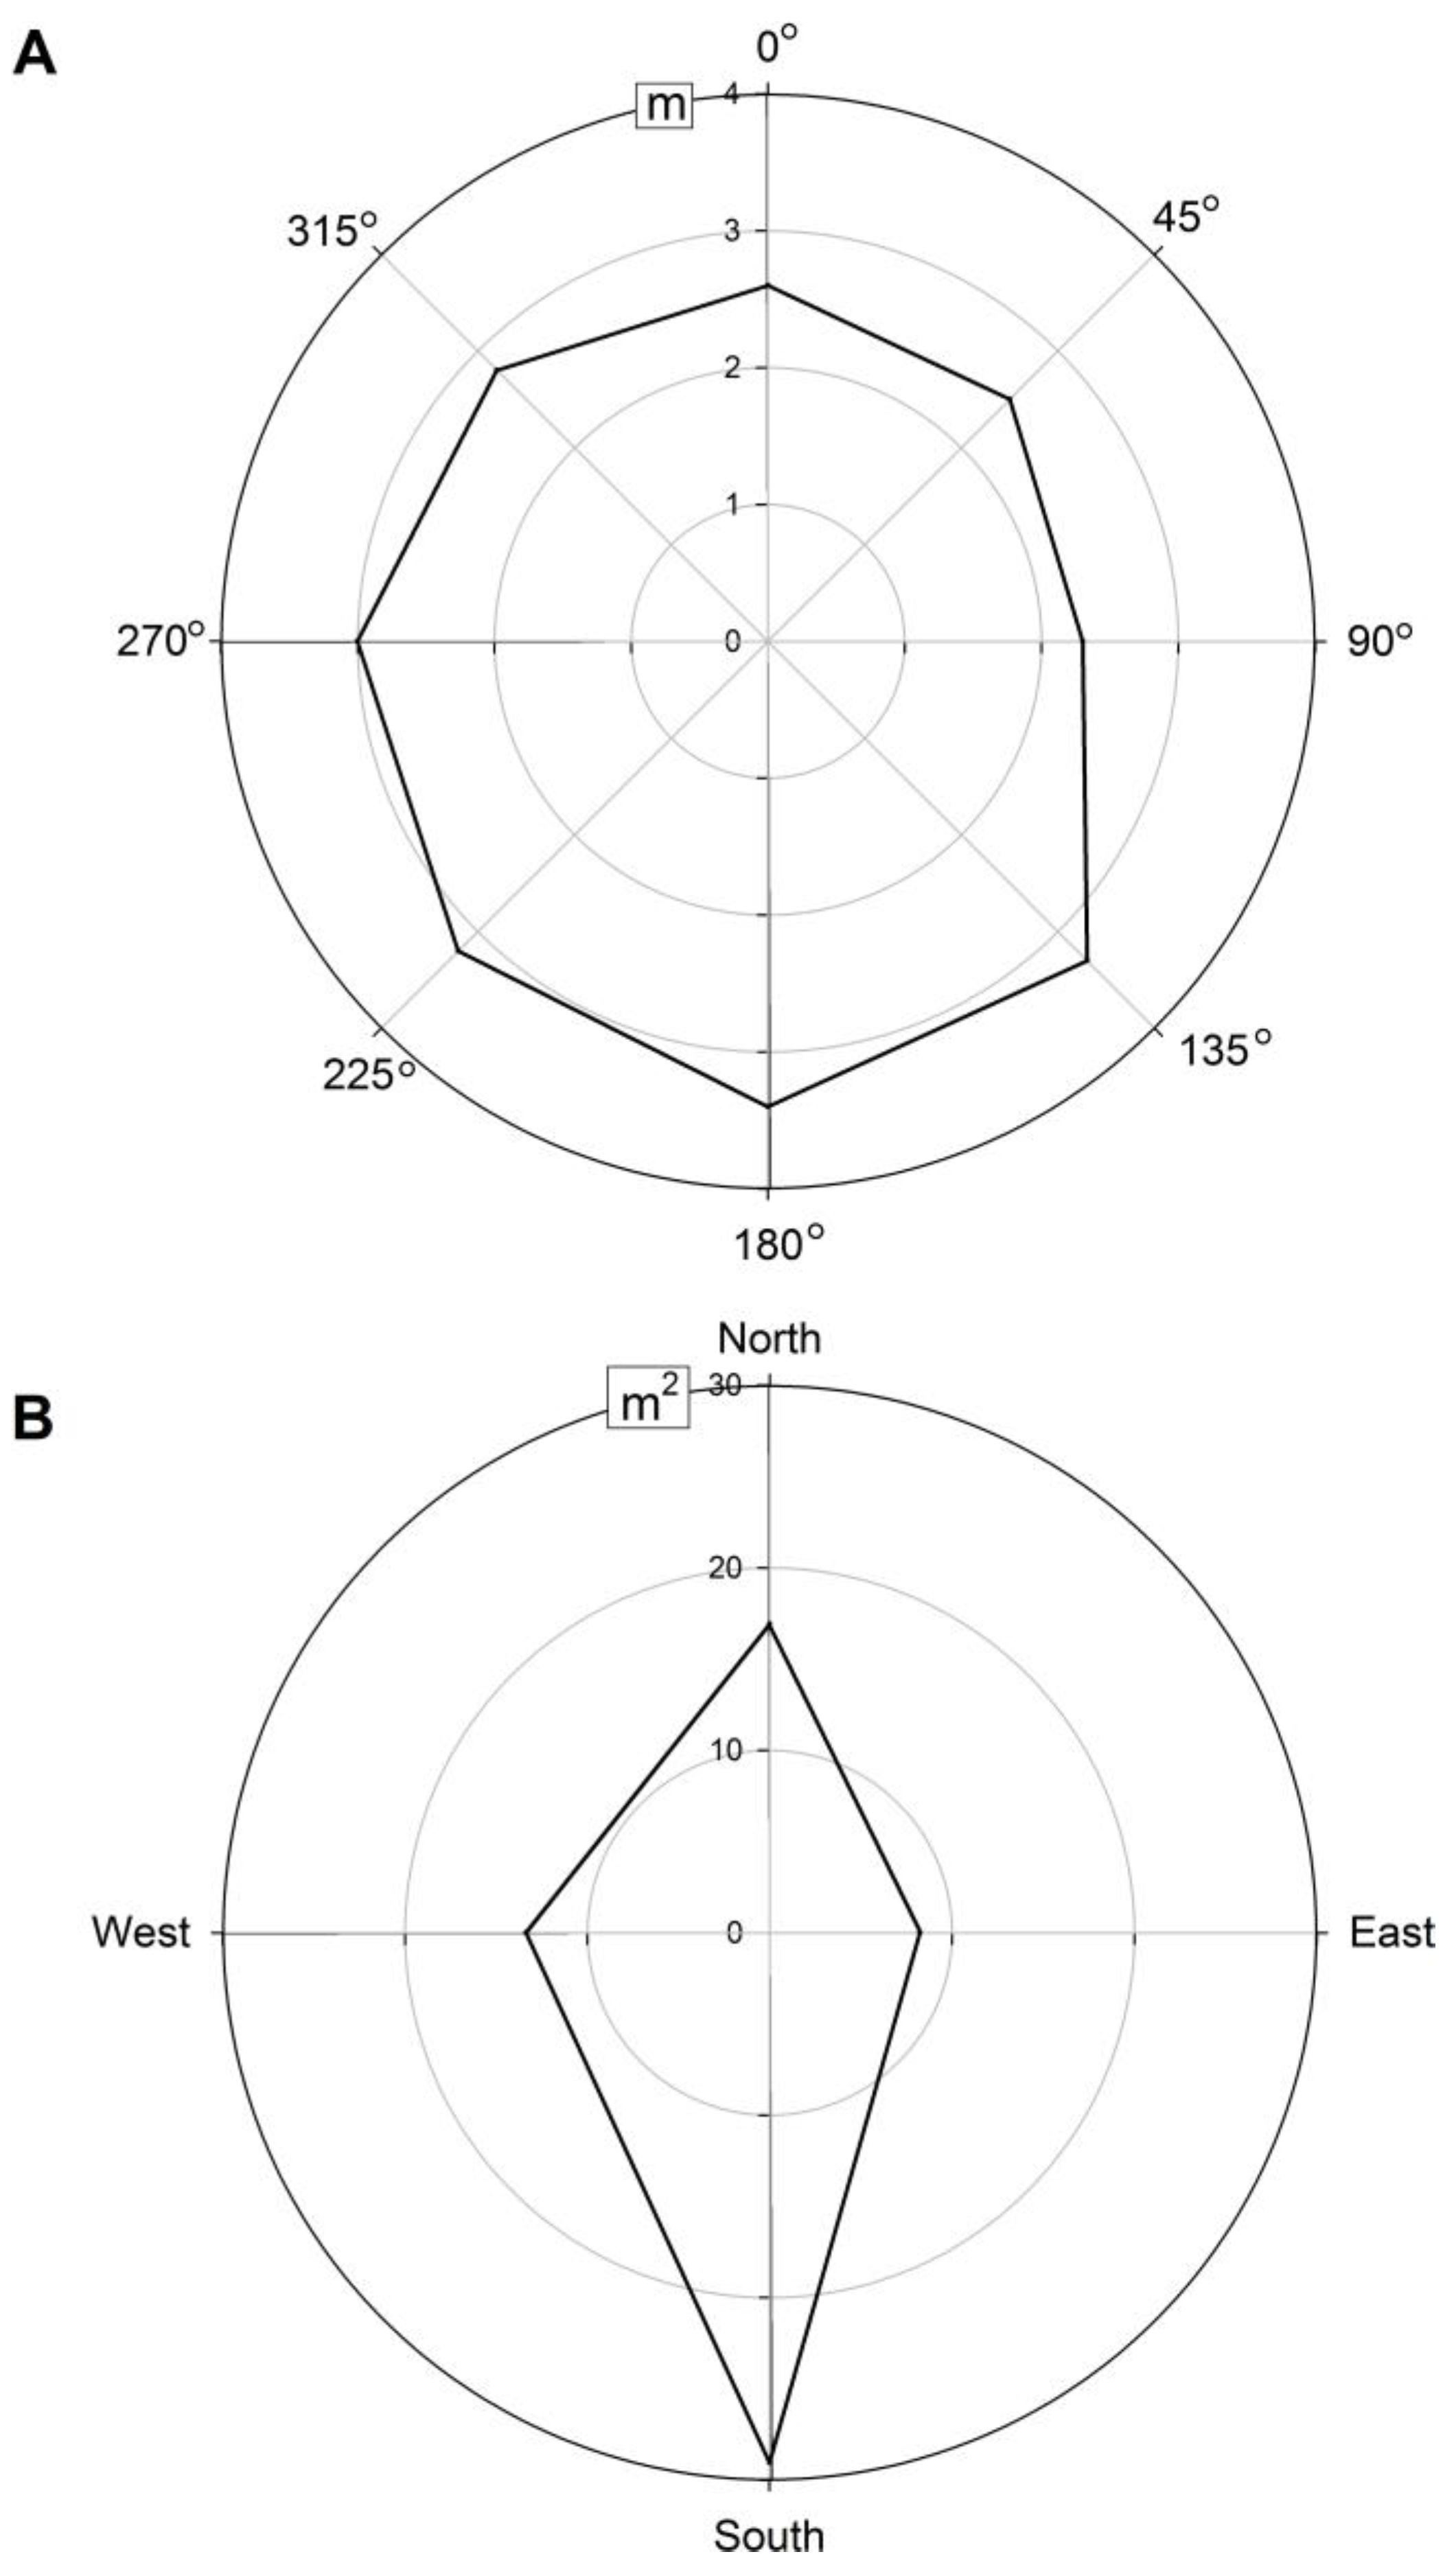
3.2.1. Crown Leaf Area and Projection
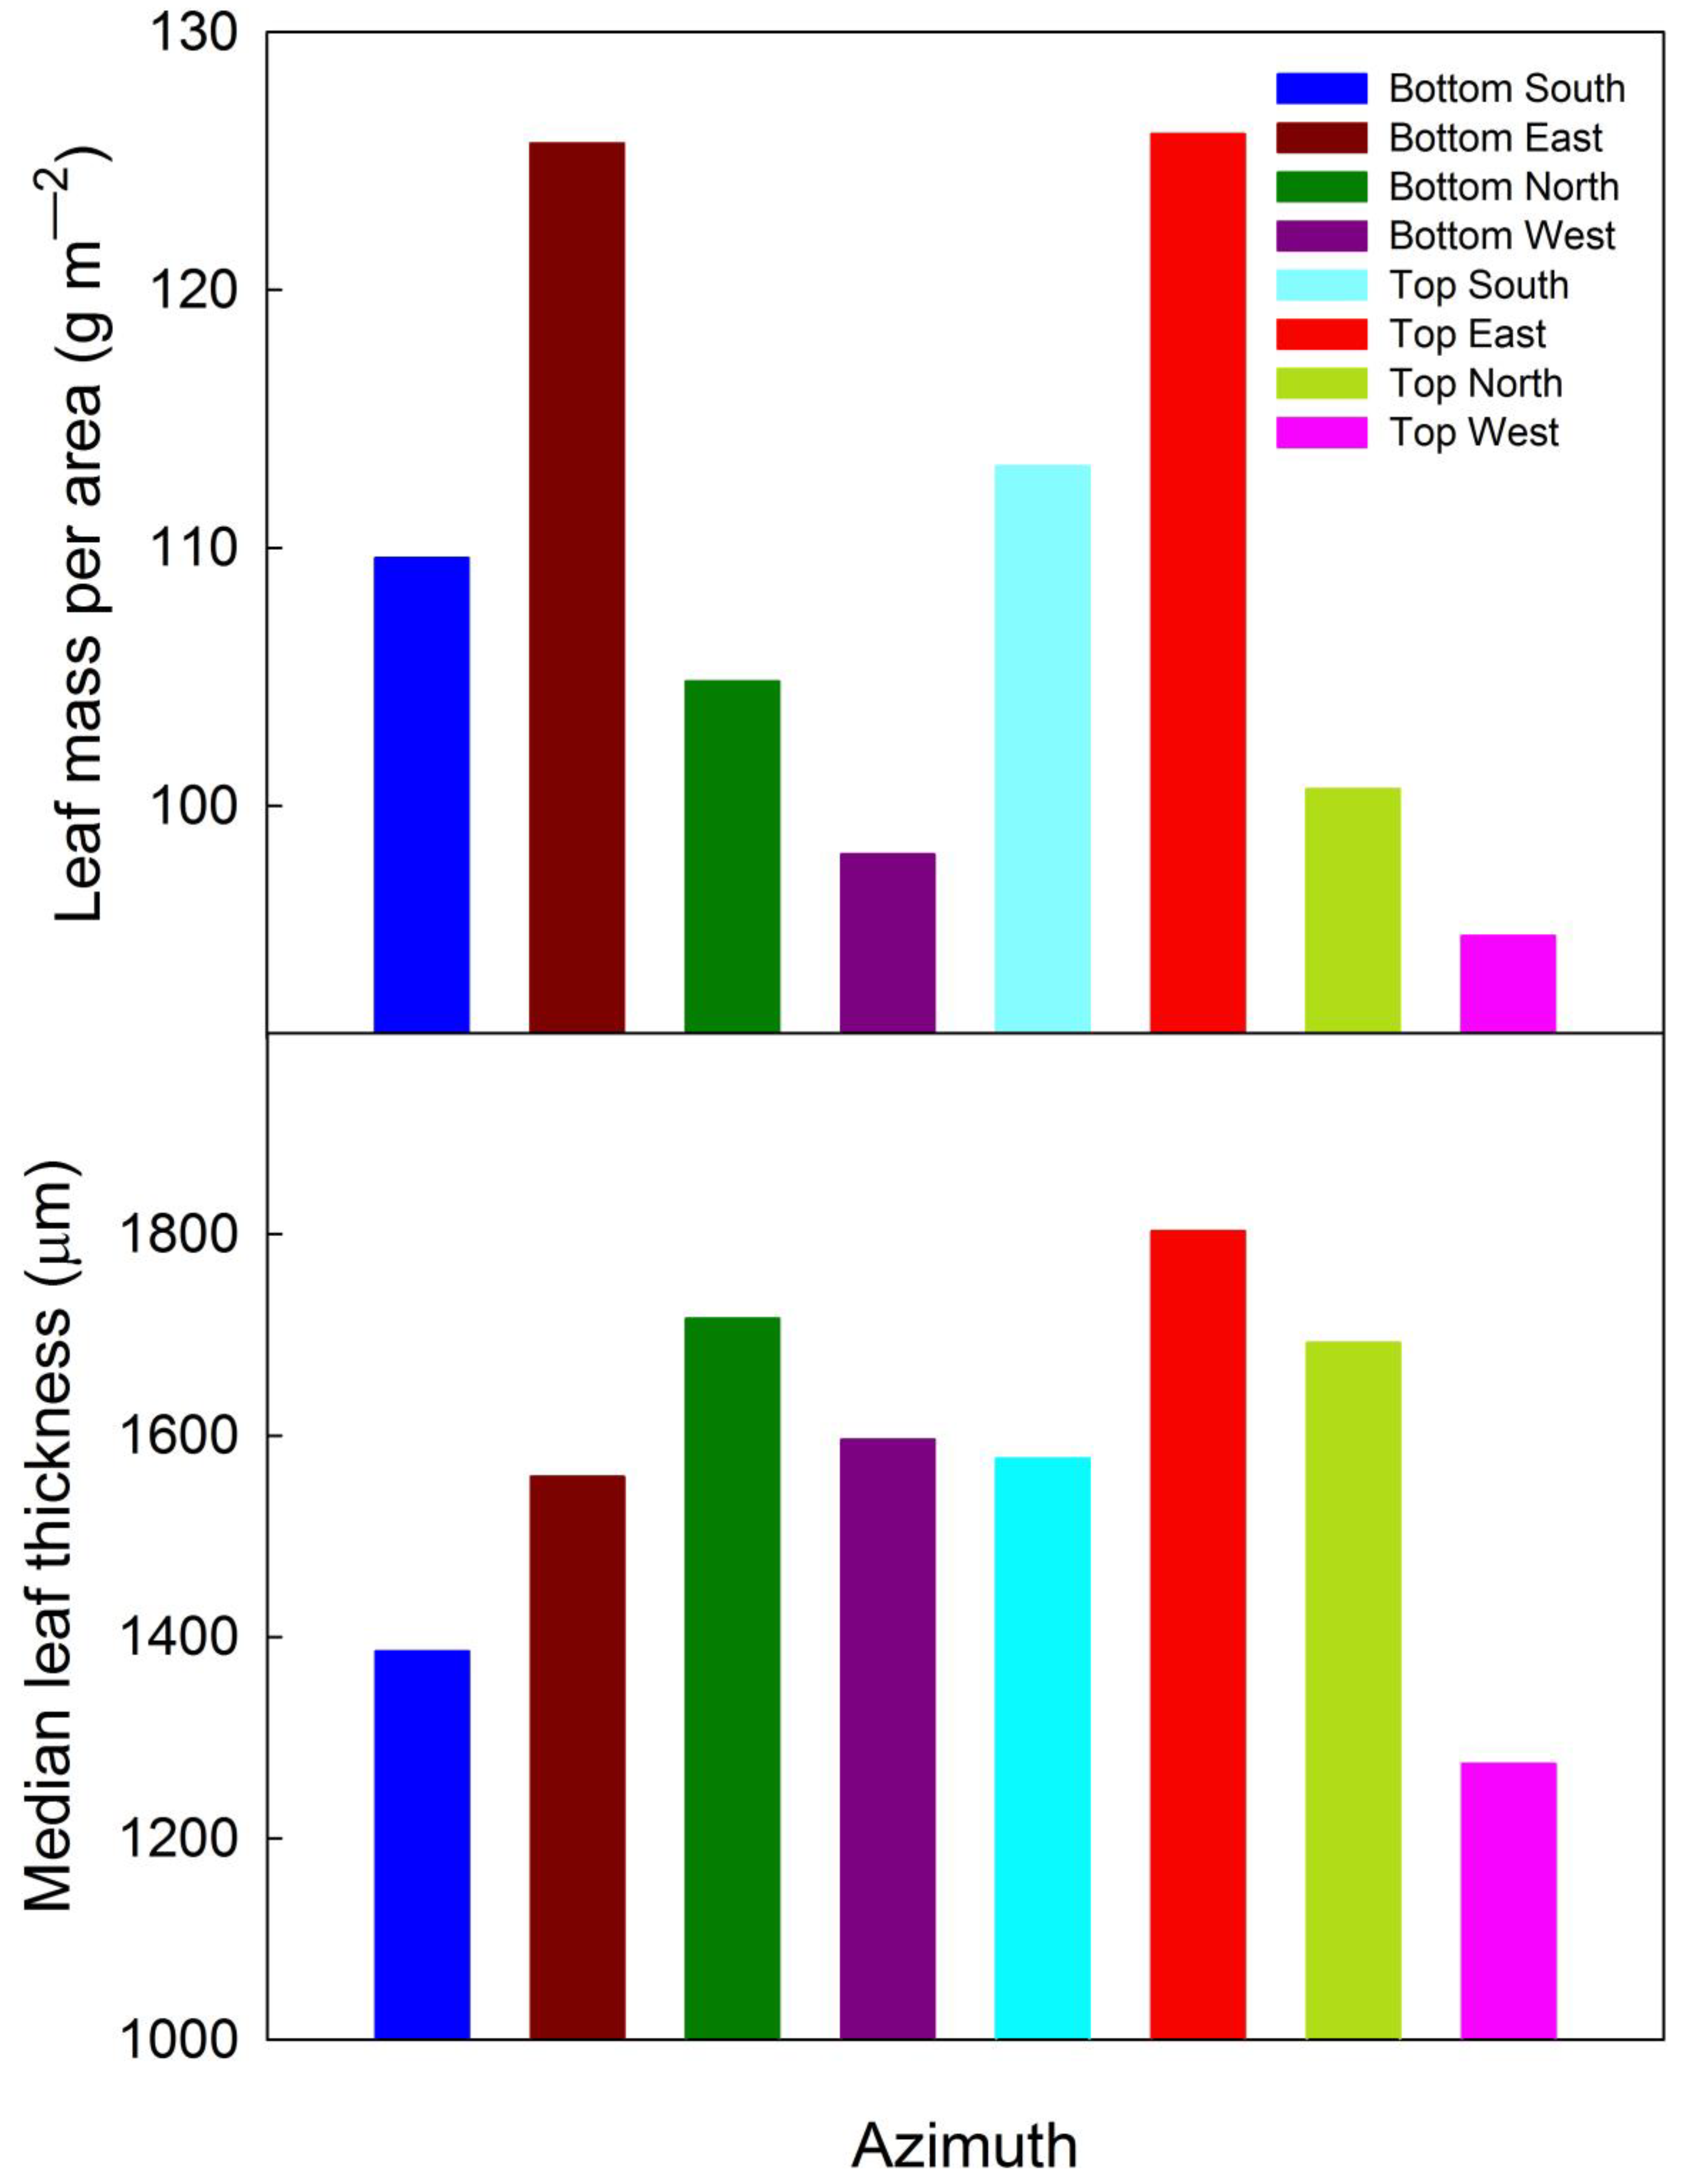
3.2.2. Leaf Biometry
3.3. Photosynthetic Activity
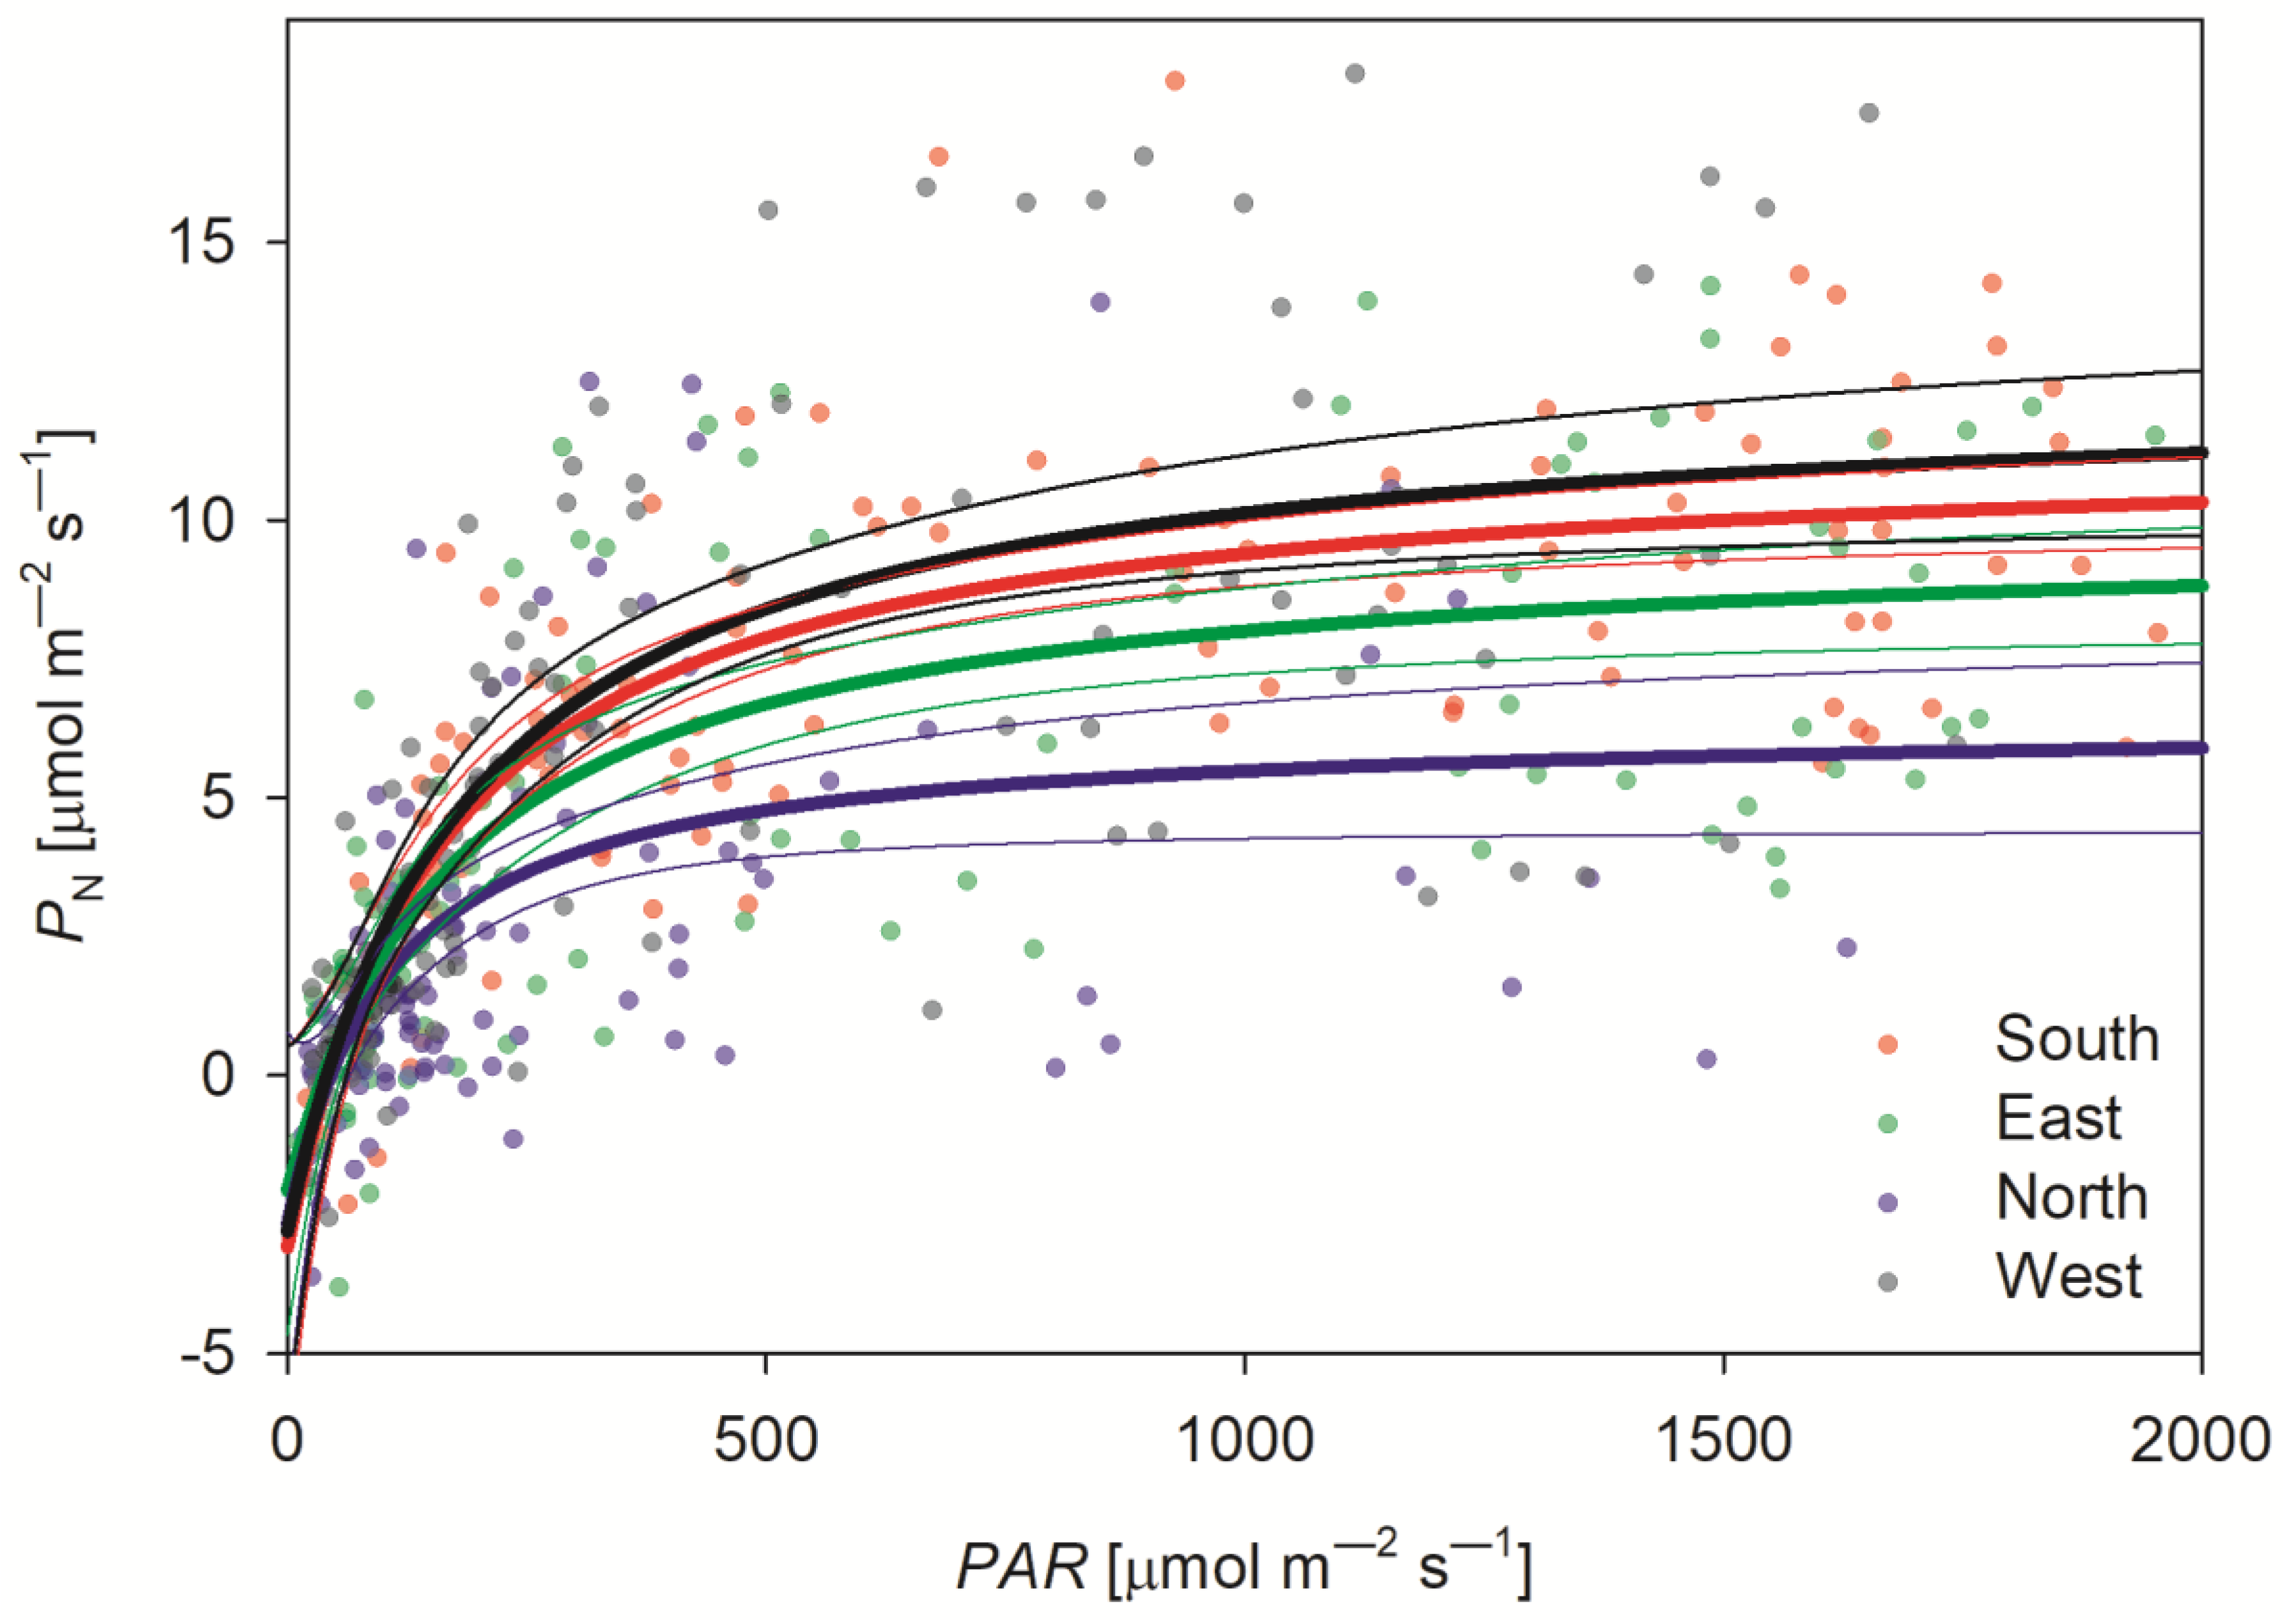
3.3.1. Maximum Rate of Photosynthesis
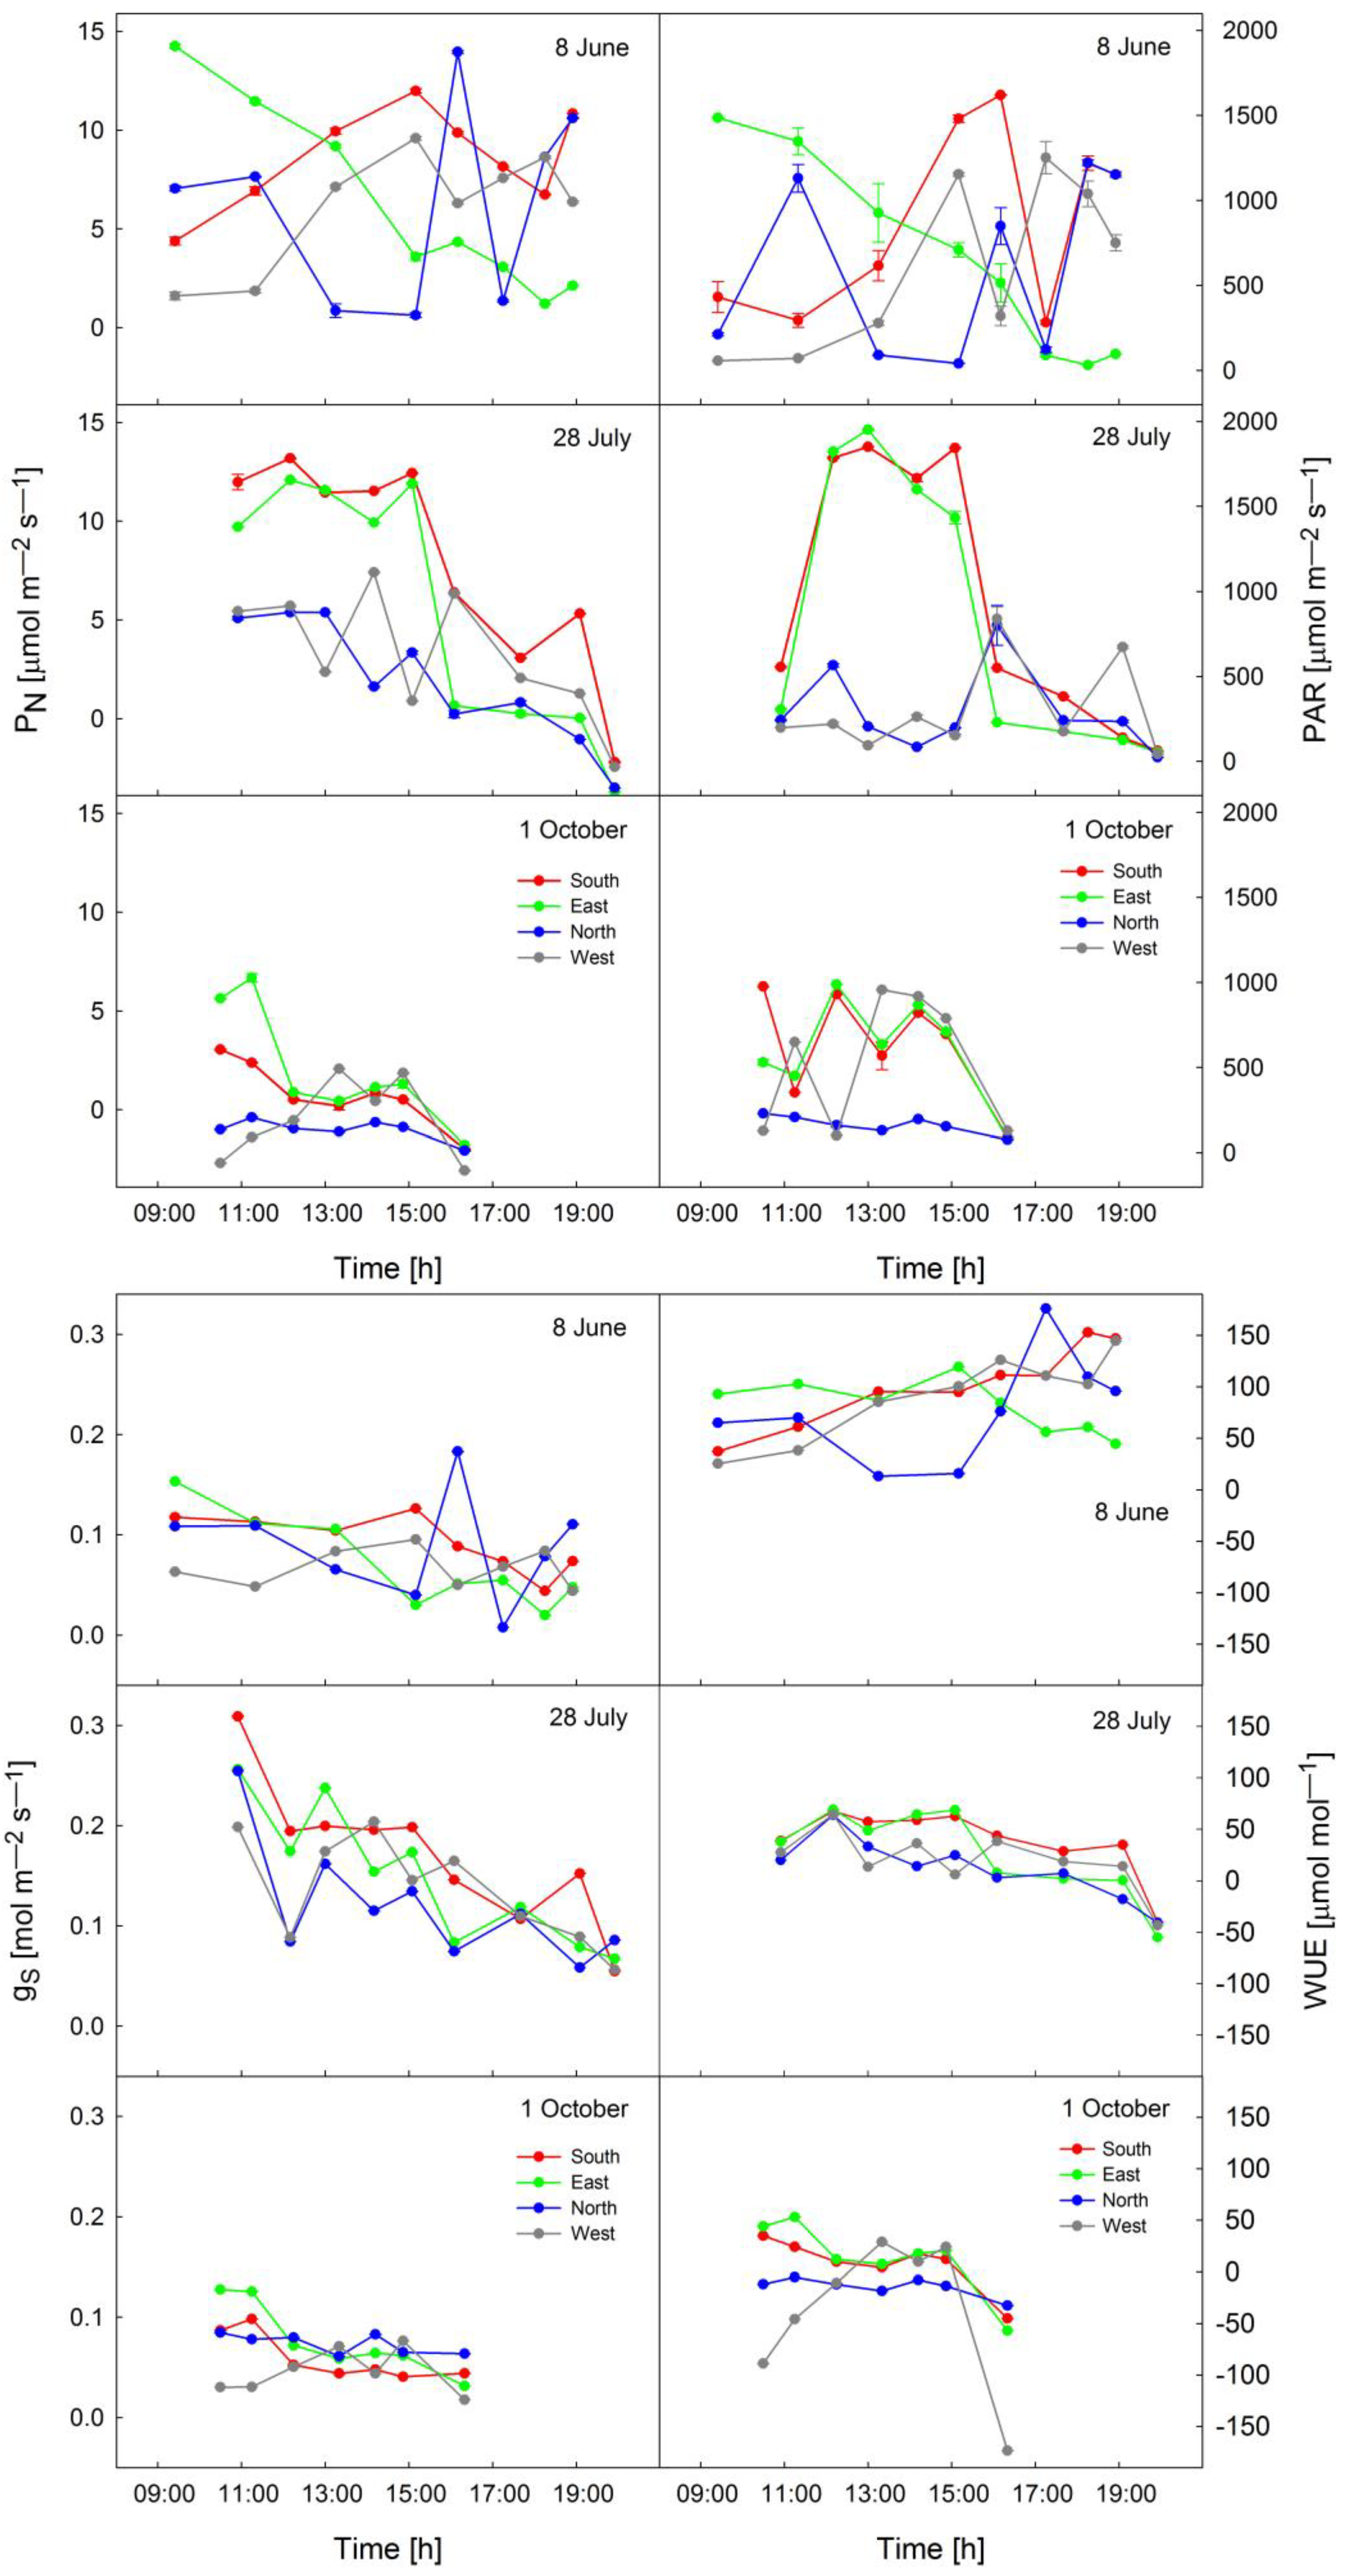
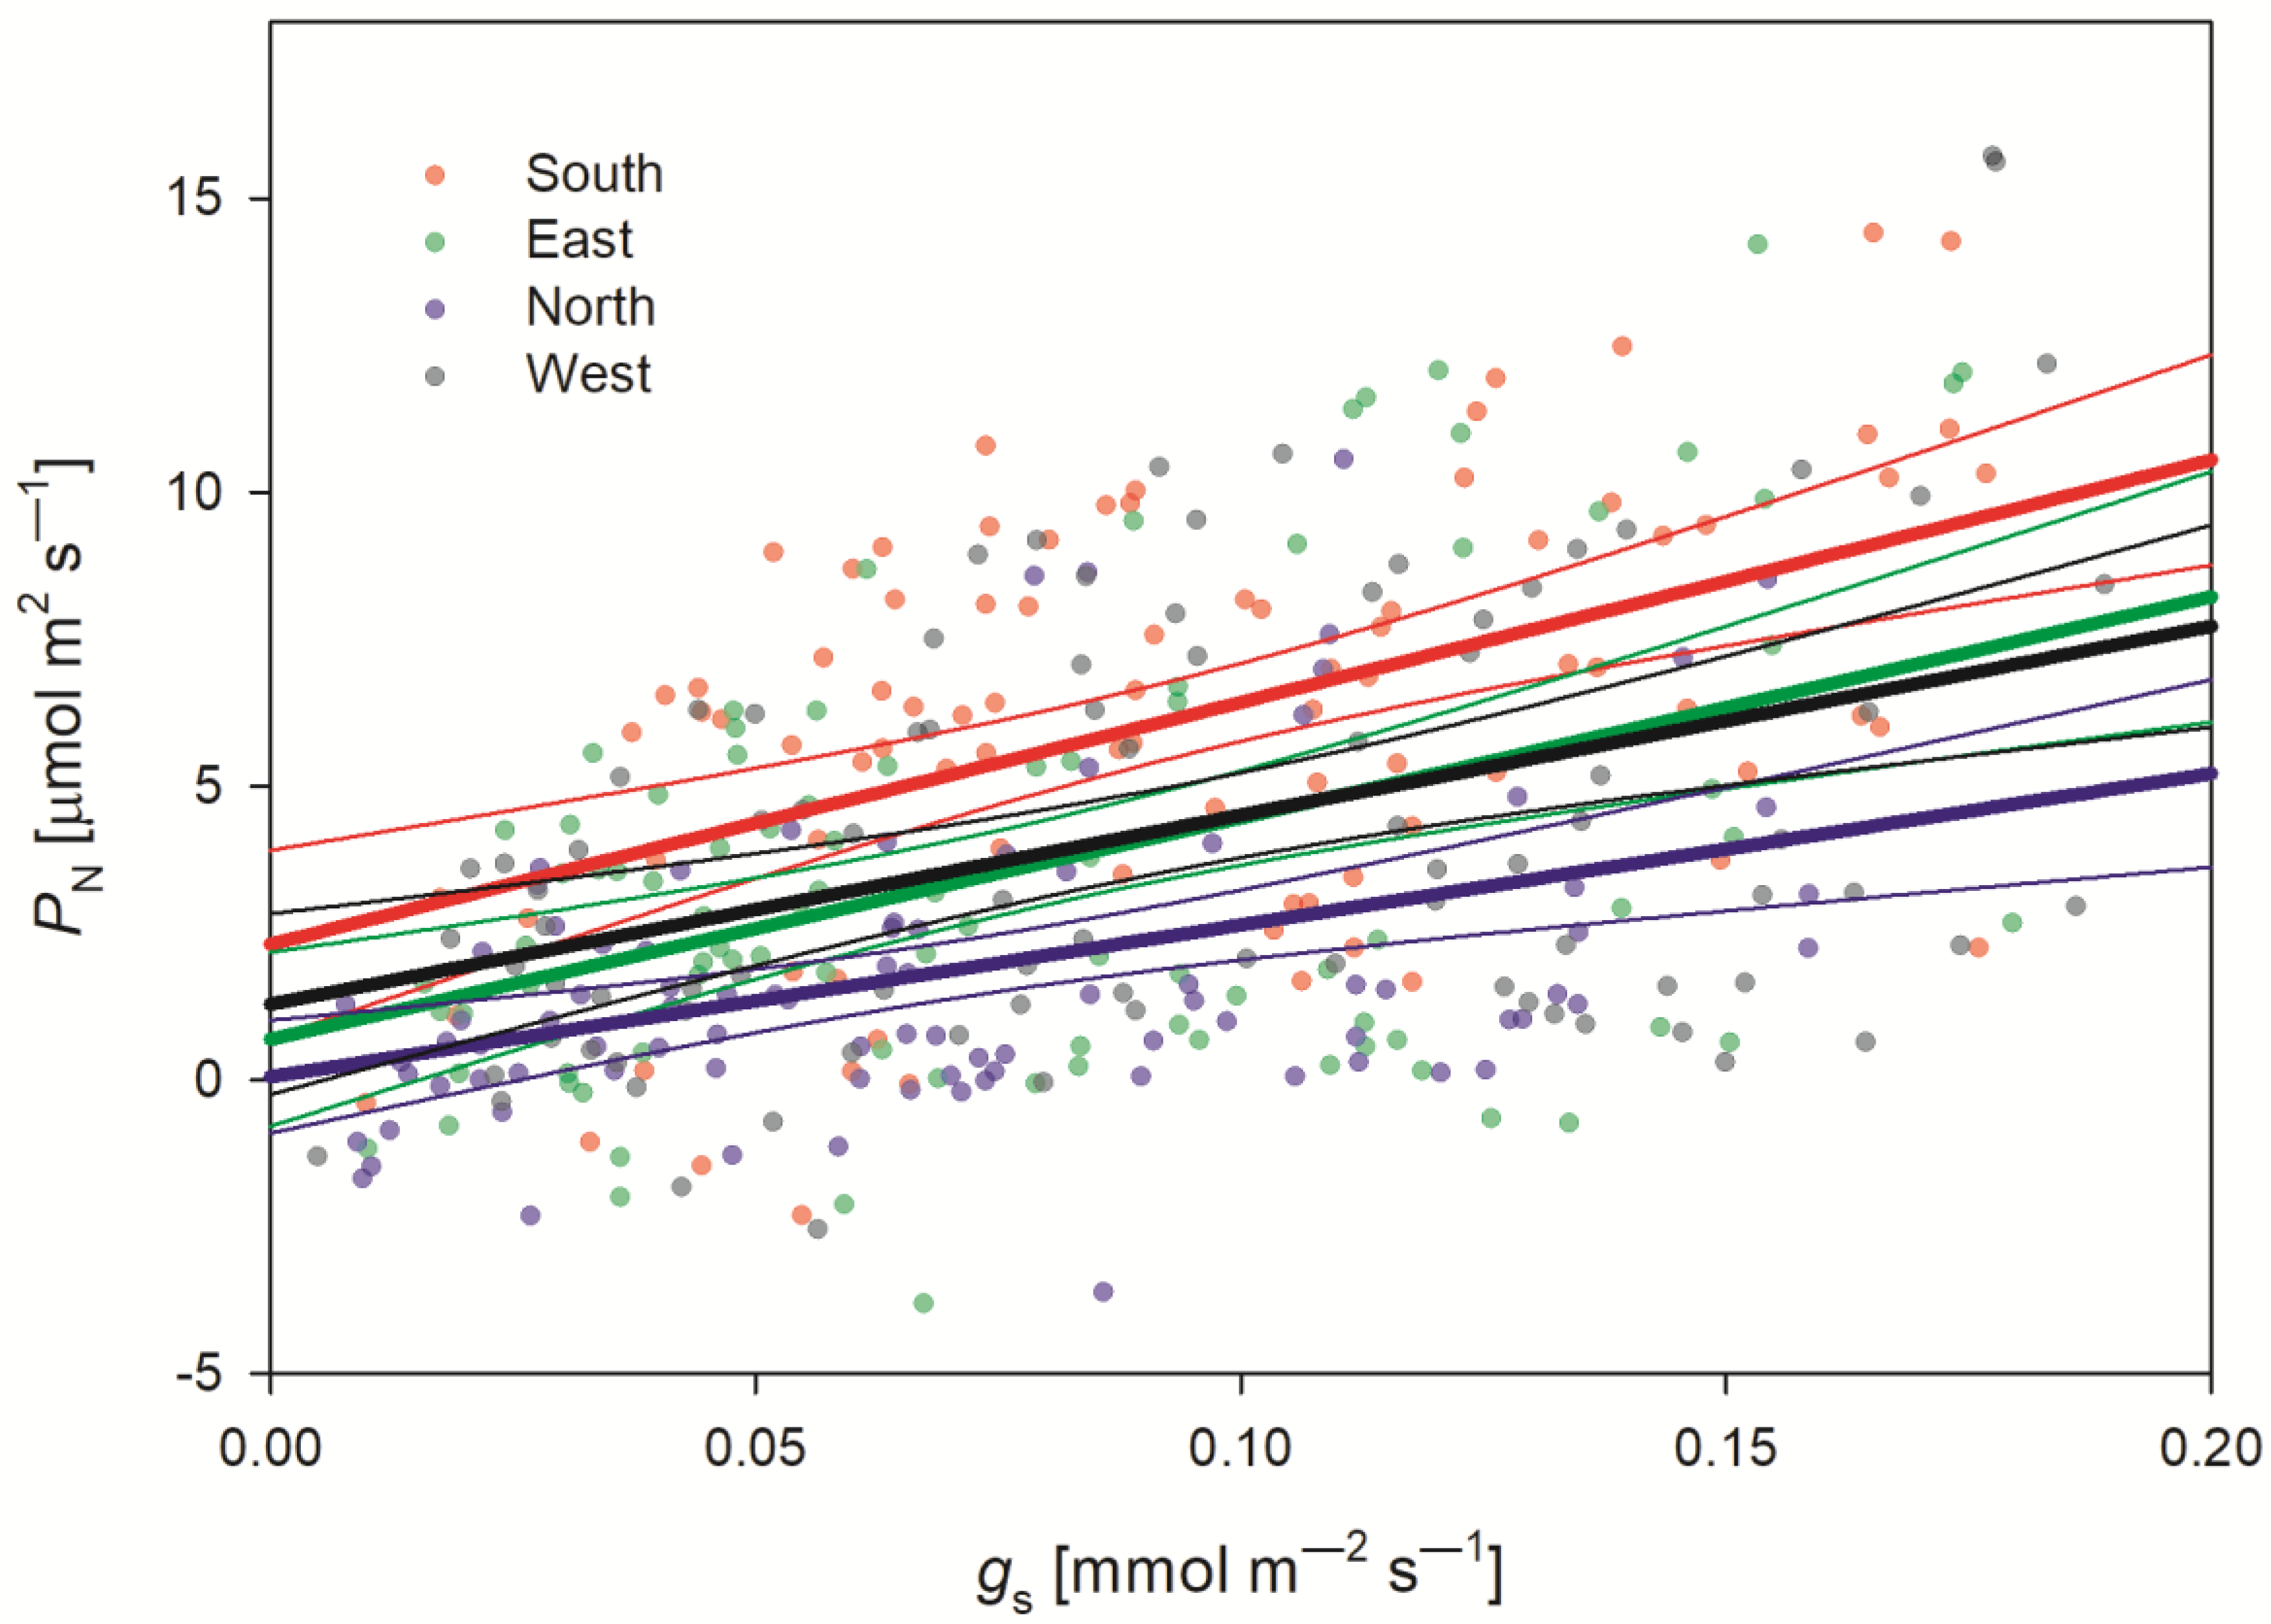
3.3.2. Diurnal Trends in Photosynthesis and Photosynthetically Active Radiation
3.3.3. Water Use Efficiency
3.3.4. Whole-Tree Photosynthesis
4. Discussion
5. Conclusions
Author Contributions
Funding
Data Availability Statement
Acknowledgments
Conflicts of Interest
References
- Ryu, Y.; Berry, J.A.; Baldocchi, D.D. What Is Global Photosynthesis? History, Uncertainties and Opportunities. Remote Sens. Environ. 2019, 223, 95–114. [Google Scholar] [CrossRef]
- Baslam, M.; Mitsui, T.; Hodges, M.; Priesack, E.; Herritt, M.T.; Aranjuelo, I.; Sanz-Sáez, Á. Photosynthesis in a Changing Global Climate: Scaling Up and Scaling Down in Crops. Front. Plant Sci. 2020, 11, 882. [Google Scholar] [CrossRef]
- De Pury, D.G.G.; Farquhar, G.D. Simple Scaling of Photosynthesis from Leaves to Canopies without the Errors of Big-leaf Models. Plant Cell Environ. 1997, 20, 537–557. [Google Scholar] [CrossRef]
- Strigul, N. Individual-Based Models and Scaling Methods for Ecological Forestry: Implications of Tree Phenotypic Plasticity. In Sustainable Forest Management; InTech: Rijeka, Croatia, 2012; pp. 359–384. [Google Scholar]
- Parker, G.G.; Harmon, M.E.; Lefsky, M.A.; Chen, J.; Pelt, R.V.; Weis, S.B.; Thomas, S.C.; Winner, W.E.; Shaw, D.C.; Frankling, J.F. Three-Dimensional Structure of an Old-Growth Pseudotsuga-Tsuga Canopy and Its Implications for Radiation Balance, Microclimate, and Gas Exchange. Ecosystems 2004, 7, 440–453. [Google Scholar] [CrossRef]
- Yang, W.-W.; Chen, X.-L.; Saudreau, M.; Zhang, X.-Y.; Zhang, M.-R.; Liu, H.-K.; Costes, E.; Han, M.-Y. Canopy Structure and Light Interception Partitioning among Shoots Estimated from Virtual Trees: Comparison between Apple Cultivars Grown on Different Interstocks on the Chinese Loess Plateau. Trees 2016, 30, 1723–1734. [Google Scholar] [CrossRef]
- Yang, W.; Ma, X.; Ma, D.; Shi, J.; Hussain, S.; Han, M.; Costes, E.; Zhang, D. Modeling Canopy Photosynthesis and Light Interception Partitioning among Shoots in Bi-Axis and Single-Axis Apple Trees (Malus Domestica Borkh). Trees 2021, 35, 845–861. [Google Scholar] [CrossRef]
- Escribano-Rocafort, A.G.; Ventre-Lespiaucq, A.B.; Granado-Yela, C.; Rubio De Casas, R.; Delgado, J.A.; Balaguer, L. The Expression of Light-Related Leaf Functional Traits Depends on the Location of Individual Leaves within the Crown of Isolated Olea Europaea Trees. Ann. Bot. 2016, 117, 643–651. [Google Scholar] [CrossRef]
- Granado-Yela, C.; García-Verdugo, C.; Carrillo, K.; Rubio De Casas, R.; Kleczkowski, L.A.; Balaguer, L. Temporal Matching among Diurnal Photosynthetic Patterns within the Crown of the Evergreen Sclerophyll Olea europaea L. Plant Cell Environ. 2011, 34, 800–810. [Google Scholar] [CrossRef]
- Sinoquet, H.; Le Roux, X.; Adam, B.; Ameglio, T.; Daudet, F.A. RATP: A Model for Simulating the Spatial Distribution of Radiation Absorption, Transpiration and Photosynthesis within Canopies: Application to an Isolated Tree Crown. Plant Cell Environ. 2001, 24, 395–406. [Google Scholar] [CrossRef]
- Peltier, J.-P.; Marigo, G. Drought Adaptation in Fraxinus Excelsior L.: Physiological Basis of the Elastic Adjustment. J. Plant Physiol. 1999, 154, 529–535. [Google Scholar] [CrossRef]
- Einhorn, K.S. Growth and Photosynthesis of Ash Fraxinus Excelsior and Beech Fagus Sylvatica Seedlings in Response to a Light Gradient Following Natural Gap Formation. Ecol. Bull. 2007, 52, 147–165. [Google Scholar]
- Van Der Tol, C.; Dolman, A.J.; Waterloo, M.J.; Raspor, K. Topography Induced Spatial Variations in Diurnal Cycles of Assimilation and Latent Heat of Mediterranean Forest. Biogeosciences 2007, 4, 137–154. [Google Scholar] [CrossRef]
- Hommel, R.; Siegwolf, R.; Saurer, M.; Farquhar, G.D.; Kayler, Z.; Ferrio, J.P.; Gessler, A. Drought Response of Mesophyll Conductance in Forest Understory Species—Impacts on Water-Use Efficiency and Interactions with Leaf Water Movement. Physiol. Plant. 2014, 152, 98–114. [Google Scholar] [CrossRef]
- Zhou, S.; Medlyn, B.; Sabaté, S.; Sperlich, D.; Prentice, I.C.; Whitehead, D. Short-Term Water Stress Impacts on Stomatal, Mesophyll and Biochemical Limitations to Photosynthesis Differ Consistently among Tree Species from Contrasting Climates. Tree Physiol. 2014, 34, 1035–1046. [Google Scholar] [CrossRef]
- Li, S.; Feifel, M.; Karimi, Z.; Schuldt, B.; Choat, B.; Jansen, S. Leaf Gas Exchange Performance and the Lethal Water Potential of Five European Species during Drought. Tree Physiol. 2015, 36, tpv117. [Google Scholar] [CrossRef]
- Premachandra, G.S.; Chaney, W.R.; Holt, H.A. Gas Exchange and Water Relations of Fraxinus Americana Affected by Flurprimidol. Tree Physiol. 1997, 17, 97–103. [Google Scholar] [CrossRef]
- Zhang, S.Y.; Zhang, G.C.; Liu, X.; Xia, J.B. The Responses of Photosynthetic Rate and Stomatal Conductance of Fraxinus Rhynchophylla to Differences in CO2 Concentration and Soil Moisture. Photosynthetica 2013, 51, 359–369. [Google Scholar] [CrossRef]
- Flower, C.; Lynch, D.; Knight, K.; Gonzalez-Meler, M. Biotic and Abiotic Drivers of Sap Flux in Mature Green Ash Trees (Fraxinus pennsylvanica) Experiencing Varying Levels of Emerald Ash Borer (Agrilus planipennis) Infestation. Forests 2018, 9, 301. [Google Scholar] [CrossRef]
- Lichtenthaler, H.K.; Babani, F.; Navrátil, M.; Buschmann, C. Chlorophyll Fluorescence Kinetics, Photosynthetic Activity, and Pigment Composition of Blue-Shade and Half-Shade Leaves as Compared to Sun and Shade Leaves of Different Trees. Photosynth. Res. 2013, 117, 355–366. [Google Scholar] [CrossRef]
- Fini, A.; Guidi, L.; Giordano, C.; Baratto, M.C.; Ferrini, F.; Brunetti, C.; Calamai, L.; Tattini, M. Salinity Stress Constrains Photosynthesis in Fraxinus Ornus More When Growing in Partial Shading than in Full Sunlight: Consequences for the Antioxidant Defence System. Ann. Bot. 2014, 114, 525–538. [Google Scholar] [CrossRef]
- Rubio De Casas, R.; Vargas, P.; Pérez-Corona, E.; Manrique, E.; Quintana, J.R.; García-Verdugo, C.; Balaguer, L. Field Patterns of Leaf Plasticity in Adults of the Long-Lived Evergreen Quercus Coccifera. Ann. Bot. 2007, 100, 325–334. [Google Scholar] [CrossRef] [PubMed]
- Wyka, T.P.; Oleksyn, J.; Żytkowiak, R.; Karolewski, P.; Jagodziński, A.M.; Reich, P.B. Responses of Leaf Structure and Photosynthetic Properties to Intra-Canopy Light Gradients: A Common Garden Test with Four Broadleaf Deciduous Angiosperm and Seven Evergreen Conifer Tree Species. Oecologia 2012, 170, 11–24. [Google Scholar] [CrossRef] [PubMed]
- Valladares, F.; Niinemets, Ü. Shade Tolerance, a Key Plant Feature of Complex Nature and Consequences. Annu. Rev. Ecol. Evol. Syst. 2008, 39, 237–257. [Google Scholar] [CrossRef]
- Kalapos, T.; Csontos, P. Variation in Leaf Structure and Function of the Mediterranean Tree Fraxinus Ornus L. Growing in Ecologically Contrasting Habitats at the Margin of Its Range. Plant Biosyst. Int. J. Deal. Asp. Plant Biol. 2003, 137, 73–82. [Google Scholar] [CrossRef]
- Bartlett, G.A.; Remphrey, W.R. The Effect of Reduced Quantities of Photosynthetically Active Radiation on Fraxinus Pennsylvanica Growth and Architecture. Can. J. Bot. 1998, 76, 1359–1365. [Google Scholar] [CrossRef]
- Niinemets, Ü. A Review of Light Interception in Plant Stands from Leaf to Canopy in Different Plant Functional Types and in Species with Varying Shade Tolerance. Ecol. Res. 2010, 25, 693–714. [Google Scholar] [CrossRef]
- Monteith, J.L.; Unsworth, M.H. Principles of Environmental Physics; Academic Press: Kidlington, UK, 2013; ISBN 9780123869104. [Google Scholar]
- IUSS Working Group WRB. World Reference Base for Soil Resources 2014. International Soil Classification System for Naming Soils and Creating Legends for Soil Maps; FAO: Rome, Italy, 2014; Available online: https://www.fao.org/3/i3794en/I3794en.pdf (accessed on 10 March 2024).
- Majewski, R.S.; Valenta, J.; Tábořík, P.; Weger, J.; Kučera, A.; Patočka, Z.; Čermák, J. Geophysical Imaging of Tree Root Absorption and Conduction Zones under Field Conditions: A Comparison of Common Geoelectrical Methods. Plant Soil 2022, 481, 447–473. [Google Scholar] [CrossRef]
- Smyth, G.K. Numerical Integration; Wiley: Hoboken, NJ, USA, 1998; pp. 3088–3095. [Google Scholar]
- Stohr, A.; Losch, R. Xylem Sap Flow and Drought Stress of Fraxinus Excelsior Saplings. Tree Physiol. 2004, 24, 169–180. [Google Scholar] [CrossRef]
- Koike, T.; Kitaoka, S.; Ichie, T.; Lei, T.T.; Kitao, M. Photosynthetic Characteristics of Mixed Deciduous-Broadleaf Forests from Leaf to Stand. Glob. Environ. Chang. Ocean Land Tokyo Terrapub 2004, 453–472. [Google Scholar]
- Pathre, U.; Sinha, A.K.; Shirke, P.A.; Sane, P.V. Factors Determining the Midday Depression of Photosynthesis in Trees under Monsoon Climate. Trees 1998, 12, 472. [Google Scholar] [CrossRef]
- Kamakura, M.; Kosugi, Y.; Takanashi, S.; Matsumoto, K.; Okumura, M.; Philip, E. Patchy Stomatal Behavior during Midday Depression of Leaf CO2 Exchange in Tropical Trees. Tree Physiol. 2011, 31, 160–168. [Google Scholar] [CrossRef] [PubMed]
- Muraoka, H.; Tang, Y.; Terashima, I.; Koizumi, H.; Washitani, I. Contributions of Diffusional Limitation, Photoinhibition and Photorespiration to Midday Depression of Photosynthesis in Arisaema Heterophyllum in Natural High Light. Plant Cell Environ. 2000, 23, 235–250. [Google Scholar] [CrossRef]
- Zhang, Y.; Meinzer, F.C.; Qi, J.; Goldstein, G.; Cao, K. Midday Stomatal Conductance Is More Related to Stem Rather than Leaf Water Status in Subtropical Deciduous and Evergreen Broadleaf Trees. Plant Cell Environ. 2013, 36, 149–158. [Google Scholar] [CrossRef] [PubMed]
- Grassi, G.; Ripullone, F.; Borghetti, M.; Raddi, S.; Magnani, F. Contribution of Diffusional and Non-Diffusional Limitations to Midday Depression of Photosynthesis in Arbutus unedo L. Trees 2009, 23, 1149–1161. [Google Scholar] [CrossRef]
- Iio, A.; Fukasawa, H.; Nose, Y.; Kato, S.; Kakubari, Y. Vertical, Horizontal and Azimuthal Variations in Leaf Photosynthetic Characteristics within a Fagus Crenata Crown in Relation to Light Acclimation. Tree Physiol. 2005, 25, 533–544. [Google Scholar] [CrossRef] [PubMed]
- Le Roux, X.; Bariac, T.; Sinoquet, H.; Genty, B.; Piel, C.; Mariotti, A.; Girardin, C.; Richard, P. Spatial Distribution of Leaf Water-use Efficiency and Carbon Isotope Discrimination within an Isolated Tree Crown. Plant Cell Environ. 2001, 24, 1021–1032. [Google Scholar] [CrossRef]
- Gregoriou, K.; Pontikis, K.; Vemmos, S. Effects of Reduced Irradiance on Leaf Morphology, Photosynthetic Capacity, and Fruit Yield in Olive (Olea europaea L.). Photosynthetica 2007, 45, 172–181. [Google Scholar] [CrossRef]
- Flexas, J.; Bota, J.; Loreto, F.; Cornic, G.; Sharkey, T.D. Diffusive and Metabolic Limitations to Photosynthesis under Drought and Salinity in C 3 Plants. Plant Biol. 2004, 6, 269–279. [Google Scholar] [CrossRef]
- Flexas, J.; Barbour, M.M.; Brendel, O.; Cabrera, H.M.; Carriquí, M.; Díaz-Espejo, A.; Douthe, C.; Dreyer, E.; Ferrio, J.P.; Gago, J.; et al. Mesophyll Diffusion Conductance to CO2: An Unappreciated Central Player in Photosynthesis. Plant Sci. 2012, 193–194, 70–84. [Google Scholar] [CrossRef]
- Xiong, D.; Douthe, C.; Flexas, J. Differential Coordination of Stomatal Conductance, Mesophyll Conductance, and Leaf Hydraulic Conductance in Response to Changing Light across Species. Plant Cell Environ. 2018, 41, 436–450. [Google Scholar] [CrossRef]
- Ni, B.-R.; Pallardy, S.G. Response of Gas Exchange to Water Stress in Seedlings of Woody Angiosperms. Tree Physiol. 1991, 8, 1–9. [Google Scholar] [CrossRef] [PubMed]
- Yu, H.; Zhou, G.; Lv, X.; He, Q.; Zhou, M. Stomatal Limitation Is Able to Modulate Leaf Coloration Onset of Temperate Deciduous Tree. Forests 2022, 13, 1099. [Google Scholar] [CrossRef]
- Kinoshita, T.; Kume, A.; Hanba, Y.T. Seasonal Variations in Photosynthetic Functions of the Urban Landscape Tree Species Gingko Biloba: Photoperiod Is a Key Trait. Trees 2021, 35, 273–285. [Google Scholar] [CrossRef]
- Escribano-Rocafort, A.G.; Ventre-Lespiaucq, A.B.; Granado-Yela, C.; Rubio De Casas, R.; Delgado, J.A.; Escudero, A.; Balaguer, L. Intraindividual Variation in Light-Related Functional Traits: Magnitude and Structure of Leaf Trait Variability across Global Scales in Olea Europaea Trees. Trees 2017, 31, 1505–1517. [Google Scholar] [CrossRef]
- Gebauer, R.; Volarik, D.; Urban, J.; Borja, I.; Nagy, N.E.; Eldhuset, T.D.; Krokene, P. Effect of Thinning on Anatomical Adaptations of Norway Spruce Needles. Tree Physiol. 2011, 31, 1103–1113. [Google Scholar] [CrossRef] [PubMed]
- Niinemets, Ü. Research Review. Components of Leaf Dry Mass per Area—Thickness and Density—Alter Leaf Photosynthetic Capacity in Reverse Directions in Woody Plants. New Phytol. 1999, 144, 35–47. [Google Scholar] [CrossRef]
- Nardini, A. Hard and Tough: The Coordination between Leaf Mechanical Resistance and Drought Tolerance. Flora 2022, 288, 152023. [Google Scholar] [CrossRef]
- Ishida, A.; Toma, T. Marjenah Leaf Gas Exchange and Cholorphyll Fluorescence in Relation to Leaf Angle, Azimuth, and Canopy Position in the Tropical Pioneer Tree, Macaranga Conifera. Tree Physiol. 1999, 19, 117–124. [Google Scholar] [CrossRef]
- Šenfeldr, M.; Urban, J.; Maděra, P.; Kučera, J. Redistribution of Water via Layering Branches between Connected Parent and Daughter Trees in Norway Spruce Clonal Groups. Trees Struct. Funct. 2015, 30, 5–17. [Google Scholar] [CrossRef]
- Wang, H.; Qin, J.; Hu, Y.; Guo, C. Asymmetric Growth of Belowground and Aboveground Tree Organs and Their Architectural Relationships: A Review. Can. J. For. Res. 2023, 53, 315–327. [Google Scholar] [CrossRef]
- Dong, T.; Duan, B.; Korpelainen, H.; Niinemets, Ü.; Li, C. Asymmetric Pruning Reveals How Organ Connectivity Alters the Functional Balance between Leaves and Roots of Chinese Fir. J. Exp. Bot. 2019, 70, 1941–1953. [Google Scholar] [CrossRef] [PubMed]


| South | East | North | West | |||||||||
|---|---|---|---|---|---|---|---|---|---|---|---|---|
| Coeff. | ±SE | p-Value | Coeff. | ±SE | p-Value | Coeff. | ±SE | p-Value | Coeff. | ±SE | p-Value | |
| Rd | −3.08 | 1.81 | 0.09 | −2.06 | 1.31 | 0.12 | −2.68 | 1.74 | 0.13 | −2.80 | 1.67 | 0.10 |
| PN max | 14.47 | 1.57 | <0.0001 | 11.85 | 1.10 | <0.0001 | 9.03 | 1.50 | <0.0001 | 15.29 | 1.40 | <0.0001 |
| KI | 159.58 | 55.96 | 0.01 | 176.34 | 75.27 | 0.02 | 105.98 | 63.88 | 0.10 | 182.43 | 73.81 | 0.02 |
| Measurement | South | East | North | West |
|---|---|---|---|---|
| Spring | 8556 ± 125 | 2009 ± 26 | 3081 ± 74 | 2699 ± 41 |
| Summer | 7772 ± 43 | 1531 ± 12 | 1096 ± 36 | 1525 ± 9 |
| Autumn | 524 ± 22 | 394 ± 11 | −369 ± 9 | −84 ± 10 |
Disclaimer/Publisher’s Note: The statements, opinions and data contained in all publications are solely those of the individual author(s) and contributor(s) and not of MDPI and/or the editor(s). MDPI and/or the editor(s) disclaim responsibility for any injury to people or property resulting from any ideas, methods, instructions or products referred to in the content. |
© 2024 by the authors. Licensee MDPI, Basel, Switzerland. This article is an open access article distributed under the terms and conditions of the Creative Commons Attribution (CC BY) license (https://creativecommons.org/licenses/by/4.0/).
Share and Cite
Majewski, R.S.; Barták, M.; Weger, J.; Čermák, J.; Urban, J. Seasonal Photosynthetic Activity in the Crown Compartments of European Ash (Fraxinus excelsior). Forests 2024, 15, 699. https://doi.org/10.3390/f15040699
Majewski RS, Barták M, Weger J, Čermák J, Urban J. Seasonal Photosynthetic Activity in the Crown Compartments of European Ash (Fraxinus excelsior). Forests. 2024; 15(4):699. https://doi.org/10.3390/f15040699
Chicago/Turabian StyleMajewski, Robert Stanislaw, Miloš Barták, Jan Weger, Jan Čermák, and Josef Urban. 2024. "Seasonal Photosynthetic Activity in the Crown Compartments of European Ash (Fraxinus excelsior)" Forests 15, no. 4: 699. https://doi.org/10.3390/f15040699