Article

Effects of Planting Position, Seedling Size, and Organic Nitrogen Fertilization on the Establishment of Scots Pine (Pinus sylvestris L.) and Norway Spruce (Picea abies (L.) Karst) Seedlings

1
Umeå Plant Science Centre, Department of Forest Genetics and Plant Physiology, Swedish University of Agricultural Sciences, 90183 Umeå, Sweden
2
Skogforsk (The Forestry Research Institute of Sweden), 91821 Sävar, Sweden
*
Author to whom correspondence should be addressed.
Forests 2024, 15(4), 703; https://doi.org/10.3390/f15040703
Submission received: 27 February 2024 / Revised: 5 April 2024 / Accepted: 12 April 2024 / Published: 16 April 2024
(This article belongs to the Special Issue Planted Forests: A Path towards Sustainable Development)

Abstract

:
The forest regeneration phase in Sweden commonly involves mechanical soil preparation followed by the planting of Scots pine (Pinus sylvestris L.) or Norway spruce (Picea abies (L.) Karst) seedlings. The prepared soil offers planting positions with different properties, including reduced damage by pine weevils (Hylobius abietis L.). Nitrogen fertilization can be applied at the time of planting to aid establishment of the seedlings. In this study, we compared the effects of different planting positions, organic nitrogen fertilization, and different seedling sizes on the early survival and growth of Scots pine and Norway spruce seedlings. The main planting positions were capped mound, hinge, and mineral soil. Seedlings planted close to organic material were categorized as being in “low-quality positions”, since proximity to organic material increases pine weevil attraction. Higher mortality rates related to pine weevil damage were recorded for the seedlings planted in the low-quality positions, regardless of seedling size or N fertilization. Pine weevil attack rates increased with increasing seedling size. Growth was, in general, lowest in the mineral soil positions. The effect of organic N fertilization on growth was positive for the spruce regardless of the planting position or seedling size, while it depended on the planting position and seedling size for the pine, indicating that the effects of organic N fertilization depend on the seedling species, seedling size, and planting position.

1. Introduction

The planting of Scots pine (Pinus sylvestris L.) and Norway spruce (Picea abies (L.) Karst) seedlings is currently the most common regeneration practice undertaken in Swedish production forests [1]. The majority of planted conifer seedlings are grown in nurseries in container systems of different sizes and types. The choice of seedling size depends on different priorities decided by managers. A newly planted seedling is vulnerable to both water stress and nutrient stress since its root soil contact is limited [2]. Regardless of size, seedlings with a low shoot–root ratio establish faster and tolerate drought stress better than seedlings with a higher shoot–root ratio, due to the increased chance of the roots exploring the soil and acquiring water and soil nutrients for the shoots [3,4]. Small seedlings are cheaper to produce and may have a lower initial shoot–root ratio than larger seedlings, but can be more sensitive to competition from other vegetation and to damage compared to larger seedlings [5,6]. On fertile sites with relatively high competition from ground vegetation, larger seedlings are at an advantage [5]. The regeneration success of seedlings of all sizes is, in general, greatly improved by mechanical soil preparation, which is carried out in approximately 85% of regeneration areas prior to planting [7]. Mechanical soil preparation includes the removal of the organic top layer, which provides a temporary decrease in competition from ground vegetation, as well as exposure and loosening of the mineral soil beneath. The exposed mineral soil warms faster when the organic layer is removed and loosening increases soil permeability [8,9,10]. Increased soil permeability enhances seedling establishment by reducing the physical resistance to root penetration, allowing an additional increase in temperature, which is beneficial for root growth, and increasing nitrogen mineralization [8,9,10,11]. Furthermore, pine weevils (Hylobius abietis L.), which are a major threat to planted seedlings in large parts of Sweden [12,13], tend to move faster and in straighter lines across exposed areas of flat mineral soil [14]. Hence, the mineral soil cover in the area surrounding a seedling decreases its susceptibility to damage by pine weevils [13,15,16,17,18,19,20,21,22]. Studies have also revealed that the threat of lethal pine weevil damage is highest before the seedling reaches a stem basal diameter of 10–12 mm [18,19].
The most common mechanical soil preparation method is disc-trenching (60%), followed by mounding (30%) and patch scarification (10%) [
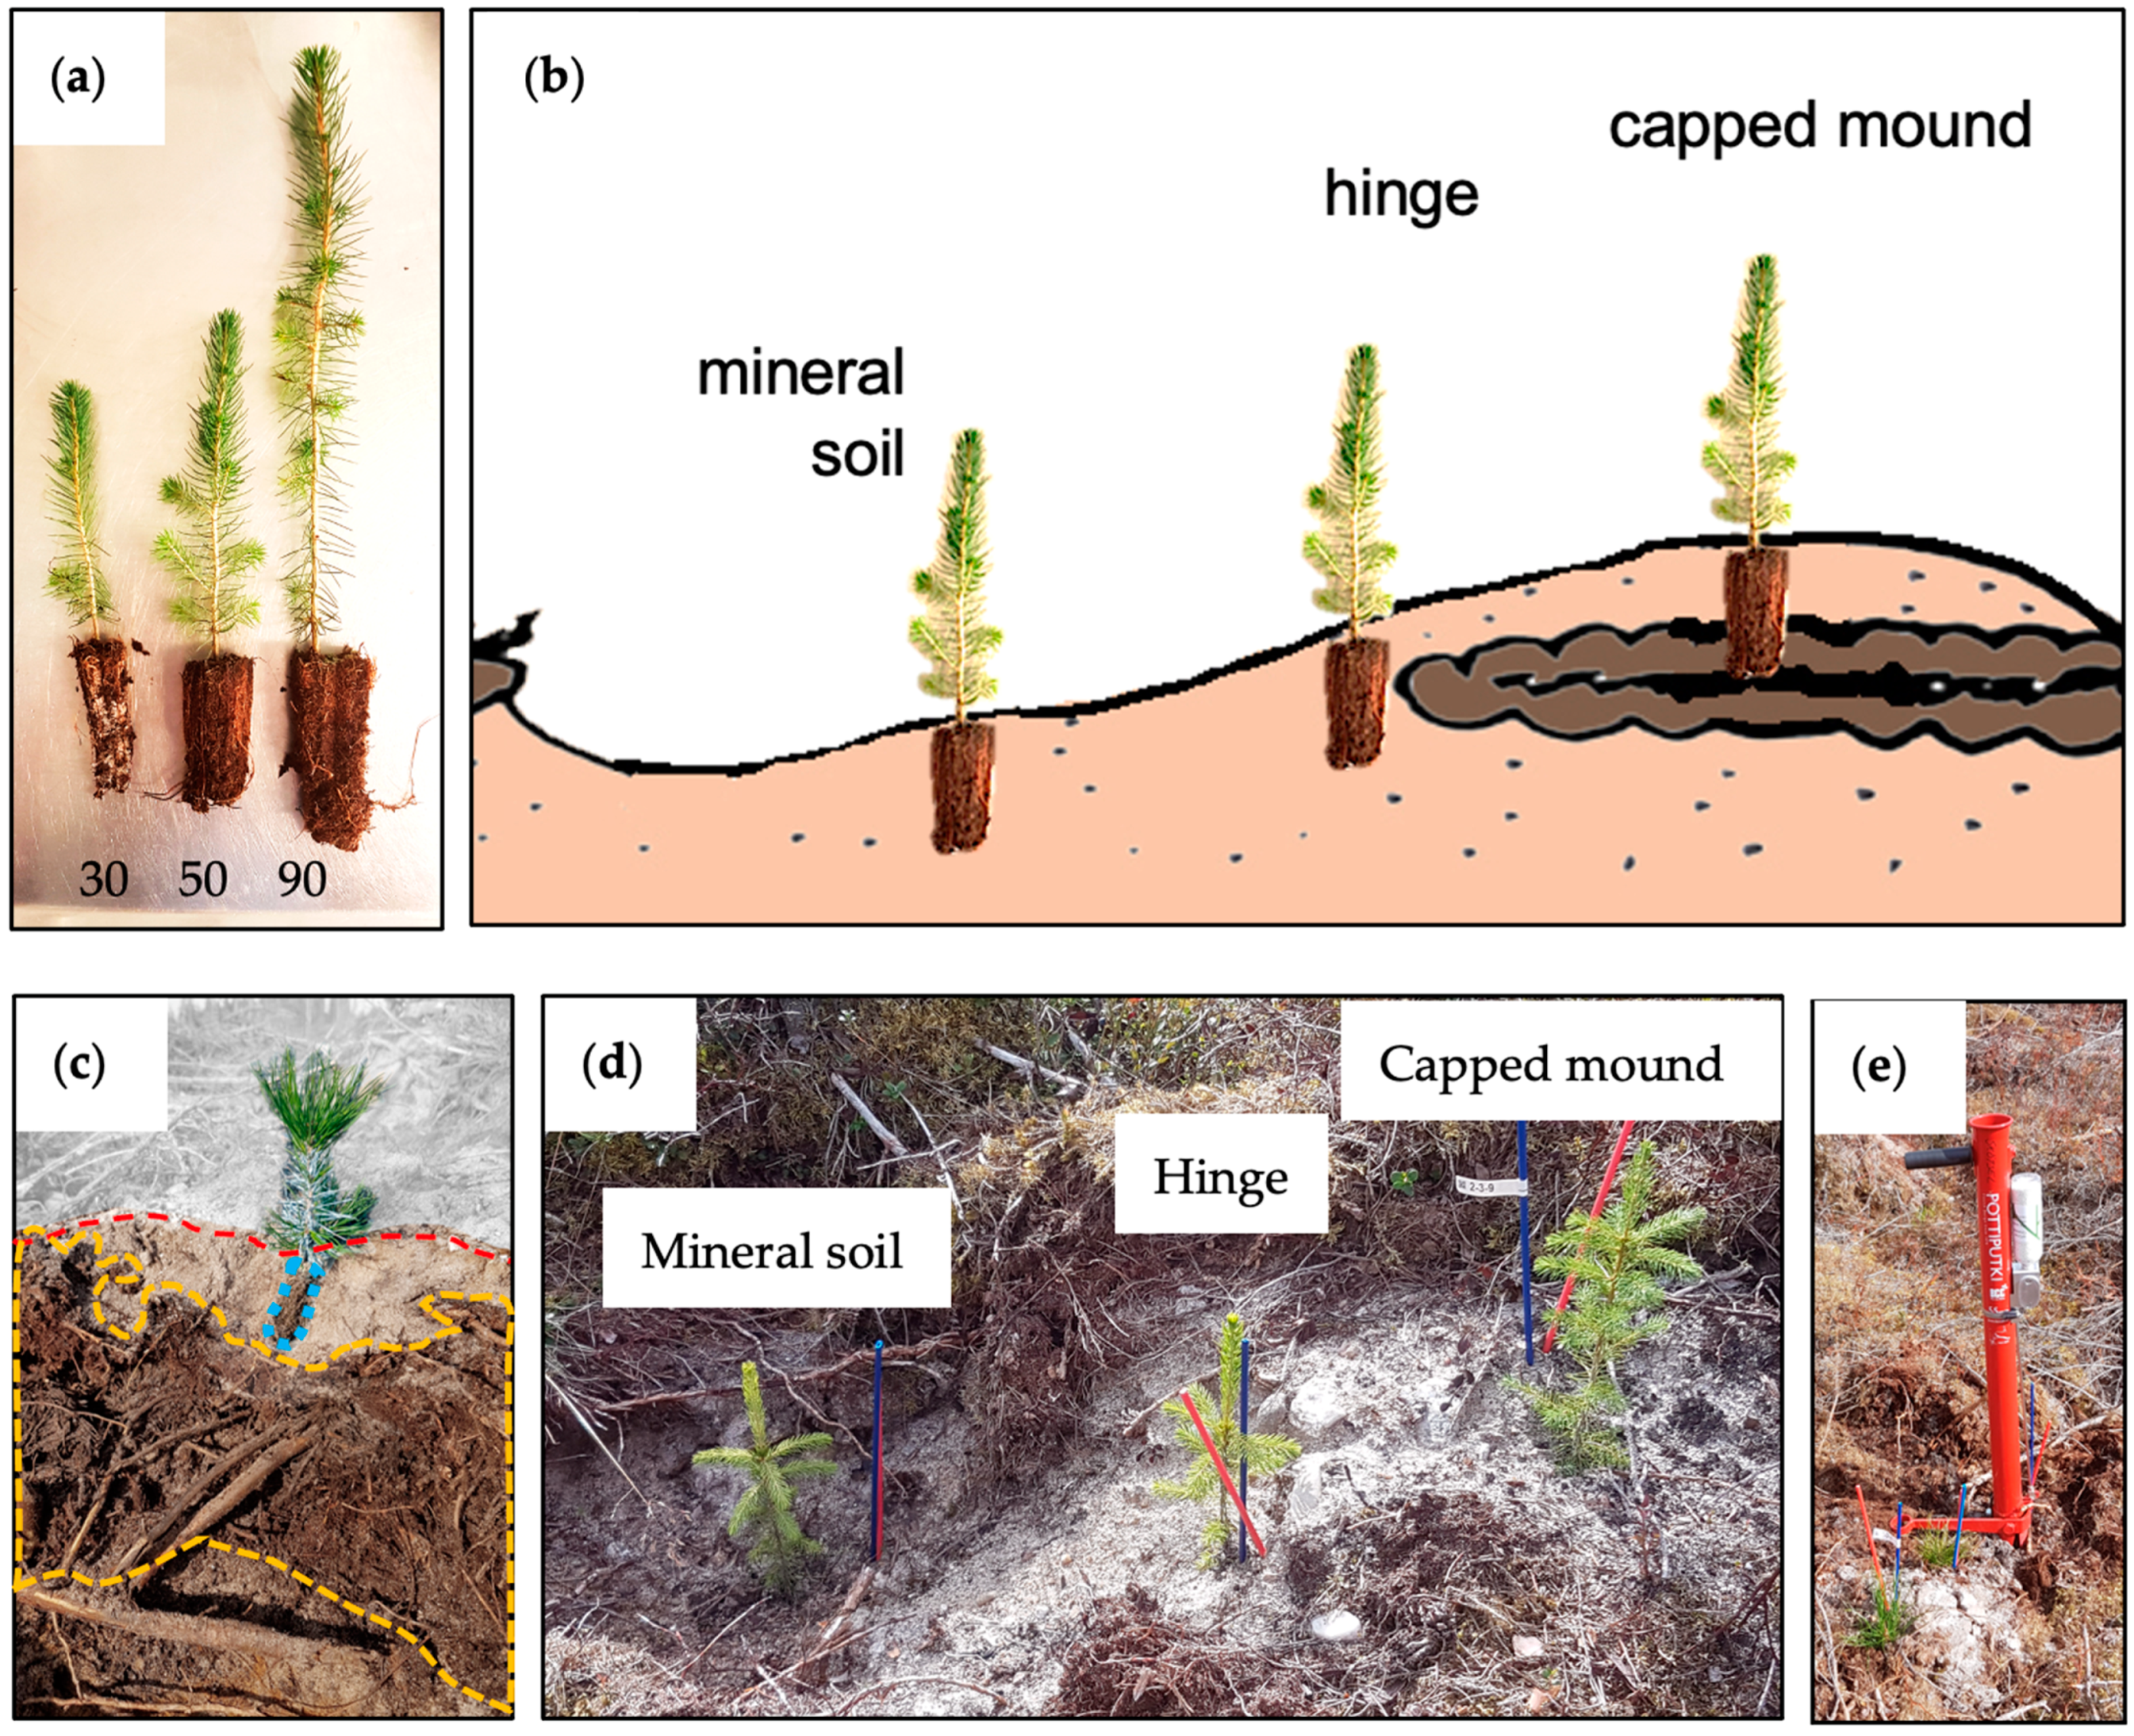
23]. Disc-trenching results in continuous furrows where mineral soil is exposed, with an adjacent ridge of the removed soil. The ridges have similar attributes to the capped mounds created during mounding: turning the soil results in a double layer of organic material covered by mineral soil. These methods offer different choices of planting positions, in general with trade-offs between nutrient and water availability. The exposed mineral soil areas adjacent to the capped mounds provide positions that have a continuous connection to soil moisture via capillary water flow, but the mineral soil in Nordic conditions is generally very poor in nutrients. The organic material within the capped mounds provides a source of nutrients for the planted seedling and the elevated position results in an increase in soil temperature, increasing the decomposition of organic material and giving the seedlings a growth advantage over seedlings planted in exposed mineral soil positions [8,9,10,15,24] (a graphical representation of the planting positions is shown in Figure 1b,d). On moist sites, the elevated spots provided by the capped mounds also provide better soil aeration and, thus, a decreased risk of oxygen deficiency in the roots [9,11]. However, capped mounds are susceptible to drought because the capillary flow of moisture from below is interrupted by the organic material within [9]. It is, therefore, important to consider the site conditions carefully before choosing the preferred planting position.
Mounds should ideally be capped by mineral soil, both for the purpose of weighing the organic material down to ensure good contact with the underlying ground and to decrease the risk of attacks by pine weevils. However, there is high variability in the quality of capped mounds depending on site conditions and the way the soil preparation is carried out. Even within a single site, there is a great variability in the occurrence of obstacles such as rocks, stumps, residual logs, ground vegetation density, etc. This heterogeneity prevents any mechanical soil preparation method from creating homogenous planting positions [10,25]. Each seedling should ideally be planted deep enough in the capped mound for the root substrate to penetrate the organic layers in order to ensure the availability of capillary water (see the capped-mound illustration in Figure 1b). However, it is often difficult to plant the seedling deep enough and it is not possible to assess the interior of each capped mound to ensure the optimal seedling root substrate position (see the example in Figure 1d). With respect to mineral soil positions, the deepest parts of patches/depressions should be avoided since these can become filled with water as a result of precipitation and melting snow. Planting in depressions can thus increase the risk of oxygen deficiency for the seedling roots, especially on flat areas and in fine-textured soil with low permeability. However, on slopes with permeable soil, such as gravel and sand, the risk of waterlogging is minimal. An intermediate choice is to plant the seedlings in the mineral soil close to the capped mound, i.e., the “hinge” of the capped mound, where the seedlings will have ready access to nutrients from the decomposing material in the adjacent mound and, simultaneously, access to capillary water from the mineral soil. An additional option is to plant in positions in the exposed mineral soil further away from the mound and add slow-release fertilizer at the time of planting, to compensate for the low nutrient status, while the position in mineral soil simultaneously ensures water availability from below. An organic slow-release nitrogen fertilizer composed of arginine–phosphate (AP) is available and used commercially for this purpose.
In this case study, we examined the effects of planting position, seedling size, and the addition of AP, as well as the potential interactions between these factors, on the establishment and early growth of Scots pine and Norway spruce seedlings. We hypothesized that (1) survival would be affected by planting position, (2) larger seedlings would attract a higher frequency of pine weevil damage, (3) seedlings of all sizes would grow best in the capped-mound positions, followed by the hinge positions and lastly the mineral soil positions, and (4) the addition of AP would improve growth so that seedlings planted in the mineral soil and hinge positions would achieve similar growth to the seedlings planted in the mound positions.

2. Materials and Methods

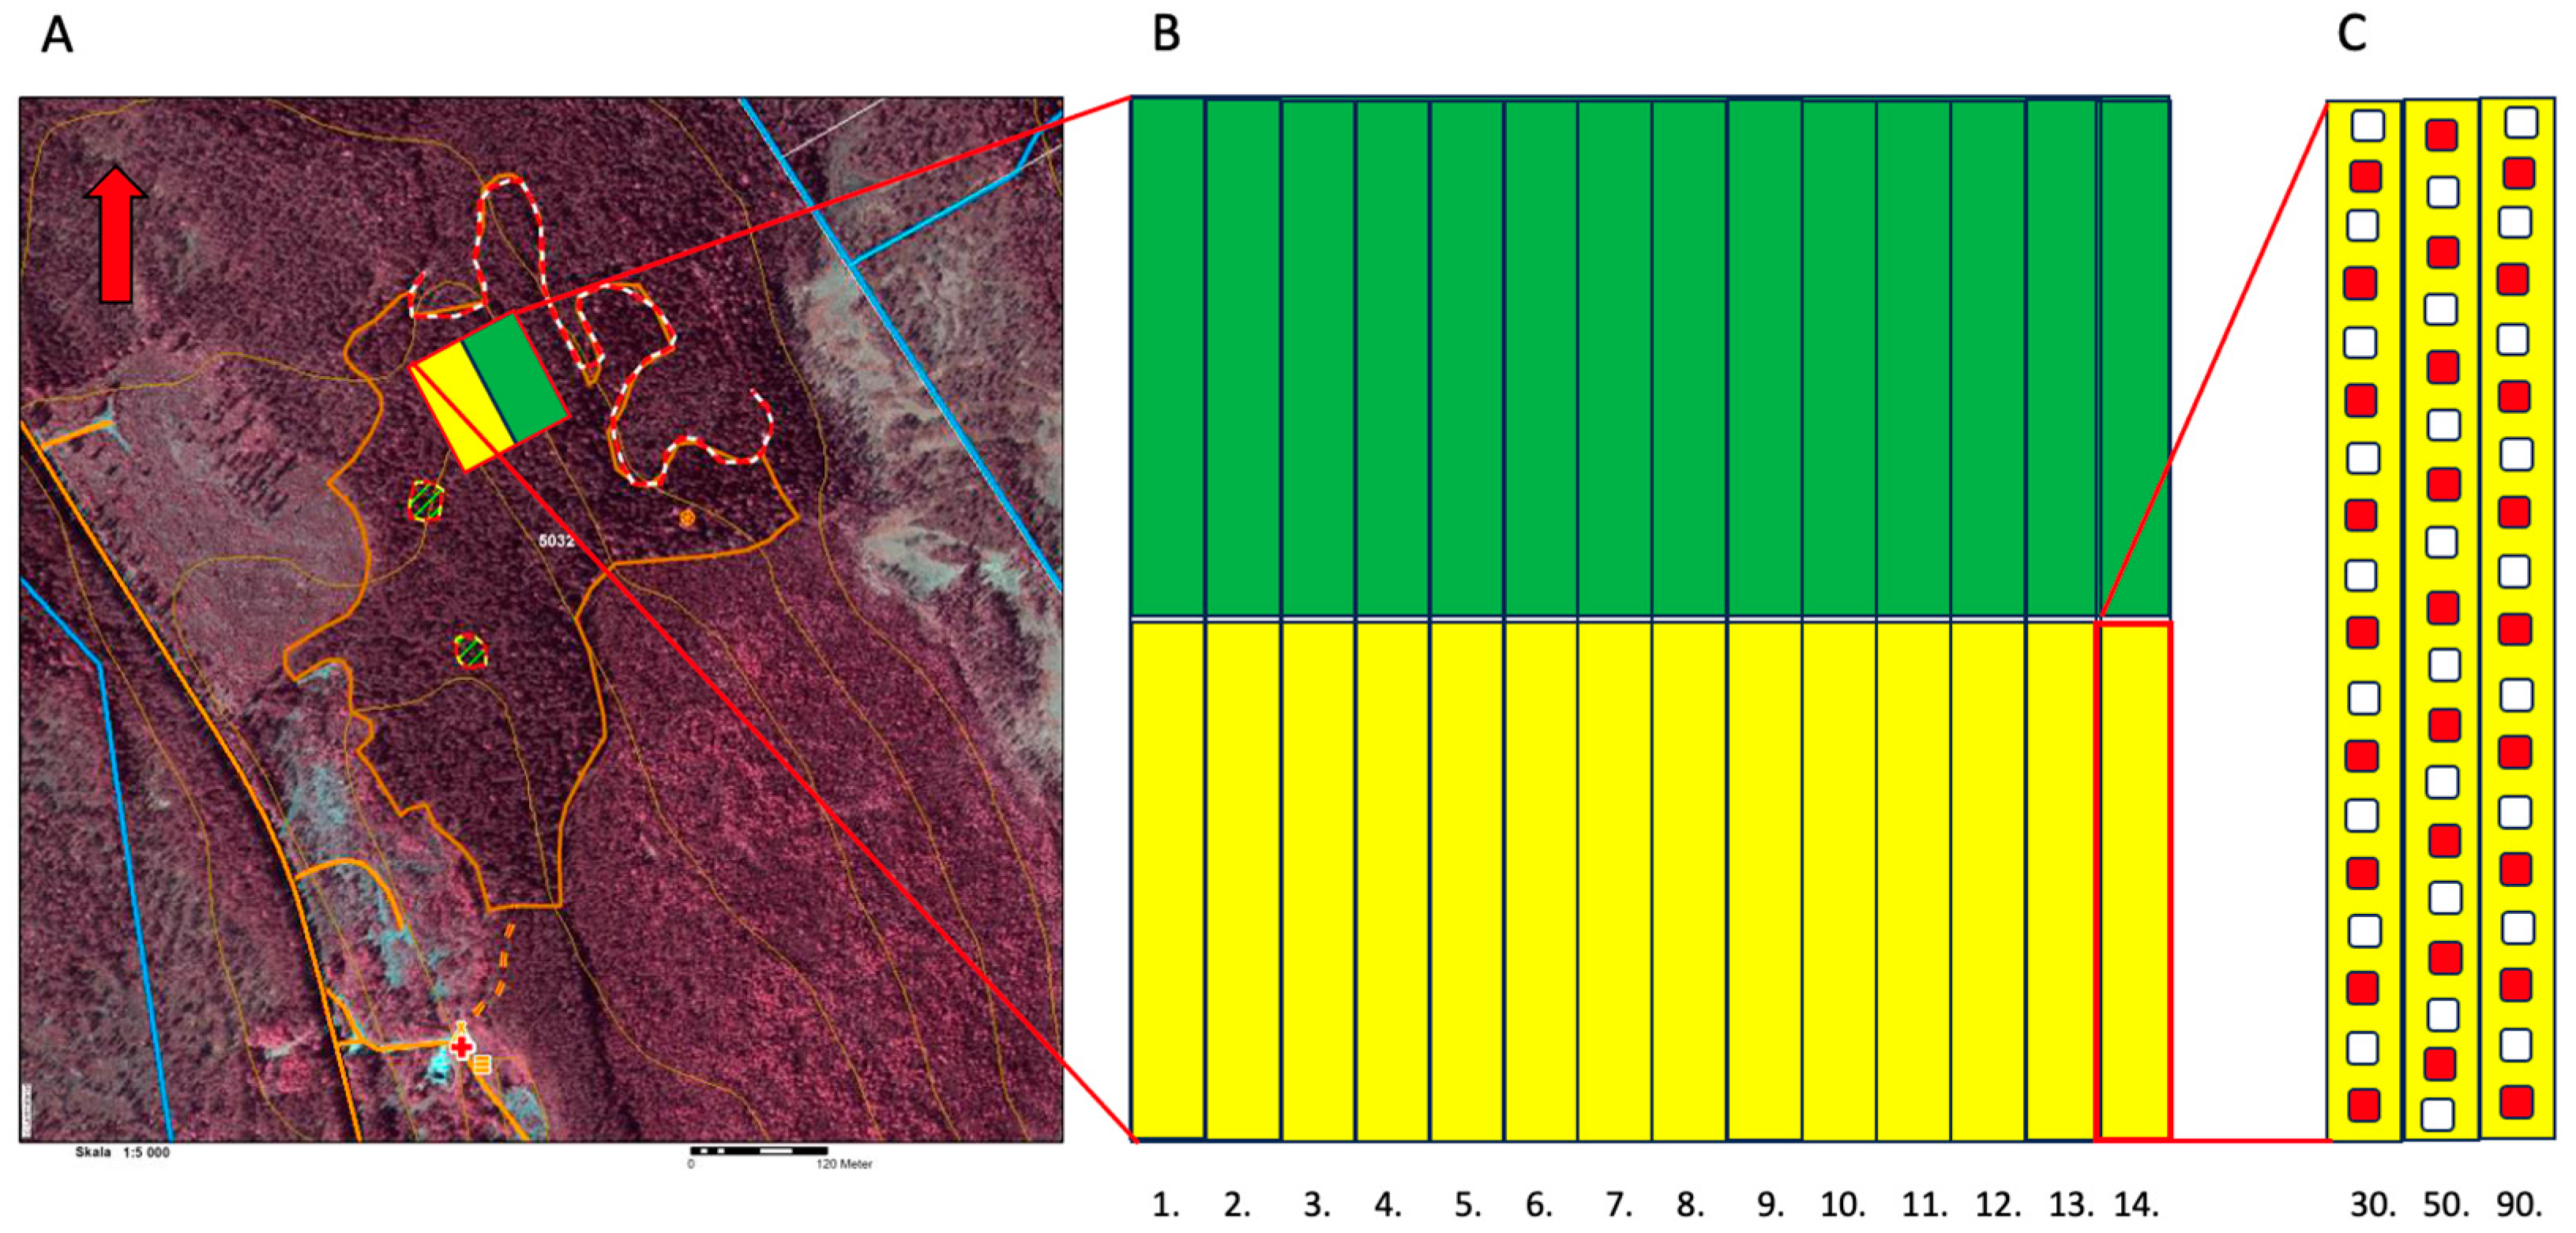
The study site was 100 × 100 m and situated on a clear-cut area with a total size of 12.3 ha in northern Sweden at 63.720954° N, 19.927771° E, ~50 m.a.s.l. (Figure 2A). The trial area sloped gently towards the east–northeast. The ground vegetation was dominated by bilberry plants (Vaccinium myrtillus L.) upslope, where the harvested stand was dominated by pine, grading to grass downslope where the harvested stand was dominated by spruce. The soil comprised a thin podzol with underlying mineral soil fractions grading from coarse wave-washed gravel upslope to fine sand downslope, with intermediate mixtures in between. The stand was harvested in June 2018 and mechanical soil preparation by mounding was undertaken in October 2019. The coarser-grained and relatively drier upper part was planted with Scots pine (yellow in Figure 2) and the lower, more fine-grained, moister part was planted with Norway spruce (green in Figure 2) during May 2020. The mechanical soil preparation method used was the mounding method. The trial area comprised 14 adjacent plots for each species (Figure 2B). Each plot comprised three rows with one seedling size in each row (Figure 2C), the seedlings having been grown in containers with cell sizes of 30, 50, and 90 cm3; the three respective rows are hereafter referred to by these volumes (Figure 1a). For each mound, a group of three seedlings was planted: one in the mound, one in the hinge, and one in the mineral soil, i.e., the exposed patch resulting from the removal of the material making up the mound (Figure 1b,d).
Mounds of insufficient quality, i.e., with insufficient contact with the underlying ground and/or without soil cover, and their accompanying hinge and mineral soil positions were not used in the trial. The variation in numbers of suitable mounds per row resulted in different numbers of seedling groups being planted in each row (7–24 seedlings per row). Every second group of seedlings was given a dose of arginine–phosphate (AP), i.e., arGrow® Granulat (Arevo AB, Umeå, Sweden), at planting. One dose of arGrow® Granulat contains 40 mg N and 22 mg P, in the form of L-arginine phosphate (C6H17N4O6P). All seedlings were marked with numbered plastic sticks to facilitate individual identification, with different colors for each seedling size and with red sticks marking the AP-treated groups (Figure 1d). All seedlings were planted with commercial Pottiputki (BCC AB, Landskrona, Sweden) planting pipes by experienced workers, deep enough for the substrate to be covered by soil, which was gently compacted by pushing the soil next to the seedling with one foot (i.e., following common commercial practice). For the AP treatment, a Pottiputki with an attached arGrow® dispenser (designed for this purpose and used in commercial applications) was used (Figure 1e). One dose was dropped into the pipe when it was inserted into the ground and prior to putting the plant in the pipe, so that the dose ended up directly below the seedlings’ roots. The seedlings were planted during the period 18–29 May 2020.
All seedlings were sown in 2019 and grown in the nursery at Skogforsk, Sävar, Sweden. Seedlings were grown in containers with cell sizes of 30, 50, and 90 cm3 for both Scots pine and Norway spruce, then stored frozen during the winter, following common practice. Forty seedlings of each species and size were randomly chosen for initial size measurements: the roots and shoots were separated and dried at 70 °C for ~60 h and then weighed separately (Table 1). For Scots pine, the percentage of seedlings with primary needles, i.e., only one needle per bundle, was recorded in a control inventory carried out immediately after planting (Table 1).
After planting, a control inventory was compiled with a more detailed quality classification assessment of the planting positions, identifying whether the seedlings were planted surrounded by mineral soil or in the vicinity of organic material. Being in the vicinity of organic material represents an increased risk of pine weevil damage by offering shelter to the weevils and thus can be considered a low-quality position at sites where pine weevils are common. Following examination of the data, we found that seedlings planted in proximity to organic material had suffered from more pine weevil damage, and these were all grouped as low-quality positions regardless of the original intended planting position. This group included seedlings in the mineral soil area planted with peat or decomposing humus in the patch closer than 10 cm to the humus edge, seedlings planted in the hinge adjacent to a mound that was not covered by mineral soil, and seedlings planted in mounds that were not covered by mineral soil. The remaining seedlings were re-defined as planted in high-quality (HQ) mineral soil, HQ hinge positions, and HQ capped mounds. Due to different patterns regarding pine weevil damage for pine and spruce in positions on capped mounds where there was humus mixed into the mineral soil around the seedlings, such positions were grouped as low-quality positions due to the high pine weevil damage for spruce, but were not grouped as such for pine. Since high-quality positions were prioritized during planting, they outnumbered the lower-quality positions for each main position. The grouping of all low-quality positions as a separate group allowed us to obtain a clearer definition of the main planting position characteristics and define the potential effects of planting position with less interference from the effects of pine weevil damage.
Seedling development records were compiled at the end of each of the first three growing seasons following planting: on 24–26 August 2020, 6–10 September 2021, and 2–8 September 2022. The inventories included recorded scores for vitality (all years, 0 = dead or dying, 1 = severely low vitality, 2 = moderate decrease in vitality from damage and/or damaged leading shoot, 3 = none or minor decrease in vitality, undamaged leading shoot); leading shoot length (all years, in cm); height (all years, measured from ground level to top bud in cm); stem basal diameter (in 2022, measured close to ground level in mm); level of pine weevil damage (all years, not including healed damage from previous years; 1 = minor, <25% of the stem circumference damaged; 2 = moderate, 25%–50% of the stem circumference damaged; 3 = severe, >50% stem of the circumference damaged; 4 = seedling killed by pine weevil damage); other damage and, when applicable, the causes of other damage; and mortality.
A subset of seedlings was harvested (starting from plot 1, seedling groups 1 and 2, and then every second pair of AP-treated and untreated seedling groups in every second plot for each species up to plot 11), including the roots, in the period 10–12 October in 2022. In total, 524 pine and 510 spruce seedlings were harvested. For these seedlings, stem base, seedling height, and leading shoot length were measured. The roots and shoots were separated at the base of the stem, then the roots were rinsed to remove soil and other foreign material under running water. The roots and shoots were dried at 70 °C for ~60 h and weighed. Comparisons of their dry weights to the field measurements were used as the basis for choosing which growth parameter to use in the analysis of field data for each tree species.
Scots pine and Norway spruce were analyzed separately. All analyses were carried out using R-studio software version 1.4.1106 [26]. We applied generalized mixed-effect models using the glmer function in the [lme4] package version 1.1-27.1 [27] with a binomial distribution for the response variables for survival, mortality, and damage by pine weevils from the field inventory data. Planting position (i.e., HQ mineral soil, HQ hinge, HQ capped-mound, and LQ positions), seedling size, and AP addition were used as fixed factors, and the plot was set as a random factor to account for the varying number of seedlings in each row as well as other potential within-site variability. ANOVA tables from these analyses are presented with the results for survival, damage, and mortality caused by pine weevils. To enable interpretable visualizations of the results, the seedling sizes were analyzed separately when effect of size was significant, following the same procedure as that used in the described analyses but omitting the size factor.
For the measured values, i.e., the diameter of pine and height of spruce from the field measurements and the dry weights and shoot–root ratio for the harvested seedlings, we applied linear mixed models using the lmer function in the [lmerTest] package version 3.1-3 [28], with AP treatment and planting position used as fixed factors and the plot used as a random factor. For growth, each seedling size was analyzed separately without first analyzing them together, since the effect of seedling size on seedling size would be superfluous.
The analysis of variance (ANOVA) type III function in the [car] package version 3.0-12 [29] was used to test each model for interactions. Where no significant interactions were found, the model was reduced to include the main effects only and was tested again with ANOVA type II in the [car] package. From all models made for visualization of the results, estimated marginal means were calculated using the [emmeans] package [30] and presented graphically using the [ggplot2] package version 3.3.6 [31].
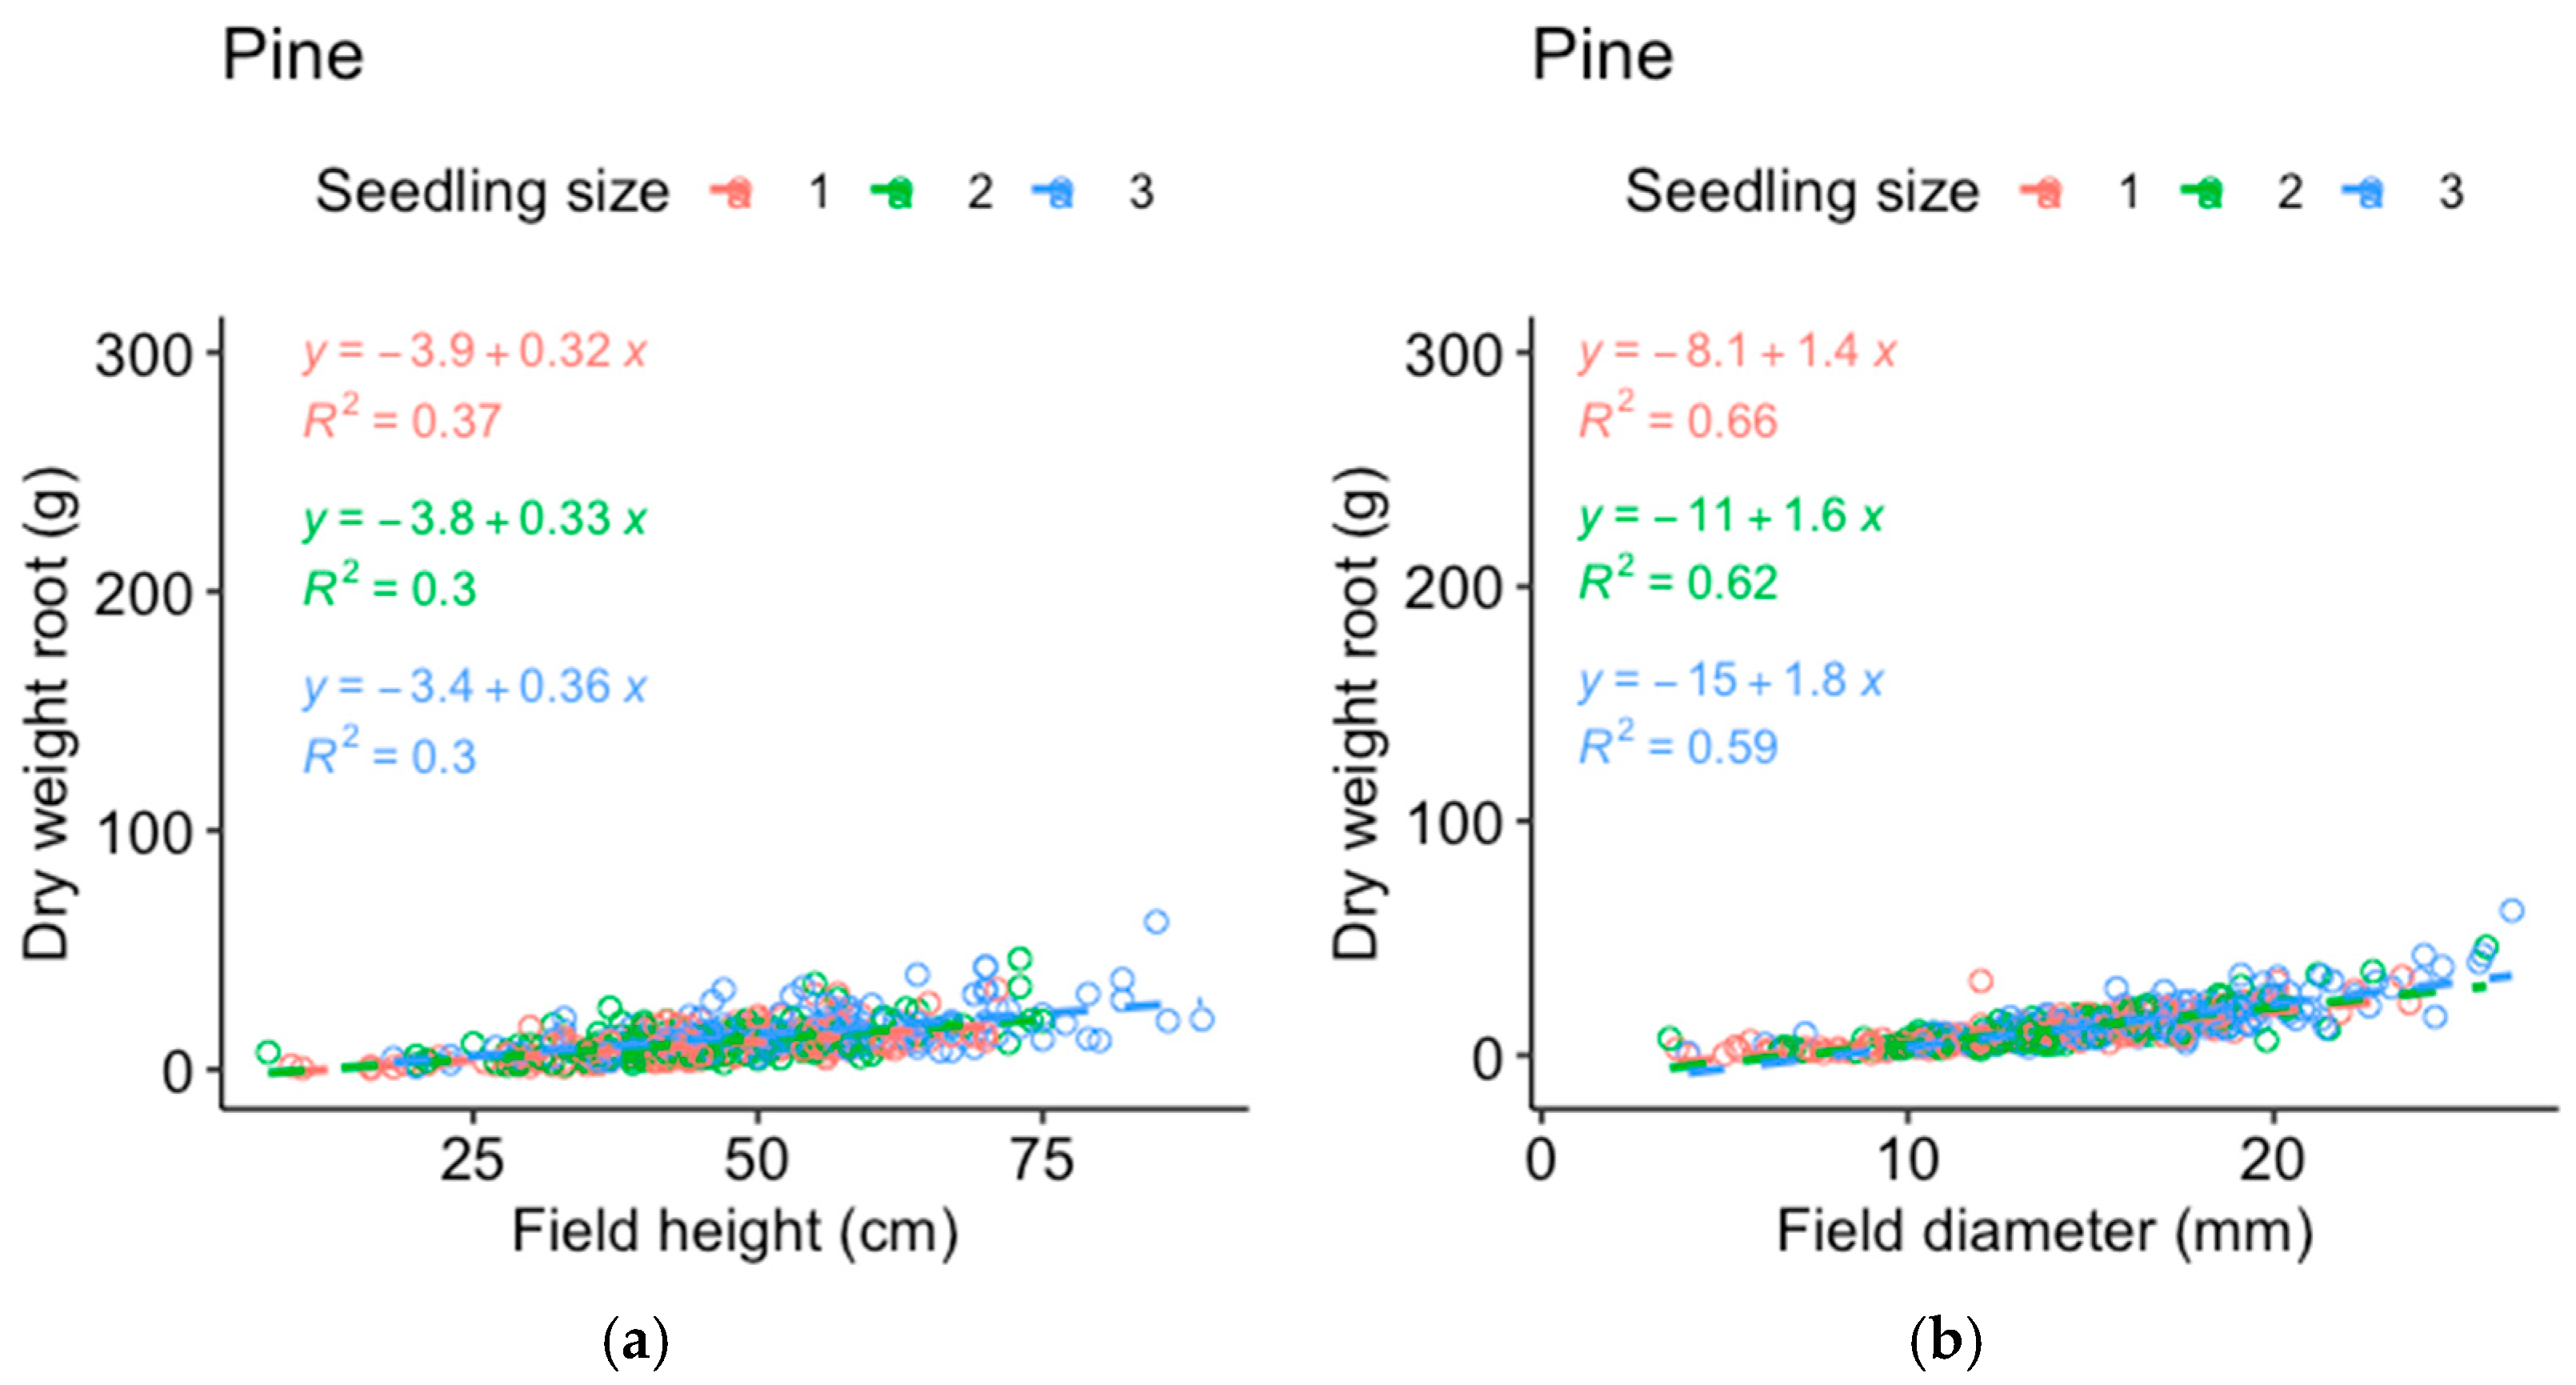
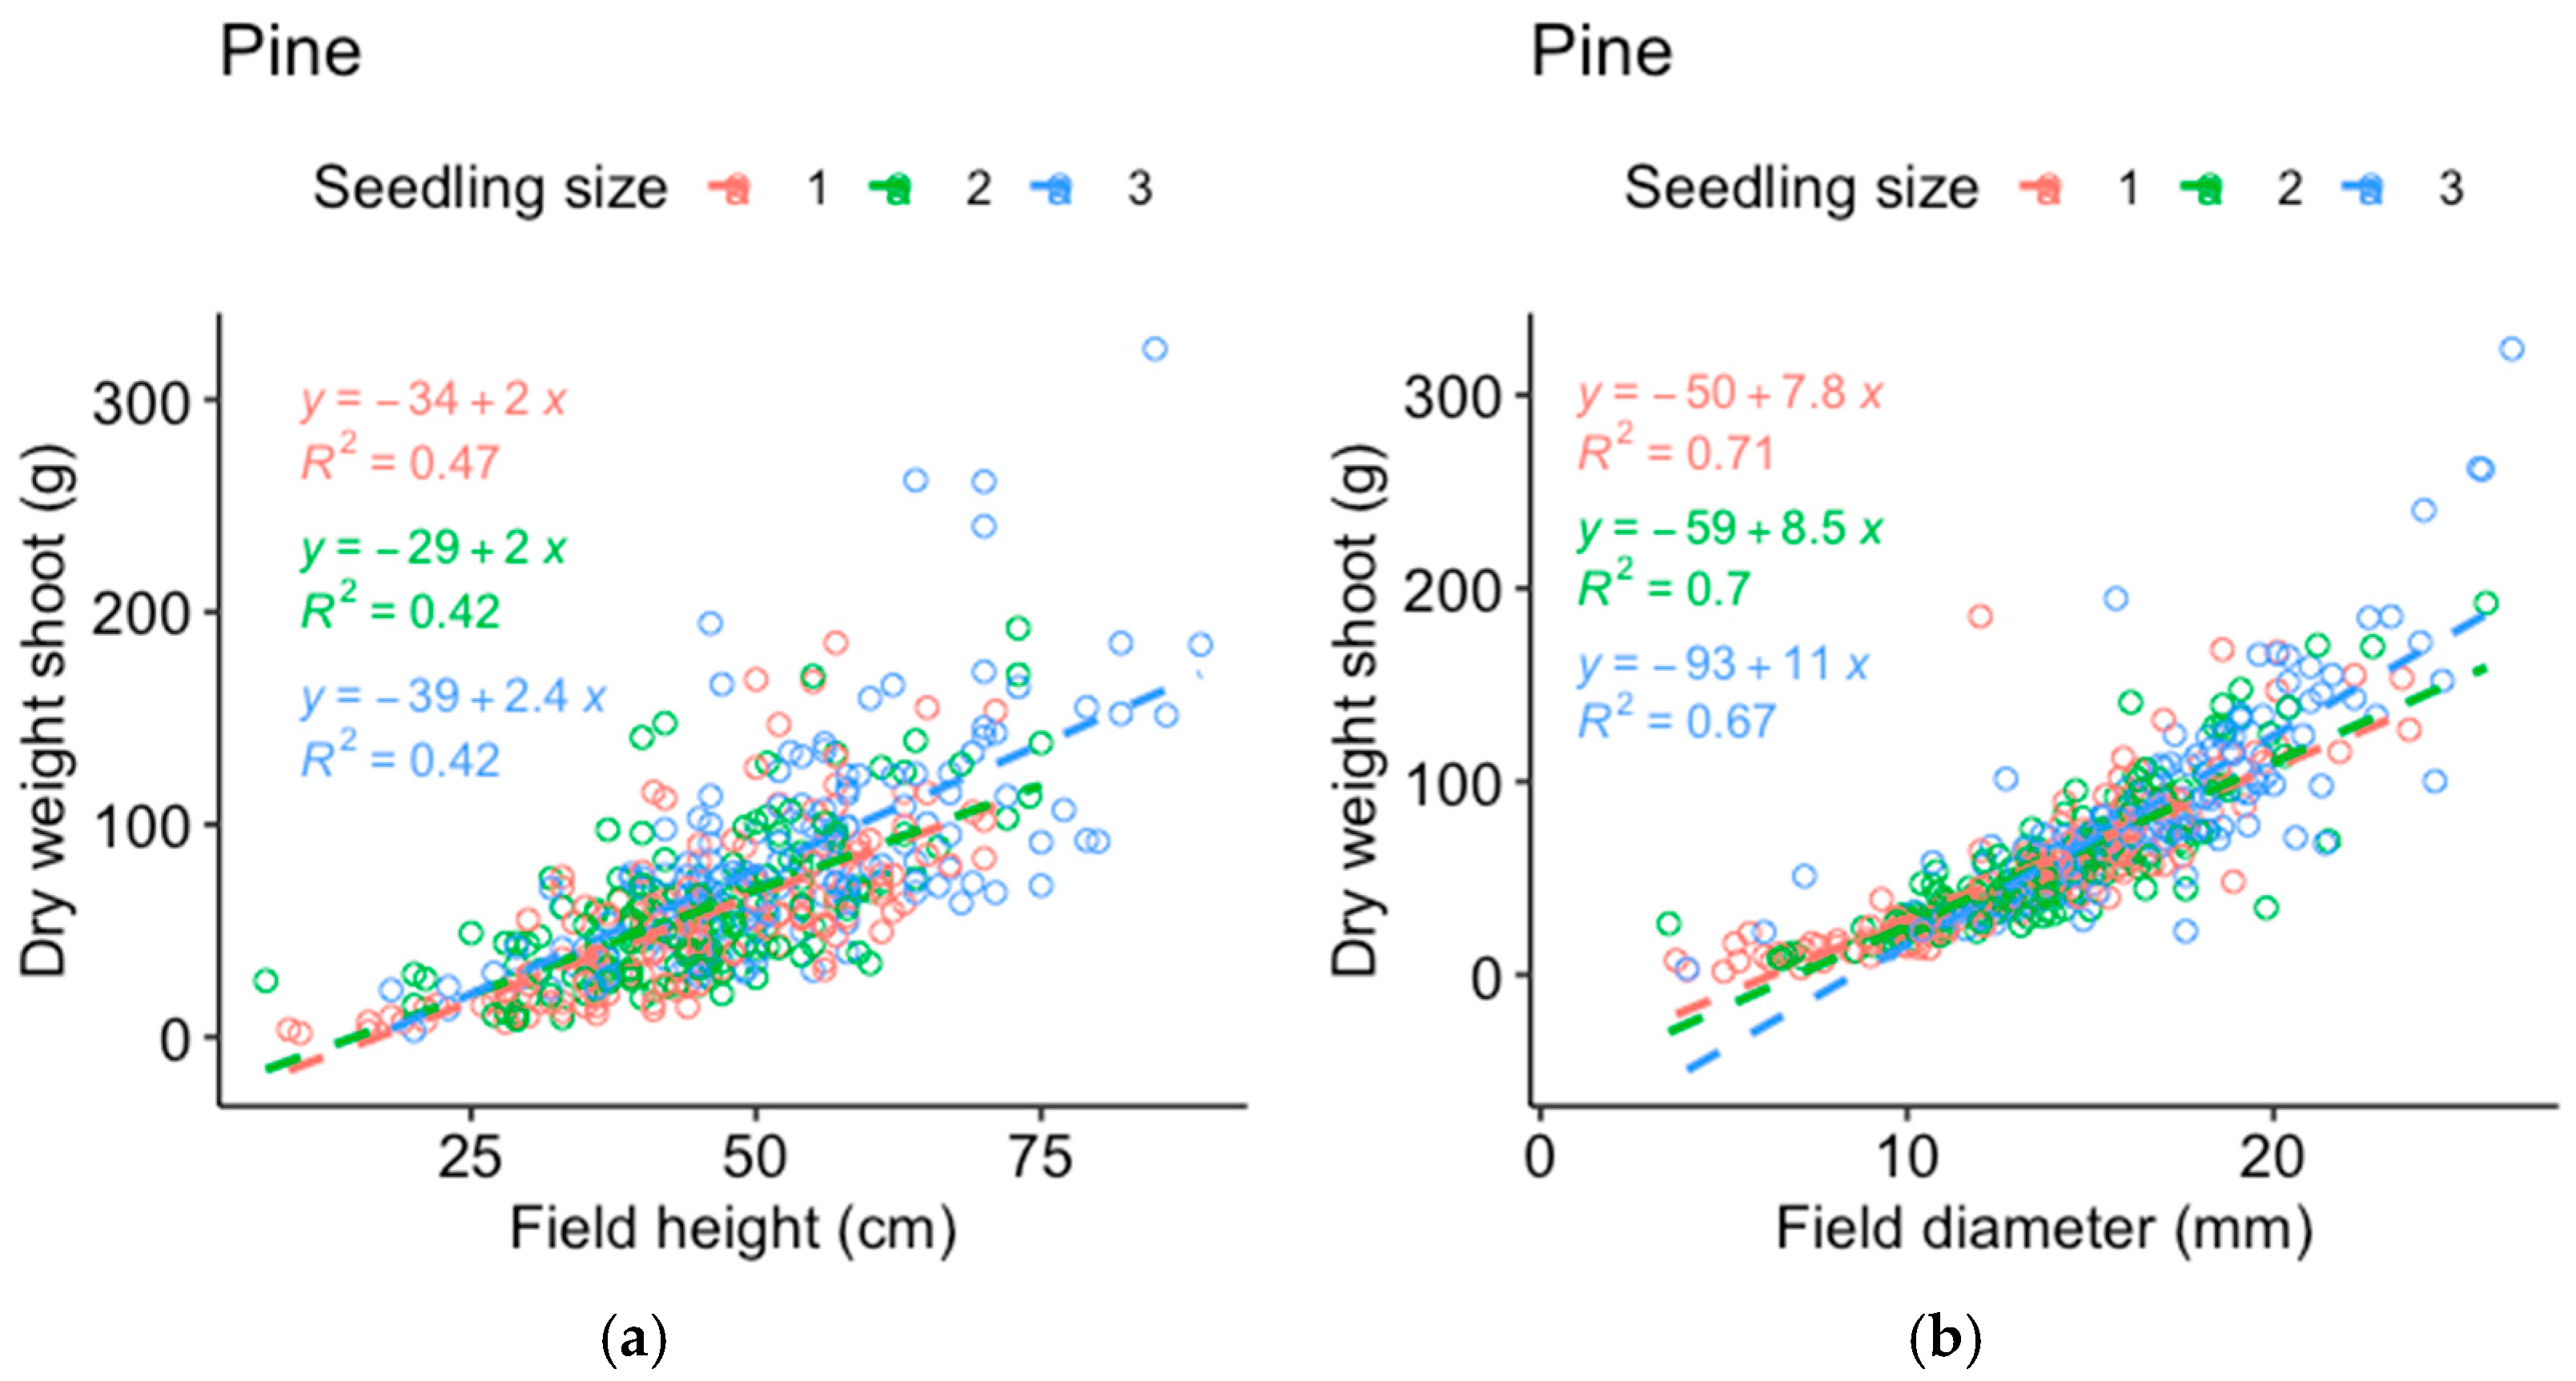
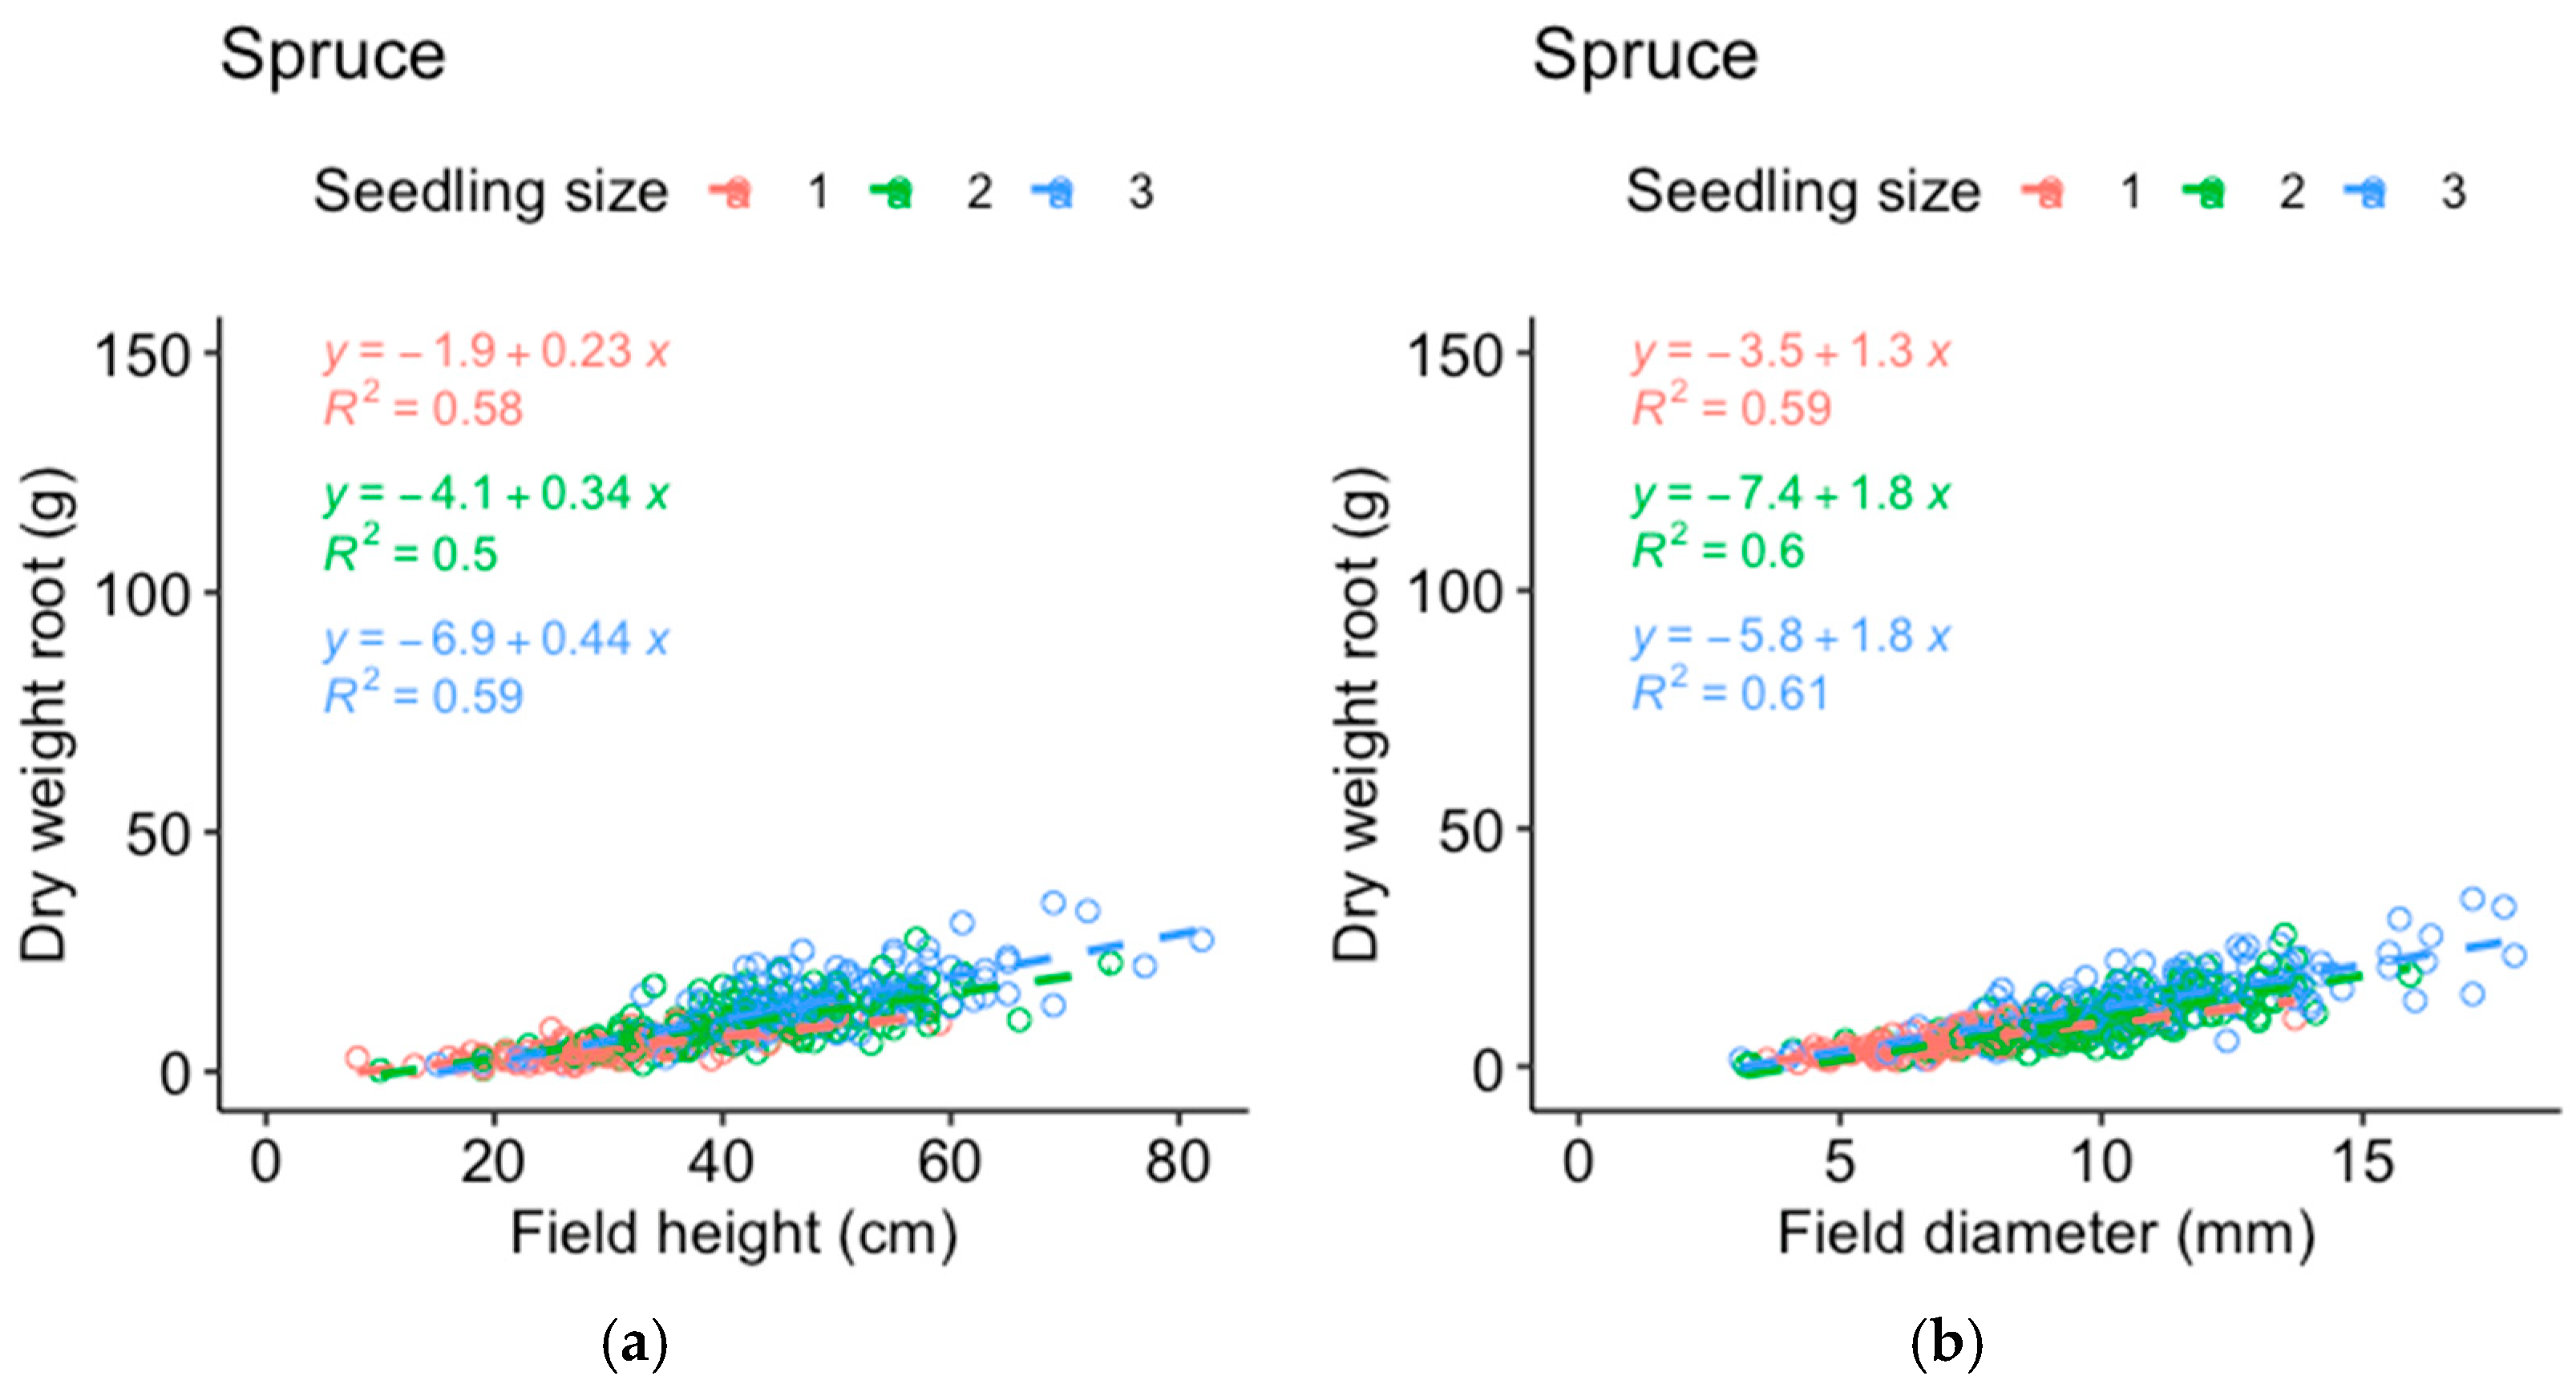
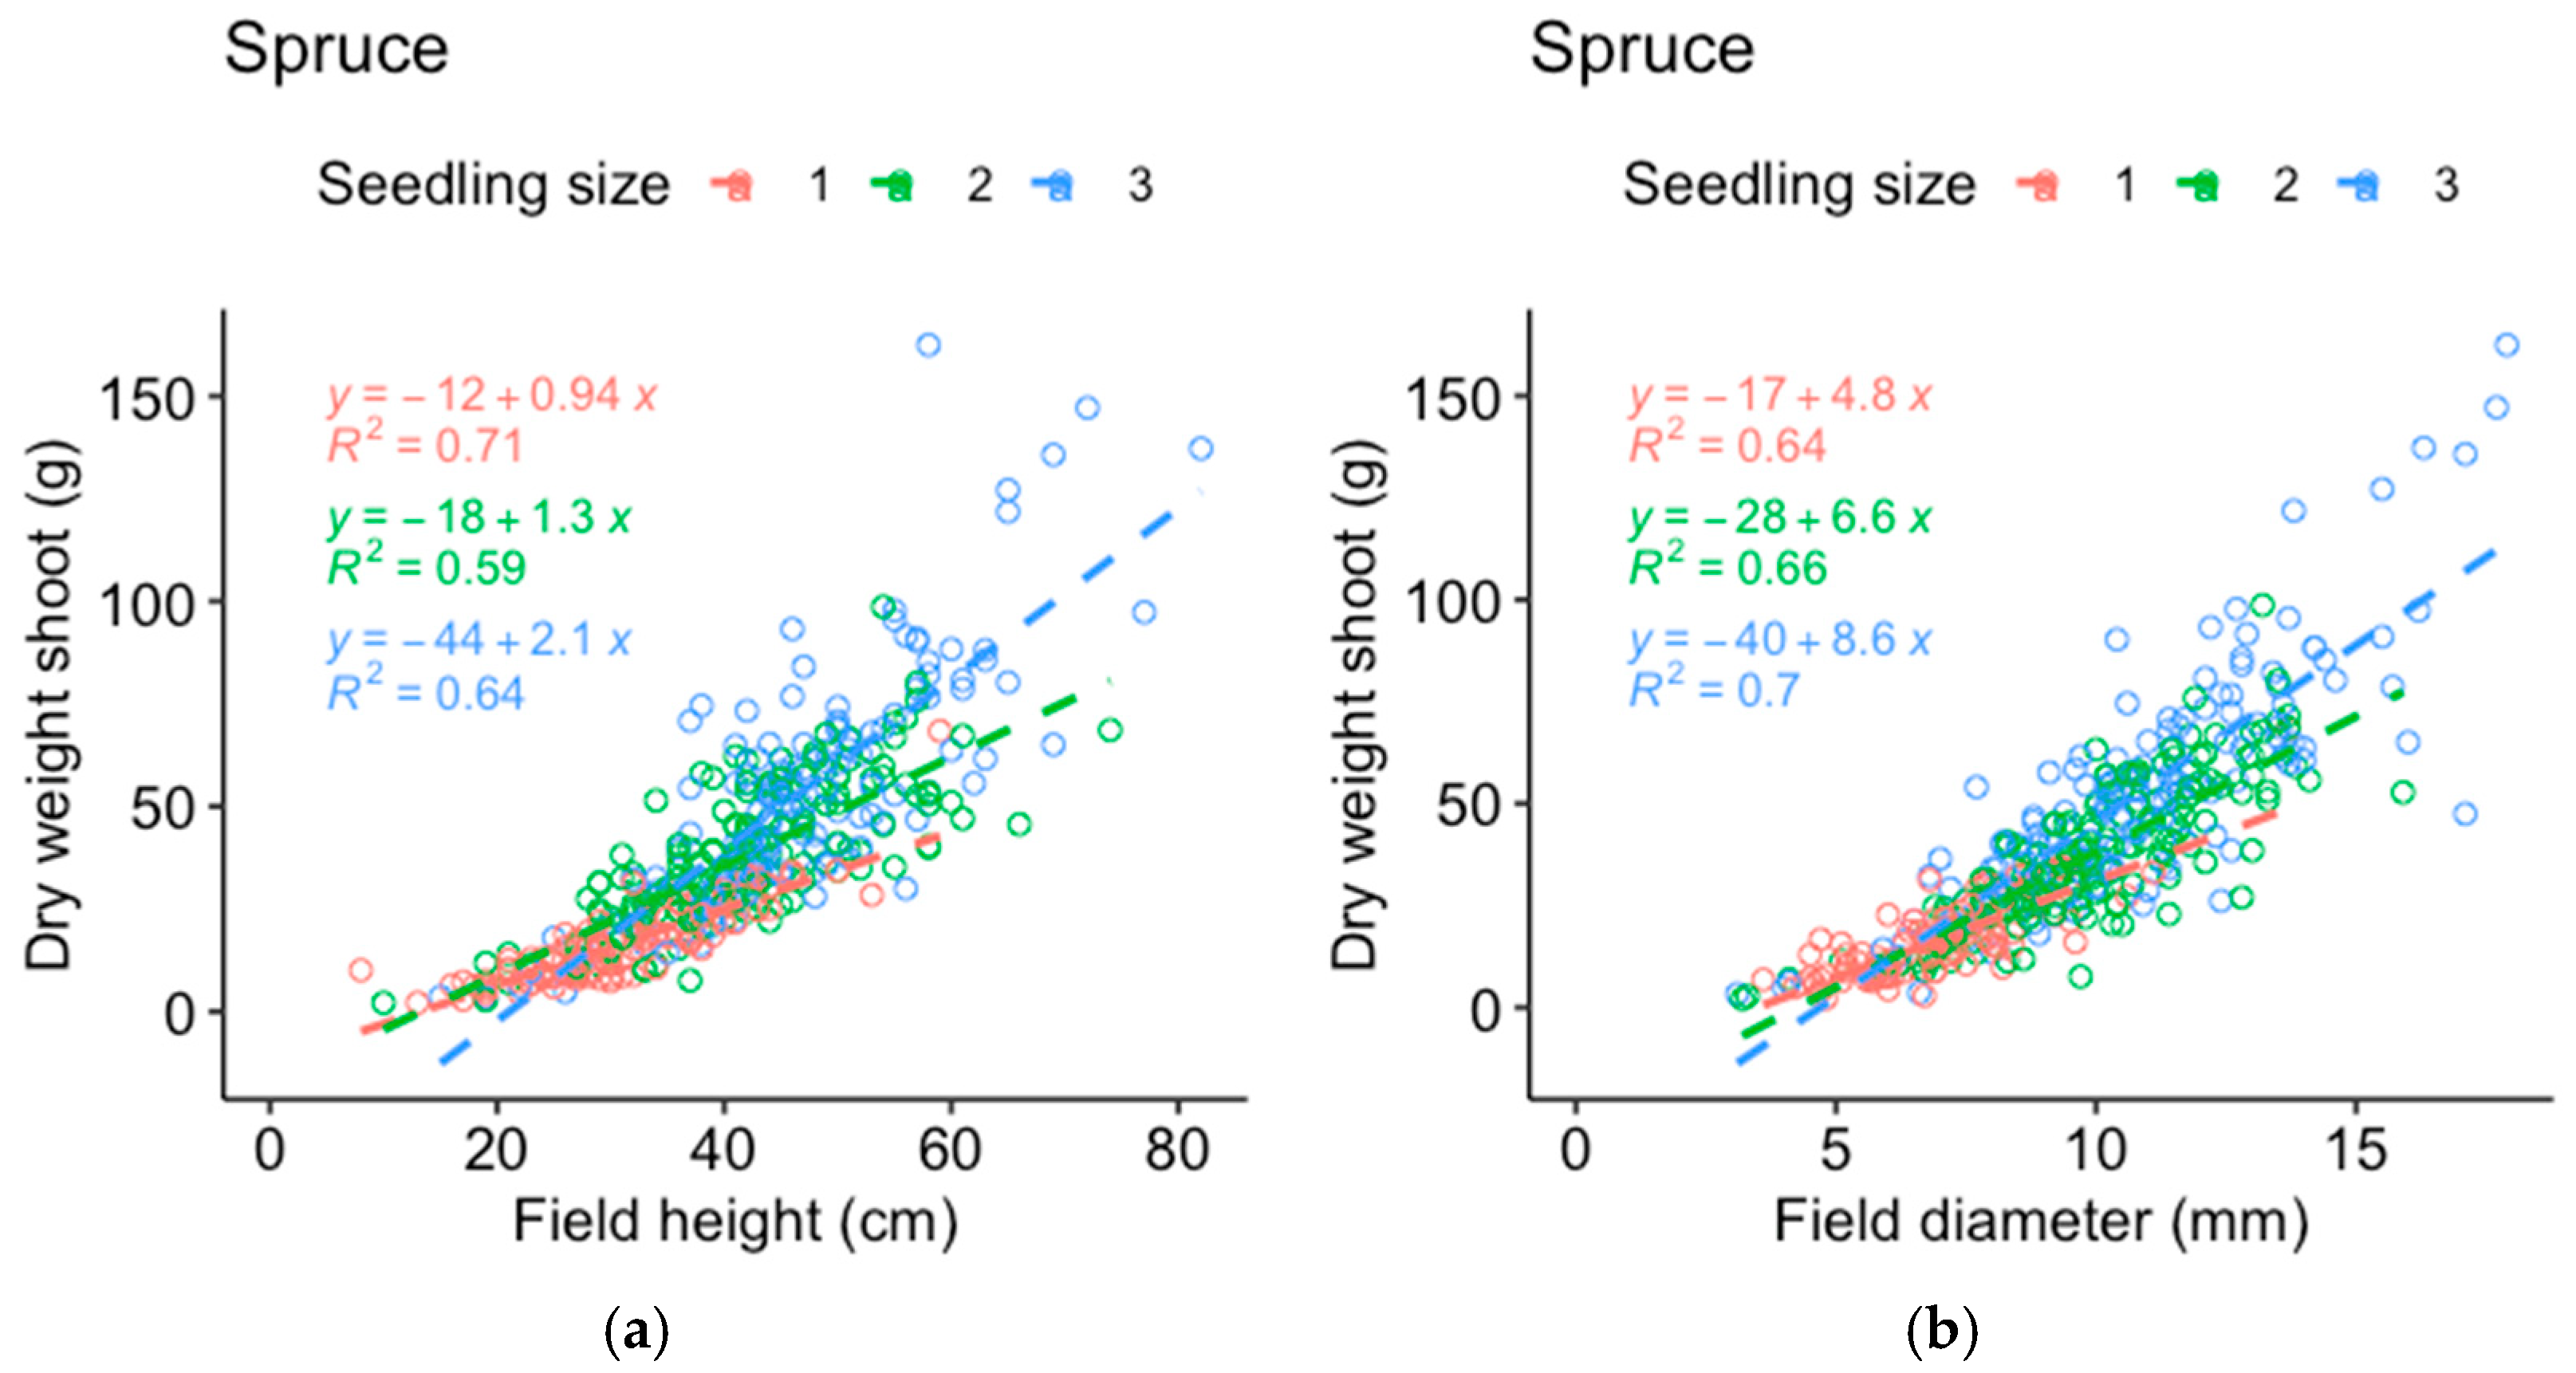
Comparisons between the dry weight data from the harvested seedlings and those from the field measurements of the same seedlings were made to determine which of the measured parameters best represented the seedling mass (Appendix A). The stem basal diameter correlated best with the dry weight of the pine roots (Figure A1) and shoots (Figure A2) and was used as the response variable for pine, while height corresponded almost as well or better compared to the stem basal diameter (depending on seedling size) for the spruce roots (Figure A3) and shoots (Figure A4). In addition, field measurements of the spruce stem basal diameter were missing for half of the plots and height was therefore used as the response variable for spruce growth to include as much of the available data as possible. The data on the dry weights of shoots and roots from the harvested seedlings were analyzed following a procedure similar to that followed for the field measurements.

3. Results

Only mounds with sufficient contact with the underlying substrate and their accompanying hinge and mineral soil positions were used in the trial, and there were relatively few low-quality positions because they were actively avoided during planting. In a commercial regeneration situation, planters are generally paid per planted seedling and cannot afford the time to consider every planting position as carefully. Hence, the results are probably biased towards a better regeneration outcome than in a commercial situation.

3.1. Survival

Planting position had a significant effect on the probability of survival for both pine and spruce, while no effect of seedling size and AP treatment on survival was found (Table 2). For the pine seedlings, the highest probability of survival was found in the capped-mound and high-quality mineral soil positions, being lower in the high-quality hinge positions and lowest in the low-quality positions (Figure 3a). For the spruce seedlings, the probability of survival was highest in the high-quality positions and lowest in the low-quality mound positions (Figure 3b).

3.2. Pine Weevil Damage and Associated Mortality

The main cause of seedling mortality was pine weevil damage: 82% of the dead pine seedlings and 72% of the dead spruce seedlings had pine weevil damage recorded as the cause of death. Planting position and seedling size had a significant effect on the probability of pine weevil damage for both pine and spruce, while there was no effect of AP treatment (Table 3). The risk of pine weevil attacks increased with increasing seedling size and was highest in the low-quality positions for both species and, in general, lower for spruce than for pine (Figure 4 and Figure 5).
Planting position had a significant effect on the probability of a fatal outcome due to pine weevil attacks for both pine and spruce, while there was no effect of seedling size and AP treatment on survival (Table 4). The risk of mortality as a result of pine weevil damage was highest in the low-quality positions and high-quality hinge positions for pine (Figure 6a), and highest in the low-quality positions for spruce (Figure 6b).

3.3. Growth

3.3.1. Pine

For pine, planting position had a significant effect on the stem basal diameter growth (Table 5). Growth was, in general, lowest in the HQ mineral soil control positions, and for the 50 cm3 pine, growth was equally low in the LQ positions (Figure 7). Compared to the HQ mineral soil control positions, the stem basal diameter growth of the 30 cm3 seedlings increased by up to ~40% (in the HQ capped-mound control positions); of the 50 cm3 seedlings increased by up to ~27% (in the AP-treated HQ hinge positions); and of the 90 cm3 seedlings increased by ~21% (HQ capped-mound positions). For the 90 cm3 pine seedlings, the AP treatment had no significant effect. For the 30 and 50 cm3 pine seedlings, there was an interaction between the AP treatment and the positions, with different AP treatment effect trends being observed in different positions: the effect trend was positive in HQ mineral soil and hinge positions, neutral (for 30 cm3 seedlings) or positive (for 50 cm3 seedlings) in LQ positions, but negative in the capped-mound positions. The effect was not significant within each planting position, but the difference shifted between planting positions so that the AP-treated seedlings no longer grew significantly less in mineral soil positions compared to untreated seedlings in the hinge positions (for 30 and 50 cm3 seedlings); in HQ hinge positions compared to untreated seedlings in HQ capped-mound positions (for 30 cm3 seedlings); or in LQ positions compared to untreated seedlings in the HQ capped-mound positions (for 50 cm3 seedlings).
The shoot–root ratio was significantly higher in HQ hinge positions than in HQ capped-mound positions for all seedling sizes, and, for the 30 cm3 seedlings, higher than in mineral soil positions and, for the 50 cm3 pine seedlings, higher than in LQ positions (Table 5, Figure 8). AP treatment had no significant effect on the shoot–root ratio. For the shoot and root dry weight analyses of pine, see Appendix B, Table A1, and Figure A5.

3.3.2. Spruce

For spruce, both the positions and AP treatment had independent significant effects on height growth for all three seedling sizes (Table 6). Growth was lowest in the HQ mineral soil positions for the 30 and 90 cm3 spruce seedlings, while for the 50 cm3 spruce, it was equally low in the LQ positions and HQ capped-mound positions (Figure 9). Compared to the HQ mineral soil control positions, the height growth of the 30 cm3 seedlings increased by up to 11% (in HQ capped-mound positions); of the 50 cm3 seedlings by up to 16% (in HQ hinge positions); and of the 90 cm3 seedlings by 15% (in HQ capped-mound positions). The increase in height growth associated with AP treatment was 7% for the 30 cm3, 6% for the 50 cm3, and 4% for the 90 cm3 spruce seedlings (Figure 9).
Planting position had a significant effect on the shoot–root ratio only for the 90 cm3 seedlings: seedlings in mineral soil positions had a significantly lower shoot–root ratio than seedlings in the other positions (Table 6, Figure 10). AP treatment had no significant effect on the shoot–root ratio. For the shoot and root dry weight analyses of spruce, see Appendix B, Table A2, and Figure A6.

4. Discussion

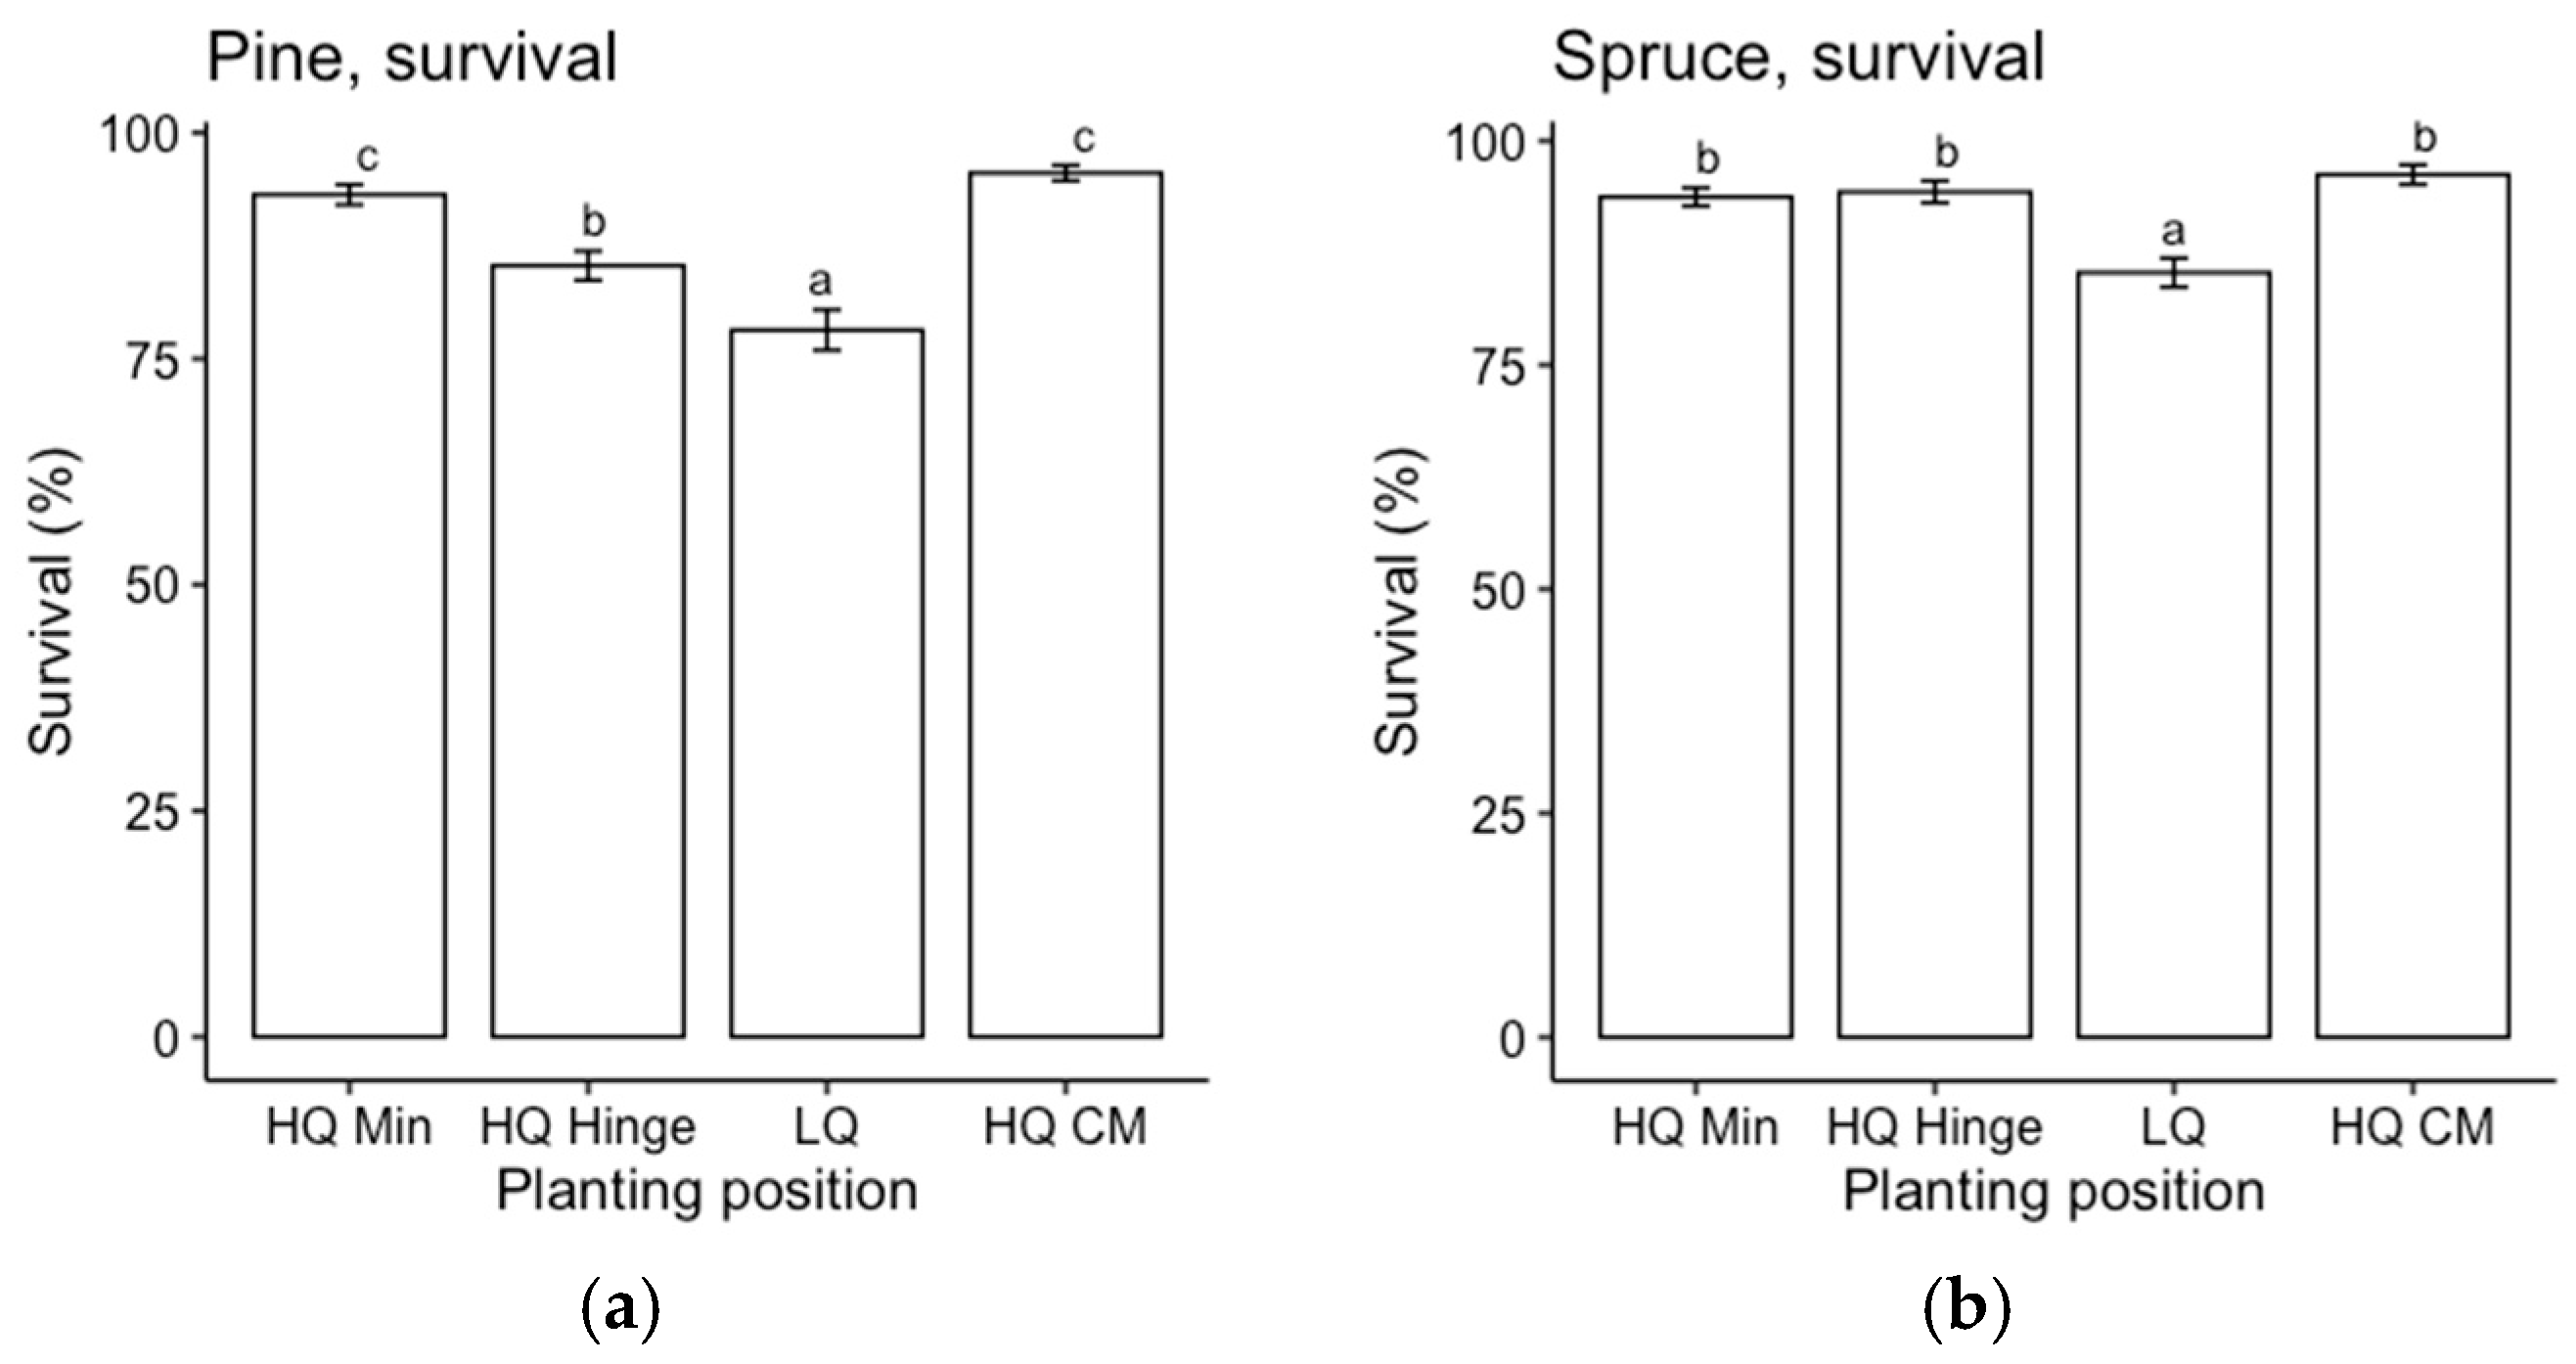
Three years after planting, seedling survival was in the range of 74%–96% for pine and 83%–98% for spruce. The main cause of mortality was pine weevil damage for both pine and spruce. Most deaths caused by pine weevils occurred in 2020 (the year of planting), which is an expected result due to the high risk of thin-stemmed seedlings being girdled [18,19,20].
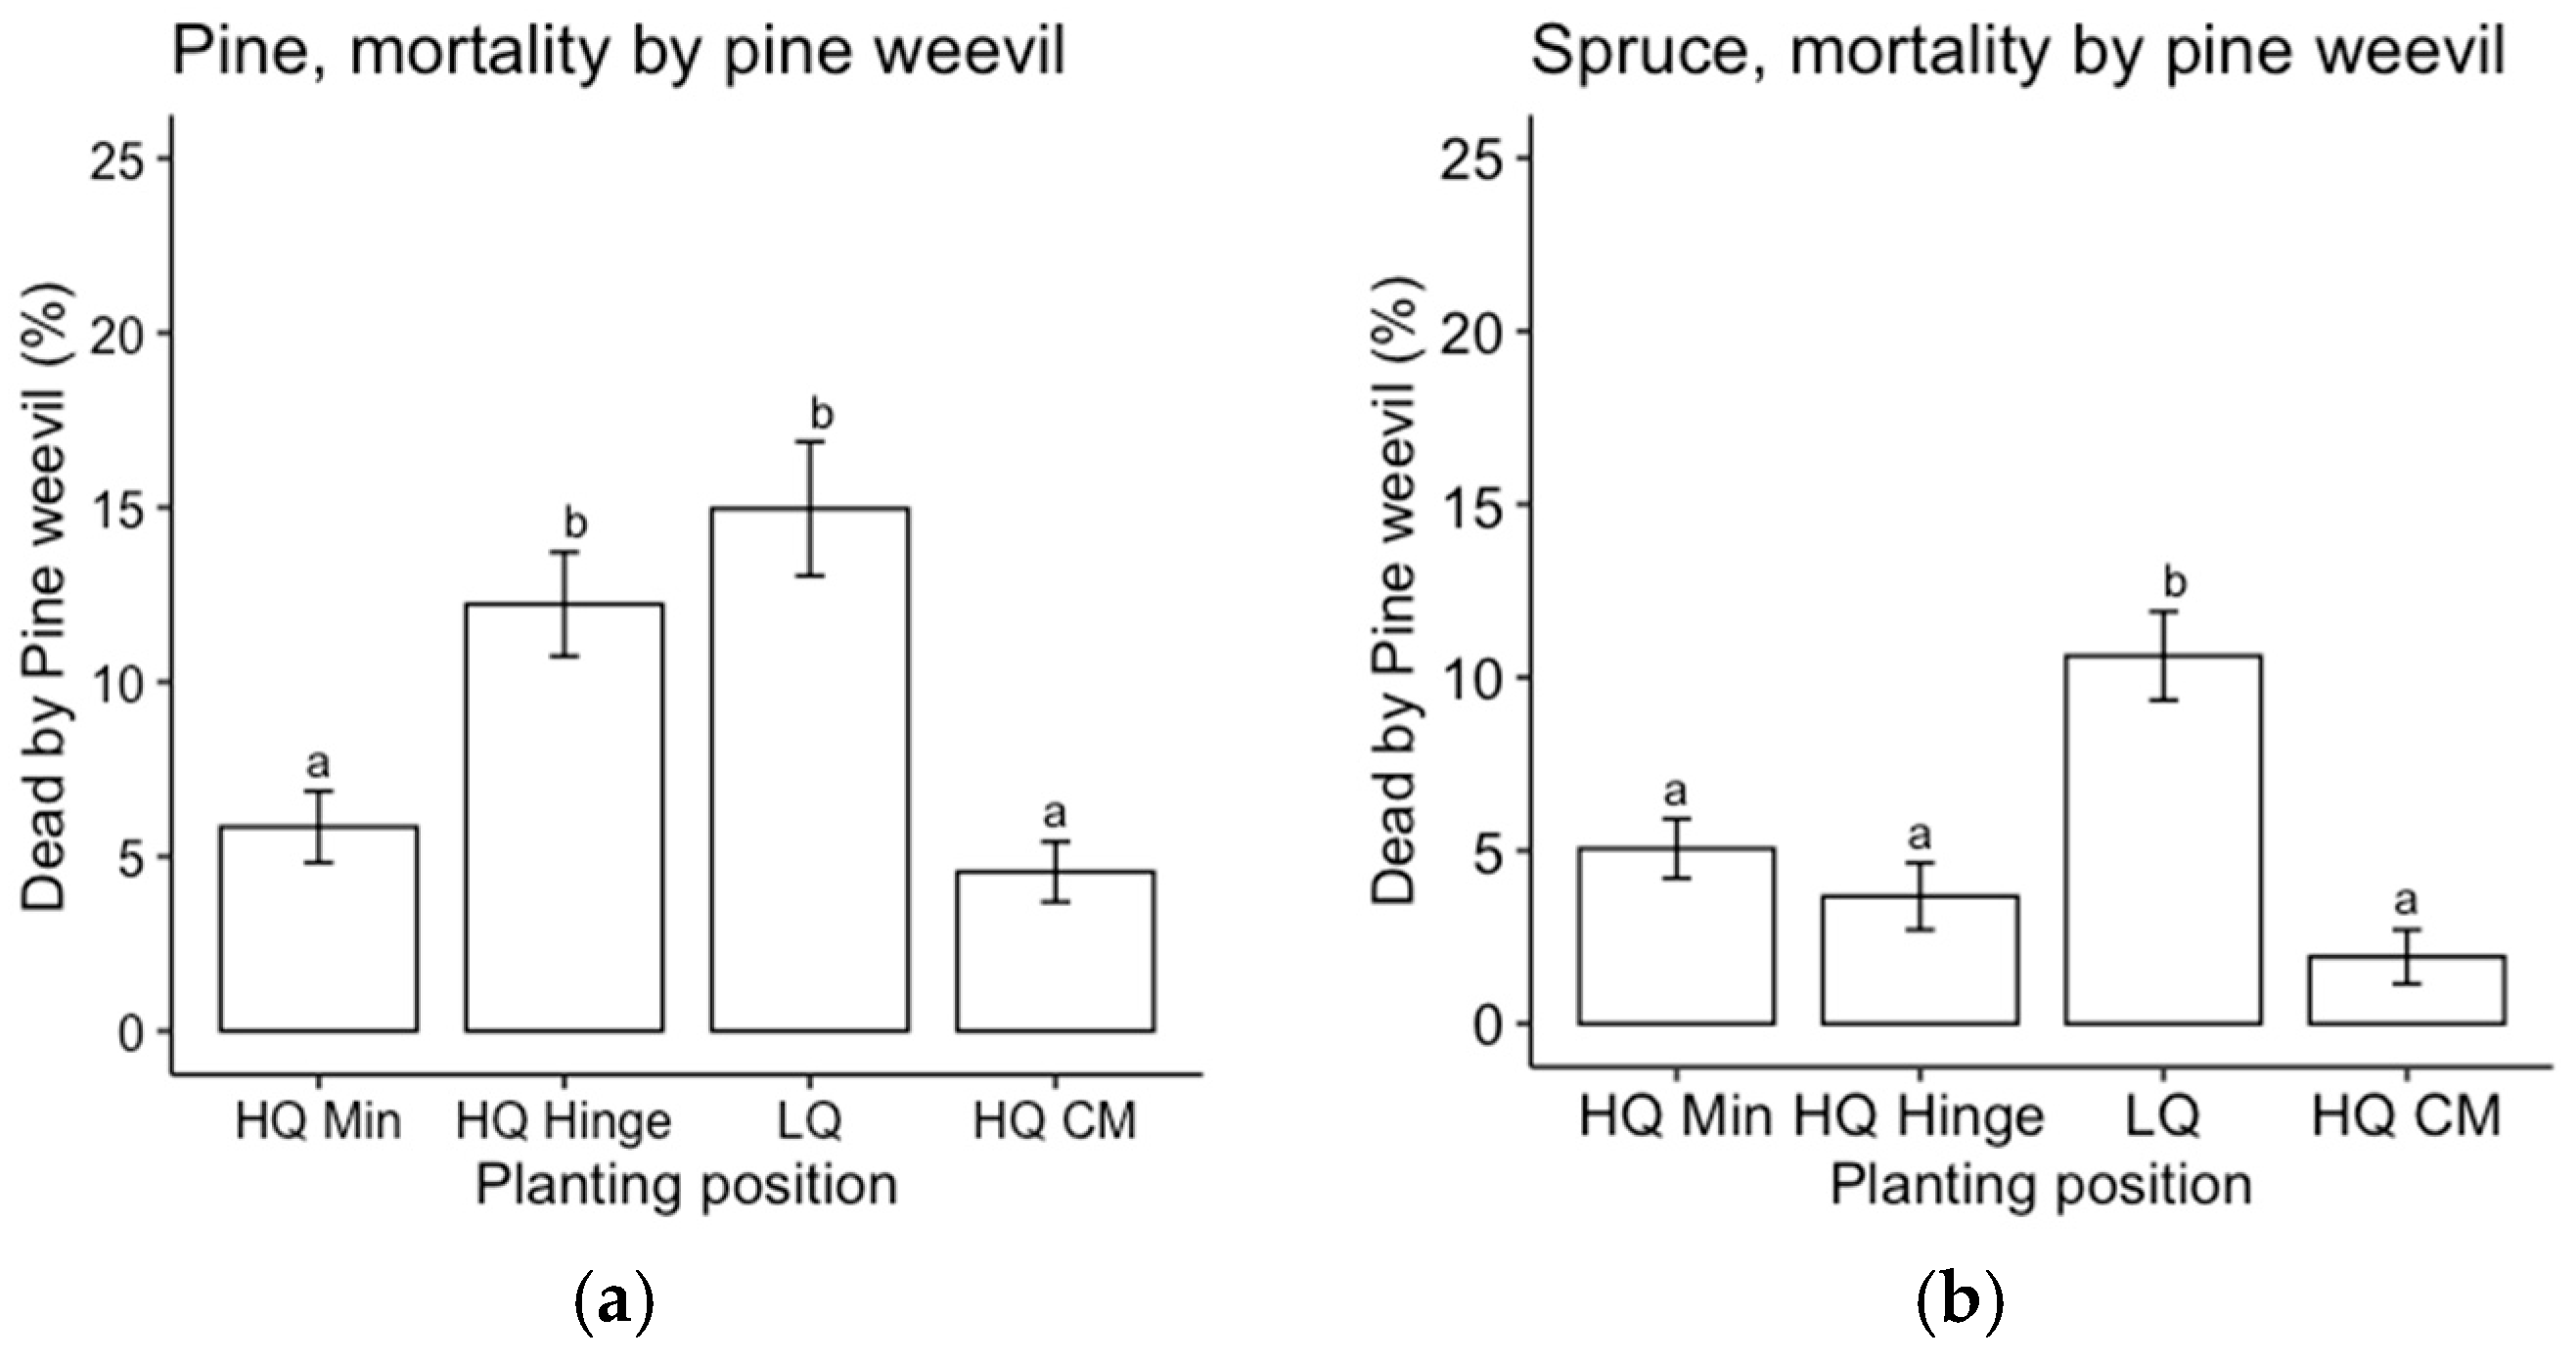
The choice of planting position affected the outcomes regarding survival, in accordance with our first hypothesis. However, it appeared to be related more to the quality of the position rather than the choice of mineral, hinge, or capped-mound position. Mortality was highest in the low-quality planting positions for both pine and spruce, and it was mainly related to pine weevil damage. This was expected since the definition of a low-quality position was based on the occurrence of organic material (i.e., humus and vegetation) in the vicinity of the seedling, which has been found to increase the frequency and level of damage by pine weevils compared to seedlings surrounded by mineral soil [15,16,17,18,19,20,
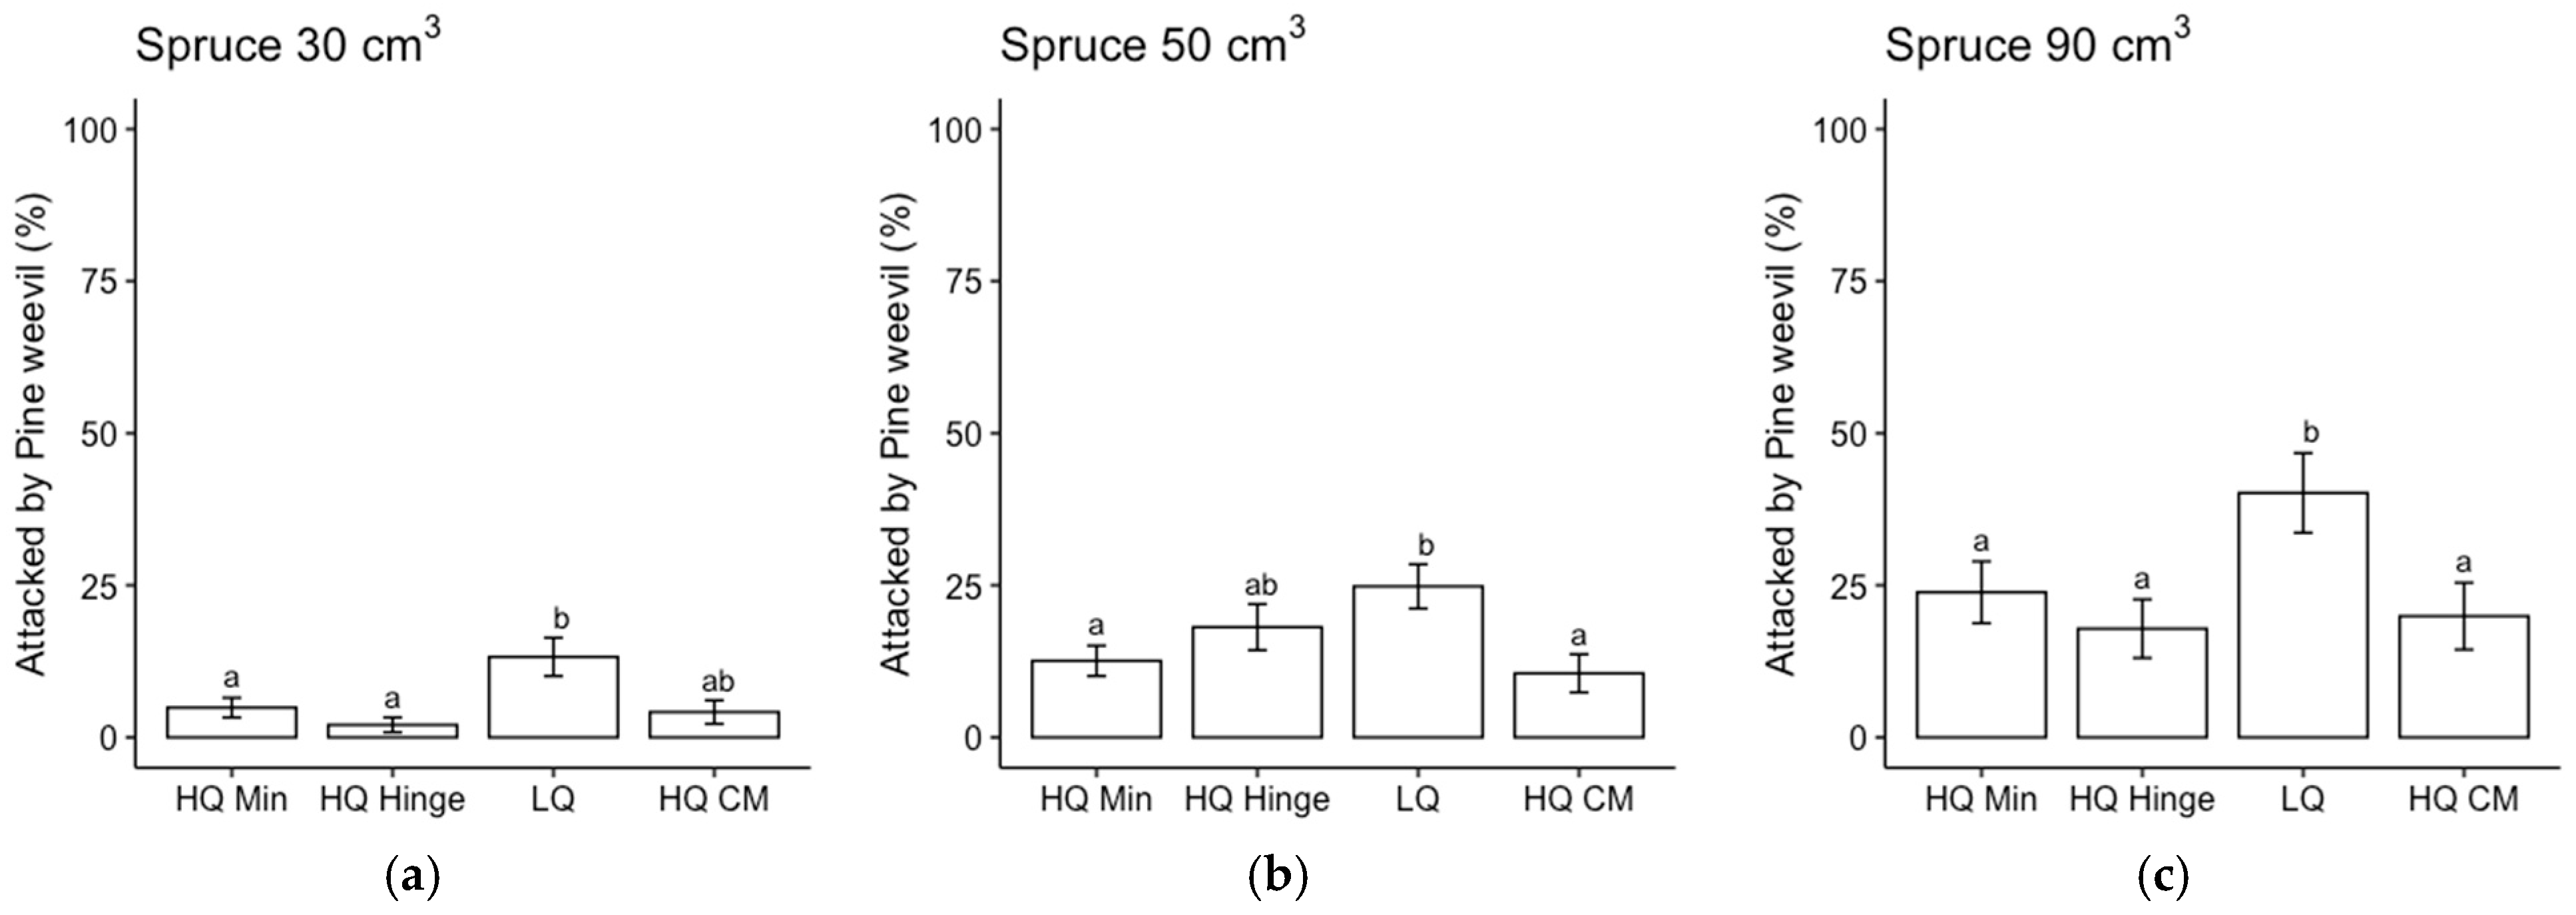
21]. However, mortality due to pine weevil damage was almost as high in the high-quality hinge positions for pine. Hence, survival in the high-quality hinge positions was lower than in the capped mounds for pine, while there was no significant difference in survival between the high-quality mineral soil and capped-mound positions. For spruce, there was no significant difference in survival between any of the three main positions as long as they were of high quality. This survival pattern was reflected by a higher attack frequency for seedlings planted in low-quality positions.
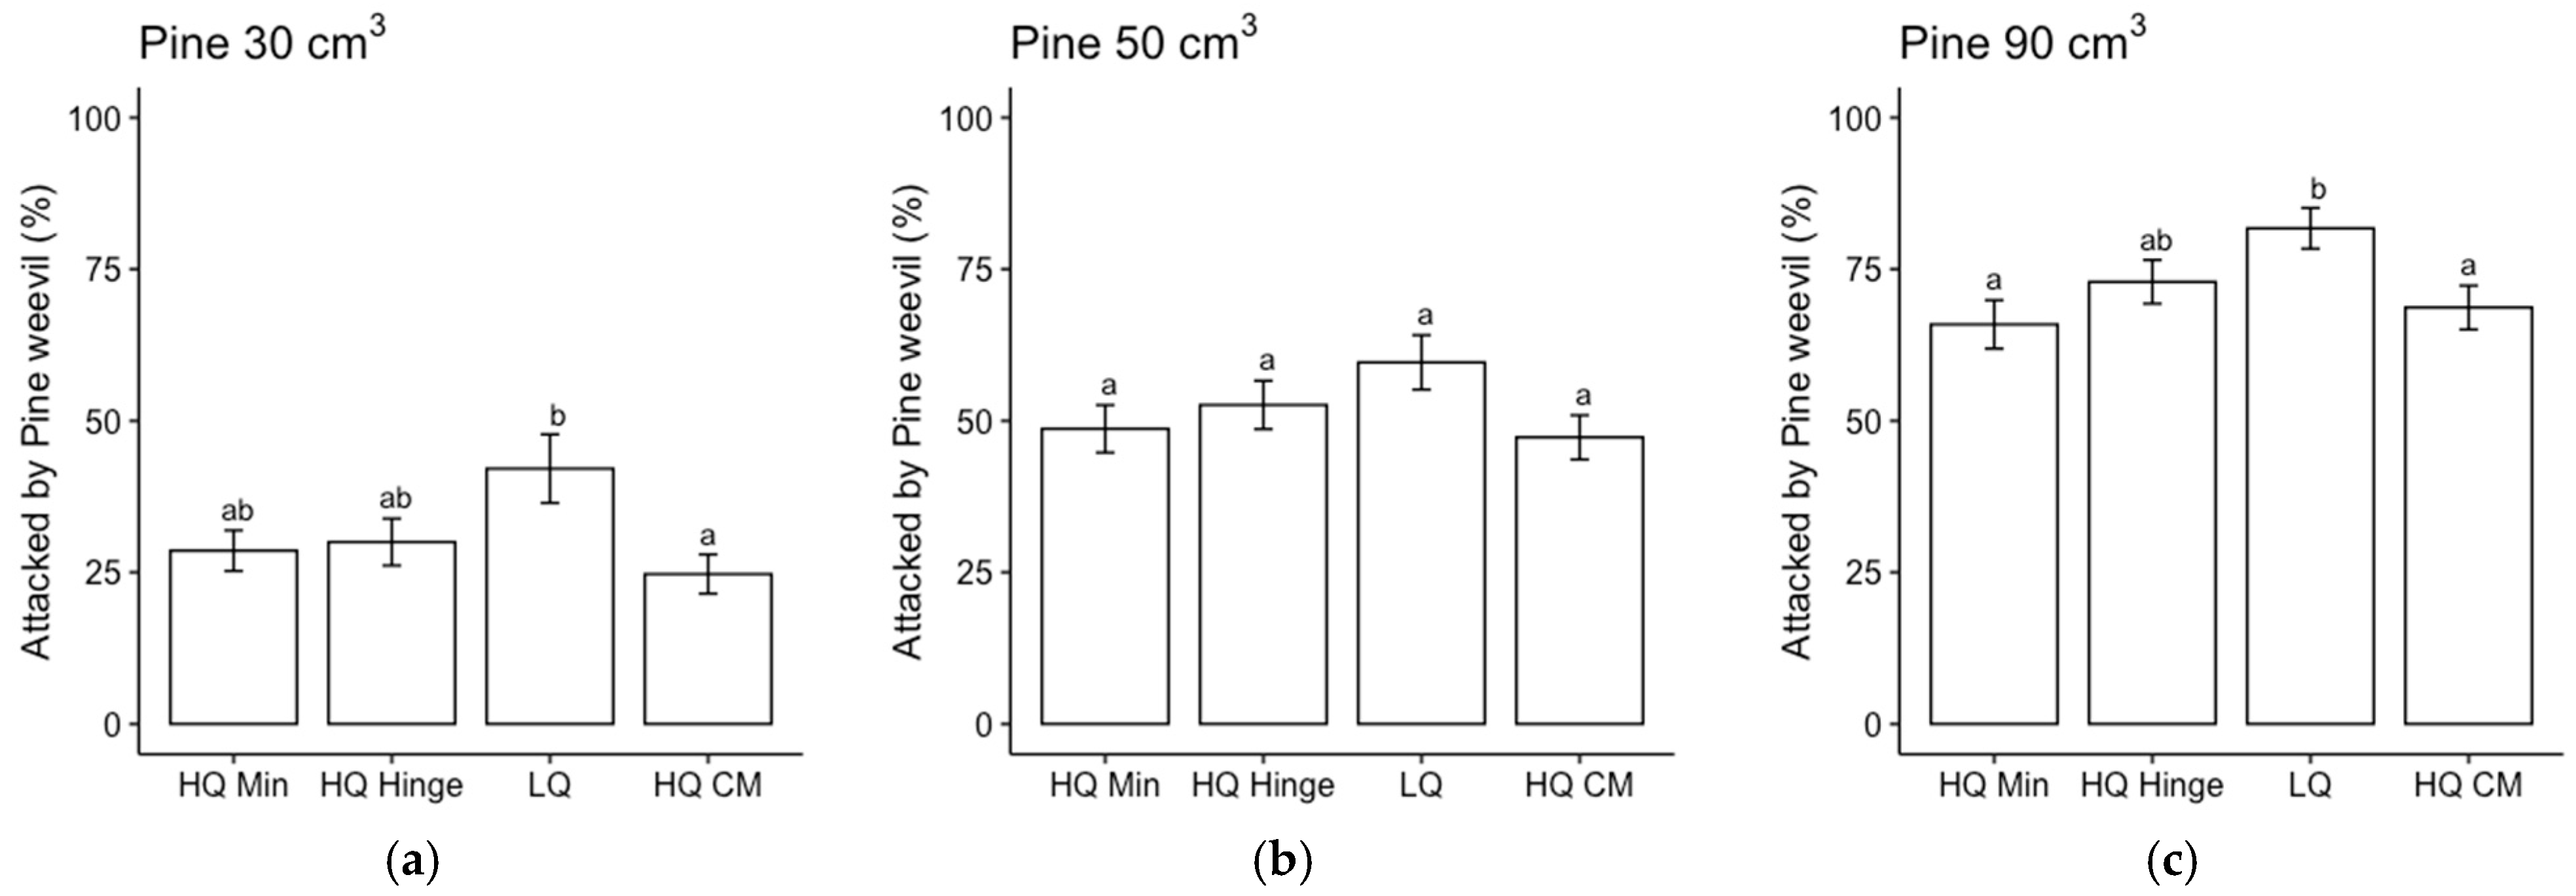
The frequency of pine weevil attacks increased with the seedling size for both species, in accordance with our second hypothesis. Despite a higher attack frequency, the larger seedlings did not exhibit any higher mortality rates compared to the smaller seedlings, indicating that they were able to cope with pine weevil attacks better than the smaller seedlings. This result is in line with previous research, in which larger seedlings attracted more pine weevil damage but exhibited no increase in mortality compared to smaller seedlings [5]. Pine weevil pressure increases with increasing temperature sum during the growing season and, in general, the harsher northern inland part of Sweden has less problems with pine weevil damage [5,32]. However, climate change is increasing the length of growing seasons over the whole country, so pine weevil pressure could potentially increase in more areas.
There was overall a higher attack frequency and higher mortality due to pine weevils for pine than for spruce, which might potentially alter trends associated with the positions in which the seedlings are more vulnerable (e.g., the number of pine weevils competing for the available seedlings may increase their attraction to otherwise less attractive feed sources). The difference in attack frequency between the tree species may, in part, be explained by the larger size of pine, since the 30 cm3 pine seedlings were approximately equal in dry weight to the 90 cm3 spruce seedlings. It could also be an effect of species preferences, since pine weevils prefer pine over spruce if both conifers are present [12,18]. However, there were also differences in environmental factors between the pine and spruce areas that may have had a direct or indirect effect on the pine weevil attack frequency in different planting positions. The pine area comprised more coarse soil (i.e., fractions larger than sand, including pebbles and stones of various sizes) than the spruce area, there were more mounds containing slash in the pine area, and there was a slightly higher soil moisture level in the spruce area. Soil microtopography has previously been found to affect pine weevils’ feeding behavior [33], and the occurrence of pine weevils has been found to correlate positively with the amount of slash (harvest residues) [34]. Hence, the pine area presented a coarser topography, which could potentially explain the higher mortality in the high-quality hinge positions for pine within the subset of plots for which these factors were assessed. Other biotic agents, such as red ants, can also decrease pine weevil damage [35]. Consequently, factors that affect red ants can have an extended effect on pine weevil damage. The spruce area had, overall, more plots closer to the adjacent forest than the pine area, which may have effects both on the pine weevils’ feeding behavior and red ant presence. The presence of ants was not recorded in our inventories but could be of interest in further studies.
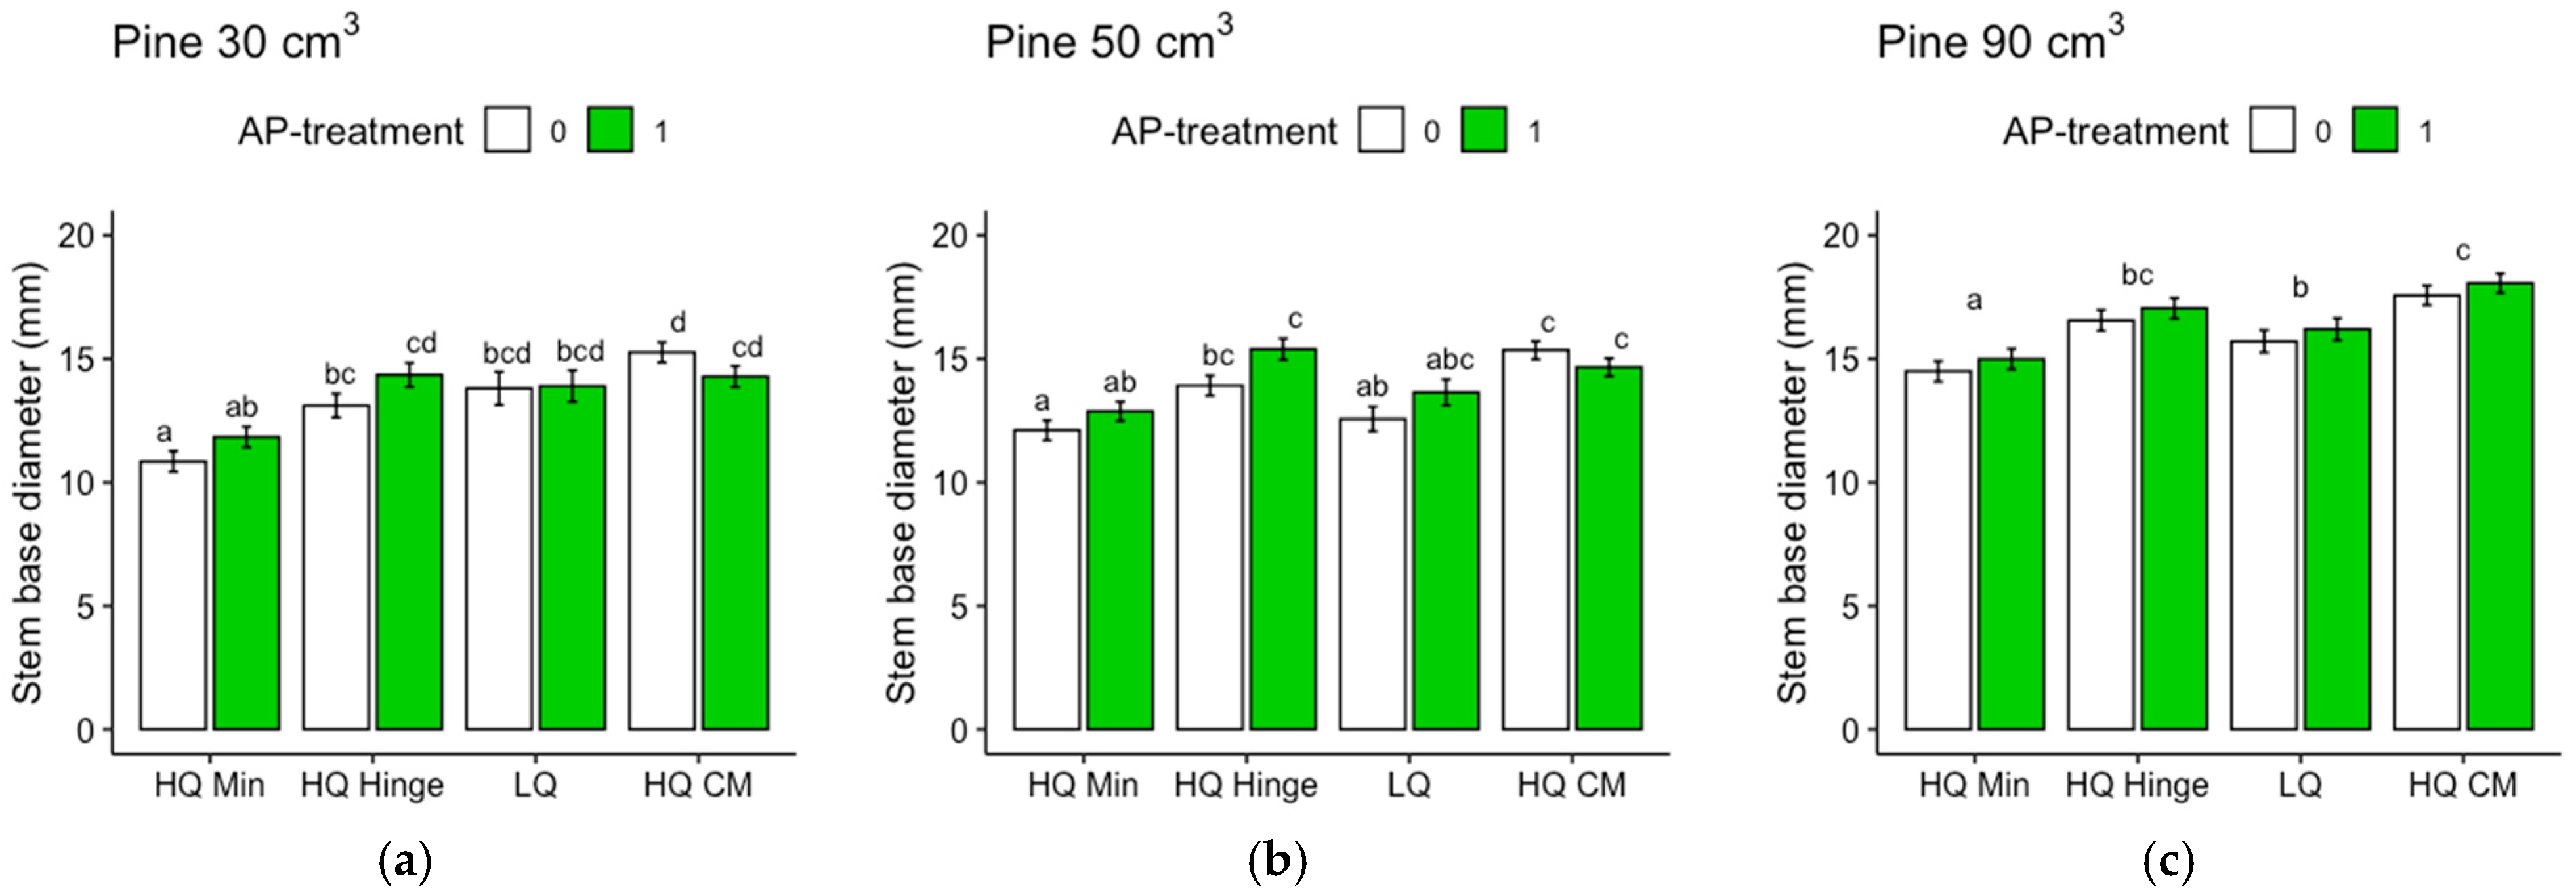
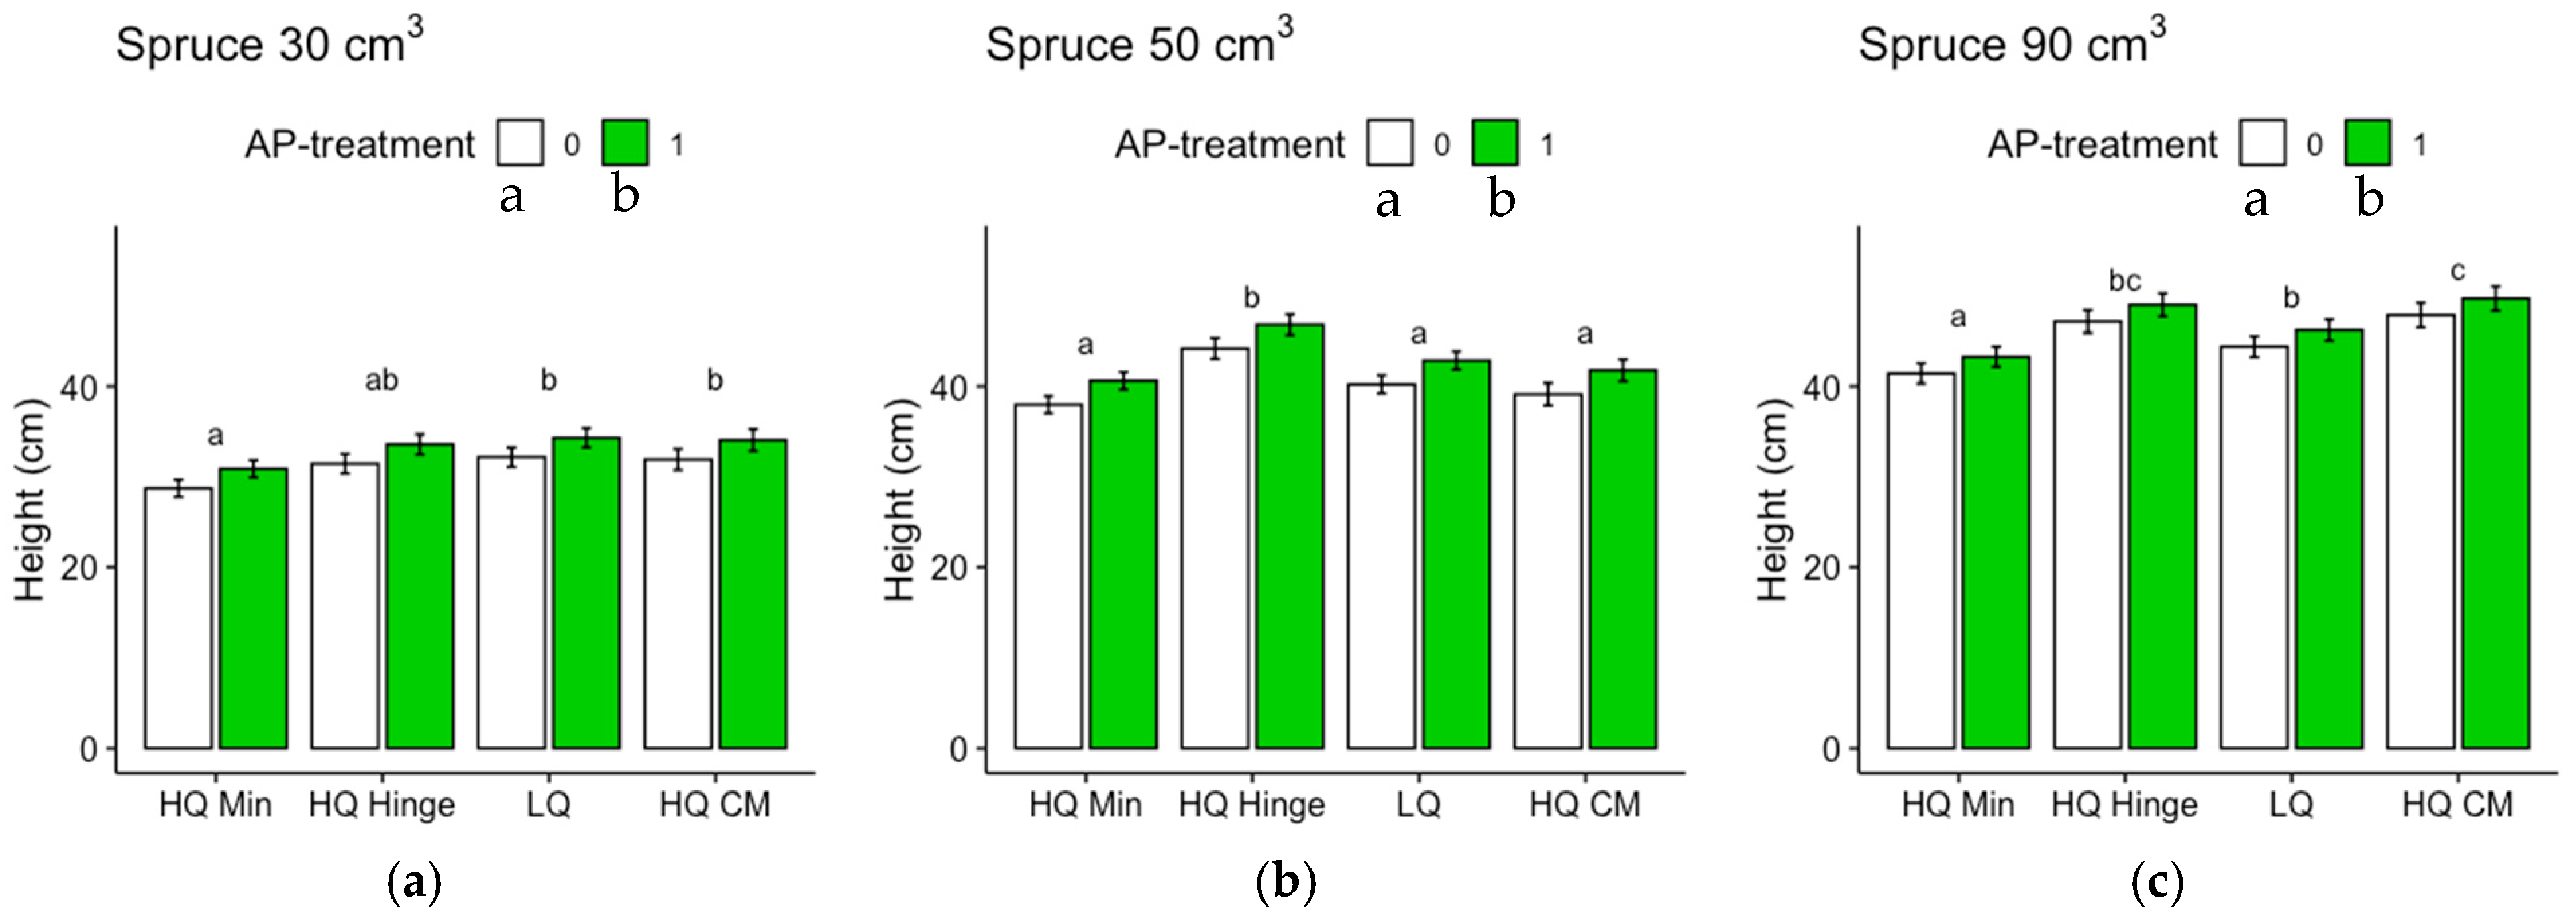
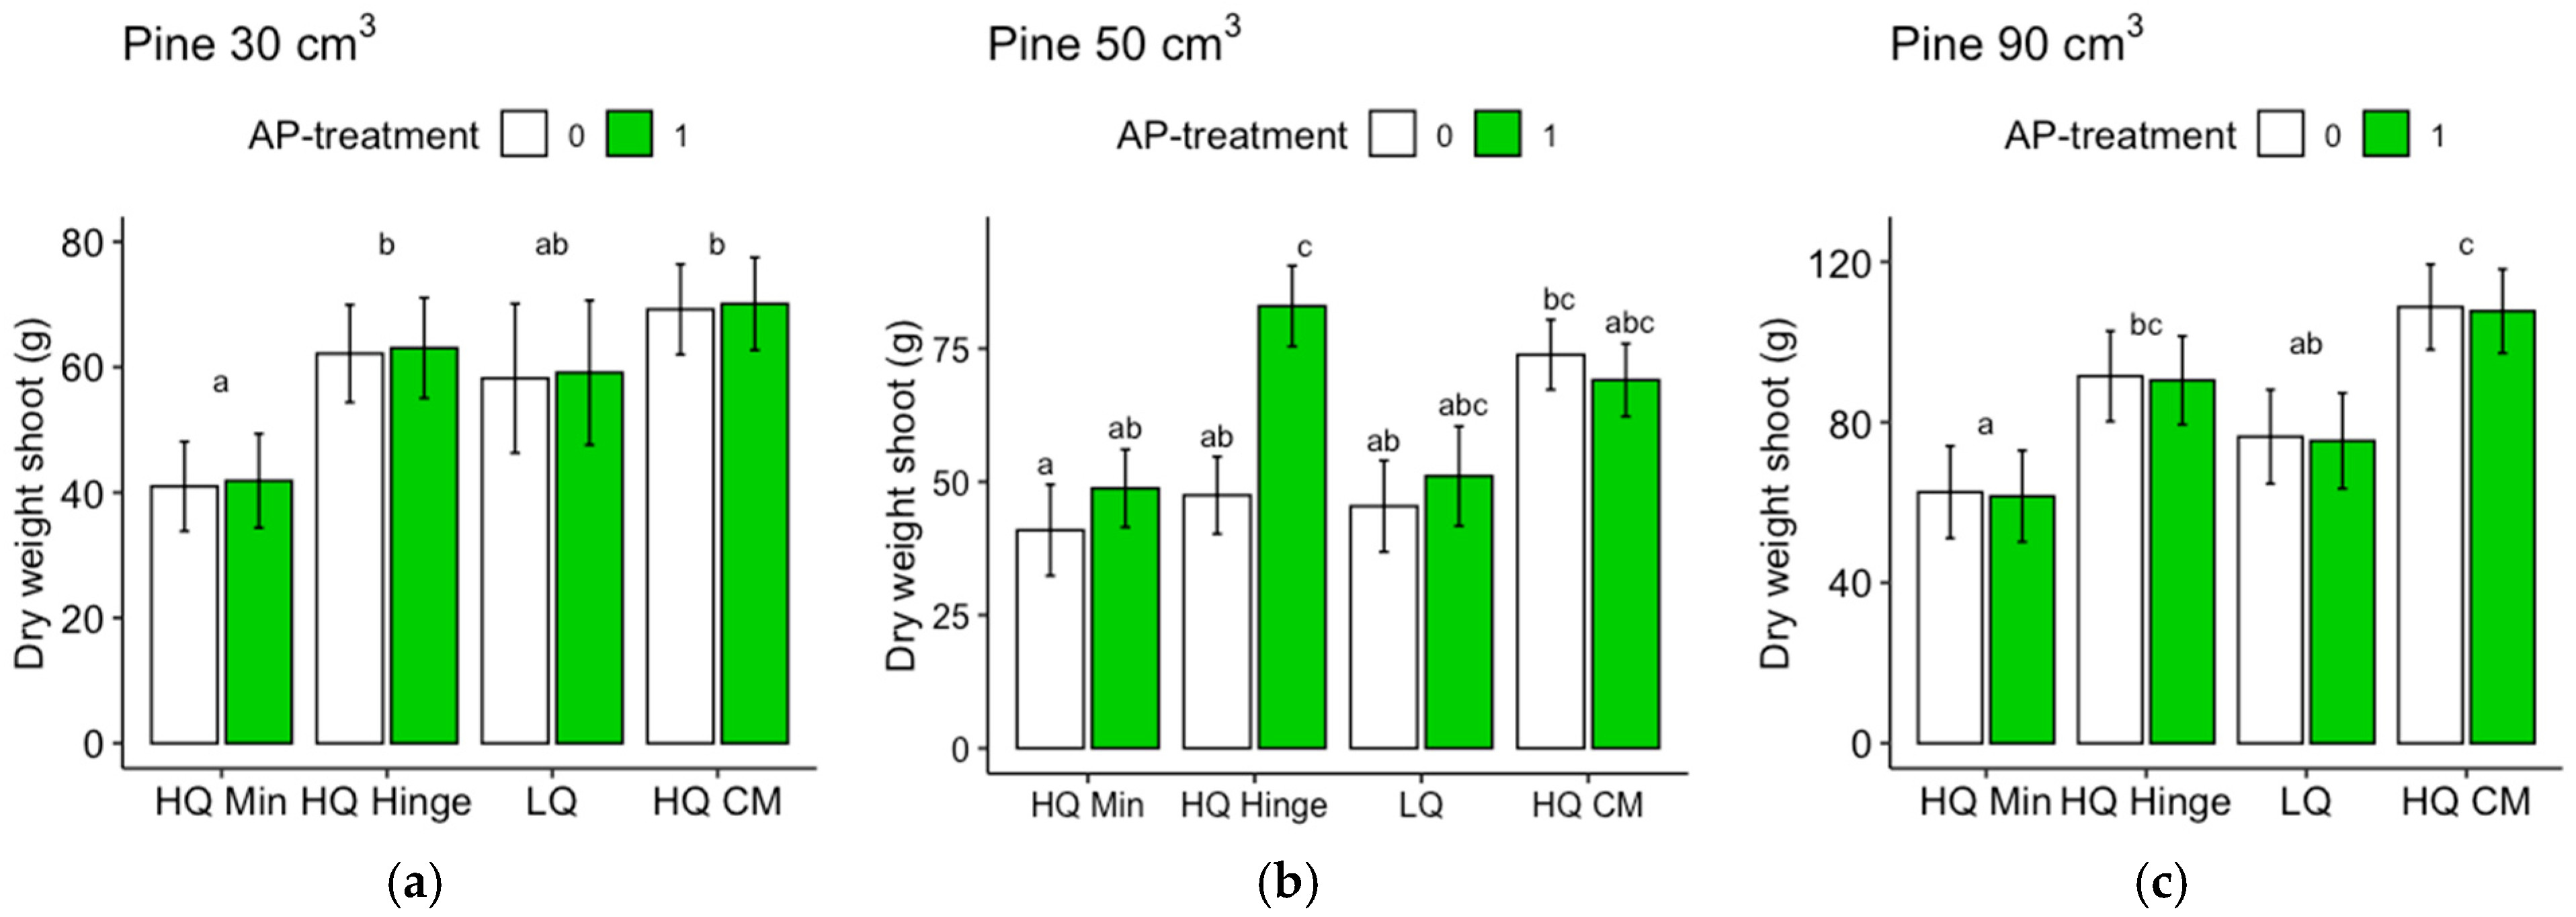
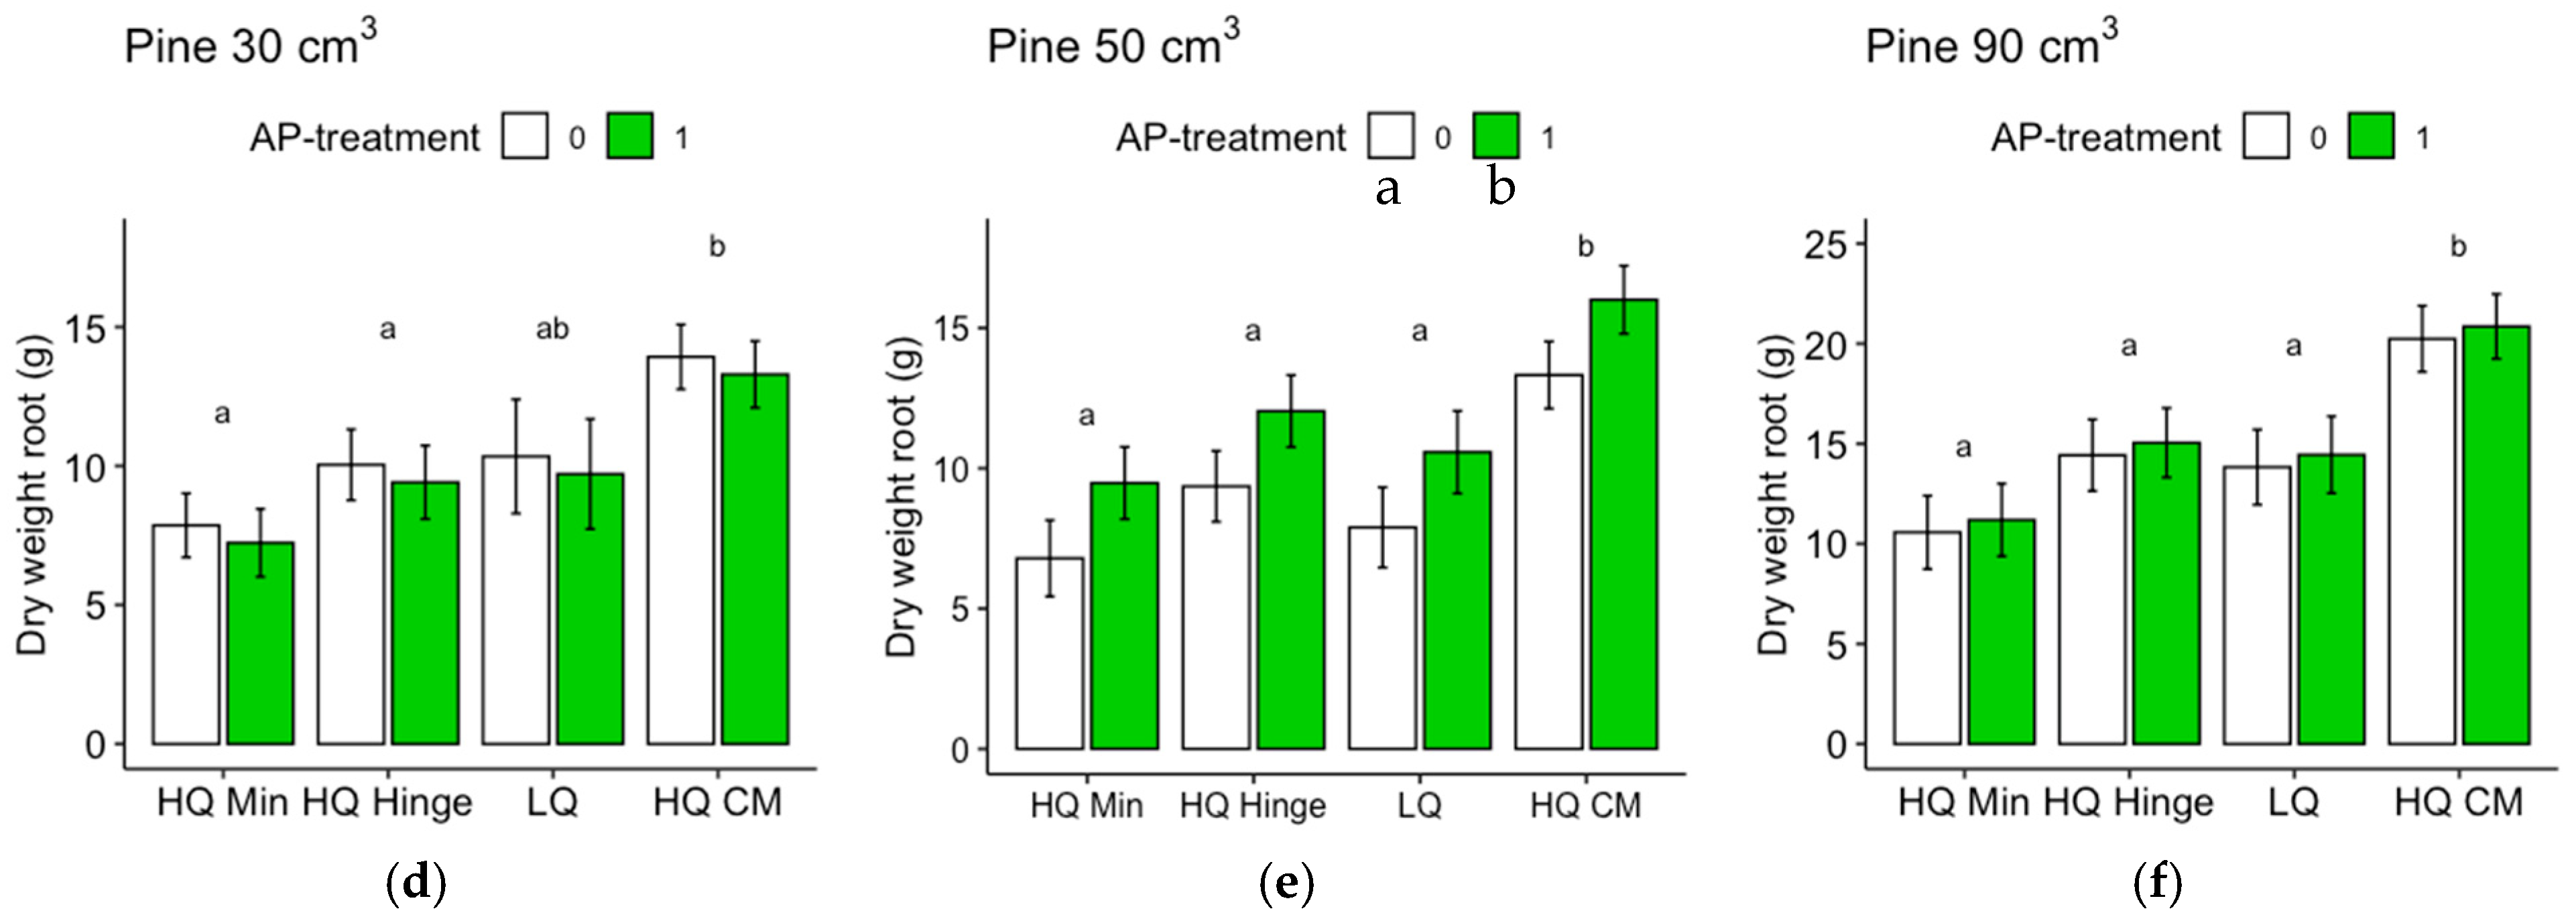
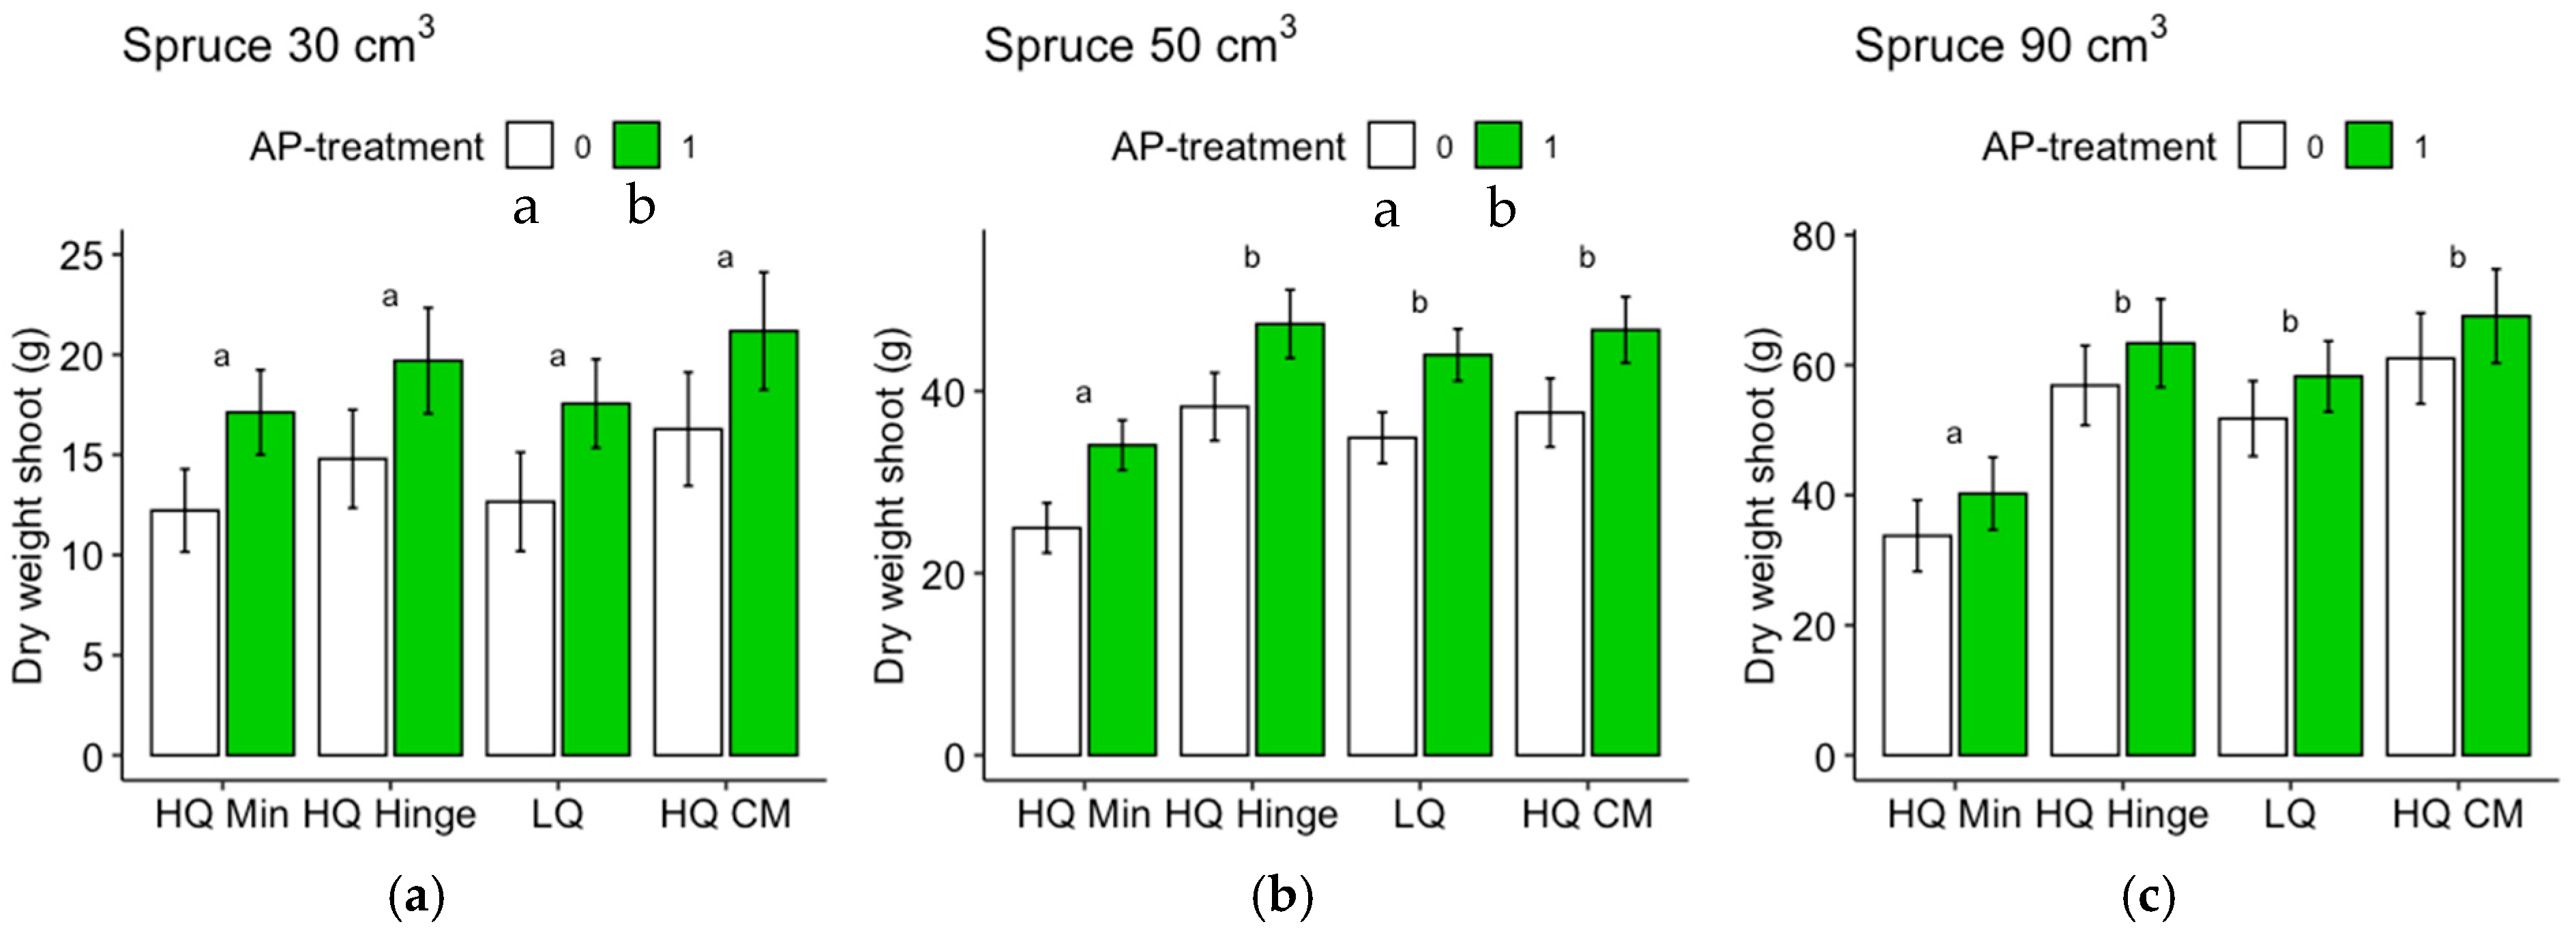
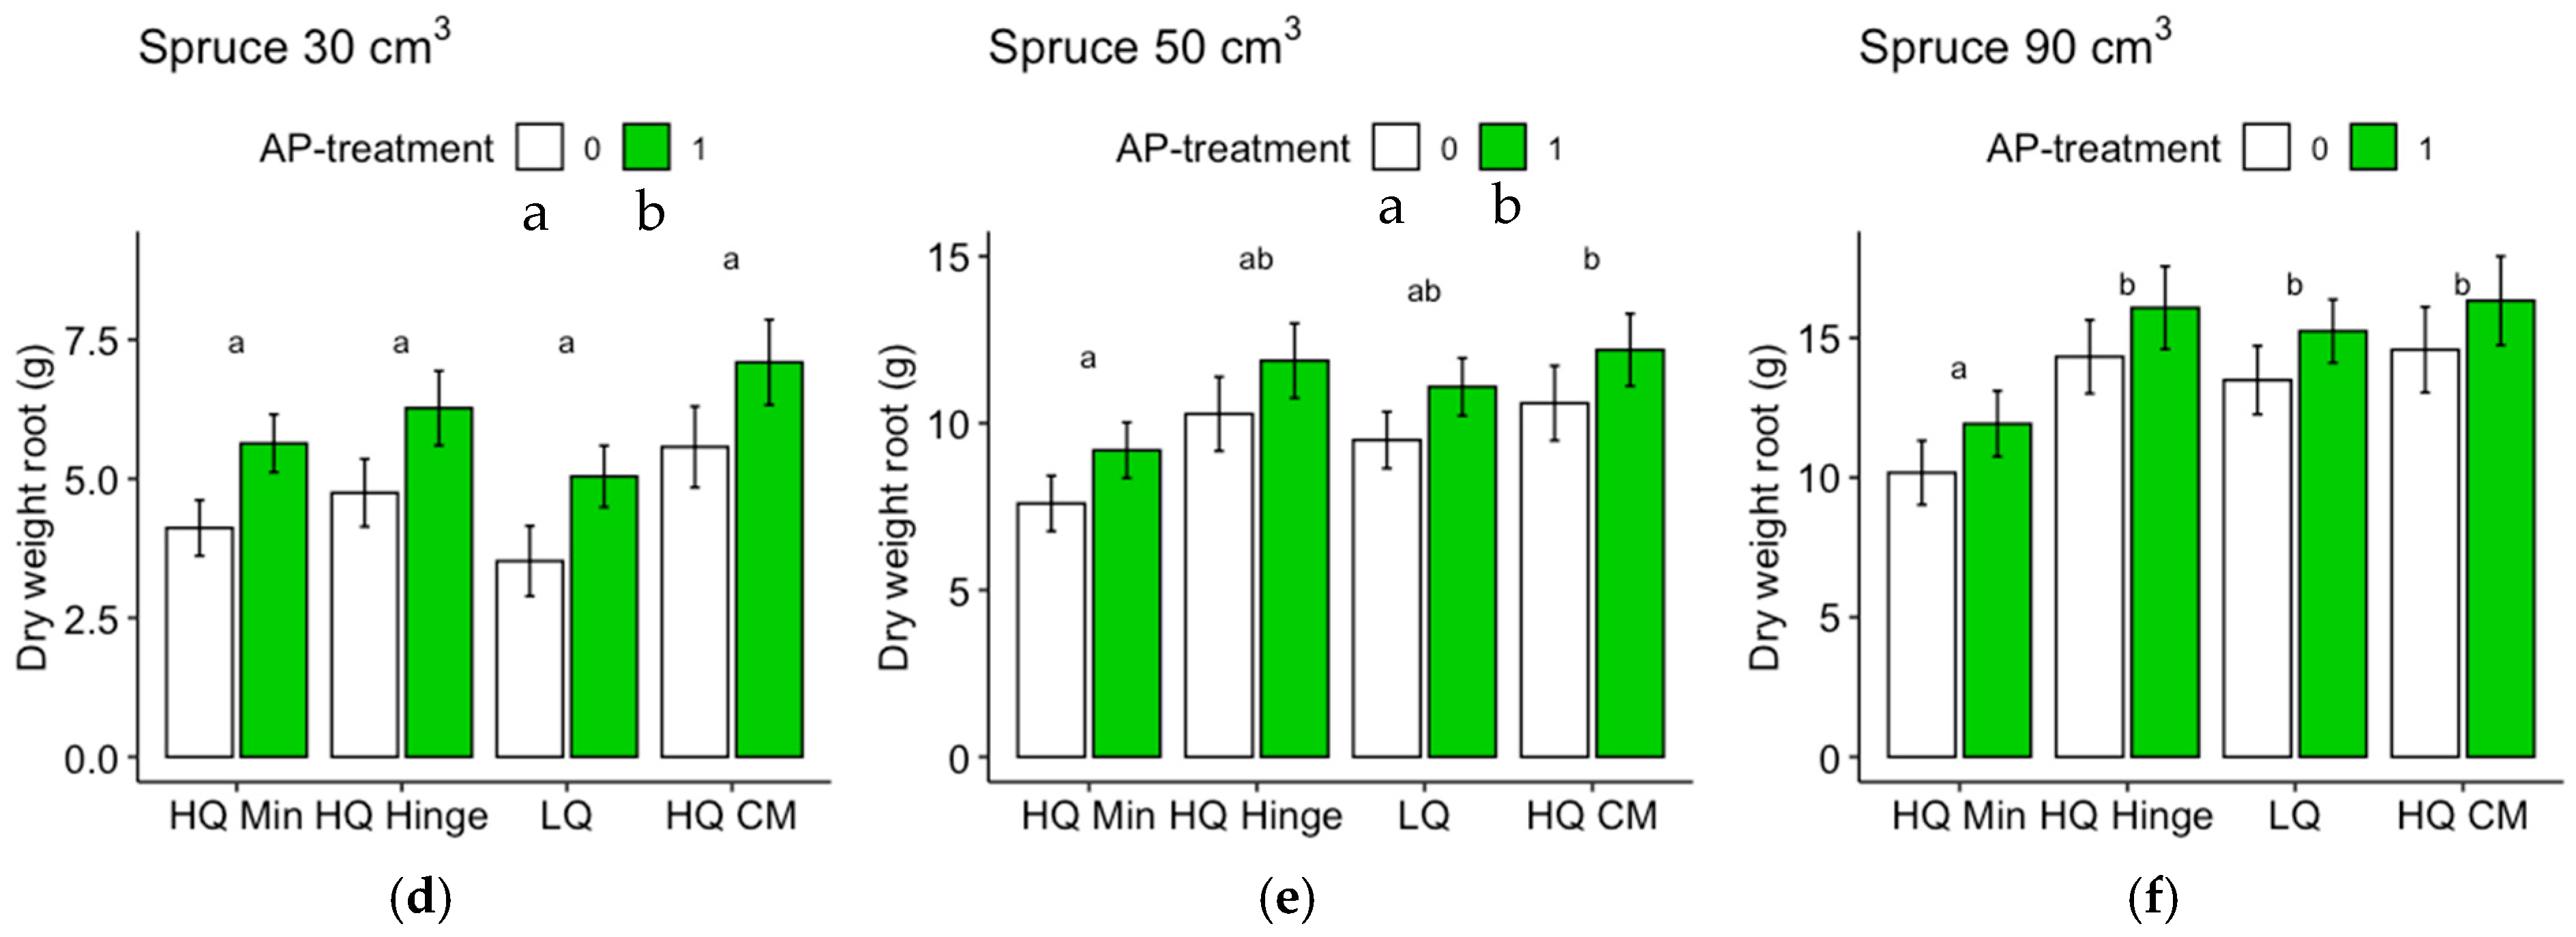
Seedlings, in general, grew less well in the mineral soil positions than in the capped-mound positions, except for the 50 cm3 spruce seedlings, in part corroborating our third hypothesis. However, growth in the high-quality hinge positions was similar to growth in the capped mounds, except for the untreated 30 cm3 pine seedlings. Growth in the low-quality positions was, in general, lower than in the mound positions, but only significantly for the 90 cm3 seedlings of both tree species and the untreated 50 cm3 pine. The effect of planting position on growth appeared greater for pine (up to 40% greater stem basal diameters for the smallest seedling size) than for spruce (up to 16% taller seedlings).
The increase in growth resulting from the AP treatment was marginal and depended on planting position for the 30 and 50 cm3 pine but was not significant for the 90 cm3 pine. However, for spruce, there was a small but significant effect on growth, irrespective of position or seedling size. The addition of AP improved growth so that the seedlings planted in mineral soil achieved similar growth to those planted in the hinge positions for the 30 and 50 cm3 pine and 30 cm3 spruce seedlings, but their growth was not equivalent to that of seedlings in the capped-mound positions, contrary to our fourth hypothesis. The small effect of AP treatment on growth did not fully compensate for the growth loss observed in the mineral soil compared to the seedlings in capped mounds, perhaps representing an insufficient increase in growth compared to the cost and extra effort required in the planting process. However, our results are only short-term, and this study does not show how the effects develop over subsequent years. Considering the potentially lower cost and ecological impact of mechanical soil preparation when patch scarification is used instead of mounding on dry sites, AP treatment could also be seen as a tool to increase growth in mineral soil positions to compensate for potential growth loss compared to capped mounds. Whether this would be economically beneficial or not is a topic for further studies.
Regardless of AP treatment, the option to plant in mineral soil in dry conditions could guarantee more water to seedlings. This would be true for the hinge positions as well, where the seedlings, in general, also grew better than in the mineral soil and equally well as those in the capped mounds (with the exception of the 30 cm3 pine). The relatively high risk of pine weevil damage in the hinge positions for pine found in this study may be different with other site conditions, but should also be considered if the site is within a pine-weevil-dense area. However, if the chosen method was a mechanical soil preparation method that does not aim to make capped mounds, hinges would not be present either.
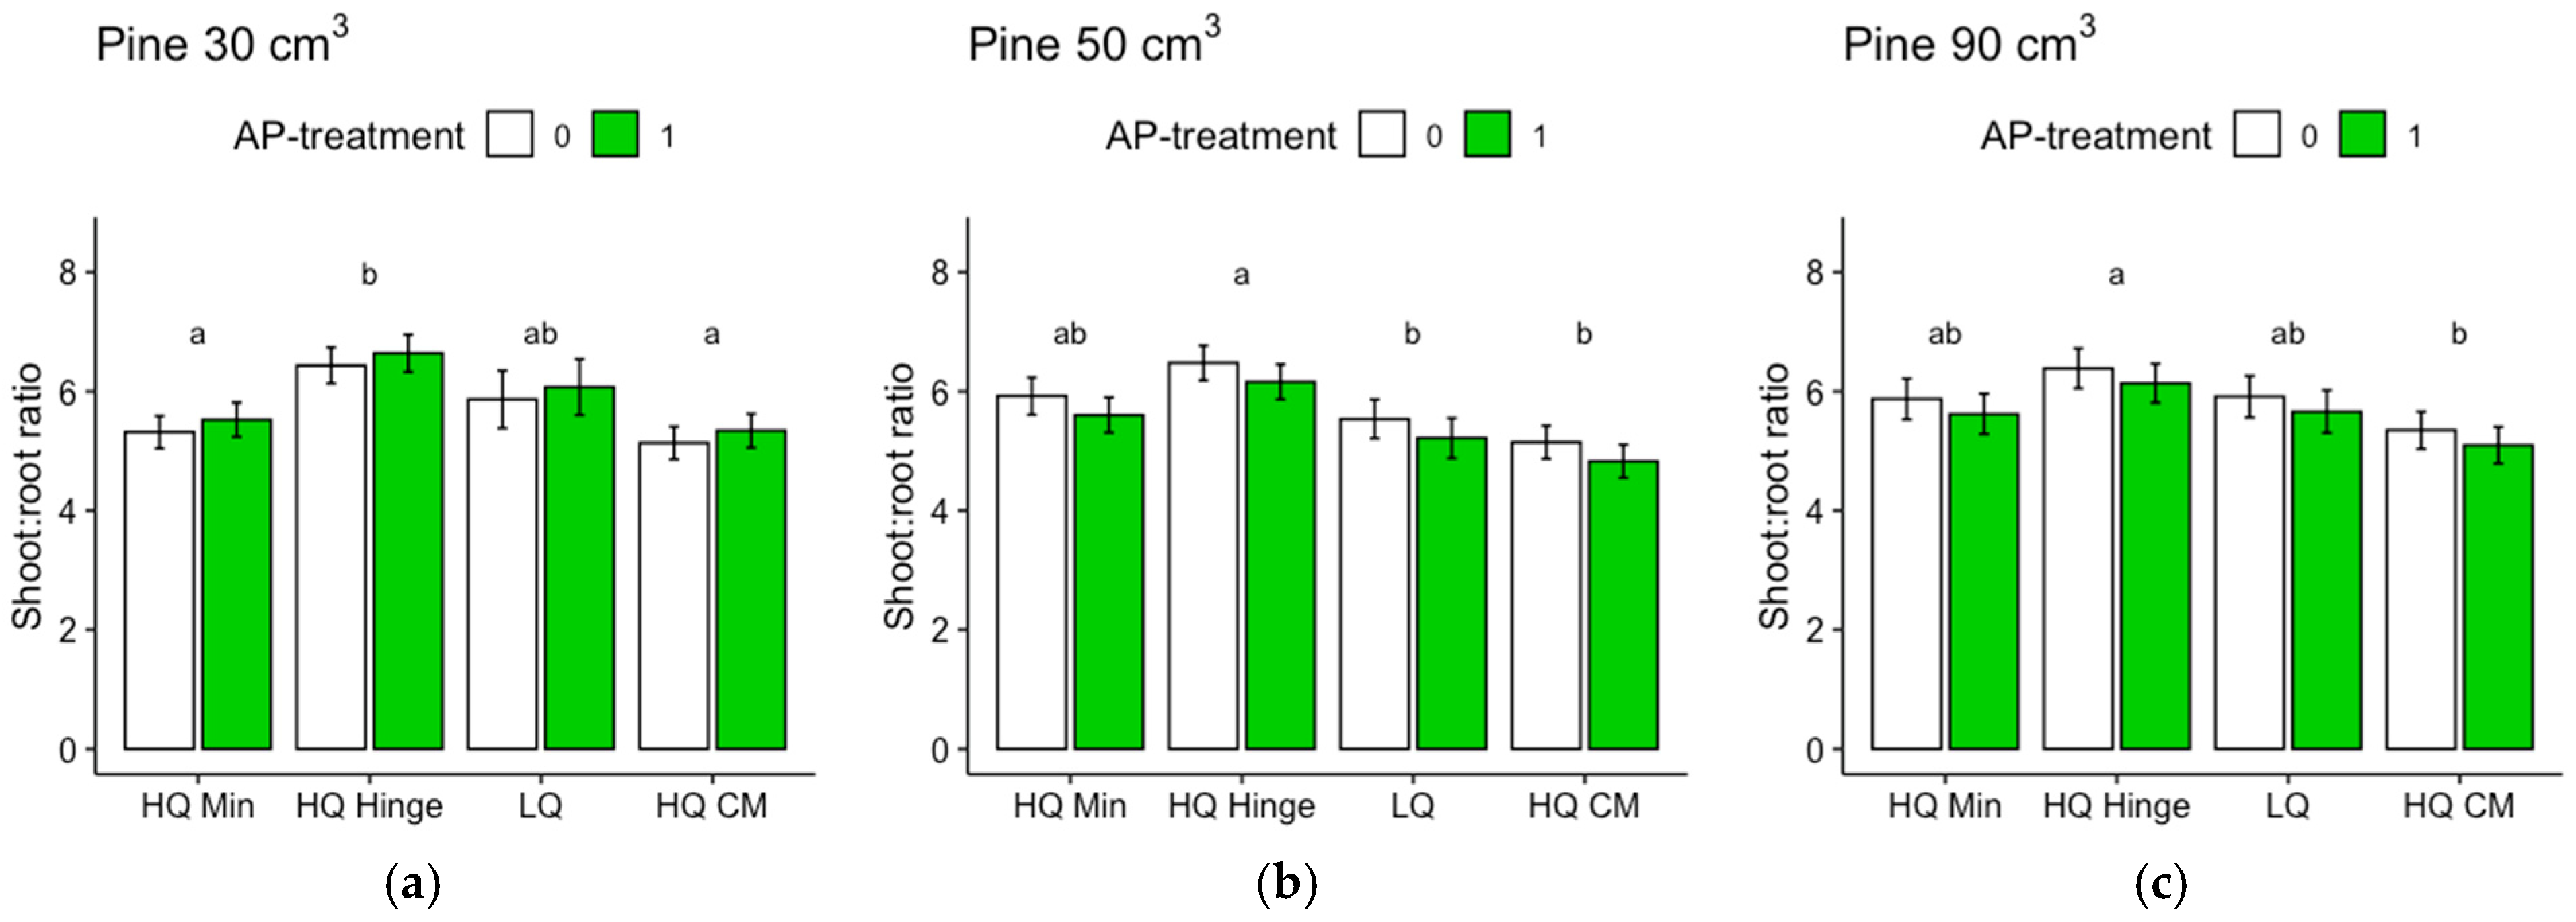
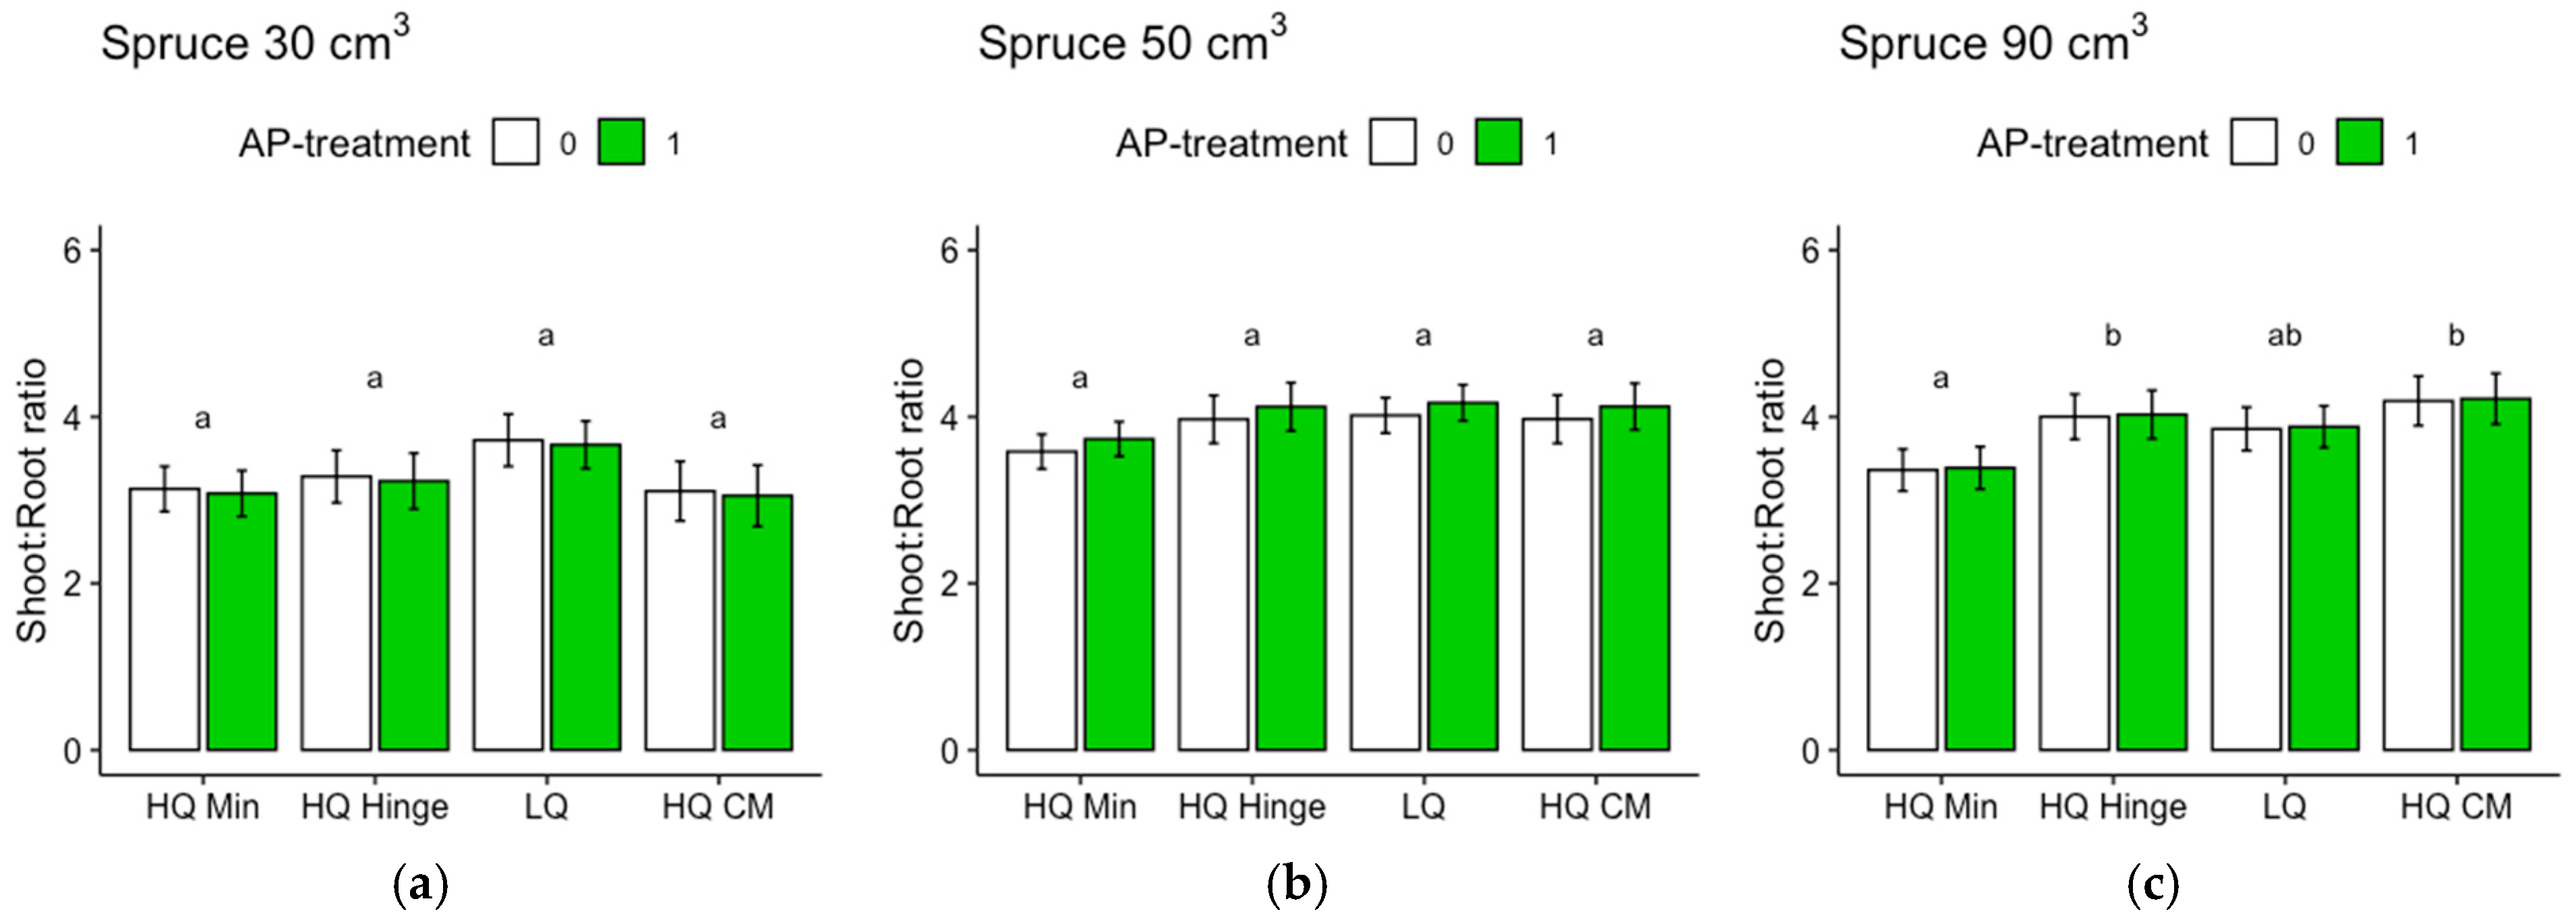
Regarding the analyses of the shoot–root ratios based on the dry weights, it should be noted that the root weights of the harvested seedlings were underestimated, since roots that grew far away from the seedlings were too difficult to dig up. Therefore, the difference between pine and spruce could, in part, be due to different root morphologies. Nevertheless, the analyses give an indication of the growth distribution above and below ground, which is seldom assessed in field studies. The harvested spruce seedlings had lower shoot–root ratios than pine, suggesting that the spruce grew relatively more below ground compared to pine, as shown by the shoot–root ratio of pine increasing by approximately three times the original ratio, while for spruce, the ratio only almost doubled. The shoot–root ratio of pine was highest in the hinge positions for all three sizes. This may potentially indicate that in this position, there is a balance between the water and nutrient availability that allows the seedlings to spend comparatively more resources on shoot growth than on root growth.
The capped-mound position has, in Swedish forest regeneration, long been considered the optimal planting position. Based on the survival and growth results in this study and other studies in which seedlings performed well in capped mounds, it may seem like this is indeed the optimal planting position. It should, in this context, also be noted that the total precipitation during the first month following planting was ~39 mm at the closest SMHI weather station, Torrböle D, ~20 km from the study site (SMHI 2023), which is sufficient for water supply from above. If, instead, there had been a dry month, mortality would probably have been higher for the capped-mound positions, since seedlings planted in mounds are more dependent on precipitation [9,36].
Mounding is a method that is most appropriate for moist and/or flat sites with fine soil where the seedlings have the advantage of elevation, especially to improve soil aeration. At such sites, lower-elevation planting positions would be at risk of oxygen deficiency in their roots [8,9]. It is also important to remember that the ideal positioning of the seedling root substrate, as presented in Figure 1b, is rarely achieved. In practice, capped mounds are highly heterogenous due to the high variation in site conditions. In practice, it is often difficult to plant the seedling deep enough due to stoniness or other obstacles. Furthermore, it not possible to assess the interior of each capped mound to ensure the seedling root substrate position. On dry to mesic sites with permeable soil, patch scarification may be sufficient, considering that the effort expended in making capped mounds does not always result in sufficient suitable planting spots in the actual mounds. In addition, the risk of capped mounds being too dry when there is limited precipitation during the establishment phase would be avoided.
Furthermore, instructing planters not to prioritize capped mounds on dry sites would logically decrease the risk of planting in low-quality positions, considering our results in which there was a lower risk of choosing low-quality positions in mineral soil than in hinge and capped-mound positions. The proportion of low-quality positions based on the total percentage for each main planting position in our study was approximately 15% for the mineral soil positions, 28% for the hinge positions, and 31% for the capped-mound positions (averaged over the classifications for pine and spruce).
As a final remark, the results in our study, as well as other trial case studies, are likely biased towards a better outcome than in a commercial regeneration situation, where the variability of planting position quality might be higher. Within-site variation, including the number of suitable planting spots and water availability, affects the survival of seedlings [37]. We actively avoided planting positions where the mounds were of insufficient quality (e.g., not compacted due to the interference of branches, logs, or other obstacles). The maximum potential number of planting positions for each tree species in this study would, in theory, be approximately 1000, based on the maximum number of seedlings in a row. In reality, 633 triplets of pine and 643 of spruce were planted, i.e., only 60% in the pine area and 64% in the spruce area of potential planting positions were used in this trial. The remaining potential planting positions were either of poor quality (e.g., not compacted due to the interference of branches, logs, or other obstacles) or absent (e.g., where the mechanical soil preparation failed due to obstacles).
Where a seedling ends up being planted depends on the planting performance as well as the availability of high-quality planting positions. Planters are generally paid per planted seedling, and to consider the planting positions as carefully as in this trial would be too time-consuming for them. The availability of high-quality positions also depends on the MSP method and performance, which, in turn, is highly dependent on local site conditions.

5. Conclusions

Pine weevils were the main agents of damage and mortality, with sufficient rainfall during the first month after planting decreasing the risk for drought damage. The quality of the planting positions affected the outcome of survival more than the choice of mineral, hinge, or capped-mound positions for pine and spruce seedlings following three growing seasons after planting. Planting larger seedlings had no beneficial effect on survival. Although not affecting their mortality, larger seedlings attracted more pine weevil damage than smaller seedlings. Seedlings grew more in the hinge and capped-mound positions than in mineral soil, except for the 50 cm3 spruce, which grew more in hinge positions than in capped mounds and mineral soil positions. The addition of arginine–phosphate had a small but significant effect on all seedling sizes for spruce, while there was an interaction with the planting position for the smaller pine sizes and no effect for the 90 cm3 pine seedlings. The effect did not compensate fully for the lower nutrient availability in the mineral soil positions compared to the capped mounds on this site. On other sites, there might be other conditions that would give different results; hence, more studies of the effects of arginine–phosphate in different planting positions and with different seedling materials over varying site conditions would be needed to expand the applicability of these results.

Supplementary Materials

The following supporting information can be downloaded at https://www.mdpi.com/article/10.3390/f15040703/s1: Table S1: Field data for pine; Table S2: Field data for spruce; Table S3: Harvested pine; Table S4: Harvested spruce; Table S5: Metadata; Table S6: Classification plant positions.

Author Contributions

Conceptualization, J.H., J.Ö., A.N. and B.H.; methodology, B.H.; validation, J.H., J.Ö., A.N. and B.H.; formal analysis, B.H.; investigation, J.H., J.Ö. and B.H.; resources, J.H. and J.Ö.; data curation, B.H.; writing—original draft preparation, B.H.; writing—review and editing, A.N., J.Ö. and J.H.; visualization, B.H.; supervision, A.N., J.H. and J.Ö.; project administration, J.H., J.Ö., B.H.; funding acquisition, A.N. and J.Ö. This manuscript is part of a Ph.D. thesis by the first author, available online at https://doi.org/10.54612/a.4flnp33t7i. All authors have read and agreed to the published version of the manuscript.

Funding

This project was funded by the Kempe Foundation under grant number SMK-1951, the Knut and Alice Wallenberg Foundation under grant number KAW 2016.0341, KAW 2018.0259, and the Swedish Governmental Agency for Innovation Systems under grant number 2016-00504. The funding for B.H.’s PhD position was provided by the Research School in Forest Genetics, Biotechnology, and Breeding at the Umeå Plant Science Centre, UPSC, at the Swedish University of Agricultural Sciences (SLU), being part of the Competence Centre program of the Swedish Governmental Agency for Innovation Systems (VINNOVA).

Data Availability Statement

The original contributions presented in this study are included in the Supplementary Materials; any further inquiries can be directed to the corresponding author.

Acknowledgments

We thank the field staff at Skogforsk for carrying out the planting, inventorying, and harvesting of the seedlings, as well as preparation of the harvested seedlings at the Skogforsk station in Sävar. We also thank the landowner, Holmen, for allowing us to use their land for our experiment.

Conflicts of Interest

A.N. is, besides her affiliation to the Swedish University of Agricultural Sciences, employed at Stora Enso, a forest industry company. J.Ö., J.H., and B.H. declare no conflicts of interest. The funders had no role in the design of the study; in the collection, analyses, or interpretation of data; in the writing of the manuscript; or in the decision to publish the results.

Appendix A

For the harvested seedlings, we compared the height and stem base diameter field measurements, made before the harvest, to the dry weights using linear regression models. The relationship is not truly linear, but the purpose of these models is to evaluate which measurement best represents the mass of the seedlings. For spruce, the height represented the shoot and root dry weights better for the smallest seedlings and the root dry weight of the largest seedlings, while the stem base diameter better represented the shoot and root dry weights for the medium-sized seedlings and the shoot dry weight of the larger seedlings. However, stem base diameter measurements were missing for half of the spruce seedlings. As the relationship to dry weight was similar for the spruce height and diameter measurements, we therefore chose to use spruce height in the analyses. For pine, the relationship between the height and dry weight was much weaker than the relation between the stem base diameter and dry weight for all three sizes. We therefore chose to use the pine stem base diameter in the analyses.
Figure A1. Regression models for root dry weights of Scots pine (Pinus sylvestris L.) of the three sizes (1 = 30 cm3, 2 = 50 cm3, 3 = 90 cm3), respectively, vs. their (a) heights measured in field and (b) stem base diameters measured in field (i.e., measurements made before harvest).
Forests 15 00703 g0a1
Figure A2. Regression models for the shoot dry weights of Scots pine (Pinus sylvestris L.) of the three sizes (1 = 30 cm3, 2 = 50 cm3, 3 = 90 cm3), respectively, vs. their (a) heights measured in field and (b) stem base diameters measured in field (i.e., measurements made before harvest).
Forests 15 00703 g0a2
Figure A3. Regression models for the root dry weights of Norway spruce (Picea abies (L.) Karst) of the three sizes (1 = 30 cm3, 2 = 50 cm3, 3 = 90 cm3), respectively, vs. their (a) heights measured in field and (b) stem base diameters measured in field (i.e., measurements made before harvest).
Forests 15 00703 g0a3
Figure A4. Regression models for the shoot dry weights of Norway spruce (Picea abies (L.) Karst) of the three sizes (1 = 30 cm3, 2 = 50 cm3, 3 = 90 cm3), respectively, vs. their (a) heights measured in field and (b) stem base diameters measured in field (i.e., measurements made before harvest).
Forests 15 00703 g0a4

Appendix B

Shoot and root dry weights are presented separately along with ANOVA tables from the separate analyses. As pointed out in the main text, the shoot weights do not include the entire root system as it was increasingly difficult to dig out roots the further away from the seedling they grew. For pine, the effect of the AP addition was only significant for the 50 cm3 seedlings, including an interaction with the shoot dry weight, while being significant on its own for the root dry weight. The extreme increase in dry weight for the 50 cm3 pine seedlings in the hinge positions from AP treatment was related to the high number of seedlings with multiple leading shoots in the hinge positions among the 50 cm3 pine seedlings. Naturally, a higher number of leading shoots will lead to a greater dry weight. For the harvested seedlings, the number of leading shoots was counted, and there were many seedlings with more than four leading shoots. For spruce, AP addition had a significant effect on both the shoot and root dry weights of the two smaller seedling sizes.
Figure A5. Results from ANOVAs for the harvested Scots pine (Pinus sylvestris L.) seedling shoot and root dry weights, for seedlings of (a,d) 30 cm3, (b,e) 50 cm3, and (c,f) 90 cm3 sizes and for each planting position group, respectively, following the third growing season. Columns indicate the dry weight in g and error bars indicate the standard error. Different letters indicate significant differences. To indicate when there was an interaction between the factors, letters are displayed above each column; to show when there was no interaction, letters are displayed above each planting position group. HQ Min = high-quality mineral soil positions; HQ Hinge = high-quality hinge positions; LQ = low-quality positions; HQ CM = high-quality capped-mound positions.
Forests 15 00703 g0a5aForests 15 00703 g0a5b
Table A1. Results from ANOVAs (type II/III Wald F tests with Kenward–Roger df) on linear mixed models for the root and shoot dry weights, respectively, of Scots pine (Pinus sylvestris L.) seedlings following the third growing season in the field. Significant results are highlighted in bold.
Pine (Shoot Dry Weight)Pine (Root Dry Weight)
Size FactorDfFDf.resPr(>F)FDf.resPr(>F)
30 cm3Position36.15138.36<0.0018.59139.84<0.001
AP10.03137.880.870.39138.20.53
Position–AP3------
50 cm3Position36.22144.05<0.0019.32146.04<0.001
AP14.30142.330.047.32144.180.007
Position–AP33.02144.030.03---
90 cm3Position37.99140.9<0.00110.48141.79<0.001
AP10.02139.30.890.22139.520.64
Position–AP3------
Figure A6. Results from ANOVAs for the harvested Norway spruce (Picea abies (L.) Karst) seedling shoot and root dry weights, for seedlings of (a,d) 30 cm3, (b,e) 50 cm3, and (c,f) 90 cm3 sizes and for each planting position group, respectively, following the third growing season. Columns indicate the dry weight in g and error bars indicate the standard error. The different letters displayed above each planting position group indicate significant differences between these groups averaged across the treatments, while letters under the treatment legend indicate significant effects of treatment averaged over the levels of planting position groups. HQ Min = high-quality mineral soil positions; HQ Hinge = high-quality hinge positions; LQ = low-quality positions; HQ CM = high-quality capped-mound positions.
Forests 15 00703 g0a6aForests 15 00703 g0a6b
Table A2. Results from ANOVA (Type II Wald F tests with Kenward-Roger df) on linear mixed models for shot and root dry weight of Norway spruce (Picea abies (L.) Karst) seedlings following the third growing season in the field, for each seedling size, respectively. Significant results are highlighted in bold. For spruce, there were no significant interactions, so this component was removed from the models.
Spruce (Shoot Dry Weight)Spruce (Root Dry Weight)
SizeFactorDfFDf.resPr(>F)FDf.resPr(>F)
30 cm3Position30.8090.060.501.8875.1290.14
AP16.6188.840.018.4490.520.005
50 cm3Position37.43160.65<0.0013.93160.460.01
AP114.48159.97<0.0015.23159.840.02
90 cm3Position38.33138.96<0.0014.51139.560.005
AP12.26136.790.142.97137.250.09

References

  1. SLU. Skogsdata 2023; SLU Institutionen för Skoglig Resurshushållning: Uppsala, Sweden, 2023. [Google Scholar]
  2. Burdett, A.; Simpson, D.; Thompson, C. Root development and plantation establishment success. Plant Soil 1983, 71, 103–110. [Google Scholar] [CrossRef]
  3. Grossnickle, S.C. Why seedlings survive: Influence of plant attributes. New For. 2012, 43, 711–738. [Google Scholar] [CrossRef]
  4. Burdett, A.N. Physiological Processes in Plantation Establishment and the Development of Specifications for Forest Planting Stock. Can. J. For. Res. 1990, 20, 415–427. [Google Scholar] [CrossRef]
  5. Johansson, K.; Hajek, J.; Sjölin, O.; Normark, E. Early performance of Pinus sylvestris and Picea abies—A comparison between seedling size, species, and geographic location of the planting site. Scand. J. For. Res. 2015, 30, 388–400. [Google Scholar] [CrossRef]
  6. Jobidon, R.; Roy, V.; Cyr, G. Net effect of competing vegetation on selected environmental conditions and performance of four spruce seedling stock sizes after eight years in Québec (Canada). Ann. For. Sci. 2003, 60, 691–699. [Google Scholar] [CrossRef]
  7. Skogsstyrelsen. Statistical Reports: Silvicultural Activities. Available online: https://www.skogsstyrelsen.se/en/statistics/subject-areas/silvicultural-activities/ (accessed on 12 June 2023).
  8. Sutton, R. Mounding site preparation: A review of European and North American experience. New For. 1993, 7, 151–192. [Google Scholar] [CrossRef]
  9. Örlander, G.; Gemmel, P.; Hunt, J. Site Preparation: A Swedish Overview; No. 105; BC Ministry of Forests: Vancouver, BC, Canada, 1990.
  10. Löf, M.; Dey, D.C.; Navarro, R.M.; Jacobs, D.F. Mechanical site preparation for forest restoration. New For. 2012, 43, 825–848. [Google Scholar] [CrossRef]
  11. Stathers, R.J.; Spittlehouse, D.L. Forest Soil Temperature Manual; FRDA Research Program, Research Branch, BC Ministry of Forests and Lands: Victoria, BC, Canada, 1990.
  12. Day, K.; Nordlander, G.; Kenis, M.; Halldorson, G. General biology and life cycles of bark weevils. In Bark and Wood Boring Insects in Living Trees in Europe, a Synthesis; Springer: Berlin/Heidelberg, Germany, 2004; pp. 331–349. [Google Scholar]
  13. Nilsson, U.; Luoranen, J.; Kolstrom, T.; Orlander, G.; Puttonen, P. Reforestation with planting in northern Europe. Scand. J. For. Res. 2010, 25, 283–294. [Google Scholar] [CrossRef]
  14. Kindvall, O.; Nordlander, G.; Nordenhem, H. Movement behaviour of the pine weevil Hylobius abietis in relation to soil type: An arena experiment. Entomol. Exp. Appl. 2000, 95, 53–61. [Google Scholar] [CrossRef]
  15. Petersson, M.; Orlander, G.; Nordlander, G. Soil features affecting damage to conifer seedlings by the pine weevil Hylobius abietis. Forestry 2005, 78, 83–92. [Google Scholar] [CrossRef]
  16. Wallertz, K.; Bjorklund, N.; Hjelm, K.; Petersson, M.; Sundblad, L.G. Comparison of different site preparation techniques: Quality of planting spots, seedling growth and pine weevil damage. New For. 2018, 49, 705–722. [Google Scholar] [CrossRef]
  17. Petersson, M.; Örlander, G. Effectiveness of combinations of shelterwood, scarification, and feeding barriers to reduce pine weevil damage. Can. J. For. Res. Rev. Can. Rech. For. 2003, 33, 64–73. [Google Scholar] [CrossRef]
  18. Wallertz, K.; Orlander, G.; Luoranen, J. Damage by pine weevil Hylobius abietis to conifer seedlings after shelterwood removal. Scand. J. For. Res. 2005, 20, 412–420. [Google Scholar] [CrossRef]
  19. Thorsen, Å.A.; Mattsson, S.; Weslien, J. Influence of stem diameter on the survival and growth of containerized Norway spruce seedlings attacked by pine weevils (Hylobius spp.). Scand. J. For. Res. 2001, 16, 54–66. [Google Scholar] [CrossRef]
  20. Örlander, G.; Nilsson, U. Effect of reforestation methods on pine weevil (Hylobius abietis) damage and seedling survival. Scand. J. For. Res. 1999, 14, 341–354. [Google Scholar] [CrossRef]
  21. Björklund, N.; Nordlander, G.; Bylund, H. Host-plant acceptance on mineral soil and humus by the pine weevil Hylobius abietis (L.). Agric. For. Entomol. 2003, 5, 61–66. [Google Scholar] [CrossRef]
  22. Luoranen, J.; Viiri, H.; Sianoja, M.; Poteri, M.; Lappi, J. Predicting pine weevil risk: Effects of site, planting spot and seedling level factors on weevil feeding and mortality of Norway spruce seedlings. For. Ecol. Manag. 2017, 389, 260–271. [Google Scholar] [CrossRef]
  23. Skogsstyrelsen. Föreskrifter för Anläggning av Skog-Regeringsuppdrag; Skogsstyrelsen: Jönköping, Sweden, 2018. [Google Scholar]
  24. Örlander, G.; Egnell, G.; Albrektson, A. Long-term effects of site preparation on growth in Scots pine. For. Ecol. Manag. 1996, 86, 27–37. [Google Scholar] [CrossRef]
  25. Johansson, K.; Nilsson, U.; Orlander, G. A comparison of long-term effects of scarification methods on the establishment of Norway spruce. Forestry 2012, 86, 91–98. [Google Scholar] [CrossRef]
  26. R Core Team. R: A Language and Environment for Statistical Computing. Available online: https://www.R-project.org/ (accessed on 21 December 2021).
  27. Bates, D.; Machler, M.; Bolker, B.M.; Walker, S.C. Fitting Linear Mixed-Effects Models Using lme4. J. Stat. Softw. 2015, 67, 48. [Google Scholar] [CrossRef]
  28. Kuznetsova, A.; Brockhoff, P.B.; Christensen, R.H.B. lmerTest Package: Tests in Linear Mixed Effects Models. J. Stat. Softw. 2017, 82, 1–26. [Google Scholar] [CrossRef]
  29. Fox, J.; Weisberg, S. An R Companion to Applied Regression; Sage Publications: Thousand Oaks, CA, USA, 2018. [Google Scholar]
  30. Lenth, R. Emmeans: Estimated Marginal Means, Aka Least-Squares Means, R Package Version, 1.7.1-1. 2021. Available online: https://CRAN.R-project.org/package=emmeans (accessed on 18 December 2022).
  31. Wickham, H. ggplot2: Elegant Graphics for Data Analysis; Springer: New York, NY, USA, 2016. [Google Scholar]
  32. Nordlander, G.; Hellqvist, C.; Johansson, K.; Nordenhem, H. Regeneration of European boreal forests: Effectiveness of measures against seedling mortality caused by the pine weevil Hylobius abietis. For. Ecol. Manag. 2011, 262, 2354–2363. [Google Scholar] [CrossRef]
  33. Nordlander, G.; Bylund, H.; Björklund, N. Soil type and microtopography influencing feeding above and below ground by the pine weevil Hylobius abietis. Agric. For. Entomol. 2005, 7, 107–113. [Google Scholar] [CrossRef]
  34. López-Villamor, A.; Carreño, S.; Goldar, X.; Suárez-Vidal, E.; Sampedro, L.; Nordlander, G.; Björklund, N.; Zas, R. Risk of damage by the pine weevil Hylobius abietis in southern Europe: Effects of silvicultural and landscape factors. For. Ecol. Manag. 2019, 444, 2090–2298. [Google Scholar] [CrossRef]
  35. Maňák, V.; Nordenhem, H.; Björklund, N.; Lenoir, L.; Nordlander, G. Ants protect conifer seedlings from feeding damage by the pine weevil Hylobius abietis. Agric. For. Entomol. 2013, 15, 98–105. [Google Scholar] [CrossRef]
  36. Häggström, B.; Domevščik, M.; Öhlund, J.; Nordin, A. Survival and growth of Scots pine (Pinus sylvestris) seedlings in north Sweden: Effects of planting position and arginine phosphate addition. Scand. J. For. Res. 2021, 36, 423–433. [Google Scholar] [CrossRef]
  37. Holmström, E.; Gålnander, H.; Petersson, M. Within-Site Variation in Seedling Survival in Norway Spruce Plantations. Forests 2019, 10, 181. [Google Scholar] [CrossRef]
Figure 1. (a) Three seedling sizes of Norway spruce (Picea abies (L.) Karst), defined by the volume of the container cells they were grown in (cm3). (b) Schematic illustration of planting positions: mineral soil position, hinge position, and capped-mound position. (c) Excavated profile of a capped mound, in which the seedling substrate does not reach down into the organic material. The blue dotted line marks the seedling root substrate, the red dashed line marks the mineral soil surface of the capped mound, and the yellow dashed line marks the organic soil layer. From above, the capped mound looks like an optimal capped mound, but below there are a lot of branches hidden in the organic layers. It is not possible to assess the thickness of the mineral soil layer just by casual observation. The background is grayed out to make it clearer where the surface of the capped mound starts. (d) An example of how the three planting positions appear in the field. (e) Commercially used Pottiputki (BCC AB, Landskrona, Sweden) planting pipe with an attached arGrow® (Arevo AB, Umeå, Sweden) dispenser. Photos by Bodil Häggström.
Forests 15 00703 g001
Figure 2. Trial design schematic. (A) Map overview, with the study site locations marked in yellow for Scots pine (Pinus sylvestris L.), and green for Norway spruce (Picea abies (L.) Karst). The contours for the entire 12.3 ha clearcut area and retention tree groups are indicated on the map. The red arrow indicates north direction. The other symbols on the map are not relevant for this study. (B) The study area was divided into 14 adjacent plots for Scots pine (yellow), and Norway spruce (green), respectively. (C) Each plot was split into three rows, in which seedlings of three different sizes (grown in containers with cell sizes of 30, 50, and 90 cm3) were planted for each tree species. The seedlings were planted in groups of three for each prepared spot of soil: one in the capped mound, one in the hinge, and one in the mineral soil. The seedlings in every second group of seedlings were given a dose of arginine–phosphate at planting, marked in red.
Forests 15 00703 g002
Figure 3. Results from ANOVAs regarding the survival of (a) Scots pine (Pinus sylvestris L.) seedlings and (b) Norway spruce (Picea abies (L.) Karst) seedlings for each planting position, respectively, following the third growing season. Columns indicate the survival probability as a percentage, and error bars indicate the standard error (data back-transformed from log scale in survival models). Different letters indicate significant differences. HQ Min = high-quality mineral soil position; HQ Hinge = high-quality hinge positions; LQ = low-quality positions; HQ CM = high-quality capped-mound positions. Note: For pine, HQ CM includes positions where humus was mixed into the mineral soil, while these positions are classed as LQ for spruce.
Forests 15 00703 g003
Figure 4. Results from ANOVAs regarding the probability of Scots pine (Pinus sylvestris L.) seedlings being attacked by pine weevils (Hylobius abietis L.) for each seedling size ((a) 30 cm3, (b) 50 cm3, and (c) 90 cm3) and for each planting position group, respectively, following the third growing season. Columns indicate the total probability of pine weevil attacks as a percentage, including both non-lethal and lethal damage; e and error bars indicate the standard error (data back-transformed from log scale in survival models). Different letters indicate significant differences. HQ Min = high-quality mineral soil positions; HQ Hinge = high-quality hinge positions; LQ = low-quality positions; HQ CM = high-quality capped-mound positions.
Forests 15 00703 g004
Figure 5. Results from ANOVAs regarding the probability of Norway spruce (Picea abies (L.) Karst) seedlings being attacked by pine weevils (Hylobius abietis L.) for each seedling size ((a) 30 cm3, (b) 50 cm3, and (c) 90 cm3) and for each planting position group, respectively, following the third growing season. Columns indicate the probability of pine weevil attacks as a percentage, including both non-lethal and lethal damage, and error bars indicate the standard error (data back-transformed from log scale in survival models). Different letters indicate significant differences. HQ Min = high-quality mineral soil positions; HQ Hinge = high-quality hinge positions; LQ = low-quality positions; HQ CM = high-quality capped-mound positions.
Forests 15 00703 g005
Figure 6. Results from ANOVAs regarding the probability of damage by pine weevil (Hylobius abietis L.) being fatal for (a) Scots pine (Pinus sylvestris L.) seedlings and (b) Norway spruce (Picea abies (L.) Karst) seedlings for each planting position group, respectively, following the third growing season. Columns indicate the probability of mortality caused by pine weevil damage as a percentage of the total number of seedlings and error bars indicate the standard error (data back-transformed from log scale in survival models). Different letters indicate significant differences. HQ Min = high-quality mineral soil positions; HQ Hinge = high-quality hinge positions; LQ = low-quality positions; HQ CM = high-quality capped-mound positions. Note: For pine, HQ CM includes positions where humus was mixed into the mineral soil, while these positions are classed as LQ for spruce.
Forests 15 00703 g006
Figure 7. Results from ANOVAs regarding the Scots pine (Pinus sylvestris L.) seedling stem basal diameter for each seedling size ((a) 30 cm3, (b) 50 cm3, and (c) 90 cm3) and for each planting position group and treatment, respectively, following the third growing season. Columns indicate the stem basal diameter in mm and error bars indicate the standard error. Different letters indicate significant differences. To indicate when there was an interaction between the factors, letters are displayed above each column; to indicate when there were no interactions, letters are displayed above each planting position group. HQ Min = high-quality mineral soil positions; HQ Hinge = high-quality hinge positions; LQ = low-quality positions; HQ CM = high-quality capped-mound positions.
Forests 15 00703 g007
Figure 8. Results from ANOVAs regarding the harvested Scots pine (Pinus sylvestris L.) seedling shoot–root ratios for each seedling size ((a) 30 cm3, (b) 50 cm3, and (c) 90 cm3) and for each planting position group, respectively, following the third growing season. Columns indicate the shoot-to-root ratio and error bars indicate the standard error. The different letters displayed above each planting position group indicate significant differences between these groups averaged across the values of the treatments. HQ Min = high-quality mineral soil positions; HQ Hinge = high-quality hinge positions; LQ = low-quality positions; HQ CM = high-quality capped-mound positions.
Forests 15 00703 g008
Figure 9. Results from ANOVAs regarding the probability of growth in Norway spruce (Picea abies (L.) Karst) seedling heights for each seedling size ((a) 30 cm3, (b) 50 cm3, and (c) 90 cm3) and for each planting position group, respectively, following the third growing season. Columns indicate the seedling heights in cm and error bars indicate the standard error. The different letters displayed above each planting position group indicate significant differences between these groups averaged over the values of the treatments, while the letters under the treatment legend indicate significant effects of treatment averaged across the planting position groups. HQ Min = high-quality mineral soil positions; HQ Hinge = high-quality hinge positions; LQ = low-quality positions; HQ CM = high-quality capped-mound positions.
Forests 15 00703 g009
Figure 10. Results from ANOVAs regarding the harvested Norway spruce (Picea abies (L.) Karst) seedling shoot–root dry weight ratios for each seedling size ((a) 30 cm3, (b) 50 cm3, and (c) 90 cm3) and for each planting position group, respectively, following the third growing season. Columns indicate the shoot–root ratios, and error bars indicate the standard error. The different letters displayed above each planting position group indicate significant differences between these groups averaged across the values of the treatments. HQ Min = high-quality mineral soil positions; HQ Hinge = high-quality hinge positions; LQ = low-quality positions; HQ CM = high-quality capped-mound positions.
Forests 15 00703 g010
Table 1. Mean height, stem basal diameter, root and shoot dry weights, and shoot–root ratio values of ~40 seedlings per size for Scots pine (Pinus sylvestris L.) and Norway spruce (Picea abies (L.) Karst). Seedling sizes are defined by the volume of the container cells they were grown in, measured in cubic centimeters. For Scots pine, the mean needle length of the 40 seedlings grown in each container cell size, as well as the percentage of seedlings with primary needles, was assessed for all seedlings after planting. N.A. = not available (needle length and primary needle share was not measured for spruce).
SpeciesScots PineNorway Spruce
Seed OriginT8 Dal130 Domsjöänget
Container cell volume (cm3)30 50 90 305090
Height (cm)10.111.813.211.315.024.4
Stem base Ø (mm)1.92.33.11.62.13.1
Needle length (cm)2.85.86.9N.A.N.A.N.A.
Root dry weight (g)0.260.550.930.160.370.60
Shoot dry weight (g)0.380.921.910.410.751.67
Shoot–root ratio1.551.742.162.562.052.80
Primary needles (%)95220.6N.A.N.A.N.A.
Table 2. Results from ANOVAs (type II Wald chi-square tests) on generalized mixed linear models regarding the probability of survival for Scots pine (Pinus sylvestris L.) and Norway spruce (Picea abies (L.) Karst) seedlings following the third growing season in the field. Significant results are highlighted in bold.
FactorPineSpruce
ChisqDfPr(>Chisq)ChisqDfPr(>Chisq)
Position74.163<0.00142.133<0.001
AP Treatment0.7410.390.1410.71
Size0.8320.660.0920.96
Table 3. Results from ANOVAs (type II Wald chi-square tests) on generalized mixed linear models regarding the probability of damage by pine weevil (Hylobius abietis L.) to Scots pine (Pinus sylvestris L.) and Norway spruce (Picea abies (L.) Karst) seedlings following the third growing season in the field. Significant results are highlighted in bold.
FactorPineSpruce
ChisqDfPr(>Chisq)ChisqDfPr(>Chisq)
Position21.783<0.00151.033<0.001
AP Treatment1.5610.210.3410.56
Size192.382<0.00197.492<0.001
Table 4. Results from ANOVAs (type II Wald chi-square tests) on generalized mixed linear models regarding the probability of a fatal outcome of damage by pine weevil (Hylobius abietis L.) for Scots pine (Pinus sylvestris L.) and Norway spruce (Picea abies (L.) Karst) seedlings following the third growing season in the field. Significant results are highlighted in bold.
FactorPineSpruce
ChisqDfPr(>Chisq)ChisqDfPr(>Chisq)
Position40.003<0.00132.133<0.001
AP Treatment2.8110.090.1410.71
Size2.4620.290.3120.86
Table 5. Results from ANOVAs (type II/III Wald F tests with Kenward–Roger df) on linear mixed models for the stem basal diameter and shoot-to-root ratio of Scots pine (Pinus sylvestris L.) seedlings following the third growing season in the field. Significant results are highlighted in bold.
Pine Size Stem Basal DiameterShoot–Root Ratio 2
FactorDfFDf.resPr(>F)FDf.resPr(>F)
30 cm3Position 1330.84505.06<0.0016.58138.83<0.001
AP11.08502.310.300.76138.190.38
Position–AP33.40507.300.02---
50 cm3Position 135.33597.580.027.34145.84<0.001
AP13.40599.810.022.05144.080.15
Position–AP320.83601.71<0.001---
90 cm3Position 1320.80575.24<0.0013.96141.290.01
AP12.78569.930.101.19139.390.28
Position–AP3------
1 For pine, the position defined as “high-quality capped-mound” includes positions where humus was mixed into the mineral soil. 2 Harvested seedlings.
Table 6. Results from ANOVAs (type II Wald F tests with Kenward–Roger df) on linear mixed models for the heights and shoot-to-root ratios of Norway spruce (Picea abies (L.) Karst) seedlings following the third growing season in the field, for each seedling size, respectively. Significant results are highlighted in bold. For spruce, there were no significant interactions, so this component was removed from the models.
Spruce Size HeightShoot–Root Ratio 2
FactorDfFDf.resPr(>F)FDf.resPr(>F)
30 cm3Position 134.22554.340.0061.3490.930.26
AP16.37549.620.010.0688.210.81
50 cm3Position 139.97644.54<0.0011.55160.880.20
AP110.81638.630.0010.65160.120.42
90 cm3Position 1311.69547.99<0.0015.20137.800.002
AP14.61543.570.030.03136.390.87
1 For spruce, positions where humus was mixed into the mineral soil are classed as low-quality positions. 2 Harvested seedlings.
Disclaimer/Publisher’s Note: The statements, opinions and data contained in all publications are solely those of the individual author(s) and contributor(s) and not of MDPI and/or the editor(s). MDPI and/or the editor(s) disclaim responsibility for any injury to people or property resulting from any ideas, methods, instructions or products referred to in the content.

