
AutoST-Net: A Spatiotemporal Feature-Driven Approach for Accurate Forest Fire Spread Prediction from Remote Sensing Data


Abstract
1. Introduction
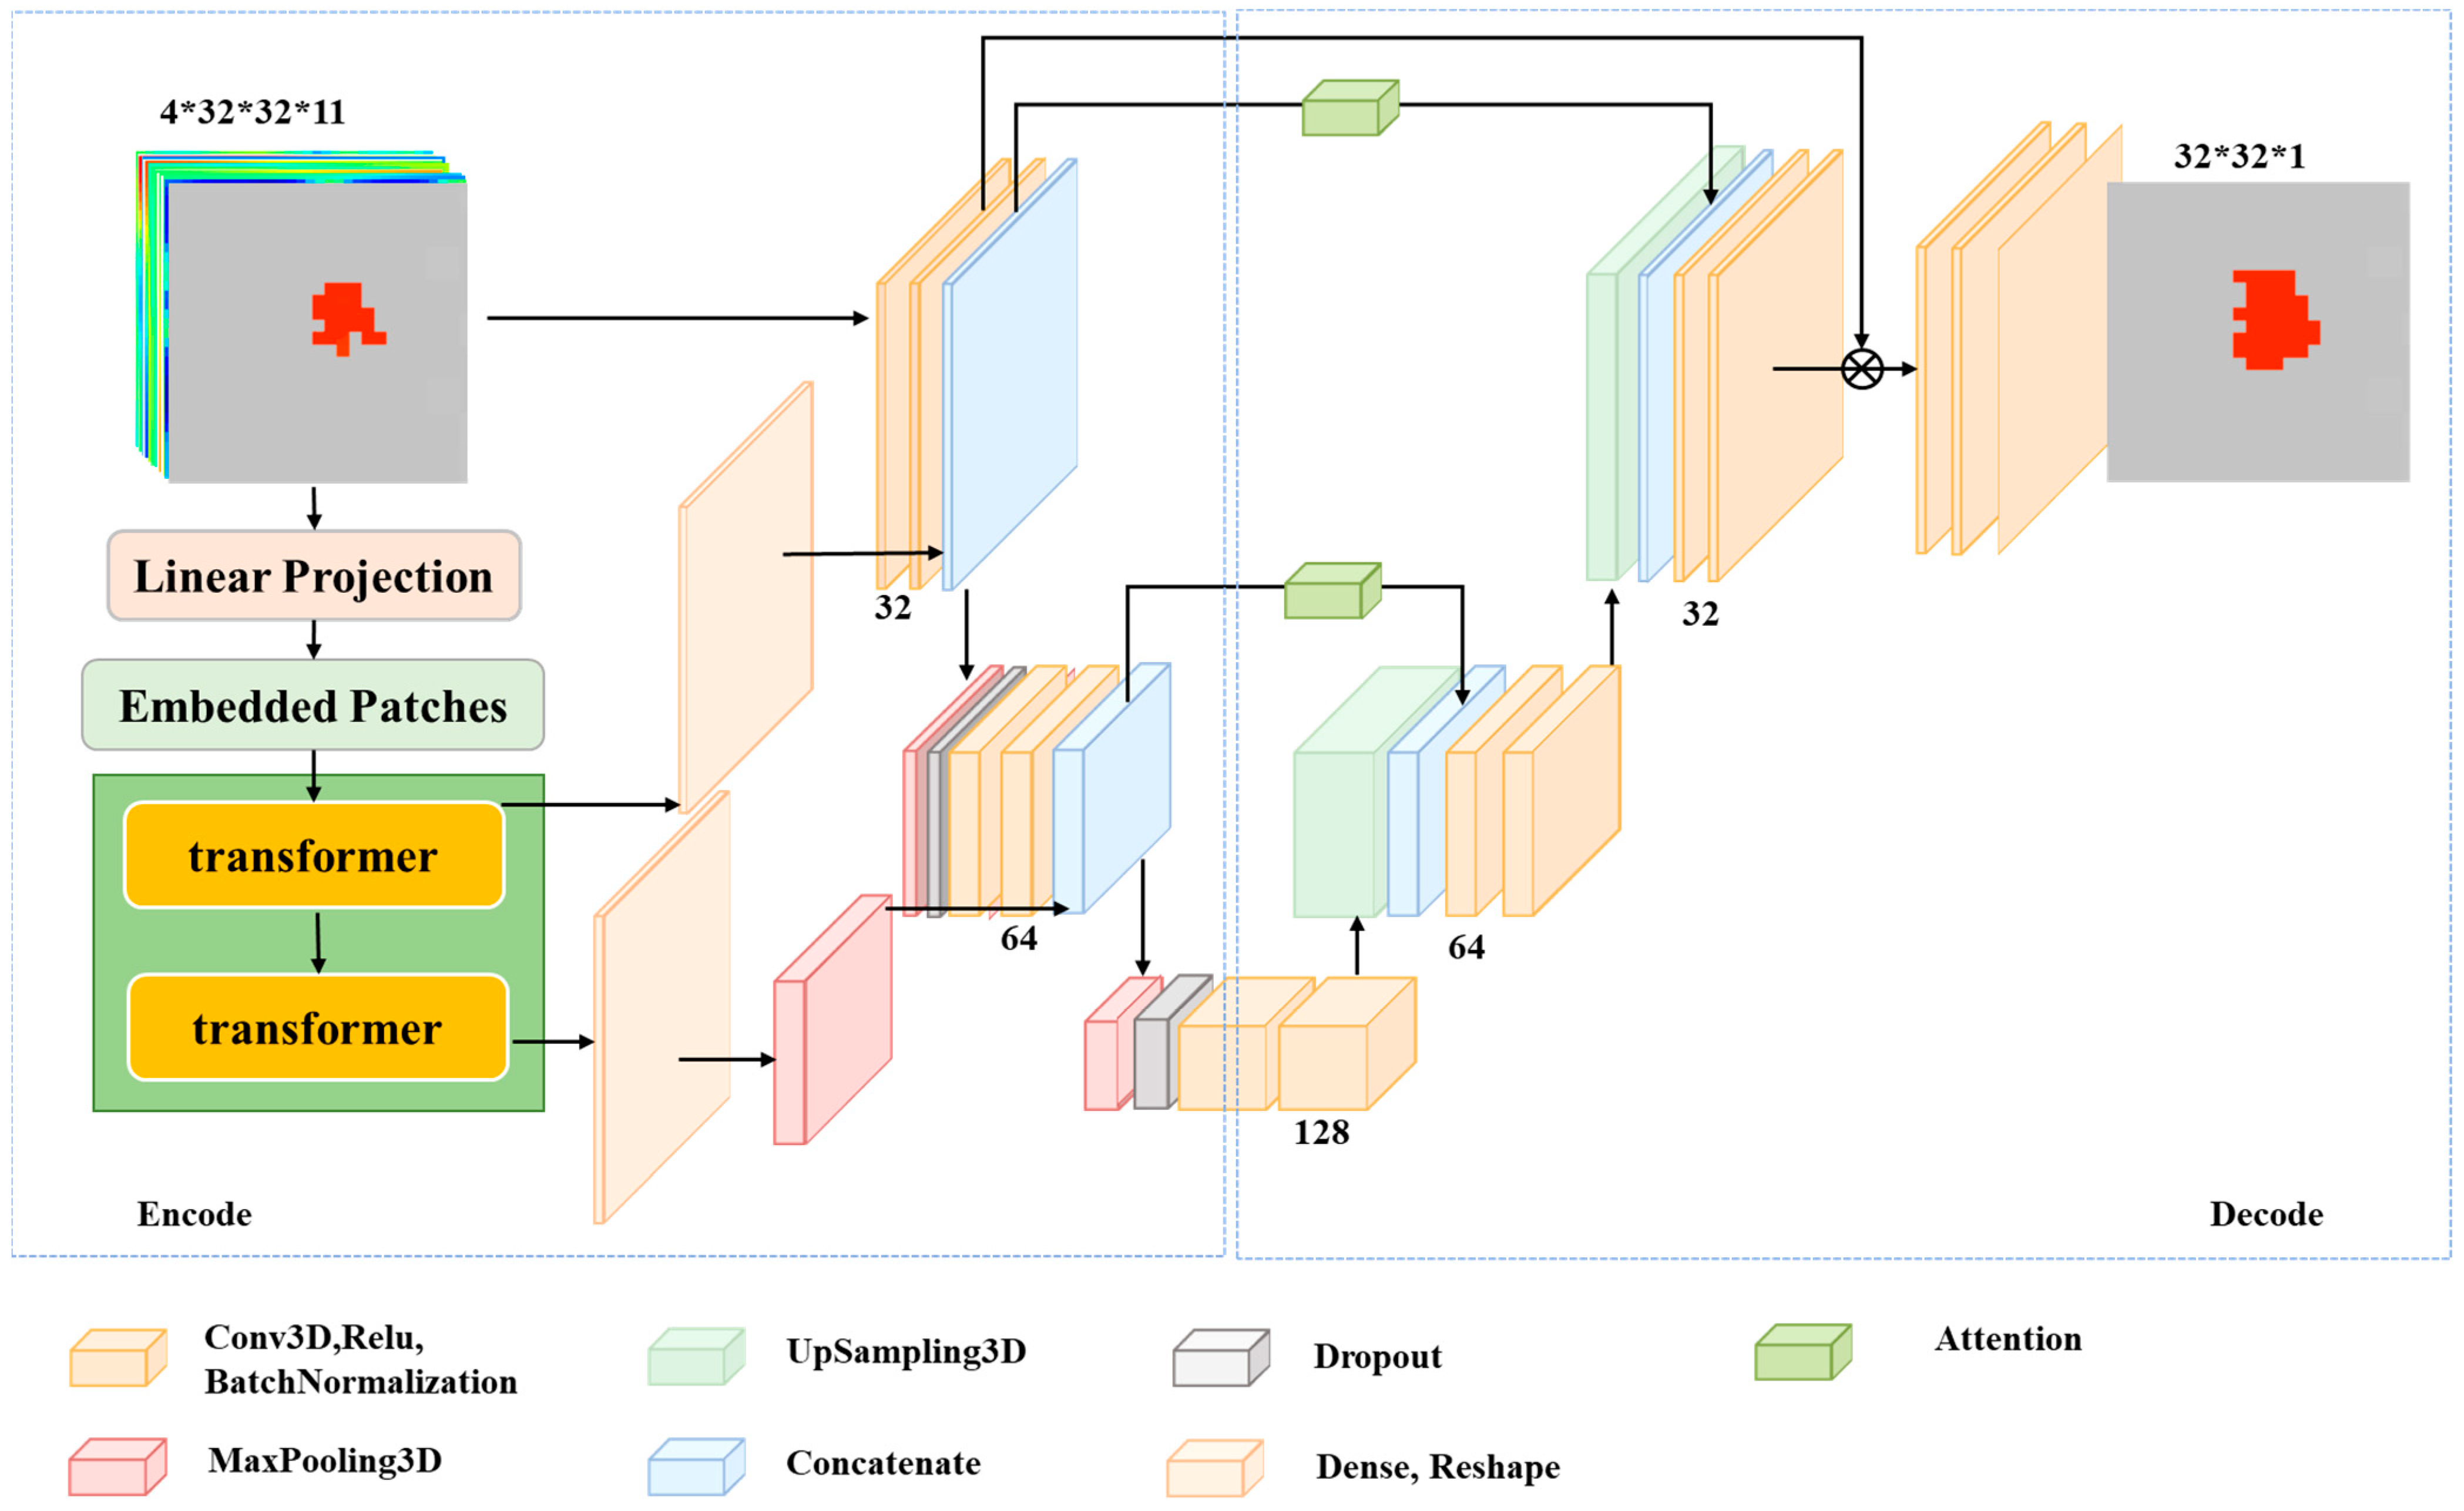
- Introduce the novel AutoST-Net model, which is based on the dynamics of fire behavior and employs a 3D convolutional neural network to capture the spatiotemporal features of forest fire spread. The model incorporates a transformer to extract global features and includes an attention mechanism to improve performance and accuracy.
- By creating a forest fire spread dataset based on the GEE and Himawari-8 satellites, evaluate and compare the performance of the AutoST-Net model with other models such as Zhengfei Wang-CA, Random Forest, and a CNN-LSTM combination.
2. Data
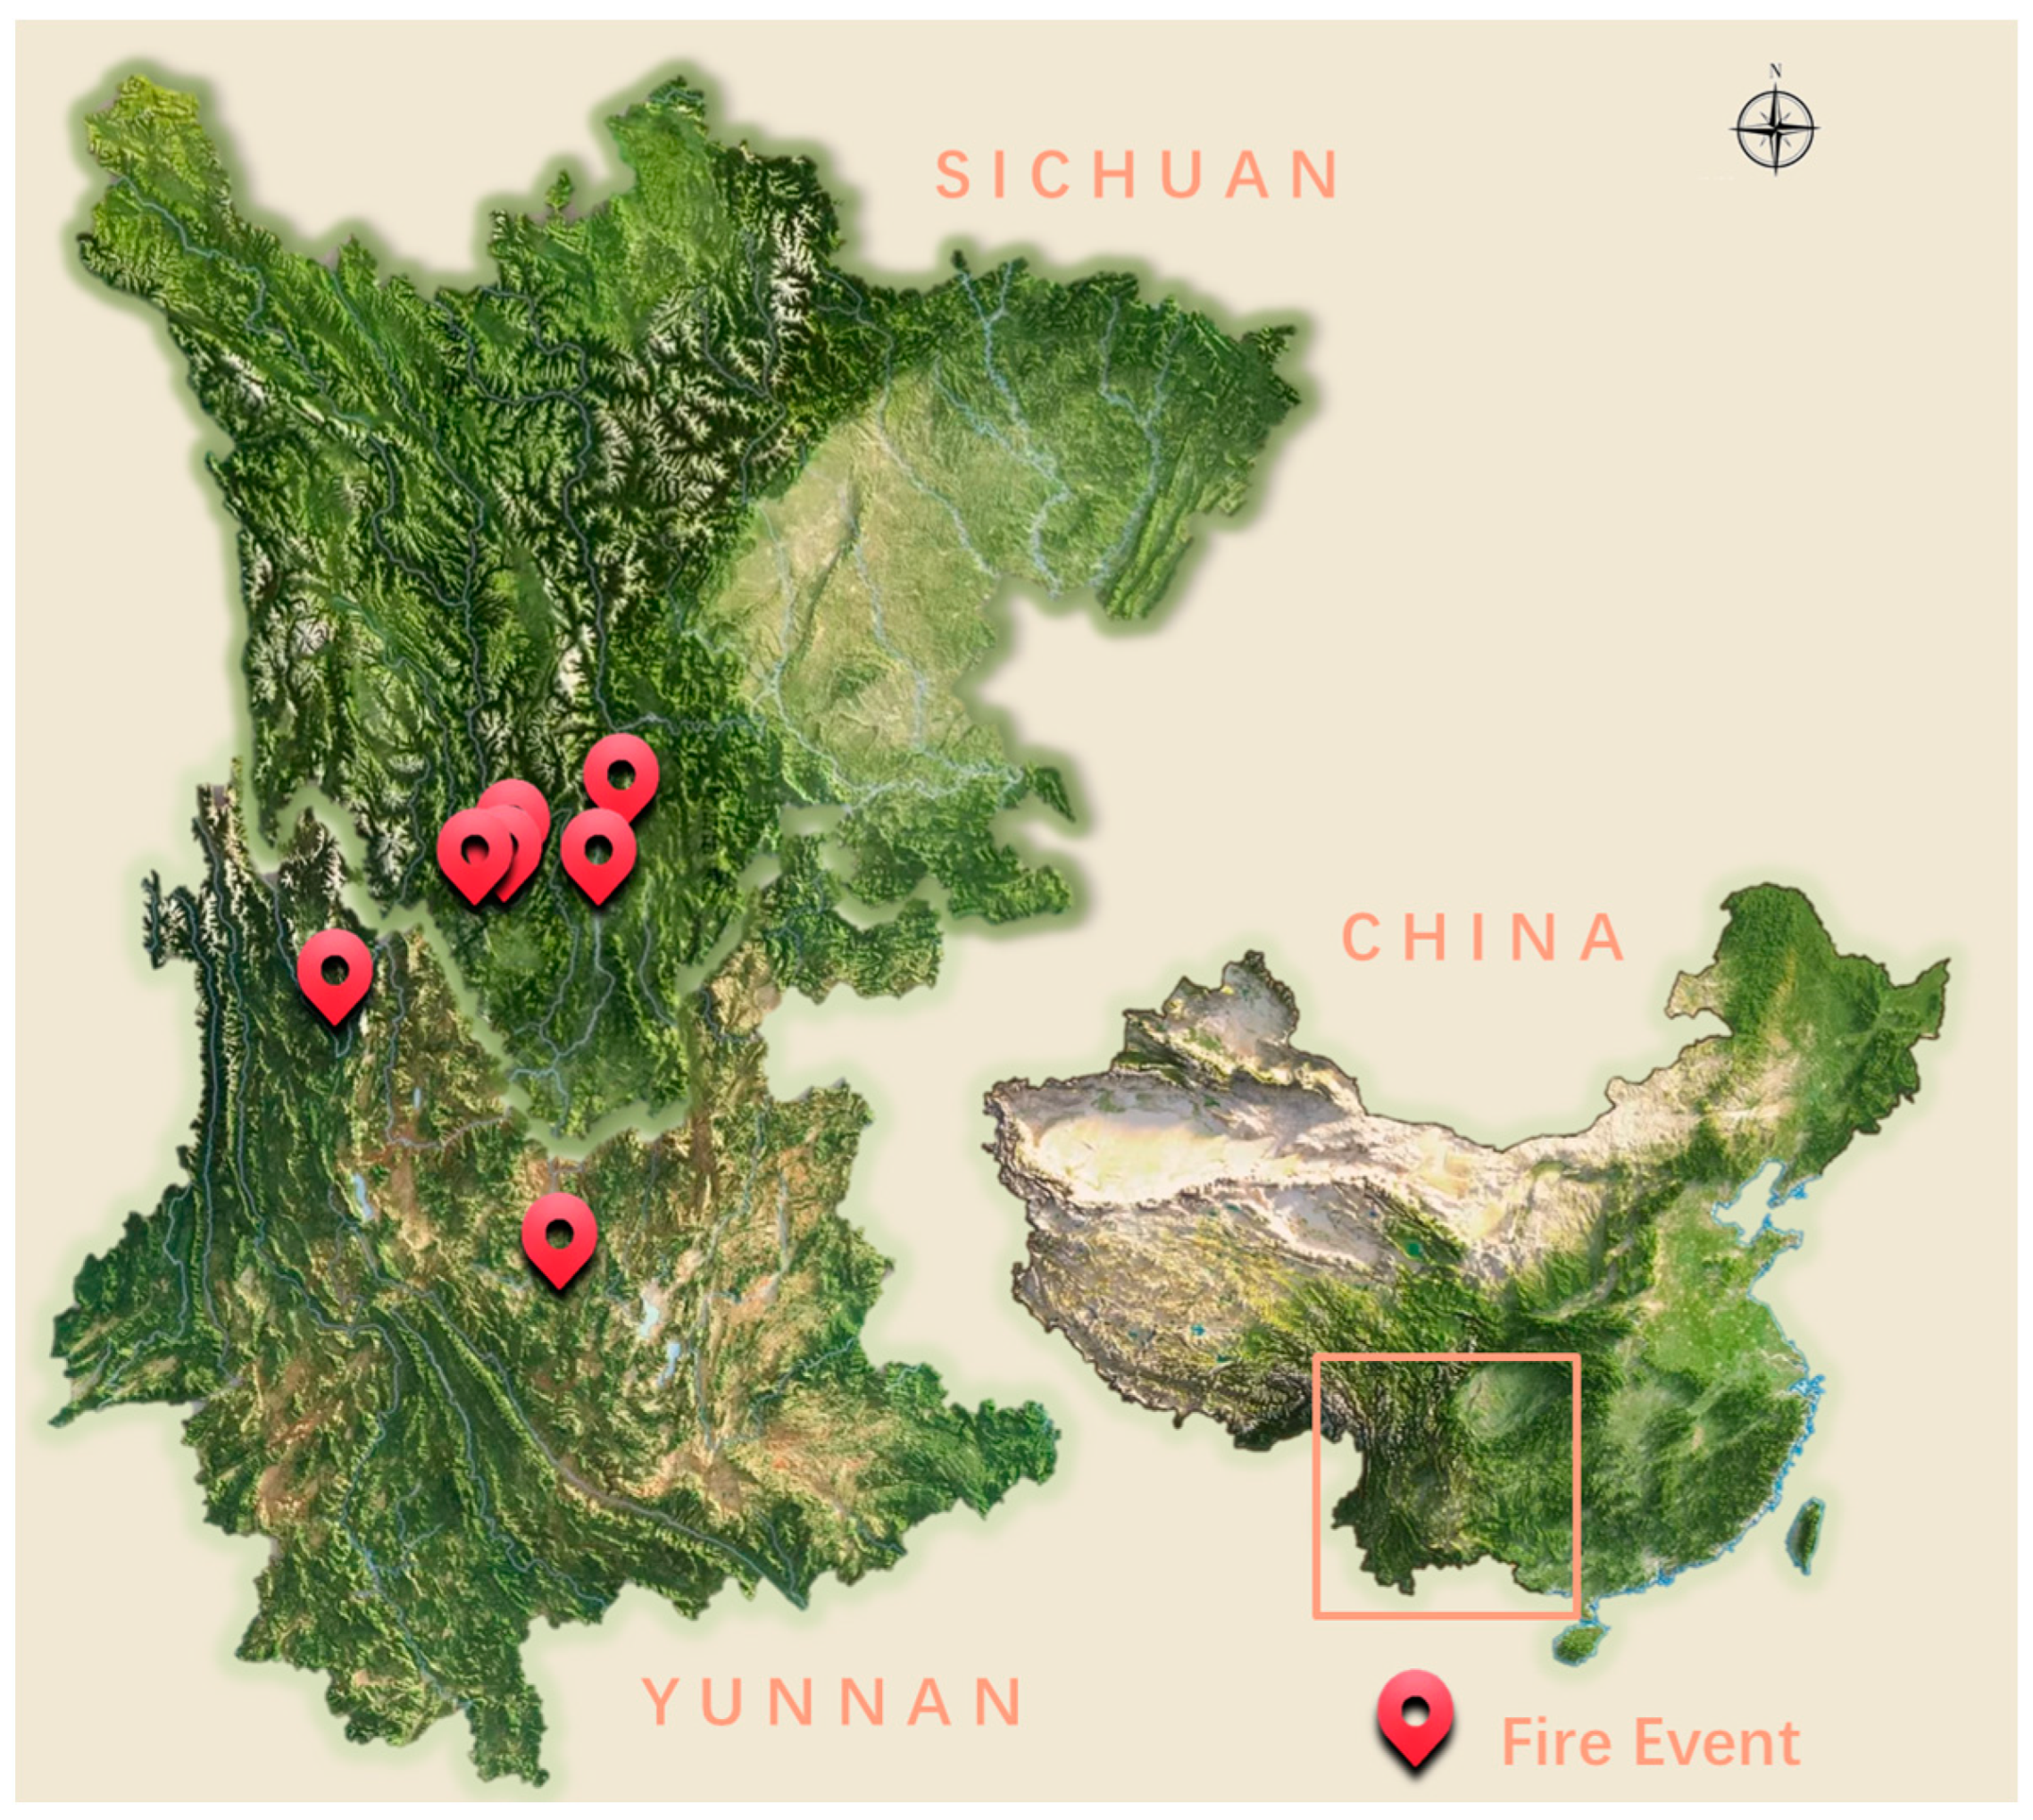
2.1. Study Regions
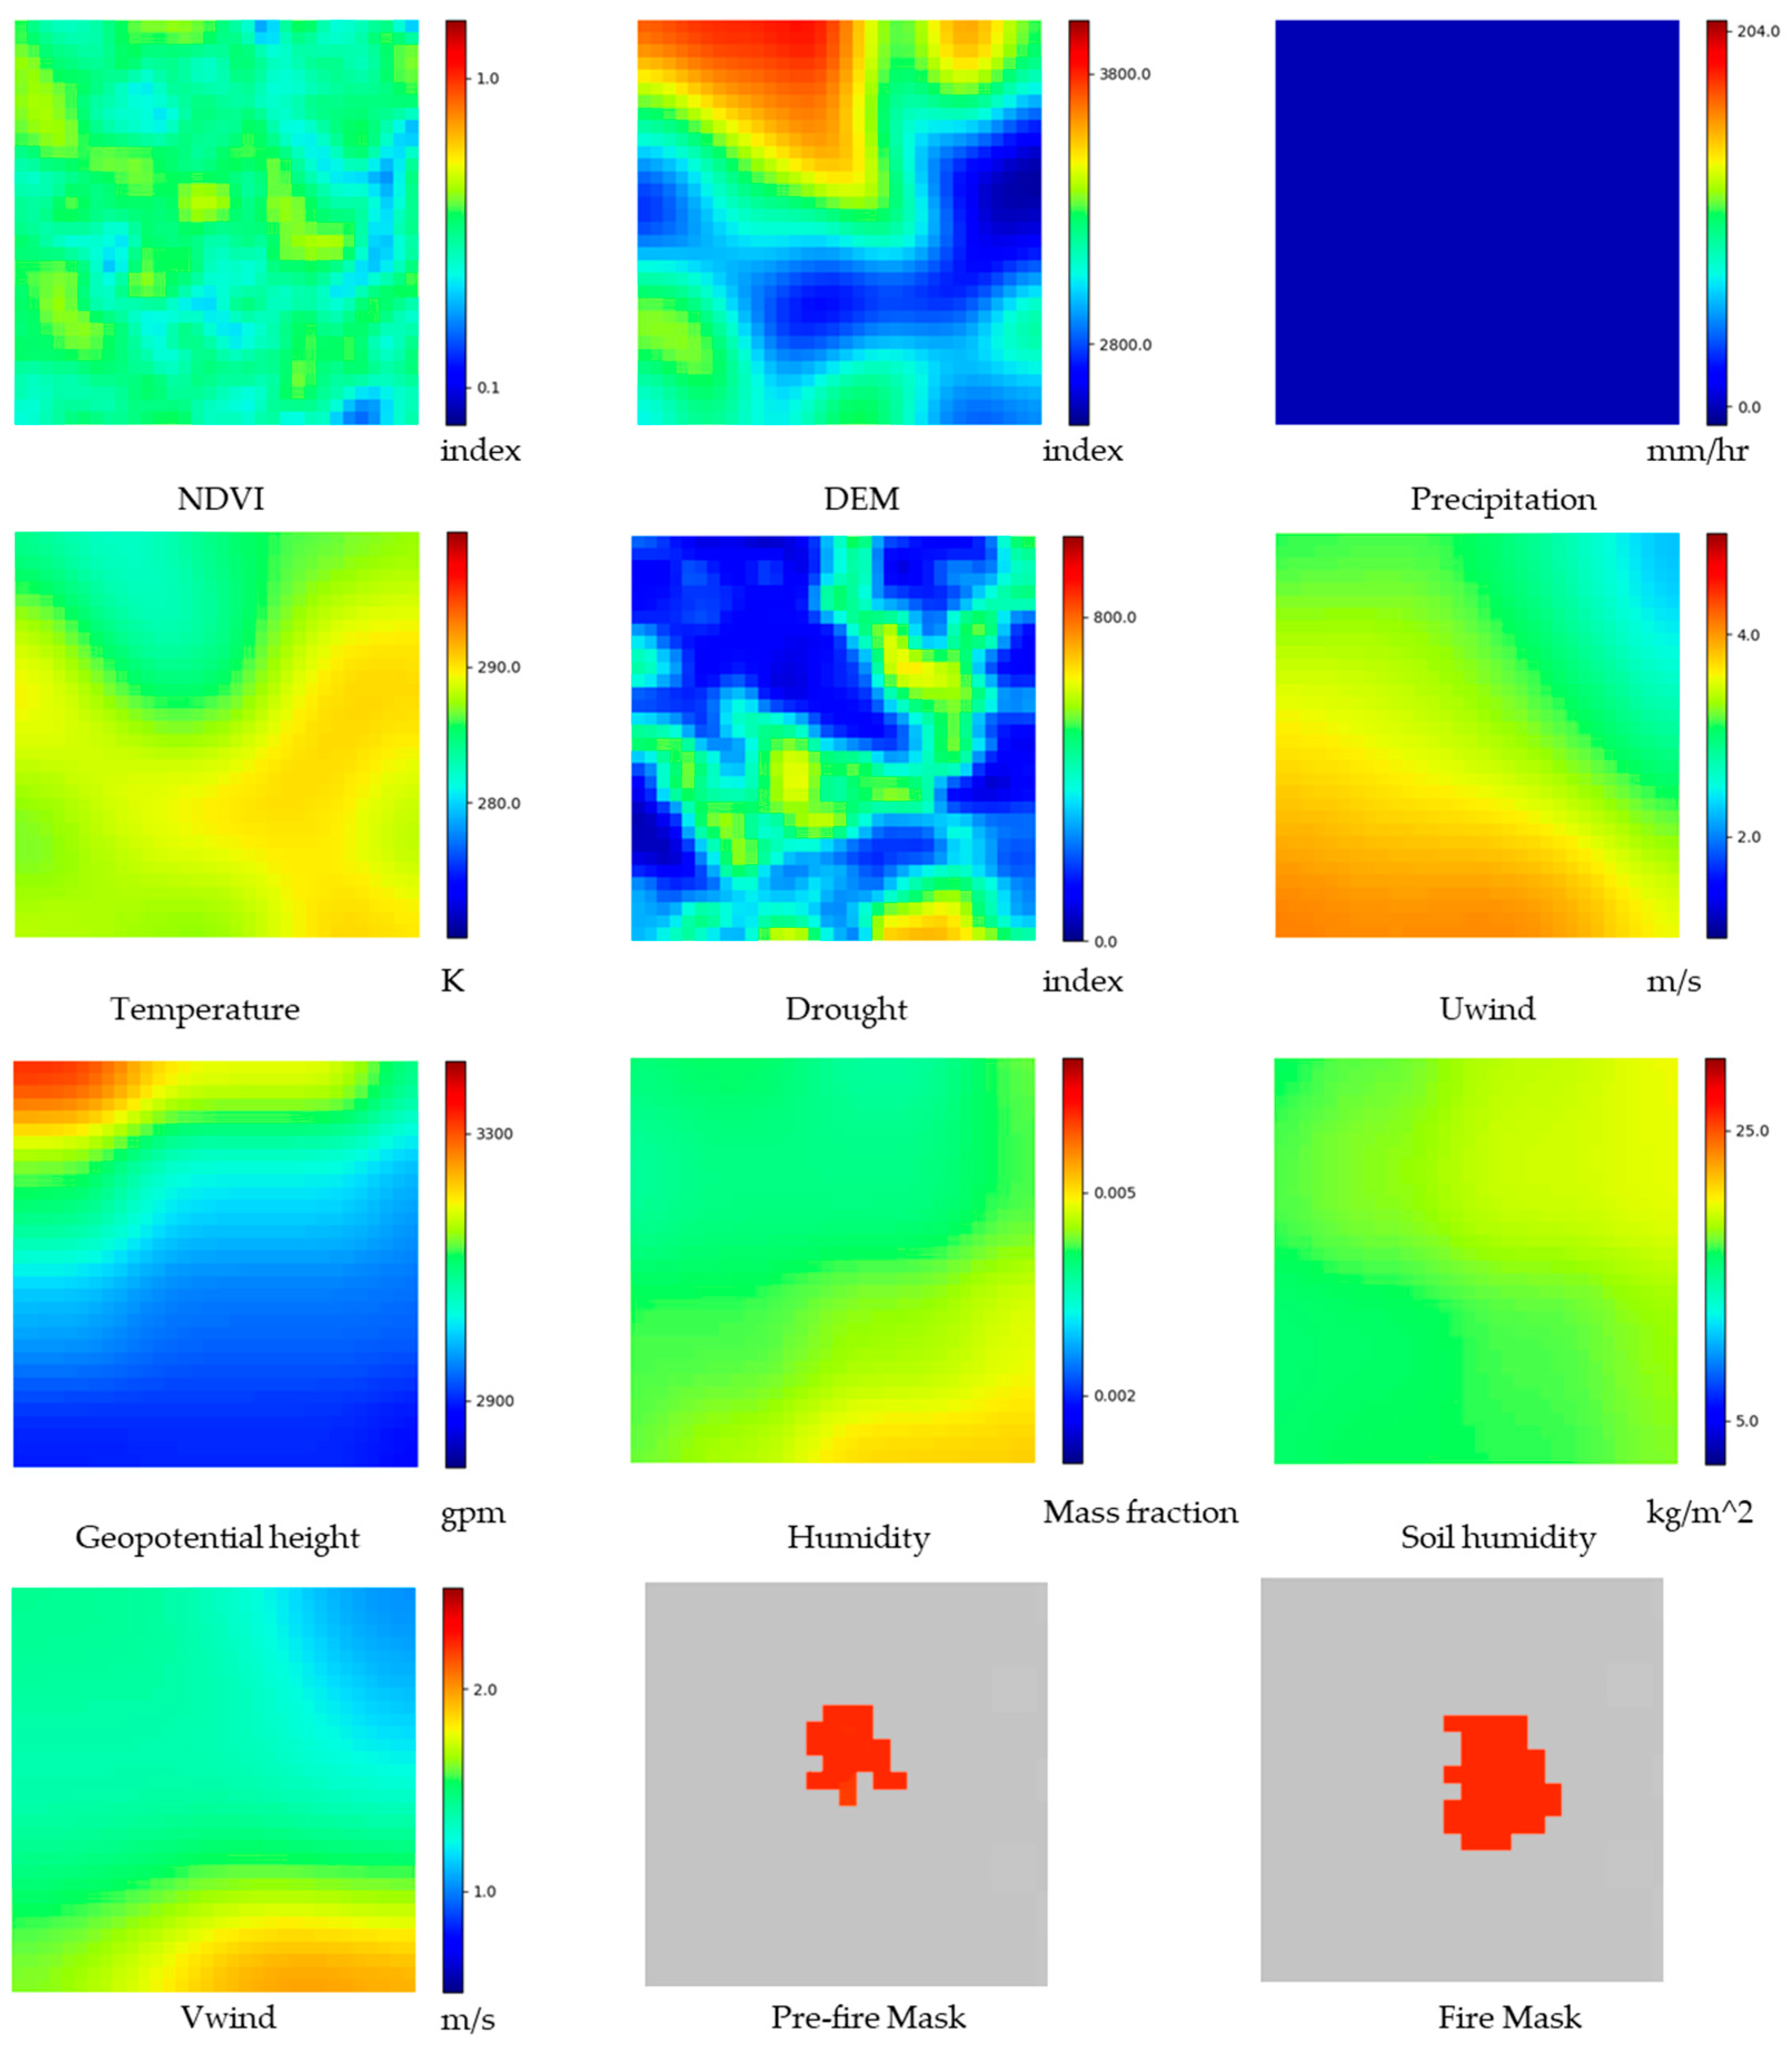
2.2. Datasets
2.3. Data Processing
3. Methodology
3.1. Problem Definition
3.2. AutoST-Net
- A.
- Encoder
- B.
- Decoder
- C.
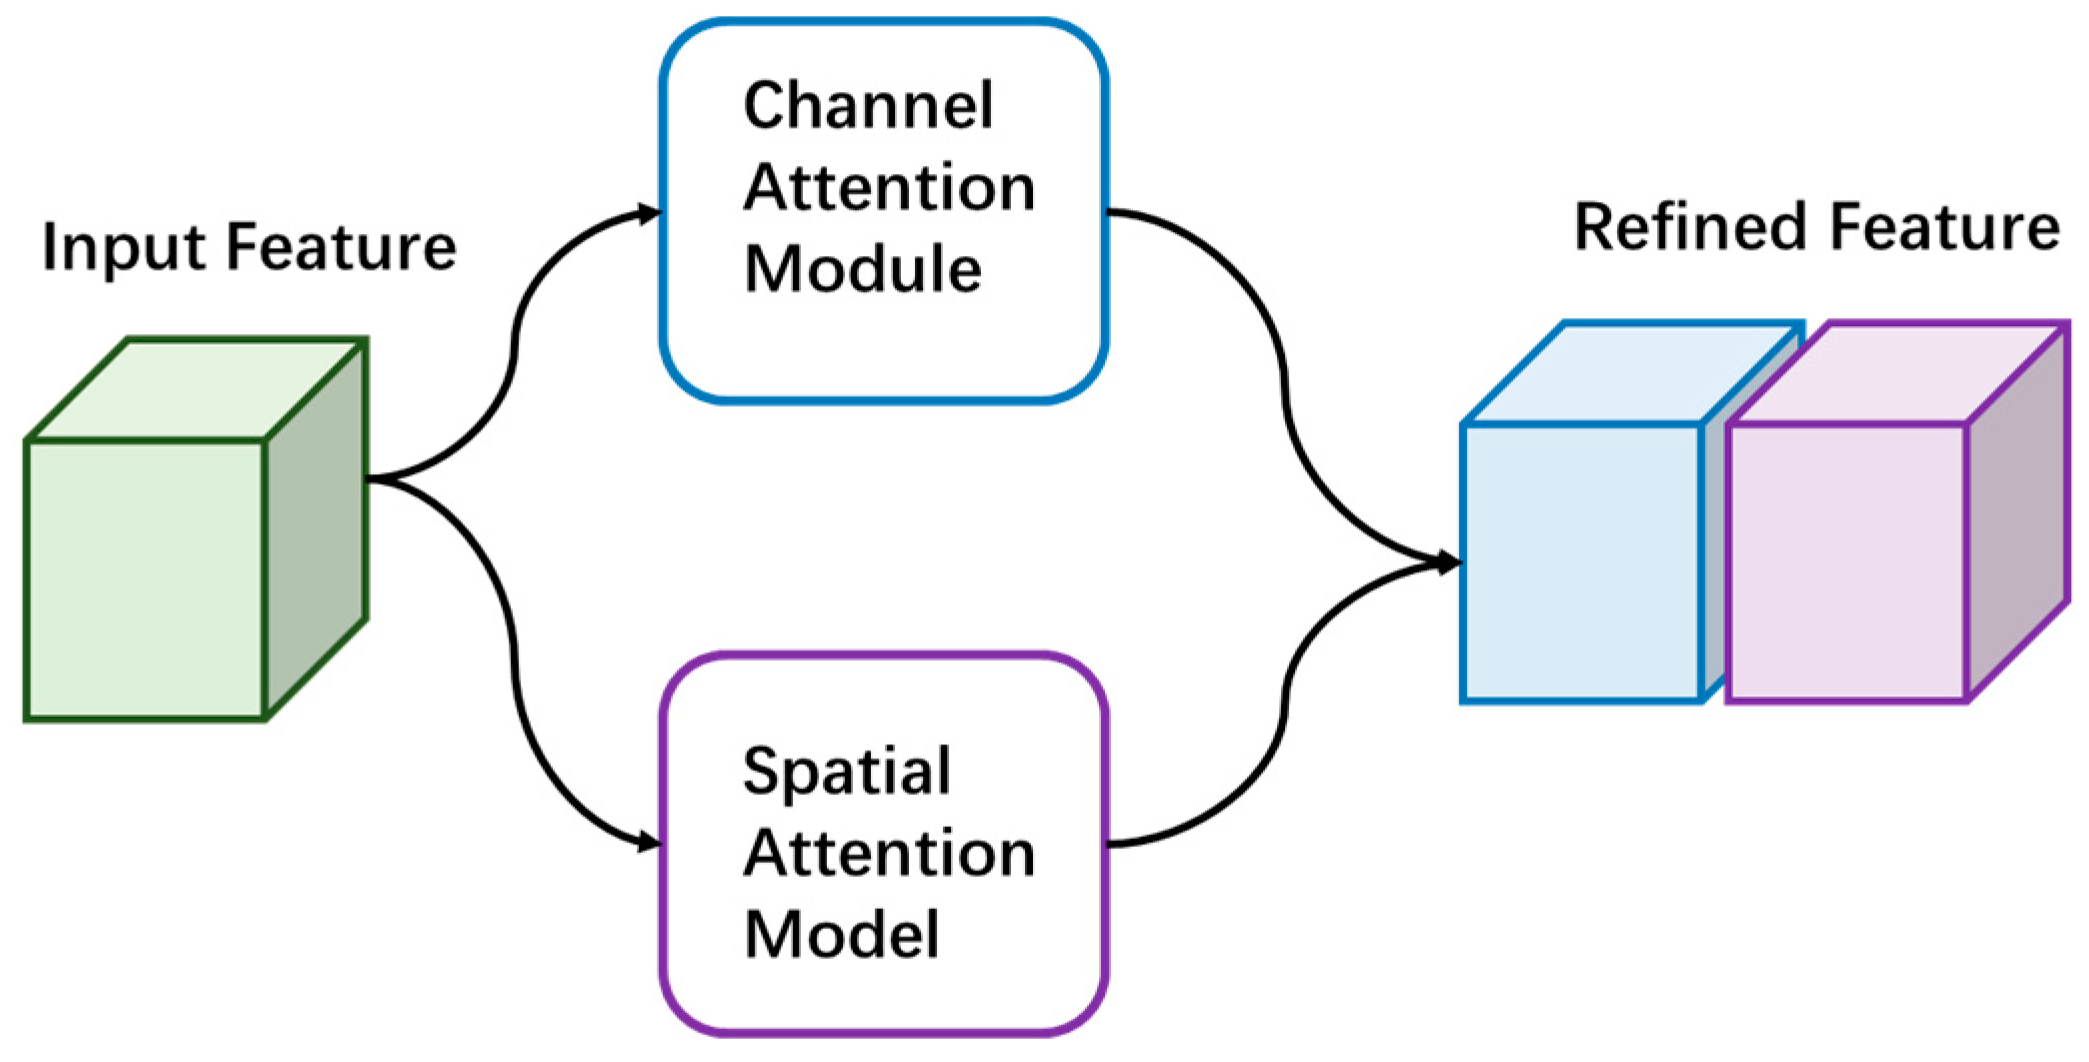
- The attention mechanism
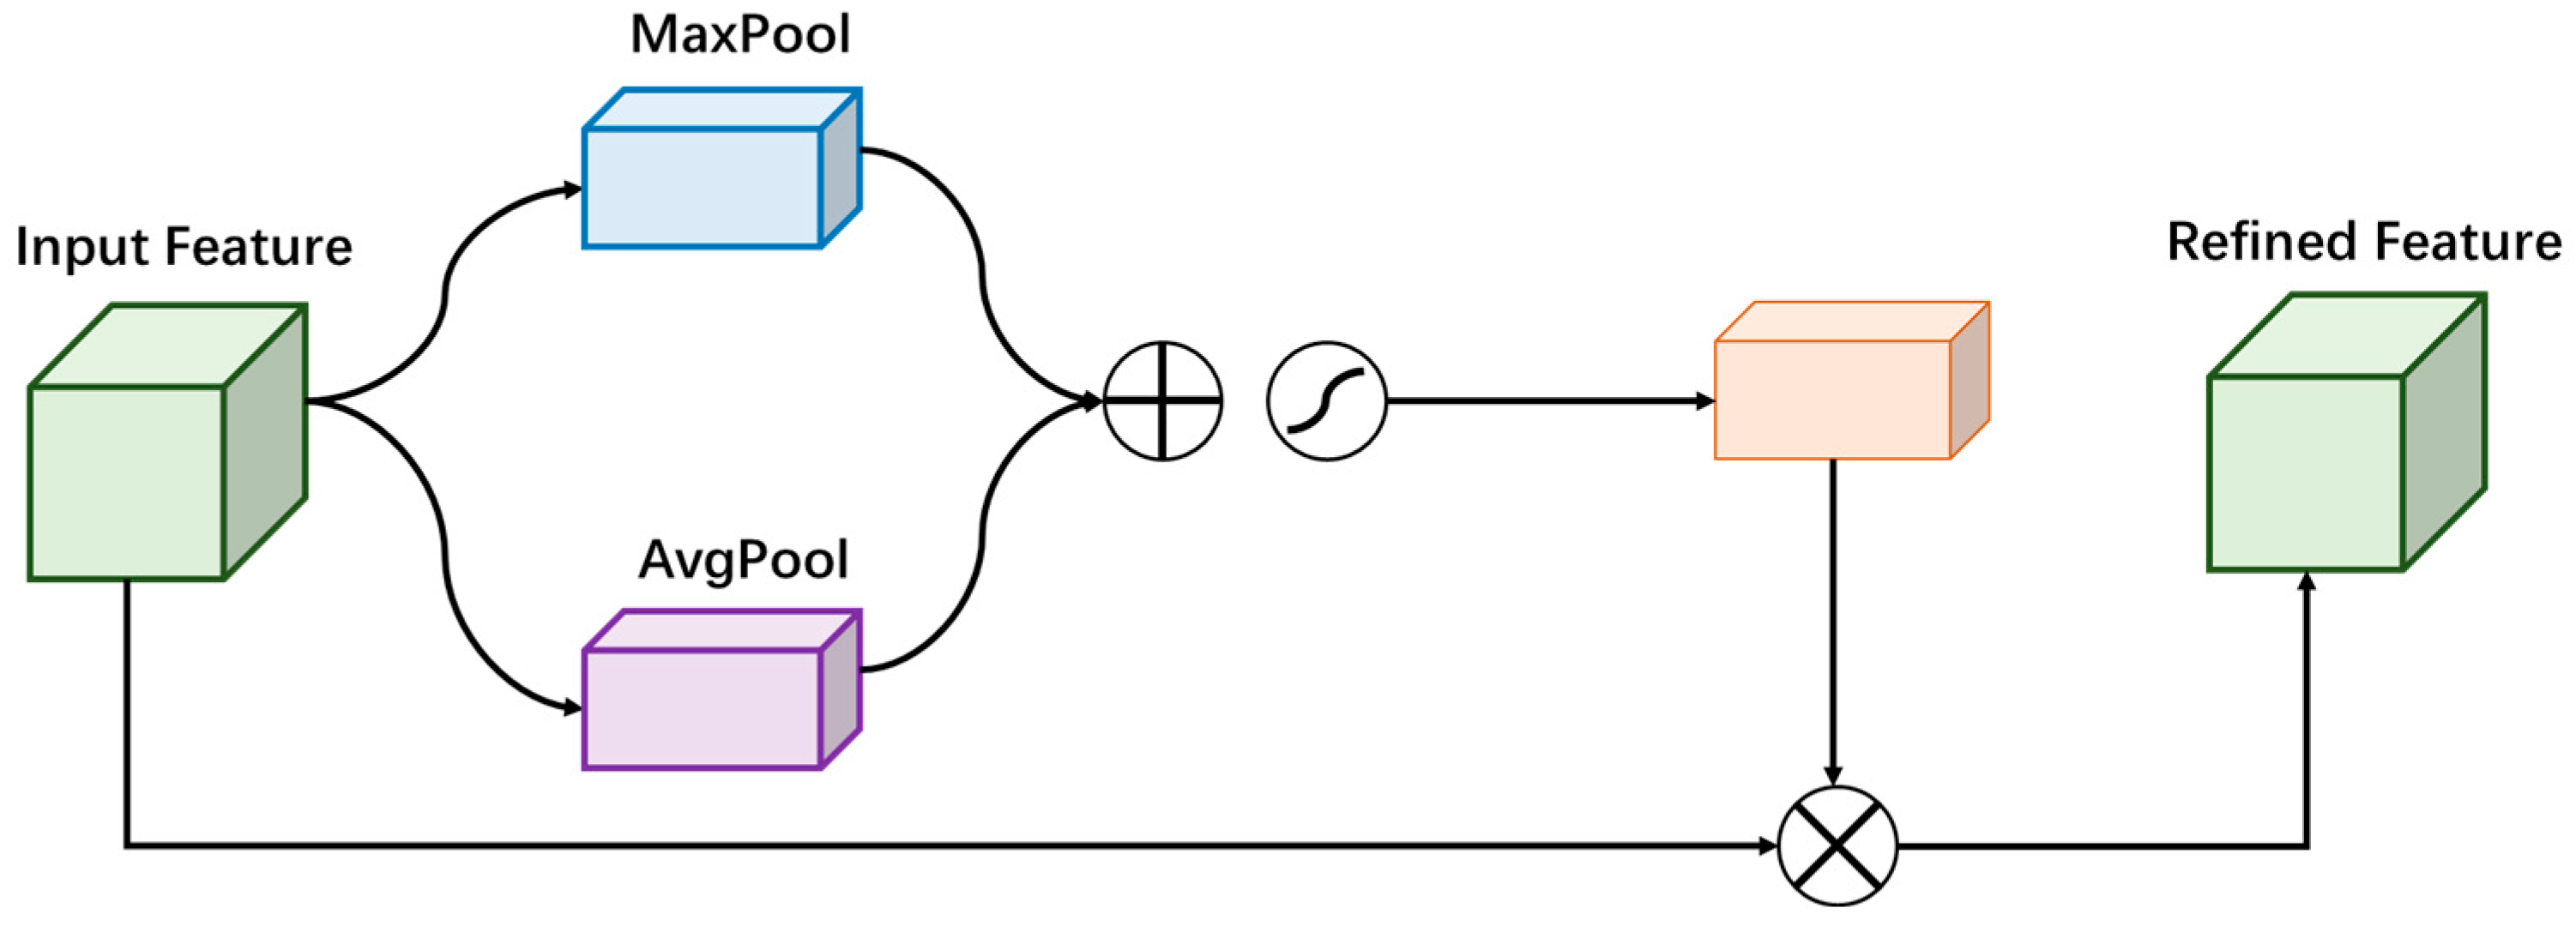
- Channel Attention Module
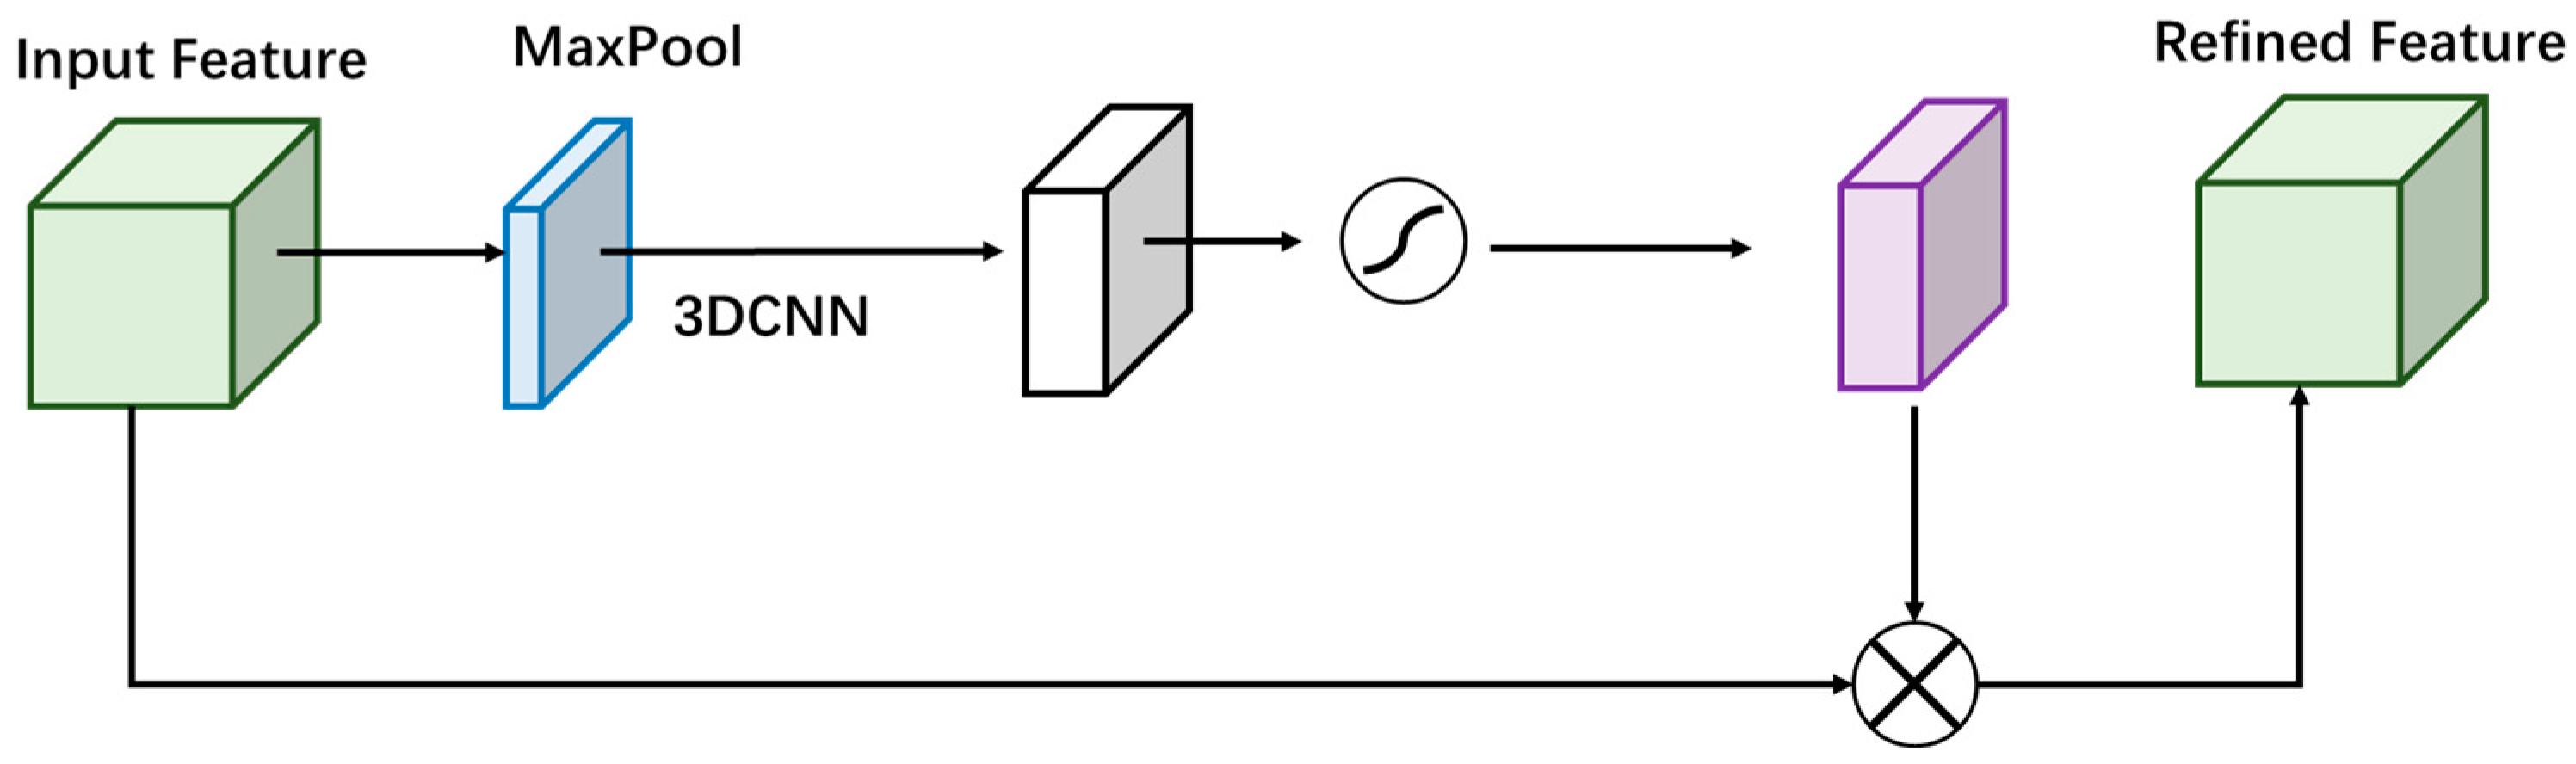
- Spatial Attention Model
- D.
- Loss function
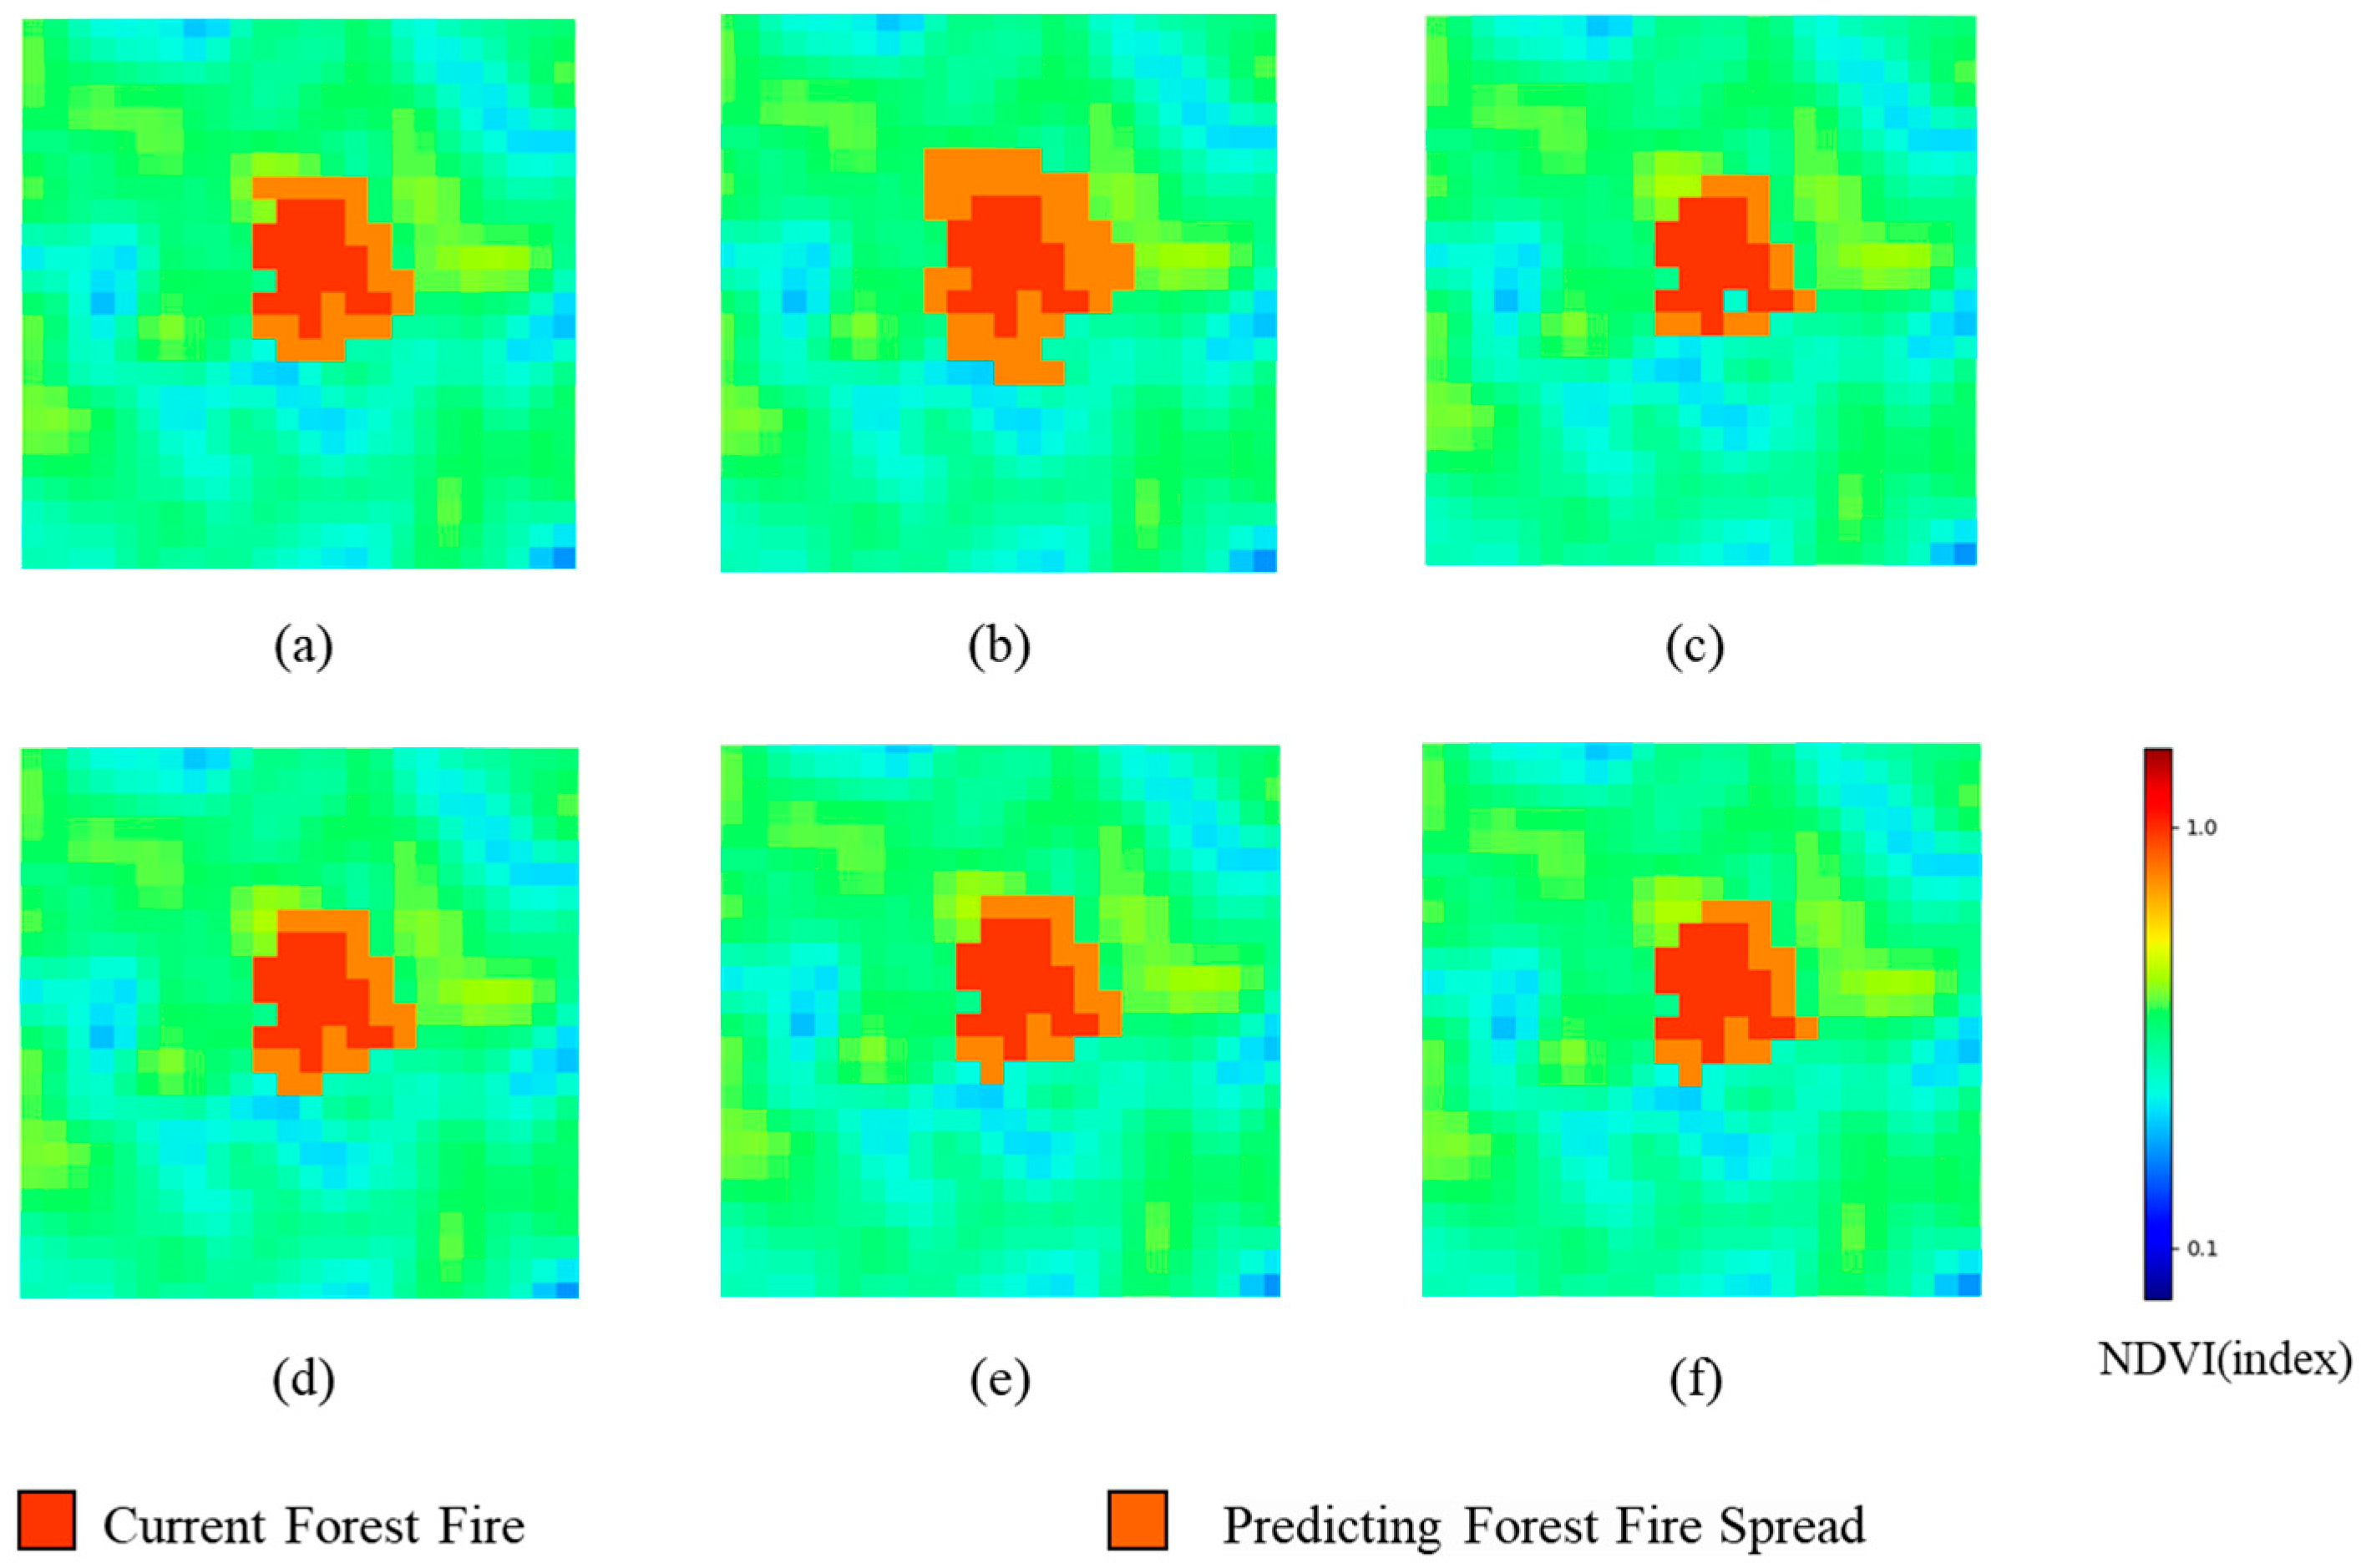
4. Experiments and Results
4.1. Evaluation Metrics
4.2. Comparative Experiments
5. Discussion
6. Conclusions
- The AutoST-Net model efficiently captures the complex spatiotemporal characteristics of forest fire spread through the skillful integration of 3DCNN and transformer.
- The innovative attention mechanism significantly enhances the model’s ability to precisely extract and utilize key features, thereby substantially improving prediction accuracy.
- The high quality dataset constructed in this study lays a solid foundation for research on forest fire spread prediction.
Author Contributions
Funding
Data Availability Statement
Conflicts of Interest
References
- Marris, E. Hawaii wildfires: Did scientists expect Maui to burn? Nature 2023, 620, 708–709. [Google Scholar] [CrossRef]
- John, T.A.; Williams, A.P. Impact of anthropogenic climate change on wildfire across western US forests. Proc. Natl. Acad. Sci. USA 2016, 113, 11770–11775. [Google Scholar]
- Barbero, R.; Abatzoglou, J.T.; Pimont, F.; Ruffault, J.; Curt, T. Attributing Increases in Fire Weather to Anthropogenic Climate Change Over France. Front. Earth Sci. 2020. [Google Scholar] [CrossRef]
- Andela, N.; Morton, D.C.; Giglio, L.; Chen, Y.; van der Werf, G.R.; Kasibhatla, P.S.; DeFries, R.S.; Collatz, G.J.; Hantson, S.; Kloster, S.; et al. A human-driven decline in global burned area. Science 2017, 356, 1356–1362. [Google Scholar] [CrossRef]
- Fernández-García, V.; Alonso-González, E. Global Patterns and Dynamics f Burned Area and Burn Severity. Remote Sens. 2023, 15, 3401. [Google Scholar] [CrossRef]
- Jinkyu, R.; Dongkurl, K.; Seungmin, C. Position Estimation of Forest Fires Using an Infrared Camera Based on Pan Tilt Servo. J. Korean Soc. Hazard Mitig. 2022, 22, 97–103. [Google Scholar]
- Gayathri, S.; Karthi, P.V.A.; Sunil, S. Prediction and Detection of Forest Fires Based on Deep Learning Approach. J. Pharm. Negat. Results 2022, 13, 429–433. [Google Scholar] [CrossRef]
- Tian, Y.; Wu, Z.; Li, M.; Wang, B.; Zhang, Z. Forest Fire Spread Monitoring and Vegetation Dynamics Detection Based on Multi-Source Remote Sensing Images. Remote Sens. 2022, 14, 4431. [Google Scholar] [CrossRef]
- Amatulli, G.; Camia, A.; San-Miguel-Ayanz, J. Estimating future burned areas under changing climate in the EU-Mediterranean countries. Sci. Total Environ. 2013, 450, 209–222. [Google Scholar] [CrossRef]
- Verdú, F.; Salas, J.; Vega-García, C. A multivariate analysis of biophysical factors and forest fires in spain 1991–2005. Int. J. Wildland Fire 2012, 21, 498–509. [Google Scholar] [CrossRef]
- Vecín-Arias, D.; Castedo-Dorado, F.; Ordóñez, C.; Rodríguez-Pérez, J.R. Biophysical and lightning characteristics drive lightning-induced fire occurrence in the central plateau of the Iberian Peninsula. Agric. For. Meteorol. 2016, 225, 36–47. [Google Scholar] [CrossRef]
- Bui, D.T.; Bui, Q.T.; Nguyen, Q.P.; Pradhan, B.; Nampak, H.; Trinh, P.T. A hybrid artificial intelligence approach using GIS-based neural-fuzzy inference system and particle swarm optimization for forest fire susceptibility modeling at a tropical area. Agric. For. Meteorol. 2017, 233, 32–44. [Google Scholar]
- Zhao, Q.; Yu, L.; Li, X.; Peng, D.; Zhang, Y.; Gong, P. Progress and Trends in the Application of Google Earth and Google Earth Engine. Remote Sens. 2021, 13, 3778. [Google Scholar] [CrossRef]
- Lasaponara, R.; Abate, N.; Fattore, C.; Aromando, A.; Cardettini, G.; Di Fonzo, M. On the Use of Sentinel-2 NDVI Time Series and Google Earth Engine to Detect Land-Use/Land-Cover Changes in Fire-Affected Areas. Remote Sens. 2022, 14, 4723. [Google Scholar] [CrossRef]
- Yailymov, B.; Shelestov, A.; Yailymova, H.; Shumilo, L. Google Earth Engine Framework for Satellite Data-Driven Wildfire Monitoring in Ukraine. Fire 2023, 6, 411. [Google Scholar] [CrossRef]
- Chen, J.; Lv, Q.C.; Wu, S.; Zeng, Y.L.; Li, M.C.; Chen, Z.Y.; Zhou, E.Z.; Zheng, W.; Liu, C.; Chen, X.; et al. An adapted hourly Himawari-8 fire product for China: Principle, methodology and verification. Earth Syst. Sci. Data 2023, 15, 1911–1931. [Google Scholar] [CrossRef]
- Xu, H.; Zhang, G.; Zhou, Z.; Zhou, X.; Zhou, C. Forest Fire Monitoring and Positioning Improvement at Subpixel Level: Application to Himawari-8 Fire Products. Remote Sens. 2022, 14, 2460. [Google Scholar] [CrossRef]
- Zhou, W.; Tang, B.H.; He, Z.W.; Huang, L.; Chen, J.Y. Identification of forest fire points under clear sky conditions with Himawari-8 satellite data. Int. J. Remote Sens. 2024, 45, 214–234. [Google Scholar] [CrossRef]
- Zhang, D.; Huang, C.; Gu, J.; Hou, J.; Zhang, Y.; Han, W.; Dou, P.; Feng, Y. Real-Time Wildfire Detection Algorithm Based on VIIRS Fire Product and Himawari-8 Data. Remote Sens. 2023, 15, 1541. [Google Scholar] [CrossRef]
- Gupta, S.K.; Kanga, S.; Meraj, G.; Kumar, P.; Singh, S.K. Uncovering the hydro-meteorological drivers responsible for forest fires utilizing geospatial techniques. Theor. Appl. Climatol. 2023, 153, 675–695. [Google Scholar] [CrossRef]
- Mutthulakshmi, K.; Wee, M.R.E.; Wong, Y.C.K.; Lai, J.W.; Koh, J.M.; Acharya, U.R.; Cheong, K.H. Simulating Forest Fire Spread and Fire-fighting Using Cellular Automata. Chin. J. Phys. 2020, 65, 642–650. [Google Scholar] [CrossRef]
- Freire, J.G.; DaCamara, C.C. Using cellular automata to simulate wildfire propagation and to assist in fire management. Hatural Hazards Earth Syst. Sci. 2019, 19, 169–179. [Google Scholar] [CrossRef]
- Sun, L.Y.; Xu, C.C.; He, Y.L.X.; Zhao, Y.J.; Xu, Y.; Rui, X.P.; Xu, H.W. Adaptive Forest Fire Spread Simulation Algorithm Based on Cellular Automata. Forests 2021, 12, 1431. [Google Scholar] [CrossRef]
- Rui, X.P.; Hui, S.; Yu, X.T.; Zhang, G.Y.; Wu, B. Forest fire spread simulation algorithm based on cellular automata. Nat. Hazards 2018, 91, 309–319. [Google Scholar] [CrossRef]
- Zhang, X.T.; Liu, P.S.; Wang, X.F. Research on the Improvement of Wang Zhengfei. Shandong For. Sci. Technol. 2020, 50, 1–6+40. [Google Scholar]
- Meng, Q.K.; Huai, Y.J.; You, J.W.; Nie, X.Y. Visualization of 3D forest fire spread based on the coupling of multiple weather factors. Comput. Graph. 2023, 110, 58–68. [Google Scholar] [CrossRef]
- Zhang, S.Y.; Liu, J.Q.; Gao, H.W.; Chen, X.D.; Li, X.D.; Hua, J. Study on Forest Fire spread Model of Multi-dimensional Cellular Automata based on Rothermel Speed Formula. Cerne 2021, 27, e-102932. [Google Scholar] [CrossRef]
- Li, J.W.; Li, X.W.; Chen, C.C.; Zheng, H.R.; Liu, N.Y. Three-Dimensional Dynamic Simulation System for Forest Surface Fire Spreading Prediction. Int. J. Pattern Recognit. Artif. Intell. 2018, 32, 1850026. [Google Scholar] [CrossRef]
- Khanmohammadi, S.; Arashpour, M.; Golafshani, E.M.; Cruz, M.G.; Rajabifard, A.; Bai, Y. Prediction of wildfire rate of spread in grasslands using machine learning methods. Environ. Model. Softw. 2022, 156, 105507. [Google Scholar] [CrossRef]
- Bot, K.; Borges, J.G. A Systematic Review of Applications of Machine Learning Techniques for Wildfire Management Decision Support. Inventions 2022, 7, 15. [Google Scholar] [CrossRef]
- Shmuel, A.; Heifetz, E. A Machine-Learning Approach to Predicting Daily Wildfire Expansion Rate. Fire 2023, 6, 319. [Google Scholar] [CrossRef]
- Michael, Y.; Helman, D.; Glickman, O.; Gabay, D.; Brenner, S.; Lensky, I.M. Forecasting fire risk with machine learning and dynamic information derived from satellite vegetation index time-series. Sci. Total Environ. 2020, 764, 142844. [Google Scholar] [CrossRef]
- Zheng, Z.; Huang, W.; Li, S.N.; Zeng, Y.N. Forest fire spread simulating model using cellular automaton with extreme learning machine. Ecol. Model. 2017, 348, 33–43. [Google Scholar] [CrossRef]
- Xu, Y.Q.; Li, D.J.; Ma, H.; Lin, R.; Zhang, F.Q. Modeling Forest Fire Spread Using Machine Learning-Based Cellular Automata in a GIS Environment. Forests 2023, 13, 1974. [Google Scholar] [CrossRef]
- Rubi, J.N.S.; de Carvalho, P.H.P.; Gondim, P.R.L. Application of Machine Learning Models in the Behavioral Study of Forest Fires in the Brazilian Federal District region. Eng. Appl. Artif. Intell. 2023, 118, 105649. [Google Scholar] [CrossRef]
- Janiec, P.; Gadal, S. A Comparison of Two Machine Learning Classification Methods for Remote Sensing Predictive Modeling of the Forest Fire in the North-Eastern Siberia. Remote Sens. 2021, 12, 4157. [Google Scholar] [CrossRef]
- De Bem, P.P.; de Carvalho, O.A.; Matricardi, E.A.T.; Guimaraes, R.F.; Gomes, R.A.T. Predicting wildfire vulnerability using logistic regression and artificial neural networks: A case study in Brazil’s Federal District. J. Int. Assoc. Wildland Fire 2019, 28, 35–45. [Google Scholar] [CrossRef]
- Cardil, A.; Monedero, S.; Ramírez, J.; Silva, C.A. Assessing and reinitializing wildland fire simulations through satellite active fire data. J. Environ. Manag. 2019, 231, 996–1003. [Google Scholar] [CrossRef]
- Luz, A.E.O.; Negri, R.G.; Massi, K.G.; Colnago, M.; Silva, E.A.; Casaca, W. Mapping Fire Susceptibility in the Brazilian Amazon Forests Using Multitemporal Remote Sensing and Time-Varying Unsupervised Anomaly Detection. Remote Sens. 2022, 14, 2429. [Google Scholar] [CrossRef]
- Stankevich, T.S. The use of convolutional neural networks to forecast the dynamics of spreading forest fires in real time. Bus. Inform. 2018, 46, 17–27. [Google Scholar] [CrossRef]
- Prapas, I.; Kondylatos, S.; Papoutsis, I.; Camps-Valls, G.; Ronco, M.; Fernandez-Torres, M.A.; Guillem, M.P.; Carvalhais, N. Deep Learning Methods for Daily Wildfire Danger Forecasting. arXiv 2021, arXiv:2111.02736. [Google Scholar]
- Yang, S.; Lupascu, M.; Meel, K.S. Predicting Forest Fire Using Remote Sensing Data and Machine Learning. In Proceedings of the AAAI Conference on Artificial Intelligence, Virtually, 2–9 February 2021; Volume 35, pp. 14983–14990. [Google Scholar]
- Zou, Y.; Sadeghi, M.; Liu, Y.; Puchko, A.; Le, S.; Chen, Y.; Andela, N.; Gentine, P. Attention-Based Wildland Fire Spread Modeling Using Fire-Tracking Satellite Observations. Fire 2023, 6, 289. [Google Scholar] [CrossRef]
- Ding, C.; Zhang, X.; Chen, J.; Ma, S.; Lu, Y.; Han, W. Wildfire detection through deep learning based on Himawari-8 satellites platform. Int. J. Remote Sens. 2022, 43, 5040–5058. [Google Scholar] [CrossRef]
- Hoai, N.V.; Anh, D.T.; Manh, D.N.; Bokgil, C.; Soonghwan, R. Investigation of Deep Learning Method for Fire Detection from Videos. In Proceedings of the 2021 International Conference on Information and Communication Technology Convergence (ICTC), Jeju Island, Republic of Korea, 20–22 October 2021; pp. 593–595. [Google Scholar]
- Bhowmik, R.T.; Jung, Y.S.; Aguilera, J.A.; Prunicki, M.; Nadeau, K. A multi-modal wildfire prediction and early-warning system based on a novel machine learning framework. J. Environ. Manag. 2023, 341, 117908. [Google Scholar] [CrossRef]
- Devlin, J.; Chang, M.W.; Lee, K.T.; Toutanova, K. BERT: Pre-training of Deep Bidirectional Transformers for Language Understanding. arXiv 2019, arXiv:1810.04805. [Google Scholar]
- Radford, A.; Narasimhan, K. Improving Language Understanding by Generative Pre-Training. 2018. Available online: https://api.semanticscholar.org/CorpusID:49313245 (accessed on 1 October 2022).
- Raffel, C.; Shazeer, N.M.; Roberts, A.; Lee, K.; Narang, S.; Matena, M.; Zhou, Y.; Li, W.; Liu, P.J. Exploring the Limits of Transfer Learning with a Unified Text-to-Text Transformer. J. Mach. Learn. Res. 2020, 21, 140:1–140:67. [Google Scholar]
- Brown, T.B.; Mann, B.; Ryder, N.; Subbiah, M.; Kaplan, J.; Dhariwal, P.; Neelakantan, A.; Shyam, P.; Sastry, G.; Askell, A.; et al. Language models are few-shot learners, Advances in Neural Information Processing Systems. arXiv 2020, arXiv:2005.14165. [Google Scholar]
- Alexey, D.; Lucas, B.; Alexander, K.; Dirk, W.; Zhai, X.; Thomas, U.; Mostafa, D.; Matthias, M.; Georg, H.; Sylvain, G.; et al. An Image is Worth 16×16 Words: Transformers for Image Recognition at Scale. arXiv 2021, arXiv:2010.11929. [Google Scholar]
- Zheng, S.; Lu, J.; Zhao, H.; Zhu, X.; Luo, Z.; Wang, Y.; Fu, Y.; Feng, J.; Xiang, T.; Philip, H.S.T.; et al. Rethinking Semantic Segmentation from a Sequence-to-Sequence Perspective with Transformers. In Proceedings of the 2021 IEEE/CVF Conference on Computer Vision and Pattern Recognition (CVPR), Virtual, 19–25 June 2021; pp. 6877–6886. [Google Scholar]
- Chen, J.; Lu, Y.; Yu, Q.; Luo, X.; Ehsan, A.; Wang, Y.; Lu, L.; Alan, L.Y.; Zhou, Y. TransUNet: Transformers Make Strong Encoders for Medical Image Segmentation. arXiv 2021, arXiv:2102.04306. [Google Scholar]
- National Bureau of Statistics of China. China Statistical Yearbook, 2023rd ed.; National Bureau of Statistics of China: Beijing, China, 2023. [Google Scholar]
- Takeuchi, W.; Darmawan, S.; Shofiyati, R.; Khiem, M.V.; Oo, K.S.; Pimple, U.; Heng, S. Near-real time meteorological drought monitoring and early warning system for croplands in Asia. In Proceedings of the 36th Asian Conference on Remote Sensing (ACRS), Quezon City, Philippines, 24–28 October 2015. [Google Scholar]
- Saha, S.; Moorthi, S.; Wu, X.; Wang, J.; Nadiga, S.; Tripp, P.; Behringer, D.; Hou, Y.; Chuang, H.; Iredell, M.; et al. NCEP Climate Forecast System Version 2 (CFSv2) 6-Hourly Products; Research Data Archive at the National Center for Atmospheric Research, Computational and Information Systems Laboratory: Boulder, CO, USA, 2011. [Google Scholar] [CrossRef]
- Rodell, M.; Houser, P.R.; Jambor, U.; Gottschalck, J.; Mitchell, K.; Meng, C.-J.; Arsenault, K.; Cosgrove, B.; Radakovich, J.; Bosilovich, M.; et al. The Global Land Data Assimilation System. Bull. Am. Meteorol. Soc. 2004, 85, 381–394. [Google Scholar] [CrossRef]
- Muñoz Sabater, J. ERA5-Land Monthly Averaged Data from 1981 to Present; Copernicus Climate Change Service (C3S) Climate Data Store (CDS): Reading, UK, 2019. [Google Scholar]
- Kubota, T.; Aonashi, K.; Ushio, T.; Shige, S.; Takayabu, Y.N.; Kachi, M.; Arai, Y.; Tashima, T.; Masaki, T.; Kawamoto, N.; et al. Global Satellite Mapping of Precipitation (GSMaP) Products in the GPM Era. Adv. Glob. Chang. Res. 2020, 67. [Google Scholar] [CrossRef]
- Bessho, K.; Date, K.; Hayashi, M.; Ikeda, A.; Imai, T.; Inoue, H.; Kumagai, Y.; Miyakawa, T.; Murata, H.; Ohno, T.; et al. An introduction to Himawari-8/9—Japan’s new-generation geostationary meteorological satellites. J. Meteorol. Soc. Jpn. 2016, 94, 151–183. [Google Scholar] [CrossRef]
- Todd, J.H.; Melanie, K.V.; Gail, L.S.; Yen-Ju, B.; Joshua, J.P.; Joshua, D.T.; Jeff, T.F.; John, L.D. The Landsat Burned Area algorithm and products for the conterminous United States. Remote Sens. Environ. 2020, 244, 111801. [Google Scholar]
- Xu, G.; Zhong, X. Real-time wildfire detection and tracking in Australia using geostationary satellite: Himawari-8. Remote Sens. Lett. 2017, 8, 1052–1061. [Google Scholar] [CrossRef]
- Liu, X.; He, B.; Quan, X. Near Real-Time Extracting Wildfire Spread Rate from Himawari-8 Satellite Data. Remote Sens. 2018, 10, 1654. [Google Scholar] [CrossRef]
- Olaf, R.; Philipp, F.; Homas, B. U-Net: Convolutional Networks for Biomedical Image Segmentation. In Proceedings of the Medical Image Computing and Computer-Assisted Intervention—MICCAI 2015, Munich, Germany, 5–9 October 2015; pp. 234–241. [Google Scholar]
- López-Sánchez, M.; Hernández-Ocaña, B.; Chávez-Bosquez, O.; Hernández-Torruco, J. Supervised Deep Learning Techniques for Image Description: A Systematic Review. Entropy 2023, 25, 553. [Google Scholar] [CrossRef]
- Tran, D.; Bourdev, L.; Fergus, R.; Torresani, L.; Paluri, M. Learning Spatiotemporal Features with 3D Convolutional Networks. In Proceedings of the 2015 IEEE International Conference on Computer Vision (ICCV), Santiago, Chile, 7–13 December 2015; pp. 4489–4497. [Google Scholar]
- Vaswani, A.; Shazeer, N.; Parmar, N.; Uszkoreit, J.; Jones, L.; Gomez, A.N.; Kaiser, Ł.; Polosukhin, I. Attention is all you need. In Proceedings of the 31st International Conference on Neural Information Processing Systems (NIPS’17), Long Beach, CA, USA, 4–9 December 2017; pp. 6000–6010. [Google Scholar]
- Hu, J.; Shen, L.; Sun, G. Squeeze-and-Excitation Networks. In Proceedings of the 2018 IEEE/CVF Conference on Computer Vision and Pattern Recognition, Salt Lake City, UT, USA, 18–22 June 2018; pp. 7132–7141. [Google Scholar]
- Woo, S.; Park, J.; Lee, J.Y.; Kweon, I.S. CBAM: Convolutional Block Attention Module. In Proceedings of the Computer Vision—ECCV 2018, Munich, Germany, 8–14 September 2018. [Google Scholar]
- Lin, T.Y.; Goyal, P.; Girshick, R.; He, K.; Dollar, P. Focal Loss for Dense Object Detection. IEEE Trans. Pattern Anal. Mach. Intell. 2020, 42, 318–327. [Google Scholar] [CrossRef]
- Wu, Z.; Wang, B.; Li, M.; Tian, Y.; Quan, Y.; Liu, J. Simulation of forest fire spread based on artificial intelligence. Ecol. Indic. 2022, 136, 108653. [Google Scholar] [CrossRef]
- Linardatos, P.; Papastefanopoulos, V.; Kotsiantis, S. Explainable AI: A Review of Machine Learning Interpretability Methods. Entropy 2021, 23, 18. [Google Scholar] [CrossRef]
- Khaire, U.M.; Dhanalakshmi, R. Stability of feature selection algorithm: A review. J. King Saud Univ.-Comput. Inf. Sci. 2022, 34, 1060–1073. [Google Scholar] [CrossRef]


| Data | Source | Temporal Resolution | Spatial Resolution |
|---|---|---|---|
| DEM | Copernicus DEM GLO-30 dataset | - | 30 m |
| Drought | Keetch–Byram Drought Index (KBDI) dataset [55] | 1 day | 4 km |
| Geopotential Height | NCEP Climate Forecast System dataset [56] | 6 h | 22 km |
| Humidity, Soil Humidity | GLDAS-2.1 dataset [57] | 3 h | 27 km |
| Temperature, vwind, uwind | ERA5-Land dataset [58] | 1 h | 11 km |
| Precipitation | GSMaP dataset [59] | 1 h | 11 km |
| NDVI | MODIS Terra Daily NDVI dataset | 1 day | 0.4 km |
| Fire | Himawari-8 NetCDF data [60] | 10 min | 2 km |
| Model | F1-Score | MIou | Execution Time (s) |
|---|---|---|---|
| Wang Zhengfei-CA | 0.7041 | 0.7570 | 0.5 |
| Random Forest | 0.6975 | 0.7232 | 2 |
| CNN-LSTM combined | 0.7421 | 0.7792 | 13 |
| 3DUnet | 0.7715 | 0.8090 | 12 |
| 3DUnetTransformer | 0.7769 | 0.8114 | 16 |
| AutoST-Net | 0.8050 | 0.8298 | 24 |
| Model | Loss | F1-Score | MIou |
|---|---|---|---|
| AutoST-Net | Focal Loss | 0.8050 | 0.8298 |
| Binary Cross-Entropy Loss | 0.7243 | 0.8001 |
| The Number of Input Channels | F1-Score | MIou |
|---|---|---|
| 11 (Baseline) | 0.7534 | 0.7976 |
| 14 (+Visible Light Bands) | 0.8050 | 0.8298 |
| 16 (+Bands 7 and 14) | 0.7681 | 0.7945 |
| Region | F1-Score | MIou |
|---|---|---|
| Sichuan and Yunnan Province | 0.8050 | 0.8298 |
| Hanma Biosphere Reserve | 0.7144 | 0.7362 |
Disclaimer/Publisher’s Note: The statements, opinions and data contained in all publications are solely those of the individual author(s) and contributor(s) and not of MDPI and/or the editor(s). MDPI and/or the editor(s) disclaim responsibility for any injury to people or property resulting from any ideas, methods, instructions or products referred to in the content. |
© 2024 by the authors. Licensee MDPI, Basel, Switzerland. This article is an open access article distributed under the terms and conditions of the Creative Commons Attribution (CC BY) license (https://creativecommons.org/licenses/by/4.0/).
Share and Cite
Chen, X.; Tian, Y.; Zheng, C.; Liu, X. AutoST-Net: A Spatiotemporal Feature-Driven Approach for Accurate Forest Fire Spread Prediction from Remote Sensing Data. Forests 2024, 15, 705. https://doi.org/10.3390/f15040705
Chen X, Tian Y, Zheng C, Liu X. AutoST-Net: A Spatiotemporal Feature-Driven Approach for Accurate Forest Fire Spread Prediction from Remote Sensing Data. Forests. 2024; 15(4):705. https://doi.org/10.3390/f15040705
Chicago/Turabian StyleChen, Xuexue, Ye Tian, Change Zheng, and Xiaodong Liu. 2024. "AutoST-Net: A Spatiotemporal Feature-Driven Approach for Accurate Forest Fire Spread Prediction from Remote Sensing Data" Forests 15, no. 4: 705. https://doi.org/10.3390/f15040705
APA StyleChen, X., Tian, Y., Zheng, C., & Liu, X. (2024). AutoST-Net: A Spatiotemporal Feature-Driven Approach for Accurate Forest Fire Spread Prediction from Remote Sensing Data. Forests, 15(4), 705. https://doi.org/10.3390/f15040705