Article

A Comparison of Unpiloted Aerial System Hardware and Software for Surveying Fine-Scale Oak Health in Oak–Pine Forests

by
Benjamin T. Fraser
1,*,
Larissa Robinov
2,
William Davidson
2,
Shea O’Connor
1 and
Russell G. Congalton
1
1
Department of Natural Resources and the Environment, University of New Hampshire, Durham, NH 03824, USA
2
Division of Forests & Lands, New Hampshire Department of Natural and Cultural Resources, Concord, NH 03301, USA
*
Author to whom correspondence should be addressed.
Forests 2024, 15(4), 706; https://doi.org/10.3390/f15040706
Submission received: 29 March 2024 / Revised: 12 April 2024 / Accepted: 15 April 2024 / Published: 17 April 2024
(This article belongs to the Special Issue Application of Close-Range Sensing in Forestry)

Abstract

:
Spongy moth (Lymantria dispar dispar) has caused considerable damage to oak trees across eastern deciduous forests. Forest management, post-outbreak, is resource intensive and typically focused on ecosystem restoration or resource loss mitigation. Some local forest managers and government partners are exploring developing technologies such as Unpiloted Aerial Systems (UASs, UAVs, or drones) to enhance their ability to gather reliable fine-scale information. However, with limited resources and the complexity of investing in hardware, software, and technical expertise, the decision to adopt UAS technologies has raised questions on their effectiveness. The objective of this study was to evaluate the abilities of two UAS surveying approaches for classifying the health of individual oak trees following a spongy moth outbreak. Combinations of two UAS multispectral sensors and two Structure from Motion (SfM)-based software are compared. The results indicate that the overall classification accuracy differed by as much as 3.8% between the hardware and software configurations. Additionally, the class-specific accuracy for ’Declining Oaks‘ differed by 5–10% (producer’s and user’s accuracies). The processing experience between open-source and commercial SfM software was also documented and demonstrated a 25-to-75-fold increase in processing duration. These results point out major considerations of time and software accessibility when selecting between hardware and software options for fine-scale forest mapping. Based on these findings, future stakeholders can decide between cost, practicality, technical complexity, and effectiveness.

1. Introduction

Spongy moth (Lymantria dispar dispar), native to Eurasia, is an invasive pest in North America, which was accidentally introduced in the 1860s in Massachusetts. In the more than 150 years spongy moth has been present in North America, tens of millions of hectares of forest have been defoliated during cyclical outbreak events with damage frequently manifesting as tree decline and mortality [1,2,3,4,5,6,7]. While the outbreaks of forest insects and diseases are not novel, their extent and impact have increased to devastating proportions in recent decades. The caterpillars of this species can feed on a wide variety of plants but prefer oaks (Quercus spp.) [8,9]. Tree decline and mortality related to spongy moth outbreaks can be exacerbated by compounding factors such as drought or unseasonably low temperatures [8]. These factors occurred in concert between 2021 and 2023 in the northeastern United States [10,11]. In New Hampshire, large spongy moth outbreaks were observed for the first time in nearly 30 years beginning in 2021 and continuing through 2023 [12]. In 2021 and 2022, over 20,000 hectares (ha) of spongy moth defoliation was mapped in New Hampshire (NH) by the NH Forest Health Bureau’s annual aerial forest survey flights [12,13,14].
When the extent of the damage to NH oak forests became apparent in spring of 2023, foresters responsible for managing several thousand acres of oak-dominated forests in the heart of the spongy moth-defoliated area contacted the NH Forest Health Bureau. The foresters were seeking advice regarding the future prospect of declining trees and how this information might inform future management decisions. Specifically, the foresters were planning for an upcoming timber harvest to salvage dead and declining oaks. Foresters look to use silvicultural methods both as a treatment as well as a way to salvage standing dead and declining trees before their economic value is lost due to decay [15,16,17,18,19]. Tree decomposition on the stump not only results in lost potential value of wood products, but it also transitions the forest from a carbon sink to a carbon source. Forest pests and diseases have been shown to reduce carbon sequestration [20]. Overall, forest degradation is known to cause reduced timber production, limit biodiversity, and impair ecosystem function [21,22,23]. Extensive tree mortality can also increase fire risk, negatively impact recreation, and affect local economies [23]. The forests in New Hampshire and neighboring Vermont provide several billions of dollars in revenue annually, with much of the forested land being privately owned [10,21]. Forest management actions, such as thinning in affected oak stands, are expected to reduce subsequent mortality due to spongy moth caterpillar outbreaks [7].
The aerial surveys conducted to map the statewide extent of oak decline are a widely adopted practice for attaining landscape level data on forest insect and disease impacts [6,24,25] but are not designed for management-level evaluation of decline. Comprehensive, local-scale knowledge is needed by foresters and land managers to implement adaptive strategies. This can either be performed via traditional field surveys on foot, or, if the resources are available, using the following newer survey tool: Unpiloted Aerial Systems. Unpiloted Aerial Systems (UASs, UAVs, or drones) are frequently used in localized research-related surveys and employed as a tool for tree level mapping [17,26,27,28,29]. However, commercial use of UASs in the natural resources industry are not yet widely adopted. Multispectral UAS sensor capabilities expand the depth of detail captured during surveys, especially in relation to vegetation health applications [30,31,32,33,34,35]. Different multispectral sensors are available for purchase, ranging in price, number of bands available, and frequencies collected. For smaller outfits with limited budgets, such as local governments or smaller businesses, tough decisions need to be made regarding resource allocation. Between training of staff, purchasing the UAS and sensor(s), establishing a ground control station, and purchasing the associated software needed for pre-processing and analysis, compromises need to be made for organizations to stay operational. UASs can range in price from a few hundred dollars to tens of thousands of dollars [36,37,38,39]. The selection of a comprehensive yet affordable image processing or photogrammetry software is also no easy task [33,40]. There are many open-source and commercial software applications available that are capable of performing some processing and analysis functions, but each requires a unique level of technical expertise [41,42].
In recent years, due to the rapid expansion of UAS applications, practitioners have begun to make comparisons between hardware and software choices as well as highlight the need for standardization and accessibility [17,32,42,43]. For example, in Changsalak and Tiansawat [
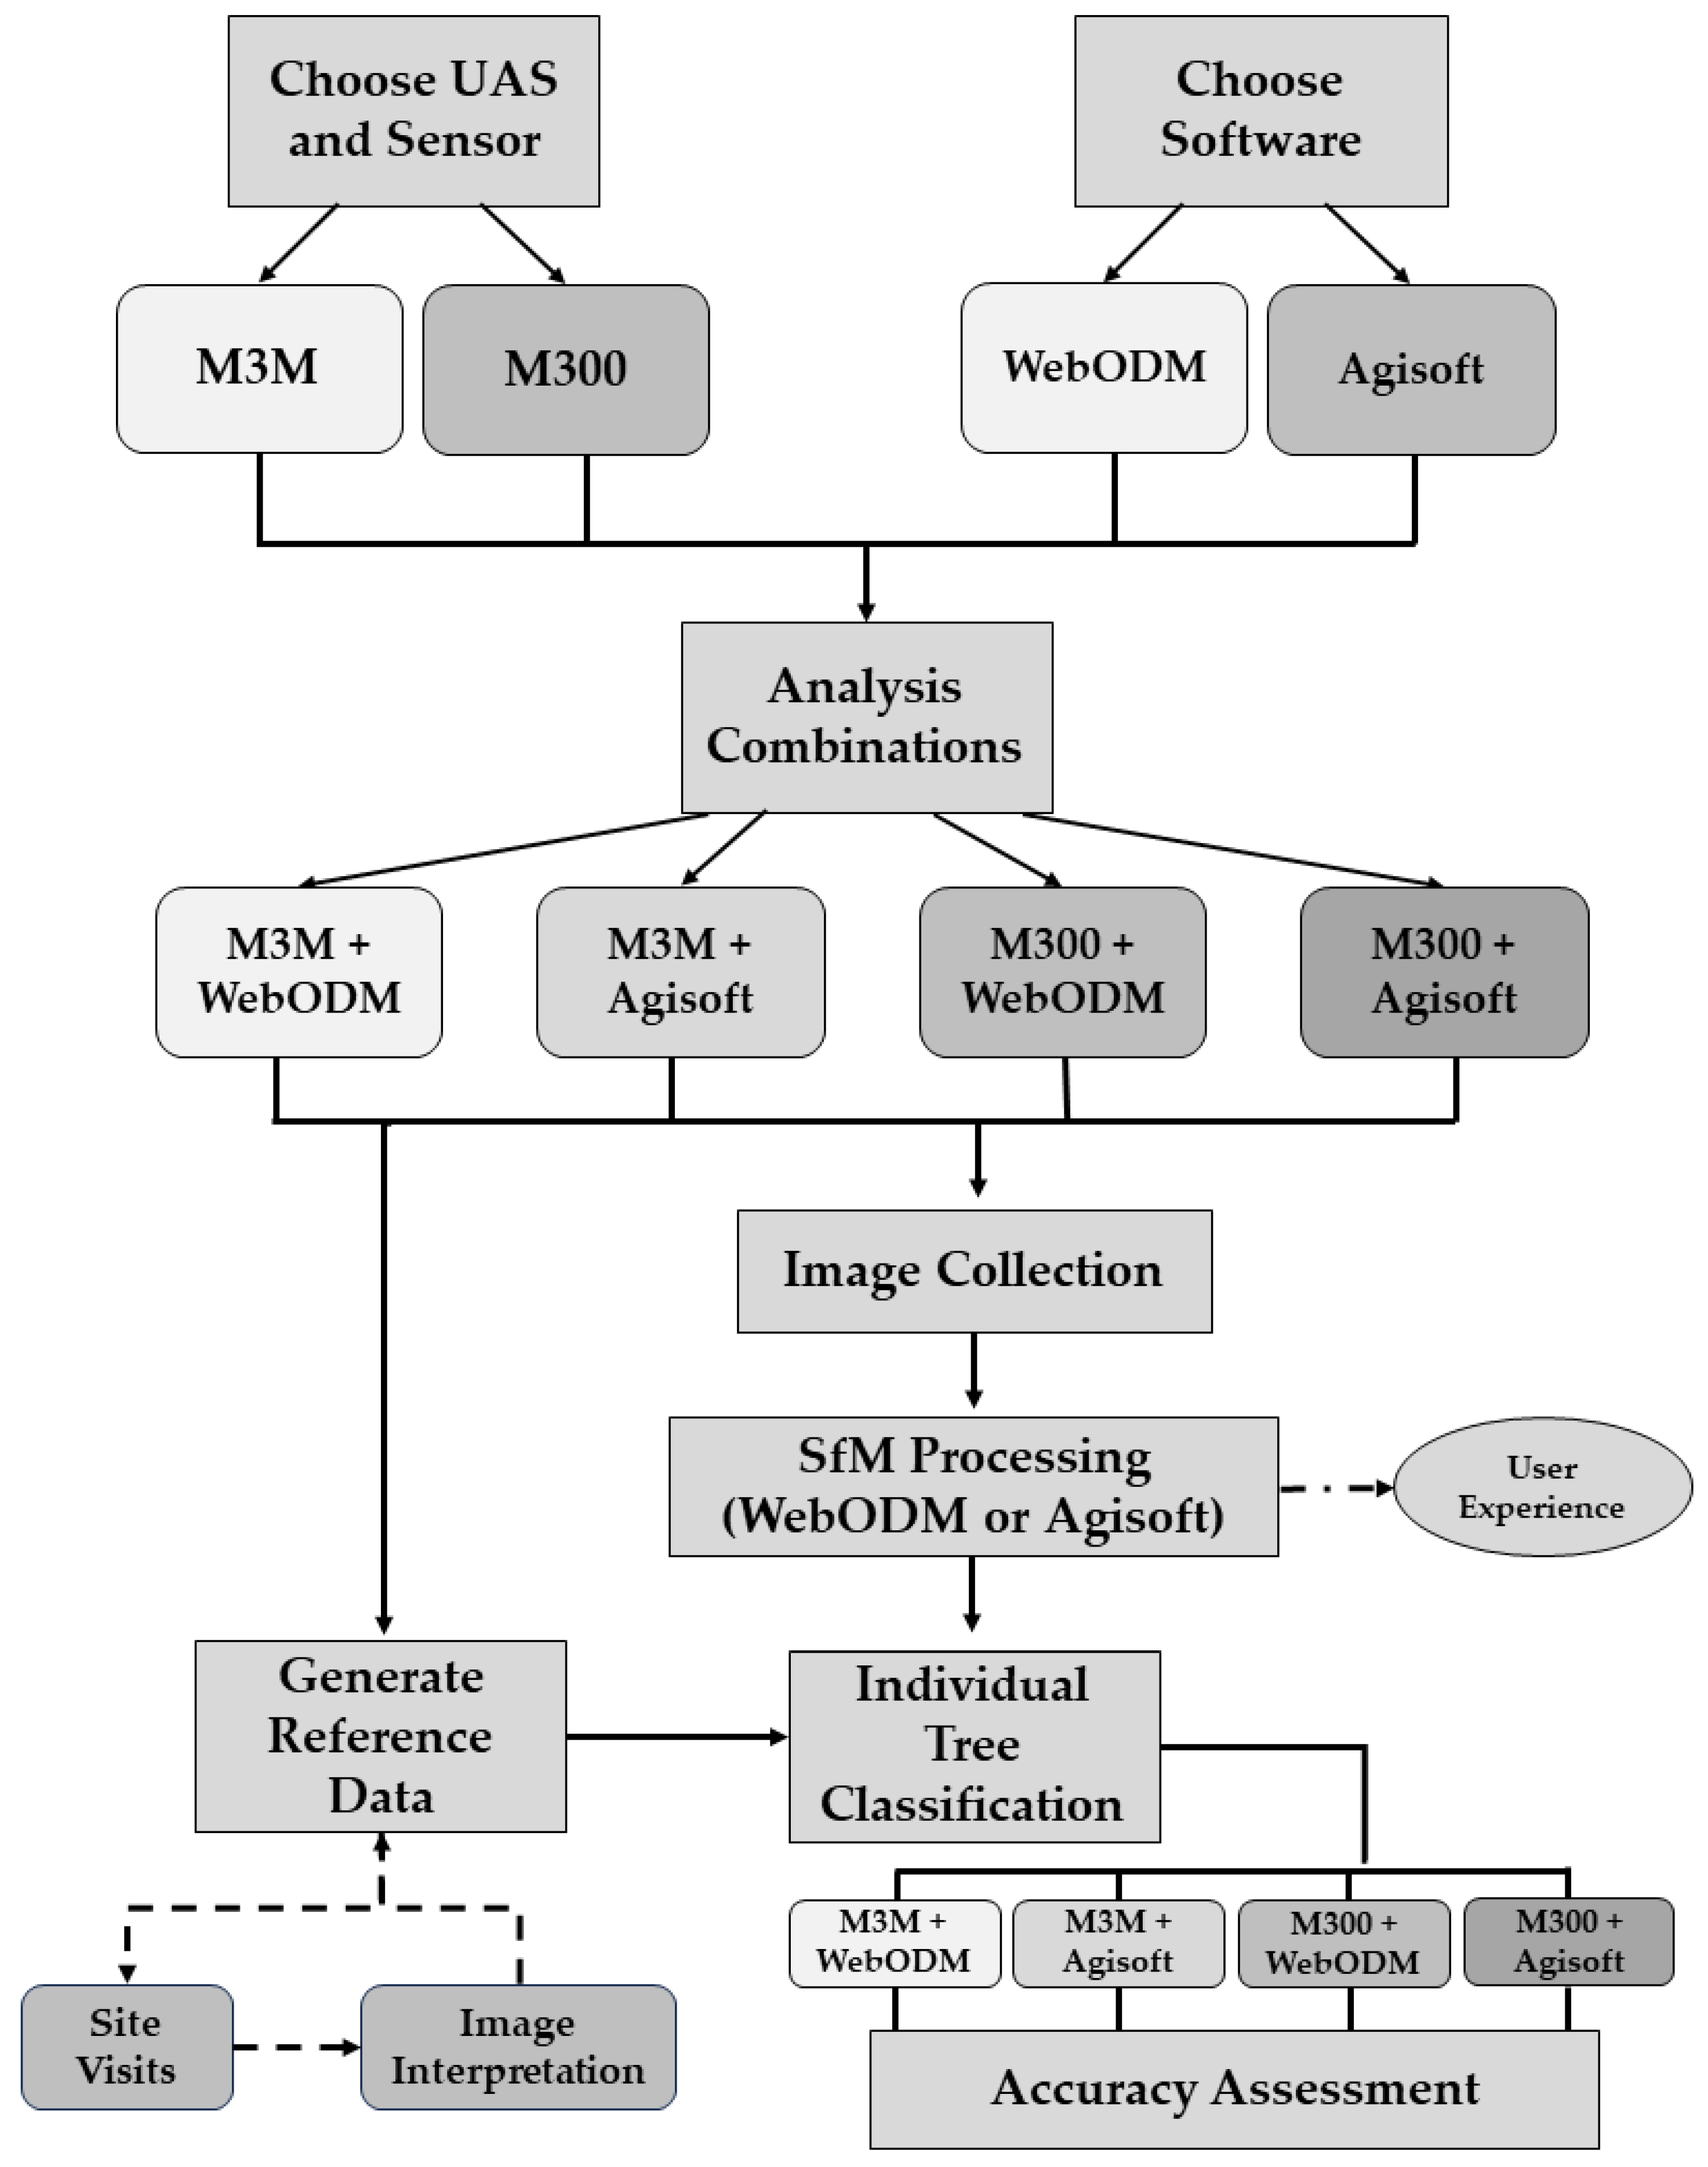
40], the authors tested WebODM against Pix4Dmapper (Pix4D S.A. Prilly, Switzerland) and determined that the results were similar but not equivalent. WebODM produced slightly higher levels of omission error for tree detections. The primary objective of this research is to evaluate the effectiveness of two UAS surveying approaches for classifying the health of individual oak trees following a spongy moth outbreak. To accomplish this, we quantified the differences in classification accuracy based on two tests. The first used different UAS sensors and the second used two different software capabilities: commercial software and open-source software (
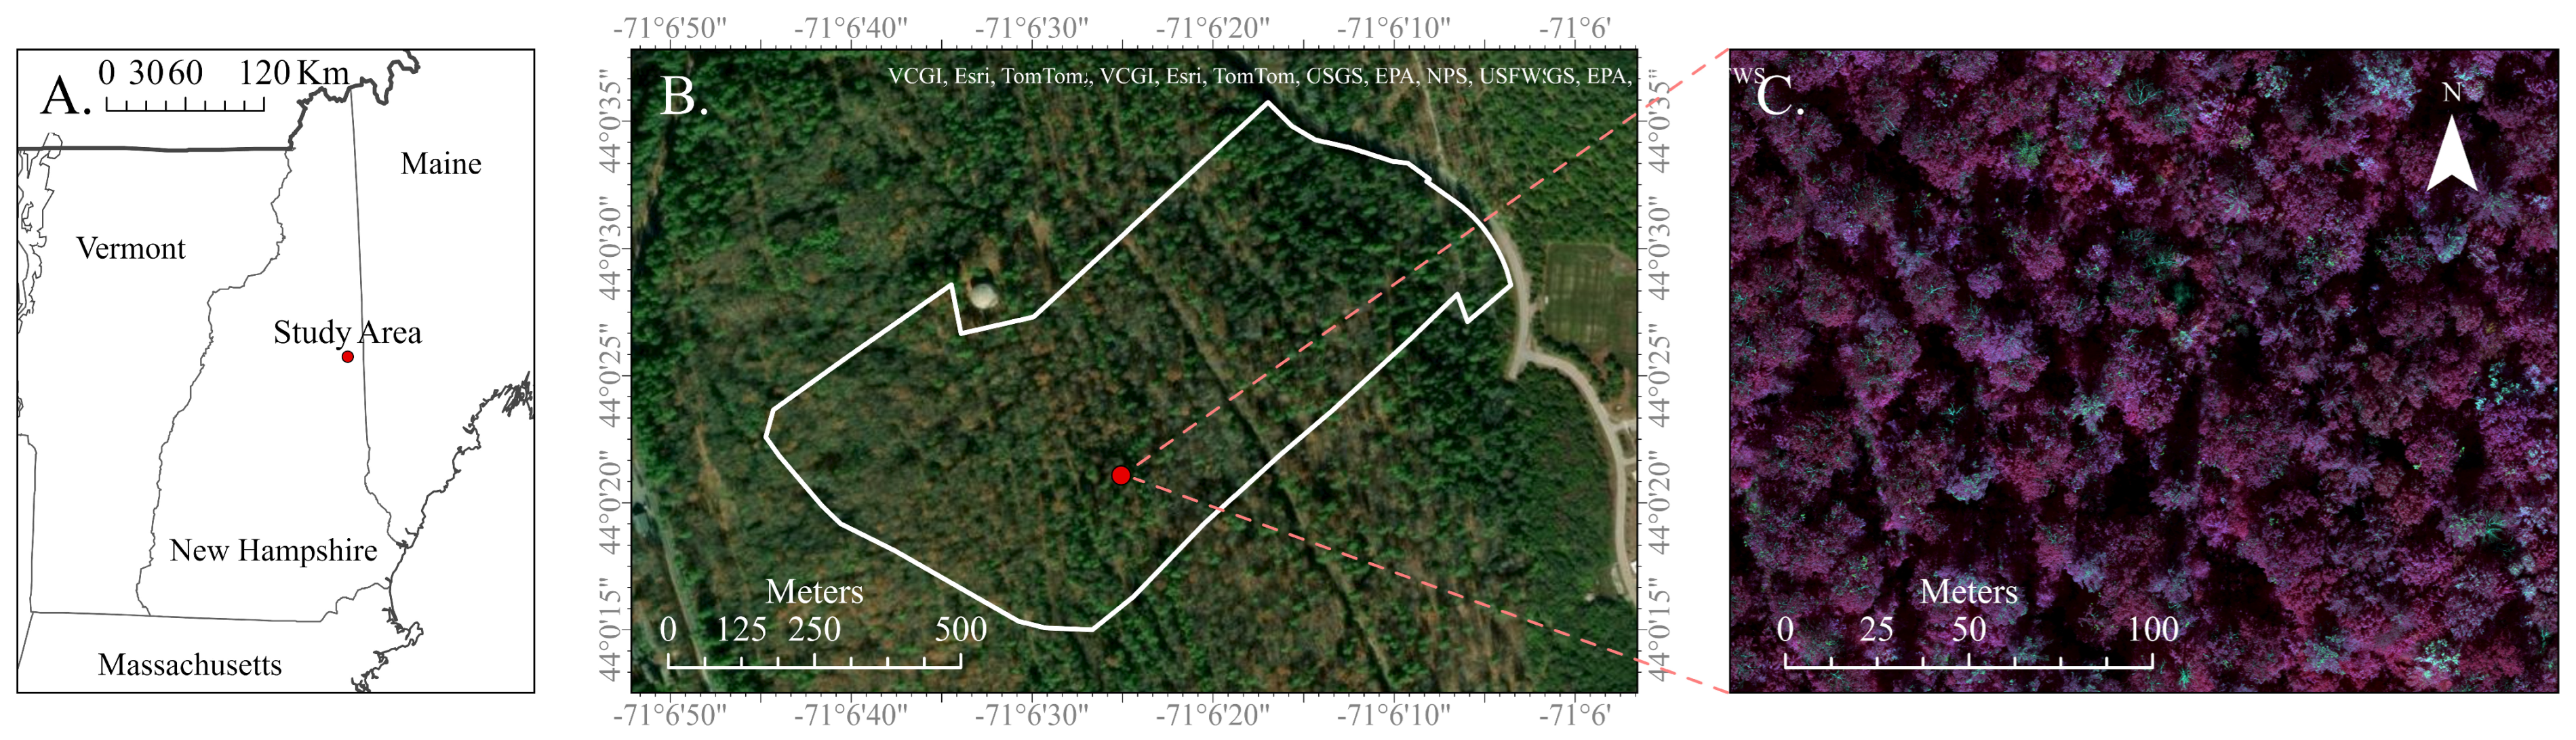
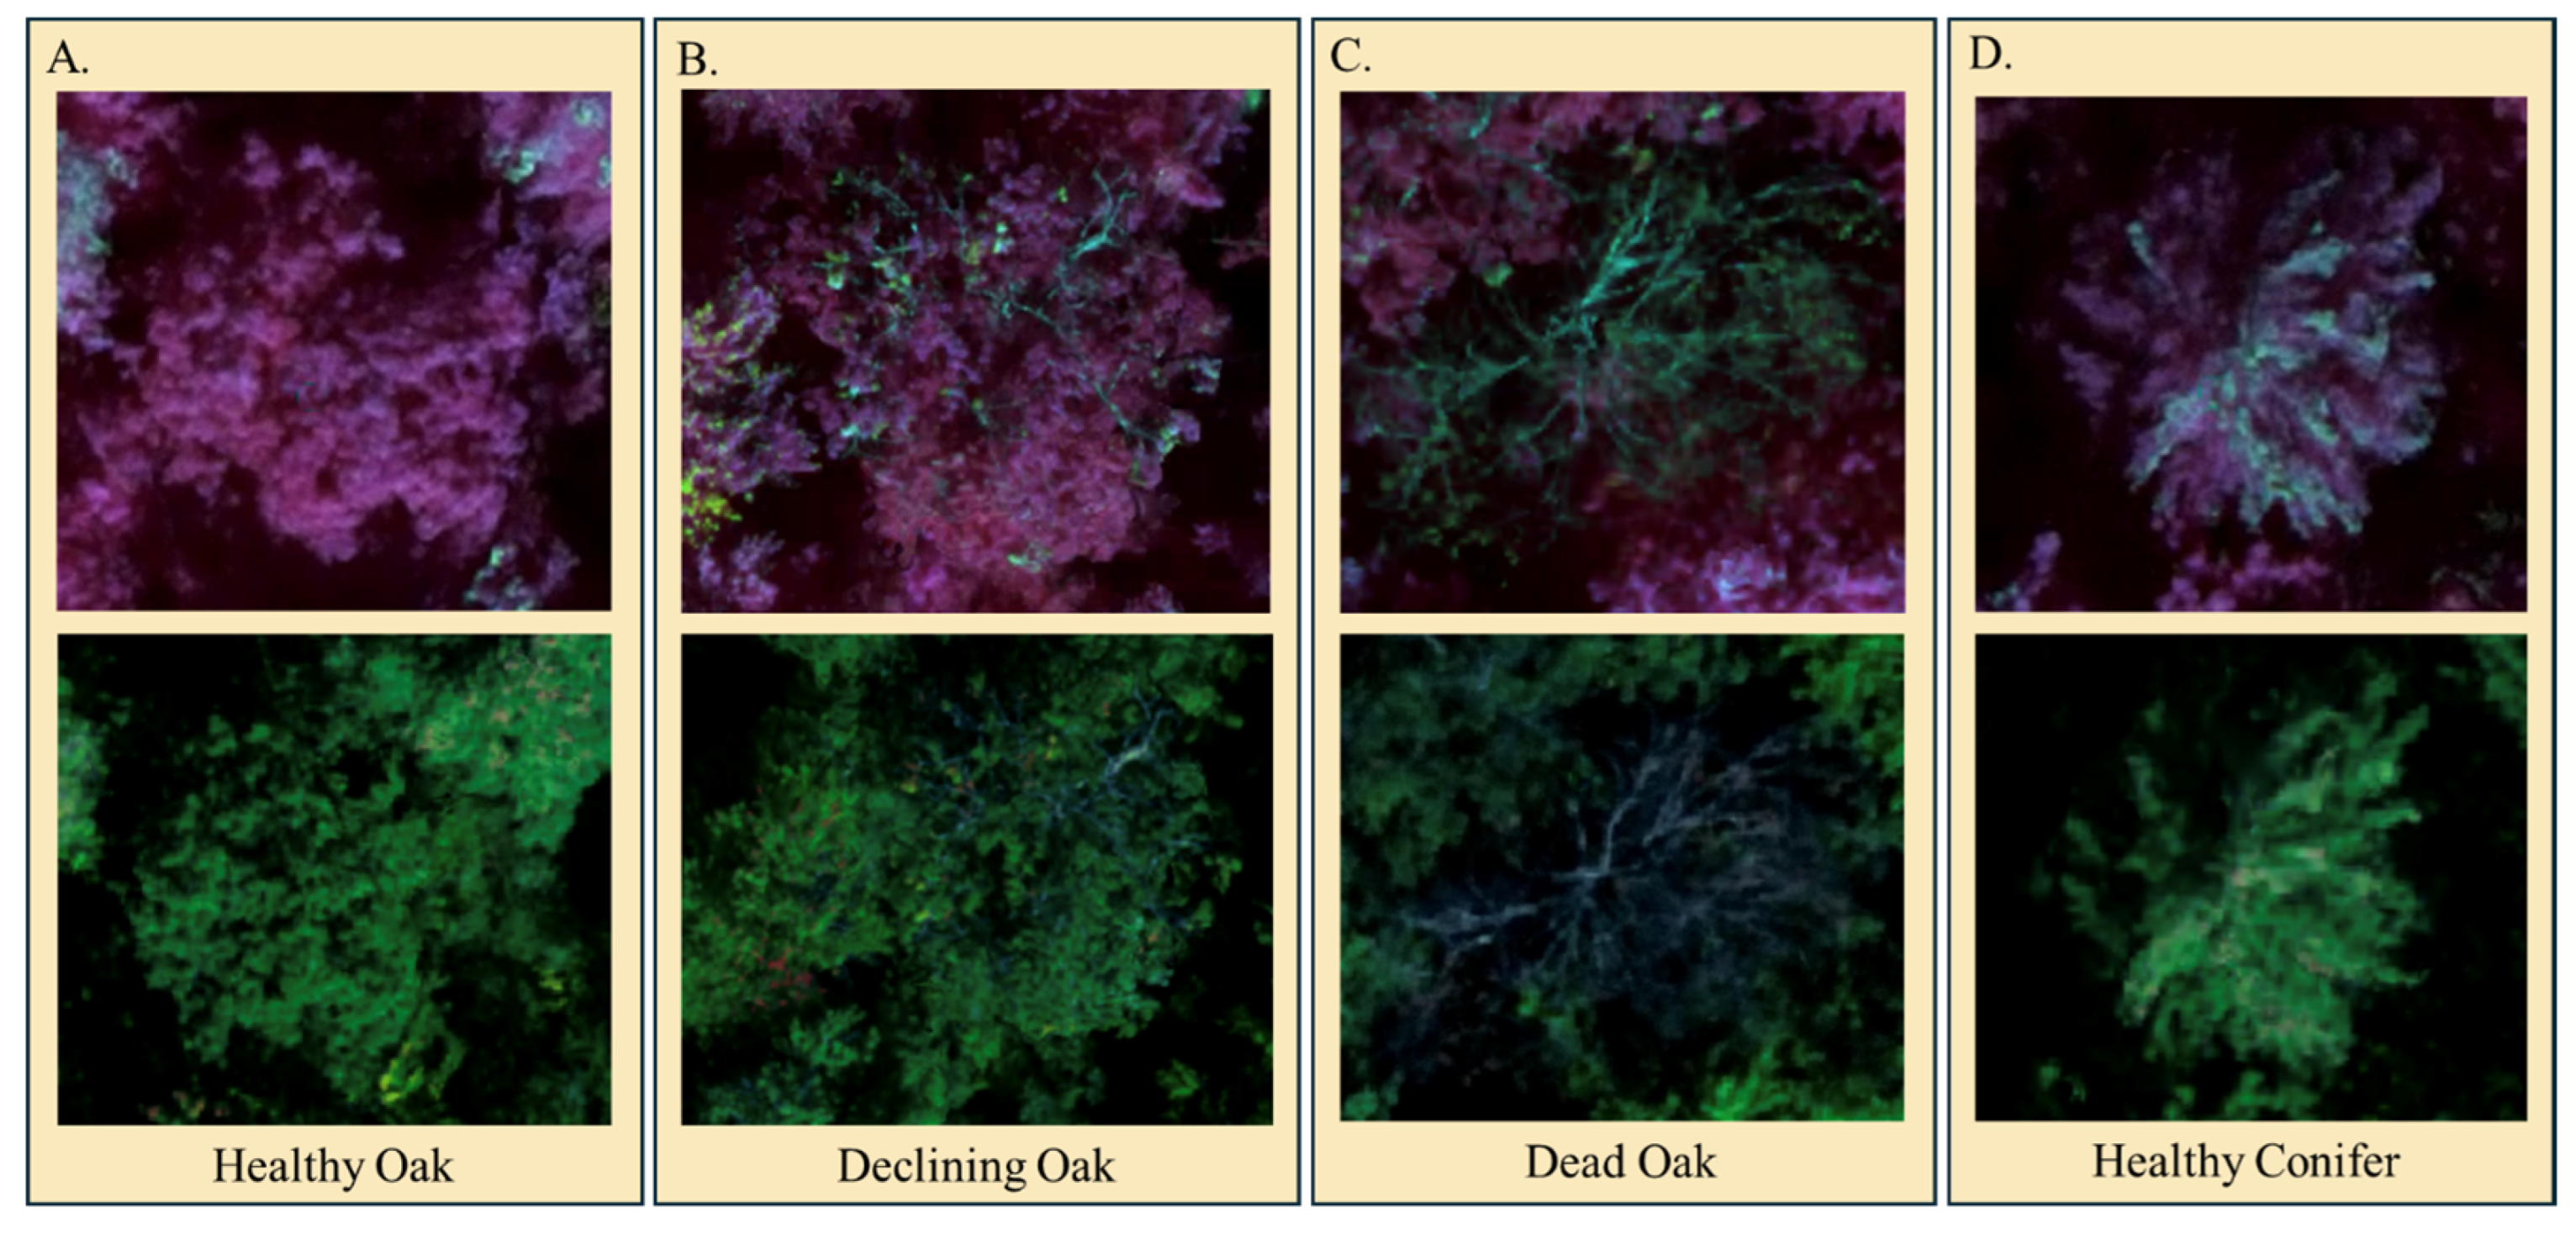
Table 1). The forests surveyed were dominated by northern red oak (Quercus rubra) and eastern white pine (Pinus strobus). Oaks were divided into three health classes: healthy, declining, and dead. We also discuss important characteristics of our image processing experience using these hardware and software options. Based on these findings, stakeholders can make practical decisions related to resource allocation, accuracy, and technical complexity.

2. Materials and Methods

2.1. Study Area

The Pine Hill Community Forest (Pine Hill) is a 240 ha oak–pine forest located in Conway, New Hampshire (Figure 1) [44]. The Upper Saco River Valley region, which includes Conway and several surrounding towns, experienced extensive spongy moth-induced defoliation in 2021 and 2022, with roughly 14,000 ha of impacted forest [13,14]. By 2023, the outbreak subsided [12]. Dry weather may have contributed to the magnitude of the spongy moth caterpillar outbreaks. The transmission of two pathogens that play a crucial role in regulating spongy moth caterpillar populations, the fungus Entomophaga maimaiga and the L. dispar nucleopolyhedrosis virus, was facilitated by wet weather conditions [45]. Coinciding with these defoliation events, the study region experienced abnormally dry weather throughout prolonged periods during the growing seasons in both 2021 and 2022. Lack of frequent rainfall during the time of the outbreak would have limited the ability of pathogens to spread, allowing large caterpillar buildup. In addition to the compounded stressors of defoliation and drought, the northeastern United States (US) was hit by a late-season hard freeze during mid-May of 2023. The tender emergent oak leaves were destroyed by the frost, rapidly turning brown and shriveling up. Cold air mainly settled in valleys; therefore, lower-elevation trees were more seriously damaged.
This study focused specifically on approximately 50 ha of forest located in the northwest corner of Pine Hill. The site covers an oak-dominated stand, which was heavily defoliated by the recent outbreaks. Additionally, our study is being used to inform a parallel project on a similar property about a mile (1.6 km) north of the study area where a salvage operation is in process. The results of that UAS survey will be used to supplement harvest planning.
The methodology used in this comparison study can be divided into four parts. First, the reference data used to train and assess the results were collected. Second, the UAS imagery was acquired using the two multispectral sensors compared in this study. Once collected, the imagery was processed using the two UAS Structure from Motion (UAS-SfM) processing software packages. Finally, a tree classification was performed for each sensor/software combination, and the results were evaluated using a quantitative accuracy assessment (i.e., error matrix). A flowchart summarizing this methodology is presented in Figure 2.

2.2. Reference Data

Reference samples for four tree classes were generated from a combination of site visits and high-resolution image interpretation. The site visits, conducted by members of the NH Division of Forests and Lands, were used to gather a perspective on the extent and distribution of each tree class within this study site. Afterwards, these same experts conducted visual assessments of the high-resolution UAS imagery (Figure 3) to generate each reference sample. These four classes included the following: Healthy Oak, Declining Oak, Dead Oak, and Healthy Conifer (Figure 3). The definitions for each class are given below and are based on assessments of canopy discoloration and transparency (i.e., crown vigor), as defined in [16,18].
  • Healthy Oak: Any oak tree (Quercus spp.) green in color, containing only trace amounts of crown transparency, discolored leaves, or fine twig dieback.
  • Declining Oak: Any oak tree (Quercus spp.) that exhibits greater than 25% crown transparency, discoloration, or an apparent reduction in foliar density. Such trees feature a measurable amount of yellow coloration or transparency.
  • Dead Oak: Any oak tree (Quercus spp.) that features greater than 50% (simple majority) of the crown being dead. This includes dead foliage, which are brown in color, and branches absent of leaves.
  • Healthy Conifer: Any coniferous tree featuring less than 50% crown discoloration, crown transparency, or fine twig dieback. Such species include eastern white pine (Pinus strobus) and eastern hemlock (Tsuga canadensis).
Previous studies of spongy moth defoliation established that three classes of crown conditions (vigor) can be useful for subsequent management [18]. The Healthy Conifer class was included due to the heavy cone abundance of trees in this region during 2023, which may cause confusion with dead oaks (i.e., those featuring brown leaves).
A total of 312 reference trees were identified by qualified members of the New Hampshire Division of Forests and Lands, based on knowledge of oak tree decline by Gottschalk et al. [18]. This included 71 Healthy Oak trees, 84 Declining Oak trees, 71 Dead Oak trees, and 84 Healthy Conifer trees.

2.3. UAS Data

To address our first research question, remotely sensed imagery was collected on the same day, 26 September 2023, by two independent UASs. First, the DJI Matrice 300 RTK (M300) (Shenzhen, China) was equipped with a MicaSense RedEdge-MX Dual Camera Imaging System (10-band sensor) (Seattle, WA, USA). This enterprise grade system was purchased for roughly USD 32,200 in 2022. Second was the DJI Mavic 3 Multispectral (M3M) (Shenzhen, China), which comes equipped with a natural color camera and a four-band multispectral sensor. The total price of this second system was roughly USD 4500. The full sets of spectral wavelengths (bands) for both sensors are shown in Table 2.
The flight paths for both UASs were pre-programmed using DJI Pilot software (v 6.1.2). The pre-programmed flight paths consisted of a singular mission for each UAS, consisting of parallel flight lines flown at approx. 7 m/s. The missions were generated based on the study area .kml. The terrain follow setting was enabled to maintain a flying height of 106.5 m (approx. 350 feet) above the ground. A 2022 statewide digital elevation model (DEM) with a spatial resolution of 0.76 m was imported to provide an accurate terrain model [46,47]. The front- and side-overlaps were 85% and 80%, respectively [48]. Both flights were conducted back-to-back during the mid-afternoon with light to moderate winds and minimal cloud coverage.

2.4. Processing

To address our second question, comparing open-source UAS Structure from Motion (UAS-SfM) processing software with commercial UAS-SfM software, the imagery from both UASs was processed using two UAS-SfM workflows, as detailed below. Generating a high-spatial-resolution, radiometrically corrected orthomosaic was the primary objective for the subsequent analysis [17]. A separate orthomosaic was created within each software using imagery from each respective UAS sensor. Only the multispectral imagery from the M3M was included in the classification and analysis. The natural color sensor on the M3M did not match the characteristics of the multispectral sensor (e.g., focal length or pixel size) and so could not be integrated during the SfM workflow. The imagery for both UASs was radiometrically corrected within the respective software when possible. The M300 multispectral data were pre-processed using their associated calibration panel. Images of this panel were taken directly before the flight. The M3M multispectral data were pre-processed using internal (DJI-specific) calibration coefficients written to the image metadata.
We used WebODM (v 2.2.0) as our open-source processing solution. Only a small fee was charged by the developer to facilitate a simplified installation process. WebODM is a toolkit comprising a graphical user interface (GUI) for coordinating several python processing workflows for image analysis and SfM [49,50]. The imagery for both UASs was processed using the ‘High-Resolution’ template. This quality setting influenced the point cloud density. Due to software limitations in WebODM, the MicaSense Dual-MX imagery was processed in two batches (5 bands each, reflecting independent processing for the two paired sensors).
Agisoft Metashape (Agisoft) (v 2.0.0, Agisoft LLC, St. Petersburg, Russia) was used as the commercial UAS-SfM solution. This software has been favored for fine-scale photogrammetry and analysis in natural resources [48,51,52]. This software was quoted at USD 3500 for a perpetual license (approx. USD 549 for education use) as of March 2024. The processing settings in Agisoft were selected to be as consistent as possible with WebODM. ‘High’ accuracy image alignment and point cloud quality setting were selected.
Challenges experienced while carrying out these four UAS-SfM processing workflows as well as the total time required to create the end products for each workflow were recorded to fully document the user experience.

2.5. Analysis

The 312 reference trees were manually reviewed and digitized within each of the four sensor and software combination orthomosaics by a pair of remote-sensing technicians using ArcGIS Pro (v 3.1, Redlands, CA, USA). The tree crowns were manually digitized to provide precise representations of each sample for each UAS-SfM model. A set of 50 object-based features (attributes) was then calculated for each tree crown using Trimble eCognition (v 10.2, Trimble, Munich, Germany) (Table 3). These individual tree crown features were chosen based on their importance in recent studies of forest health using similar sensors [53,54]. Shape features such as ‘length/width’ or ‘size in pixels’ were not included to avoid subjectivity resulting from the tree crowns being manually digitized. Based on the absence of a Blue and Coastal Blue band, 18 features could not be created using the M3M sensor models. An explanation of each derivative band (i.e., spectral index) can be found in Appendix A.
The tree crowns were then classified using the random forest supervised classification algorithm [26,55,56]. The python package scikit-learn (scikit-learn v 1.2.2) [57] was used to perform the classification and accuracy assessment. For each of the four sets of reference samples, the classification was performed a minimum of 10 times. The training and testing data were split into two equal groups (50%/50%, stratified based on class) [54]. An average overall accuracy was calculated based on the initial 10 iterations using a thematic map accuracy assessment error matrix [58,59,60]. Additionally, we used a feature importance test to weight the relative contribution of input features based on the Gini Index [55,61]. Based on the results of this test, a selection of the least important features was removed from each classification, and the algorithm was run 10 times to establish a new average overall accuracy [53,62]. An error matrix was created based on the top performing (highest overall accuracy) feature set for each of the four UAS sensor models: (1) M300 and Agisoft, (2) M3M and Agisoft, (3) M300 and WebODM, and (4) M3M and WebODM. Using these error matrices, the overall accuracy (i.e., total agreement between the reference data and the classification output), producer’s accuracy (i.e., omission error), and user’s accuracy (i.e., commission error) could be reviewed and compared among the tests [58,60].

3. Results

3.1. Processing

Remotely sensed imagery captured using the M300 and M3M UASs was each processed using both open-source WebODM SfM software and commercial Agisoft Metashape software. The spatial resolution for the four-band M3M multispectral imagery orthomosaics ranged from 5.4 cm to 5.7 cm. The spatial resolution for the 10-band M300 multispectral imagery orthomosaics ranged from 8.4 cm to 8.8 cm. The M3M imagery was processed using Agisoft in just over 4 h. Similarly, the M300 imagery processed using the same settings in just over 3 h. While using WebODM, the M3M imagery finished processing in approximately 17 h. Performing the same task using the M300 (10-band) imagery required over 99 h. Two key limitations were experienced during this processing task. First, WebODM software does not currently have an option for integrating the radiometric calibration plate imagery, taken at the start of each flight. This imagery is essential for pre-processing the M300 imagery. Secondly, WebODM software does not recognize multispectral imagery composites comprised of more than five bands. Due to this limitation, the imagery had to be reprocessed in two batches and composited independently in ArcGIS Pro. This reprocessing of just the orthoimagery using the ‘fast orthophoto’ option took 3.5 h to complete.

3.2. Analysis of Oak Health

The results of the tree level classification using each of the UAS hardware and software combinations are given below in Table 4. The combination of M300 and Agisoft achieved the highest overall classification accuracy for the four tree classes (89.5% ± 2.3%). The combination of M3M hardware and Agisoft software resulted in the lowest average overall classification accuracy (85.0% ± 2.9%), although this was essentially the same as the combination of M3M hardware and WebODM software (85.3% ± 2.3%). When comparing equivalent hardware, the use of open-source software instead of commercial software provided a slightly higher overall accuracy (0.3%) for M3M and a lower overall accuracy for M300 (−3.8%). When comparing equivalent software, M300 outperformed M3M only slightly using WebODM (0.4% higher overall classification accuracy) and moderately using Agisoft (4.5% higher overall classification accuracy). The class-specific changes in user’s and producer’s accuracies (i.e., commission and omission errors) based on these differences in overall performance were further examined while reviewing specific error matrices generated during this testing. Table 5 provides a single reference error matrix produced using the lowest performing hardware and software combination, M3M and Agisoft. In comparison to the top performing combination, M300 and Agisoft shown in Table 6, the user’s and producer’s accuracies for the class of interest (‘Declining Oak’) are 11.5% and 4.8% lower, respectively.
Each of the overall and class-specific classification accuracies reported above are based on the best combination of input features, following review of the calculated Gini Index for each iteration. While using M3M, the highest classification accuracy was achieved while using all 32 of the input features. While using M300 and MicaSense 10-band sensor, the highest overall classification accuracy was achieved following the removal of up to five of the least important features. Based on the results of the Gini Index calculations, the most important features for each of the hardware and software combinations are presented below in Table 7. For all tests, the Normalized Difference Vegetation Index (NDVI) and Ratio Vegetation Index (RVI) are among the most important bands. These derivative bands both require the Near-Infrared (NIR) and Red bands. For the classifications performed using M300 imagery, the Coastal Blue band was indicated as highly important using the Agisoft model, and the Blue band was present in at least a few of the derivative bands. In fact, both indices that were ranked as most important using the M300 sensor (Lichtenhaler Index (LIC) and Green Leaf Index (GLI)) cannot be used with the M3M sensor [63,64]. For the classifications performed using M3M imagery, the Green and Red bands were identified as important and were present in several of the most important derivative bands.

4. Discussion

The impact of spongy moth outbreaks on oak populations is widespread and has far-reaching consequences for forest resource health and management. Forest and land managers, including state agencies, work to minimize these ecological and economic impacts and build resiliency against future outbreaks [9,18,19,23], but often lack the tools and resources to adopt cutting-edge technologies to guide their decisions. UASs, and their associated image processing workflows, offer a way to bridge the gap between field observations and airborne or satellite-based observations, leading to more effective management efforts [62,65,66]. UAS assessments of oak crown vigor, especially at fine scales, can also support silvicultural management efforts, given operational flexibility for timely and frequent flights of UASs compared to more traditional imagery platforms (i.e., planes and satellites), which deal with cloud cover, fuel costs, and other logistical challenges [17,18]. However, willingness to participate in new technologies are dampened without evidence that investments will be met with adequate returns. With multiple options out there for purchase and a range of daunting price tags, this analysis of how different UASs, and associated software, compare may assist smaller organizations in deciding what is best for their team [17,18]. Our objective was to compare the effectiveness of two UAS (different costs and different multispectral payloads) surveying approaches to quantify the differences in accuracy achieved for classifying individual oak tree health following a recent spongy moth outbreak. These surveying approaches utilized different pieces of hardware and software so that combinations of each type of hardware and software could be evaluated for cost and accuracy.
In comparing UAS hardware, M300 UAS paired with MicaSense Dual-MX 10-band sensor achieved the highest overall performance with an 89.5% classification accuracy when paired with commercial-grade Agisoft SfM software. M3M achieved its highest overall classification accuracy of 85.3% using WebODM open-source SfM. When using Agisoft, M3M achieved an average overall accuracy of 85.0%. This average overall accuracy increase of approximately 3.8% between hardware options (M300 vs. M3M) comes at the cost of a USD 27,700 price difference. The class of most interest to the foresters looking to conduct management operations, the ’Declining Oak‘ identification, achieved larger differences in user’s and producer’s accuracies between these two types of hardware. In our example error matrices, we saw an increase in user’s accuracy of 11.5% and an increase in producer’s accuracy of 4.8% when using the more expensive system. Secondly, in comparing UAS-SfM software choices, commercial-grade Agisoft SfM software performed 3.8% better overall when classifying the imagery captured using M300 and MicaSense sensor, but 0.3% lower when using M3M sensor. The most likely cause for the difference in performance when using both software and MicaSense sensor is the lack of radiometric calibration in WebODM. It is well documented that radiometric correction (i.e., pre-processing of remotely sensed imagery to more closely measure surface reflectance) is an essential process of digital image analysis [17,33,67,68,69]. This slight increase (3.8%) in overall classification performance was made based on a USD 3500 investment in software.
Just looking at the results and costs, one might assume that there is no major difference between the kinds of software and hardware being compared, at least not thousands of dollars worth of an upgrade. However, when you look beyond the accuracies and dollar signs, there are few nuances worth mentioning. While processing the imagery from both UAS sensors in both software applications, notable differences in user experience were documented. From these notes, three major considerations stand out with respect to the choice between commercial or open-source software use. First, UAS-SfM processing took nearly 25 times as long using WebODM in comparison to Agisoft while both were set to a ‘High’ quality setting. On ‘Ultra-High’ (point cloud quality setting), WebODM took over 75 times longer than Agisoft and often failed before generating outputs. When switching to the ‘Fast Orthophoto’ setting in WebODM, which omitted point cloud and DEM creation, the processing times were much more similar. The lack of a 3D point cloud or DEM, however, removed a primary source of data for individual tree segmentation. Vacca [50] also found that WebODM took longer to process than Agisoft, even on a small number of photos (i.e., small area). This investment in processing time could limit operational feasibility for teams attempting to complete surveys over large areas in a timely manner or those who wish to automate their processing workflow. A second major consideration is the lack of configuration for WebODM to process image composites with greater than five bands. While not as common, sensors with increased spectral resolution (number and width of bands) are currently available and may increase in availability in the coming years. This heightened spectral resolution is known to aid in various environmental applications, including forest health management [31,34,67,70,71]. When working with these heightened spectral resolution sensors, WebODM may present some additional barriers. Lastly, open-source WebODM software does not currently support the integration of pre-flight radiometric processing or calibration panel recognition. This pre-processing step is an essential component of many digital image analysis workflows [17,68] and may have contributed to the lower overall classification accuracy when using MicaSense sensor in conjunction with WebODM. Deng et al. [67] determined that the use of different UAS sensors and radiometric calibration methods could influence the accuracy of observed spectral reflectance values in a precision agriculture setting.
M3M is advertised to have an internal calibration panel and, therefore, was not manually calibrated in either WebODM or Agisoft during the processing stages. This could explain why the results produced by WebODM and Agisoft were so similar for M3M but varied more for M300. It is also worth mentioning that our results are the product of manually delineated tree crowns. The value of more expensive hardware and software might become more apparent if we were to utilize automation for individual tree segmentation, rather than manual, due to potentially improved point cloud generation and processing [40,48,52]. From an applied perspective, crown delineation would need to be automated for efficiency of workflow and, therefore, 3D data would be instrumental.
The results of this study demonstrate that both UAS hardware and software options achieved an accuracy sufficient to inform fine-scale forest management operations. The overall classification accuracy for delineating three classes of oak health as well as conifer trees ranged from 85.0% (M3M and Agisoft) to 89.5% (M300 and Agisoft). The user’s and producer’s accuracies for this highest performing combination were 89.5% and 81.0% for Declining Oak. Among the most important features for all tests were NDVI, RVI, Green, and Red band products. Similar studies by Kanaskie et al. [54] and Lopez et al. [53] achieved forest health classification accuracies closer to 70%–80% using similar sensors and methods. Abdollahnejad and Panagiotidis [72], achieved an 84.7% overall accuracy for assessing the health status of trees infested by bark beetles. These studies, among others, have found that spectral wavelengths and derivative bands created using Red and Green reflectance are important indicators of physiological stress [26,35,54,73,74,75].
As spongy moth outbreaks and other forest disturbances continue to impact global forests, it is imperative that novel remote-sensing applications offer ways to effectively and efficiently acquire spatially explicit information to support management decisions [2,76]. The kinds of hardware and software compared during this research represent an investment of hundreds to thousands of dollars as well as quantifiable differences in processing time, resources, and technical complexity. As more users continue to adopt these technologies, reliable evidence must be available to support their decisions on which kind of hardware and software best suits their individual needs.

5. Conclusions

The health of oak (Quercus spp.) following severe spongy moth outbreaks is a major concern for foresters in New Hampshire and the broader eastern United States. As individuals and state agencies explore novel methods for surveying and managing these forests, many are looking to UAS hardware and software as a key tool for expanding their capabilities. This research compares the effectiveness of using two UAS hardware and two UAS software options for classifying the health of individual oak trees within an oak–pine-dominated site. The results demonstrate that when properly processed, commercial-grade M300 and MicaSense multispectral sensor achieve the highest classification accuracy at 89.5%. Alternatively, analyzing imagery collected from M3M multispectral sensor and processed in open-source WebODM SfM software achieved an overall classification accuracy of 85.3%. This comparison of different types of hardware and software also demonstrated key differences in processing time investments and pre-processing limitations. These findings can be used to support decisions regarding resource allocation, accuracy requirements, and technical complexity for anyone wishing to use these technologies to aid in managing their forests.

Author Contributions

Conceptualization, L.R., R.G.C., W.D. and B.T.F.; methodology, L.R., R.G.C., W.D., S.O. and B.T.F.; software, L.R., B.T.F. and R.G.C.; validation, L.R., R.G.C., W.D., S.O. and B.T.F.; formal analysis, L.R. and B.T.F.; resources, R.G.C.; writing—original draft preparation, L.R., W.D., S.O., B.T.F. and R.G.C.; writing—review and editing, L.R., W.D., B.T.F. and R.G.C.; supervision, R.G.C.; project administration, R.G.C. All authors have read and agreed to the published version of the manuscript.

Funding

Partial funding was provided by the New Hampshire Agricultural Experiment Station. This is Scientific Contribution Number 3012. This work was supported by the USDA National Institute of Food and Agriculture McIntire-Stennis, project #NH00103-M (Accession #1026105).

Data Availability Statement

The raw data supporting the conclusions of this article will be made available by the authors on request.

Acknowledgments

This project was made possible by the collaboration of the University of New Hampshire, the New Hampshire Division of Forests and Lands, the Forest Ecosystem Monitoring Cooperative, the Upper Saco Valley Land Trust and their Land Steward, Greg Bjork, and New Hampshire Licensed Forester, Tim Nolin.

Conflicts of Interest

The authors declare no conflicts of interest.

Appendix A

Table A1. Object-based derivative band definitions (i.e., spectral indices or band ratios) calculated using Unpiloted Aerial System (UAS) imagery. Derivative bands created using either the Coastal Blue or Blue bands are written in blue text. These bands could not be created using Mavic 3 Multispectral (M3M) sensor.
Derivative Bands
AcronymNameCitation
NDVINormalized Difference Vegetation Index[77,78]
GRVIGreen Red Vegetation Index (or NGRDI)[62,77,79]
GLIGreen Leaf Index[63,79]
GNDVIGreen NDVI[80]
RENDVIRed-Edge NDVI[62,81]
LCILeaf Chlorophyll Index[82]
RVIRatio Vegetation Index[83]
EVIEnhanced Vegetation Index[84]
DVIDifference Vegetation Index[83]
RDVIRe-Normalized Difference Vegetation Index[85]
TVITriangular Vegetation Index[86]
ARI 1Anthocyanin Reflectance Index[87]
PSRIPlant Senescence Reflectance Index[88]
CHLREChlorophyll Red-Edge Index[89]
BNDVIBlue NDVI[90]
cBNDVICoastal Blue NDVI[91]
RGIRed Green Ratio[92]
PBIPlant biochemical Index[75,93]
LICLichtenhaler Index[64]

References

  1. Coleman, T.W. Lymantria dispar and Progression to Management Strategies in the United States. In Slow the Spread: A 20-Year Reflection on the National Lymantria dispar Integrated Pest Management Program; Coleman, T.W., Liebhold, A.M., Eds.; US Department of Agriculture, Forest Service, Northern Research Station: Madison, WI, USA, 2023. [Google Scholar]
  2. Pasquarella, V.J.; Bradley, B.A.; Woodcock, C.E. Near-Real-Time Monitoring of Insect Defoliation Using Landsat Time Series. Forests 2017, 8, 275. [Google Scholar] [CrossRef]
  3. Pasquarella, V.J.; Elkinton, J.S.; Bradley, B.A. Extensive Gypsy Moth Defoliation in Southern New England Characterized Using Landsat Satellite Observations. Biol. Invasions 2018, 20, 3047–3053. [Google Scholar] [CrossRef]
  4. Clement, G.E.; Munro, W. Control of the Gypsy Moth by Forest Management; Kessinger Publishing: Whitefish, MO, USA, 1917. [Google Scholar]
  5. Baker, W.L. Effect of Gypsy Moth Defoliation on Certain Forest Trees. J. For. 1941, 39, 1017–1022. [Google Scholar]
  6. Liebhold, A.M.; Gottschalk, K.W.; Luzader, E.R.; Mason, D.A.; Bush, R.; Twardus, D.B. Gypsy Moth in the United States: An Atlas; USDA Forest Service: Radnor, PA, USA, 1997; pp. 1–36.
  7. Davidson, C.B.; Gottschalk, K.W.; Johnson, J.E. Tree Mortality Following Defoliation by the European Gypsy Moth (Lymantria dispar L.). For. Sci. 1999, 45, 74–84. [Google Scholar]
  8. Hilmers, T.; Leroy, B.M.L.; Bae, S.; Hahn, W.A.; Hochrein, S.; Jacobs, M.; Lemme, H.; Müller, J.; Schmied, G.; Weisser, W.W.; et al. Growth Response of Oaks to Insect Defoliation: Immediate and Intermediate Perspectives. For. Ecol. Manag. 2023, 549, 121465. [Google Scholar] [CrossRef]
  9. Mull, A.; Spears, L.R. Spongy Moth (Lymantria dispar dispar Linnaeus); Utah State University: Logan, UT, USA, 2022. [Google Scholar]
  10. Janowiak, M.K.; D’Amato, A.W.; Swanston, C.W.; Iverson, L.; Thompson, F.R.; Dijak, W.D.; Matthews, S.; Peters, M.P.; Prasad, A.; Fraser, J.S.; et al. New England and Northern New York Forest Ecosystem Vulnerability Assessment and Synthesis: A Report from the New England Climate Change Response Framework Project; Gen. Tech. Rep. NRS-173; U.S. Department of Agriculture, Forest Service, Northern Research Station: Newtown Square, PA, USA, 2018; 234p. [CrossRef]
  11. Morin, R.S.; Barnett, C.J.; Butler, B.J.; Crocker, S.J.; Domke, G.M.; Hansen, M.H.; Hatfield, M.A.; Horton, J.; Kurtz, C.M.; Lister, T.W.; et al. Forests of Vermont and New Hampshire 2012; U.S. Forest Service: Newtown Square, PA, USA, 2015; p. 80.
  12. Lombard, K.; Davidson, B.; Crandall, R. 2023 New Hampshire Forest Health Report; New Hampshire Forest Health Program: Concord, NH, USA, 2023.
  13. Lombard, K.; Weimer, J.; Davidson, B. 2021 New Hampshire Forest Health Highlights; New Hampshire Forest Health Program: Concord, NH, USA, 2021.
  14. Lombard, K.; Davidson, B. 2022 New Hampshire Forest Health Newsletter; New Hampshire Forest Health Program: Concord, NH, USA, 2022.
  15. O’Hara, K.L.; Ramage, B.S. Silviculture in an Uncertain World: Utilizing Multi-Aged Management Systems to Integrate Disturbance. Forestry 2013, 86, 401–410. [Google Scholar] [CrossRef]
  16. Pontius, J.; Hallett, R. Comprehensive Methods for Earlier Detection and Monitoring of Forest Decline. For. Sci. 2014, 60, 1156–1163. [Google Scholar] [CrossRef]
  17. Ecke, S.; Dempewolf, J.; Frey, J.; Schwaller, A.; Endres, E.; Klemmt, H.J.; Tiede, D.; Seifert, T. UAV-Based Forest Health Monitoring: A Systematic Review. Remote Sens. 2022, 14, 3205. [Google Scholar] [CrossRef]
  18. Gottschalk, K.W.; Russ Macfarlane, W. United States Department of Agriculture Forest Service Northeastern Forest Experiment Station General Technical Report NE-168; Northeastern Area State and Private Forestry—Appalachian Integrated Pest Management Program—Photographic Guide to Crown Condition of Oaks: Use for Gypsy Moth Si Lvicu Ltu Ral Treatments; Northeastern Forest Experiment Station: Radnor, PA, USA, 1993.
  19. Liebhold, A.M. Forest Pest Management in a Changing World. Int. J. Pest. Manag. 2012, 58, 289–295. [Google Scholar] [CrossRef]
  20. Quirion, B.R.; Domke, G.M.; Walters, B.F.; Lovett, G.M.; Fargione, J.E.; Greenwood, L.; Serbesoff-King, K.; Randall, J.M.; Fei, S. Insect and Disease Disturbances Correlate With Reduced Carbon Sequestration in Forests of the Contiguous United States. Front. For. Glob. Chang. 2021, 4, 716582. [Google Scholar] [CrossRef]
  21. Gunn, J.S.; Ducey, M.J.; Belair, E. Evaluating Degradation in a North American Temperate Forest. For.Ecol. Manag. 2019, 432, 415–426. [Google Scholar] [CrossRef]
  22. Aukema, J.E.; Leung, B.; Kovacs, K.; Chivers, C.; Britton, K.O.; Englin, J.; Frankel, S.J.; Haight, R.G.; Holmes, T.P.; Liebhold, A.M.; et al. Economic Impacts of Non-Native Forest Insects in the Continental United States. PLoS ONE 2011, 6, e24587. [Google Scholar] [CrossRef] [PubMed]
  23. Sánchez, J.J.; Marcos-Martinez, R.; Srivastava, L.; Soonsawad, N. Valuing the Impacts of Forest Disturbances on Ecosystem Services: An Examination of Recreation and Climate Regulation Services in U.S. National Forests. Trees For. People 2021, 5, 100123. [Google Scholar] [CrossRef]
  24. Coleman, T.W.; Graves, A.D.; Heath, Z.; Flowers, R.W.; Hanavan, R.P.; Cluck, D.R.; Ryerson, D. Accuracy of Aerial Detection Surveys for Mapping Insect and Disease Disturbances in the United States. For. Ecol. Manag. 2018, 430, 321–336. [Google Scholar] [CrossRef]
  25. Hall, R.J.; Castilla, G.; White, J.C.; Cooke, B.J.; Skakun, R.S. Remote Sensing of Forest Pest Damage: A Review and Lessons Learned from a Canadian Perspective. Can. Entomol. 2016, 148, S296–S356. [Google Scholar] [CrossRef]
  26. Dash, J.P.; Pearse, G.D.; Watt, M.S. UAV Multispectral Imagery Can Complement Satellite Data for Monitoring Forest Health. Remote Sens. 2018, 10, 1216. [Google Scholar] [CrossRef]
  27. Corte, A.P.D.; Souza, D.V.; Rex, F.E.; Sanquetta, C.R.; Mohan, M.; Silva, C.A.; Zambrano, A.M.A.; Prata, G.; Alves de Almeida, D.R.; Trautenmüller, J.W.; et al. Forest Inventory with High-Density UAV-Lidar: Machine Learning Approaches for Predicting Individual Tree Attributes. Comput. Electron. Agric. 2020, 179, 105815. [Google Scholar] [CrossRef]
  28. Guerra-Hernández, J.; González-Ferreiro, E.; Monleón, V.J.; Faias, S.P.; Tomé, M.; Díaz-Varela, R.A. Use of Multi-Temporal UAV-Derived Imagery for Estimating Individual Tree Growth in Pinus Pinea Stands. Forests 2017, 8, 300. [Google Scholar] [CrossRef]
  29. Krause, S.; Sanders, T.G.M.; Mund, J.P.; Greve, K. UAV-Based Photogrammetric Tree Height Measurement for Intensive Forest Monitoring. Remote Sens. 2019, 11, 758. [Google Scholar] [CrossRef]
  30. Lausch, A.; Erasmi, S.; King, D.J.; Magdon, P.; Heurich, M. Understanding Forest Health with Remote Sensing—Part I—A Review of Spectral Traits, Processes and Remote-Sensing Characteristics. Remote Sens. 2016, 8, 1029. [Google Scholar] [CrossRef]
  31. Lausch, A.; Erasmi, S.; King, D.J.; Magdon, P.; Heurich, M. Understanding Forest Health with Remote Sensing—Part II—A Review of Approaches and Data Models. Remote Sens. 2017, 9, 129. [Google Scholar] [CrossRef]
  32. Pause, M.; Schweitzer, C.; Rosenthal, M.; Keuck, V.; Bumberger, J.; Dietrich, P.; Heurich, M.; Jung, A.; Lausch, A. In Situ/Remote Sensing Integration to Assess Forest Health—A Review. Remote Sens. 2016, 8, 471. [Google Scholar] [CrossRef]
  33. Jensen, J. Introductory Digital Image Processing: A Remote Sensing Perspective, 4th ed.; Pearson Education Inc.: Glenview, IL, USA, 2016. [Google Scholar]
  34. Kampen, M.; Vienna, L.S.; Immitzer, M.; Vienna, L.S. UAV-Based Multispectral Data for Tree Species Classification and Tree Vitality Analysis. In Proceedings of the Dreiländertagung der Deutschen Gesellschaft für Photogrammetrie, Fernerkundung und Geoinformation (DGPF), der OVG und der SGPF, Wien, Austria, 20–22 February 2019; pp. 623–639. [Google Scholar]
  35. Minařík, R.; Langhammer, J. Use of a Multispectral UAV Photogrammetry for Detection and Tracking of Forest Disturbance Dynamics. Int. Arch. Photogramm. Remote Sens. Spat. Inf. Sci. 2016, 41, 711–718. [Google Scholar] [CrossRef]
  36. Nex, F.; Remondino, F. UAV for 3D Mapping Applications: A Review. Appl. Geomat. 2014, 6, 1–15. [Google Scholar] [CrossRef]
  37. Hassler, S.C.; Baysal-Gurel, F. Unmanned Aircraft System (UAS) Technology and Applications in Agriculture. Agronomy 2019, 9, 618. [Google Scholar] [CrossRef]
  38. Marshall, D.M.; Barnhart, R.K.; Shappee, E.; Most, M. Introduction to Unmanned Aerial Systems, 2nd ed.; CRC Press: Boca, Raton, FL, USA, 2016. [Google Scholar]
  39. Kakaes, K.; Greenwood, F.; Lippincott, M.; Dosemagen, S.; Meier, P.; Wich, S. Drones and Aerial Observation: New Technologies for Property Rights, Human Rights, and Global Development a Primer; New America: Washington, DC, USA, 2015. [Google Scholar]
  40. Changsalak, P.; Tiansawat, P. Comparison of Seedling Detection and Height Measurement Using 3D Point Cloud Models from Three Software Tools: Applications in Forest Restoration. Environ. Asia 2022, 15, 100–105. [Google Scholar] [CrossRef]
  41. Mishra, P.K.; Rai, A. Role of Unmanned Aerial Systems for Natural Resource Management. J. Indian Soc. Remote Sens. 2021, 49, 671–679. [Google Scholar] [CrossRef]
  42. Lausch, A.; Borg, E.; Bumberger, J.; Dietrich, P.; Heurich, M.; Huth, A.; Jung, A.; Klenke, R.; Knapp, S.; Mollenhauer, H.; et al. Understanding Forest Health with Remote Sensing, Part III: Requirements for a Scalable Multi-Source Forest Health Monitoring Network Based on Data Science Approaches. Remote Sens. 2018, 10, 1120. [Google Scholar] [CrossRef]
  43. Cummings, A.R.; McKee, A.; Kulkarni, K.; Markandey, N. The Rise of UAVs. Photogramm. Eng. Remote Sens. 2017, 83, 317–325. [Google Scholar] [CrossRef]
  44. Upper Saco Valley Land Trust (USVLT) Pine Hill Community Forest. Available online: https://www.usvlt.org/conserved-lands/pine_hill_community_forest/37 (accessed on 20 March 2024).
  45. Smitley, D.R.; Bauer, L.S.; Hajek, A.E.; Sapio, F.J.; Humber, R.A. Introduction and Establishment of Entomophaga Maimaiga, a Fungal Pathogen of Gypsy Moth (Lepidoptera: Lymantriidae) in Michigan. Environ. Entomol. 1995, 24, 1685–1695. [Google Scholar] [CrossRef]
  46. GRANIT LiDAR. GRANIT LiDAR Distribution Site. Available online: https://lidar.unh.edu/map/ (accessed on 20 March 2024).
  47. Earth System Research Center, University of New Hampshire. LiDAR-Derived Bare Earth DEM—NH, 2022. 2022. Available online: https://www.nhgeodata.unh.edu/datasets/6b6e1b8af62d478396d6a8620ff45fcb/explore (accessed on 29 March 2024).
  48. Fraser, B.T.; Congalton, R.G. Issues in Unmanned Aerial Systems (UAS) Data Collection of Complex Forest Environments. Remote Sens. 2018, 10, 908. [Google Scholar] [CrossRef]
  49. Vacca, G. Overview of Open Source Software for Close Range Photogrammetry. Int. Arch. Photogramm. Remote Sens. Spat. Inf. Sci. 2019, 42, 239–245. [Google Scholar] [CrossRef]
  50. Vacca, G. WEB Open Drone Map (WebODM) a Software Open Source to Photogrammetry Process. In Proceedings of the FIG Working Week, Smart Surveyors for Land and Water Management, Amsterdam, The Netherlands, 10–14 May 2020. [Google Scholar]
  51. Fraser, B.T.; Bunyon, C.L.; Reny, S.; Lopez, I.S.; Congalton, R.G. Analysis of Unmanned Aerial System (UAS) Sensor Data for Natural Resource Applications: A Review. Geographies 2022, 2, 303–340. [Google Scholar] [CrossRef]
  52. Maturbong, B.; Wing, M.G.; Strimbu, B.; Burnett, J. Forest Inventory Sensivity to {UAS}-Based Image Processing Algorithms. Ann. For. Res. 2019, 52, 87–108. [Google Scholar] [CrossRef]
  53. Lopez, I.; Fraser, B.T.; Congalton, R.G. Evaluating the Use of Unpiloted Aerial Systems to Detect and Evaluating the Use of Unpiloted Aerial Systems to Detect and Monitor Beech Bark Disease in New England. Geogr. Bull. 2023, 64, 4. [Google Scholar]
  54. Kanaskie, C.R.; Routhier, M.R.; Fraser, B.T.; Congalton, R.G.; Ayres, M.P.; Garnas, J.R. Early Detection of Southern Pine Beetle Attack by UAV-Collected 2 Multispectral Imagery. Remote Sens. 2024, 16. under review. [Google Scholar]
  55. Breiman, L. Random Forests. Mach. Learn. 2001, 45, 5–32. [Google Scholar] [CrossRef]
  56. Belgiu, M.; Drăgu, L. Random Forest in Remote Sensing: A Review of Applications and Future Directions. ISPRS J. Photogramm. Remote Sens. 2016, 114, 24–31. [Google Scholar] [CrossRef]
  57. Pedregosa, F.; Varoquaux, G.; Gramfort, A.; Michel, V.; Thirion, B.; Grisel, O.; Blondel, M.; Prettenhofer, P.; Weiss, R.; Dubourg, V.; et al. Scikit-Learn: Machine Learning in Python. J. Mach. Learn. Res. 2011, 12, 2825–2830. [Google Scholar]
  58. Congalton, R.G. A Review of Assessing the Accuracy of Classifications of Remotely Sensed Data. Remote Sens. Environ. 1991, 37, 35–46. [Google Scholar] [CrossRef]
  59. Congalton, R.; Mead, R. A Quantitative Method to Test for Consistency and Correctness in Photointerpretation. Photogramm. Eng. Remote Sens. 1983, 49, 69–74. [Google Scholar]
  60. Congalton, R.G.; Green, K. Assessing the Accuracy of Remotely Sensed Data: Principals and Practices, 3rd ed.; CRC Press: Boca Raton, FL, USA, 2019. [Google Scholar]
  61. Breiman, L.; Friedman, J.H.; Olshen, R.A.; Stone, C.J. ClassIfIcation and Regression Trees, 1st ed.; Chapman and Hall/CRC: New York, NY, USA, 1984; ISBN 9781315139470. [Google Scholar]
  62. Fraser, B.T.; Congalton, R.G. Monitoring Fine-scale Forest Health Using Unmanned Aerial Systems (UAS) Multispectral Models. Remote Sens. 2021, 13, 4873. [Google Scholar] [CrossRef]
  63. Bárta, V.; Hanuš, J.; Dobrovolný, L.; Homolová, L. Comparison of Field Survey and Remote Sensing Techniques for Detection of Bark Beetle-Infested Trees. For. Ecol. Manag. 2022, 506, 119984. [Google Scholar] [CrossRef]
  64. Lichtenthaler, H.K.; Lang, M.; Sowinska, M.; Heisel, F.; Miehe, J.A.; Chtenthaler, H.K.L.; Lang, M.; Miehif, J.A. Detection of Vegetation Stress Via a New High Resolution Fluorescence Imaging System. J. Plant Physiol. 1996, 148, 599–612. [Google Scholar] [CrossRef]
  65. Revill, A.; Florence, A.; Macarthur, A.; Hoad, S.; Rees, R.; Williams, M. Quantifying Uncertainty and Bridging the Scaling Gap in the Retrieval of Leaf Area Index by Coupling Sentinel-2 and UAV Observations. Remote Sens. 2020, 12, 1843. [Google Scholar] [CrossRef]
  66. Choi, W.I.; Park, Y.S. Management of Forest Pests and Diseases. Forests 2022, 13, 1765. [Google Scholar] [CrossRef]
  67. Deng, L.; Mao, Z.; Li, X.; Hu, Z.; Duan, F.; Yan, Y. UAV-Based Multispectral Remote Sensing for Precision Agriculture: A Comparison between Different Cameras. ISPRS J. Photogramm. Remote Sens. 2018, 146, 124–136. [Google Scholar] [CrossRef]
  68. Olsson, P.O.; Vivekar, A.; Adler, K.; Garcia Millan, V.E.; Koc, A.; Alamrani, M.; Eklundh, L. Radiometric Correction of Multispectral Uas Images: Evaluating the Accuracy of the Parrot Sequoia Camera and Sunshine Sensor. Remote Sens. 2021, 13, 577. [Google Scholar] [CrossRef]
  69. Lillesand, T.; Kiefer, R.W.; Chipman, J. Remote Sensing and Image Interpretation, 7th ed.; John Wiley and Sons Ltd.: Hoboken, NJ, USA, 2015; ISBN 978-1-118-34328-9. [Google Scholar]
  70. Gini, R.; Sona, G.; Ronchetti, G.; Passoni, D.; Pinto, L. Improving Tree Species Classification Using UAS Multispectral Images and Texture Measures. Int. J. Geo-Inf. 2018, 7, 315. [Google Scholar] [CrossRef]
  71. Candiago, S.; Remondino, F.; De Giglio, M.; Dubbini, M.; Gattelli, M. Evaluating Multispectral Images and Vegetation Indices for Precision Farming Applications from UAV Images. Remote Sens. 2015, 7, 4026–4047. [Google Scholar] [CrossRef]
  72. Abdollahnejad, A.; Panagiotidis, D. Tree Species Classification and Health Status Assessment for a Mixed Broadleaf-Conifer Forest with Uas Multispectral Imaging. Remote Sens. 2020, 12, 3722. [Google Scholar] [CrossRef]
  73. Dash, J.P.; Watt, M.S.; Pearse, G.D.; Heaphy, M.; Dungey, H.S. Assessing Very High Resolution UAV Imagery for Monitoring Forest Health during a Simulated Disease Outbreak. ISPRS J. Photogramm. Remote Sens. 2017, 131, 1–14. [Google Scholar] [CrossRef]
  74. Czapski, P.; Kacprzak, M.; Kotlarz, J.; Mrowiec, K.; Kubiak, K.; Tkaczyk, M. Preliminary Analysis of the Forest Health State Based on Multispectral Images Acquired by Unmanned Aerial Vehicle. Folia For. Pol. Ser. A 2015, 57, 138–144. [Google Scholar] [CrossRef]
  75. Huo, L.; Lindberg, E.; Bohlin, J.; Persson, H.J. Assessing the Detectability of European Spruce Bark Beetle Green Attack in Multispectral Drone Images with High Spatial- and Temporal Resolutions. Remote Sens. Environ. 2023, 287, 113484. [Google Scholar] [CrossRef]
  76. Aukema, J.E.; McCullough, D.G.; Von Holle, B.; Liebhold, A.M.; Britton, K.; Frankel, S.J. Historical Accumulation of Nonindigenous Forest Pests in the Continental United States. Bioscience 2010, 60, 886–897. [Google Scholar] [CrossRef]
  77. Tucker, C.J. Red and Photographic Infrared Linear Combinations for Monitoring Vegetation. Remote Sens. Environ. 1979, 8, 127–150. [Google Scholar] [CrossRef]
  78. Rouse, R.W.H.; Haas, J.A.W.; Deering, D.W. Monitoring Vegetation Systems in The Great Plains with Erts. NASA Spec. Publ. 1974, 351, 309. [Google Scholar]
  79. Klouček, T.; Komárek, J.; Surový, P.; Hrach, K.; Janata, P.; Vašíček, B. The Use of UAV Mounted Sensors for Precise Detection of Bark Beetle Infestation. Remote Sens. 2019, 11, 1561. [Google Scholar] [CrossRef]
  80. Gitelson, A.A.; Kaufman, Y.J.; Merzlyak, M.N. Use of a Green Channel in Remote Sensing of Global Vegetation from EOS- MODIS. Remote Sens. Environ. 1996, 58, 289–298. [Google Scholar] [CrossRef]
  81. Iordache, M.D.; Mantas, V.; Baltazar, E.; Pauly, K.; Lewyckyj, N. A Machine Learning Approach to Detecting Pine Wilt Disease Using Airborne Spectral Imagery. Remote Sens. 2020, 12, 2280. [Google Scholar] [CrossRef]
  82. Yu, R.; Ren, L.; Luo, Y. Early Detection of Pine Wilt Disease in Pinus Tabuliformis in North China Using a Field Portable Spectrometer and UAV-Based Hyperspectral Imagery. For. Ecosyst. 2021, 8, 44. [Google Scholar] [CrossRef]
  83. Zhu, Y.; Yao, X.; Tian, Y.C.; Liu, X.J.; Cao, W.X. Analysis of Common Canopy Vegetation Indices for Indicating Leaf Nitrogen Accumulations in Wheat and Rice. Int. J. Appl. Earth Obs. Geoinf. 2008, 10, 1–10. [Google Scholar] [CrossRef]
  84. Liu, H.Q.; Huete, A. A Feedback Based Modification of the NDVI to Minimize Canopy Background and Atmospheric Noise. IEEE Trans. Geosci. Remote Sens. 1995, 33, 457–465. [Google Scholar] [CrossRef]
  85. Roujean, J.-L.; Breon, F.-M. Estimating PAR Absorbed by Vegetation from Bidirectional Reflectance Measurements. Remote Sens. Environ. 1995, 51, 375–384. [Google Scholar] [CrossRef]
  86. Broge, N.H.; Leblanc, E. Comparing Prediction Power and Stability of Broadband and Hyperspectral Vegetation Indices for Estimation of Green Leaf Area Index and Canopy Chlorophyll Density. Remote Sens. Environ. 2001, 76, 156–172. [Google Scholar] [CrossRef]
  87. Gitelson, A.A.; Merzlyak, M.N.; Chivkunova, O.B. Optical Properties and Nondestructive Estimation of Anthocyanin Content in Plant Leaves. Photochem. Photobiol. 2001, 74, 38–45. [Google Scholar] [CrossRef] [PubMed]
  88. Merzlyak, M.N.; Gitelson, A.A.; Chivkunova, O.B.; Rakitin, V.Y. Non-Destructive Optical Detection of Pigment Changes during Leaf Senescence and Fruit Ripening. Physiol. Plant. 1999, 106, 135–141. [Google Scholar] [CrossRef]
  89. Gitelson, A.A.; Keydan, G.P.; Merzlyak, M.N. Three-Band Model for Noninvasive Estimation of Chlorophyll, Carotenoids, and Anthocyanin Contents in Higher Plant Leaves. Geophys. Res. Lett. 2006, 33, L11402. [Google Scholar] [CrossRef]
  90. Blackburn, G.A. Spectral Indices for Estimating Photosynthetic Pigment Concentrations: A Test Using Senescent Tree Leaves. Int. J. Remote Sens. 1998, 19, 657–675. [Google Scholar] [CrossRef]
  91. Bunyon, C.L.; Fraser, B.T.; Mcquaid, A.; Congalton, R.G. Using Imagery Collected by an Unmanned Aerial System to Monitor Cyanobacteria in New Hampshire, USA, Lakes. Remote Sens. 2023, 15, 2839. [Google Scholar] [CrossRef]
  92. Santos, I.C.d.L.; dos Santos, A.; Oumar, Z.; Soares, M.A.; Silva, J.C.C.; Zanetti, R.; Zanuncio, J.C. Remote Sensing to Detect Nests of the Leaf-Cutting Ant Atta Sexdens (Hymenoptera: Formicidae) in Teak Plantations. Remote Sens. 2019, 11, 1641. [Google Scholar] [CrossRef]
  93. Abdullah, H.; Skidmore, A.K.; Darvishzadeh, R.; Heurich, M. Timing of Red-Edge and Shortwave Infrared Reflectance Critical for Early Stress Detection Induced by Bark Beetle (Ips Typographus, L.) Attack. Int. J. Appl. Earth Obs. Geoinf. 2019, 82, 101900. [Google Scholar] [CrossRef]
Disclaimer/Publisher’s Note: The statements, opinions, and data contained in all publications are solely those of the individual author(s) and contributor(s) and not of MDPI and/or the editor(s). MDPI and/or the editor(s) disclaim responsibility for any injury to people or property resulting from any ideas, methods, instructions, or products referred to in the content.
Figure 1. From left to right, (A) Pine Hill Community Forest study site, located in northern New Hampshire (USA); (B) outline of the 50-hectare (ha) area mapped using both Unpiloted Aerial Systems (UASs); and (C) small portion of the orthoimagery created using the Mavic 3 Multispectral (M3M) sensor, demonstrating the oak–pine forest composition.
Forests 15 00706 g001
Figure 2. Flowchart detailing the UAS hardware and software combinations used for this study as well as the major processing and analysis stages used to generate the final results.
Forests 15 00706 g002
Figure 3. False color composite and natural color orthoimagery for individual samples of each of the four classes: (A) Healthy Oak, (B) Declining Oak, (C) Dead Oak, and (D) Healthy Conifer.
Forests 15 00706 g003
Table 1. Hardware and software combinations quantitatively compared during this study.
Commercial GradeEnterprise Grade
UASM3MM300
SensorDJI Integrated Multispectral Sensor (4 bands)MicaSense Multispectral Sensor System (10 bands)
SoftwareOpen-Source (WebODM)Proprietary (Agisoft Metashape)
Table 2. Bands available for both sensors with approximate wavelengths being collected. The MicaSense Dual-MX sensor (MicaSense) includes two paired sensors with 5 bands each. The ‘Blue-MX’ sensor’s bands are given in blue. The M3M sensor bands are also given.
BandsMicaSense (nm)M3M (nm) ± 16 nm
Coastal Blue444NA
Blue475NA
Green531, 560560
Red650, 668650
Red-Edge705, 717, 740730
NIR842860
Table 3. Object-based features calculated for each tree crown polygon in Trimble eCognition. Features listed in blue require the Blue or Coastal Blue bands and so could not be created using the M3M sensor. Definitions for each of the derivative bands are given in Appendix A. GLCM texture features are based on the Gray-Level Co-Occurrence Matrix. GLDV texture features are based on the Gray-Level Difference Vector.
SpectralDerivative BandsTexture
Mean Coastal BlueNDVIGLCM Contrast
Mean BlueGRVIGLCM Correlation
Mean Green 1GLIGLCM Dissimilarity
Mean Green 2GNDVIGLCM Entropy
Mean Red 1RENDVIGLCM Homogeneity
Mean Red 2LCIGLCM Mean
Mean Red-Edge 1RVIGLDV Entropy
Mean Red-Edge 2EVIGLDV Mean
Mean Red-Edge 3DVIGLDV Contrast
Mean Near-InfraredRDVI
Std. Dev. Coastal BlueTVI
Std. Dev. BlueARI 1
Std. Dev. Green 1PSRI
Std. Dev. Green 2CHLRE
Std. Dev. Red 1BNDVI
Std. Dev. Red 2cBNDVI
Std. Dev. Red-Edge 1RGI
Std. Dev. Red-Edge 2PBI
Std. Dev. Red-Edge 3LIC
Std. Dev. Near-Infrared
Table 4. Overall average classification accuracy for each of the combinations of UAS hardware and software based on the four tree classes. Additionally, the producer’s and user’s accuracies for the land cover class of interest (Declining Oak) to the foresters are provided.
M300 + AgisoftM3M + AgisoftM300 + WebODMM3M + WebODM
Overall Accuracy89.5%85.0%85.7%85.3%
Declining OakProducer’s Accuracy81.0%76.2%76.2%81.0%
User’s Accuracy89.5%78.0%84.2%79.1%
Table 5. Example error matrix from a single iteration of the random forest classification performed using imagery from M3M sensor and Agisoft Metashape processing.
Reference Data
Healthy OakDeclining OakDead OakHealthy ConiferRow TotalUser’s
Accuracy
MapHealthy Oak364024285.7%
Declining Oak132354178.0%
Dead Oak033103491.2%
Healthy Conifer031353989.7%
Column Total37423542156
Producer’s Accuracy97.3%76.2%88.6%83.3%
Overall Accuracy85.9%
Table 6. Example error matrix from a single iteration of the random forest classification performed using imagery from M300 sensor and Agisoft Metashape processing.
Reference Data
Healthy OakDeclining OakDead OakHealthy ConiferRow TotalUser’s Accuracy
MapHealthy Oak373014190.2%
Declining Oak034133889.5%
Dead Oak043313886.8%
Healthy Conifer011373994.9%
Column Total37423542156
Producer’s Accuracy100.0%81.0%94.3%88.1%
Overall Accuracy90.4%
Table 7. Object-based input features (attributes) quantified as the most important (in descending order) for each of the UAS hardware and software combination classifications. Feature importance is quantified based on the Gini Index, and results are the average of ten iterations.
M300 + AgisoftM3M + AgisoftM300 + WebODMM3M + WebODM
Top FeaturesLICNDVIGLIGRVI
NDVIRVIStd. Dev. Red-EdgeRGI
RVIMean GreenRDVIRVI
Coastal Blue NDVIRBINDVINDVI
Std. Dev. GreenTVIRVIStd. Dev. Red
Disclaimer/Publisher’s Note: The statements, opinions and data contained in all publications are solely those of the individual author(s) and contributor(s) and not of MDPI and/or the editor(s). MDPI and/or the editor(s) disclaim responsibility for any injury to people or property resulting from any ideas, methods, instructions or products referred to in the content.

