Article

Influence of Soil Quality on the Browsing Intensity of Ungulate Herbivores on Tree Species in European Forests

1
Department of Natural Resource Management, College of Agriculture, Wolaita Sodo University, Wolaita Sodo P.O. Box 138, Ethiopia
2
Department of Forest Biodiversity, Faculty of Forestry, University of Agriculture in Krakow, 31-425 Krakow, Poland
3
Department of Ecology and Silviculture, Faculty of Forestry, University of Agriculture in Krakow, 31-425 Krakow, Poland
*
Author to whom correspondence should be addressed.
Forests 2024, 15(4), 708; https://doi.org/10.3390/f15040708
Submission received: 13 February 2024 / Revised: 26 March 2024 / Accepted: 15 April 2024 / Published: 17 April 2024
(This article belongs to the Section Forest Ecology and Management)

Abstract

:
The impact of ungulate browsing on tree saplings has been found to have a negative effect on the regeneration of temperate forests. However, it remains ambiguous whether a relationship exists between browsing intensity and soil quality in natural forests. Therefore, we conducted a study in Roztoczańskie National Park to investigate the relationship between soil quality and browsing intensity for tree saplings. The aim was to gain a better understanding of how soil quality affects the browsing of ungulates on tree species. Baseline data (sapling height, basal diameter, crown length and width, browsed-shoot diameter, and soil samples) were collected from the 22 belt transects established in the permanent research plots. The soil quality index was calculated using physical and chemical soil properties. Twig dry mass was determined using allometric equations. Species relative density and browsing intensity were assessed through field measurements. Relationships between the variables were established using a linear regression model. The results suggest that browsing intensity is influenced by the gradient of the soil quality index and that it varies between tree species. Along the increasing soil quality gradient, tree species’ relative density (p = 0.012) and twig dry mass m−2 (p = 0.005) significantly decreased for A. pseudoplatanus. In contrast, browsing intensity increased significantly with an increasing species relative density for A. pseudoplatanus (p = 0.00) and C. betulus (p = 0.001) and with an increasing twig dry mass for F. sylvatica (p = 0.034) and C. betulus (p = 0.004). Browsing intensity increased significantly with an increasing soil quality index for F. sylvatica (p = 0.027) and decreased significantly for A. pseudoplatanus (p = 0.036). Notably, there was a significant positive relationship between browsing intensity and species relative density and twig dry mass, indicating that ungulate browsing is concentrated where browsing is abundant. These results provide insights that can be used to improve management and conservation strategies to protect tree species vulnerable to ungulate herbivory.

1. Introduction

The impact of ungulate herbivory on ecosystems has been an important ecological concern in Europe [1,2]. This is due to the fact that browsing by wild ungulates plays an important role in the regeneration of forests and the dynamics of tree stands [3,4,5]. In forests that have experienced natural disturbances, a high ungulate density significantly affects the frequency of browsing on young trees [6] and is often considered to be a threat to tree regeneration [7,8]. Ungulate browsers directly affect the survivorship and recruitment of tree saplings, which in turn can affect ecosystem function [9,10]. Furthermore, selective ungulate herbivory causes unpalatable, chemically defended plants to dominate the ecosystem [11].
Browsing intensity on tree saplings is determined by several factors, including the presence of forest gaps, tree composition, elevation, former management, and soil properties [12,13,14]. In particular, studies have shown that browsing intensity on specific tree species is indirectly impacted by the prevailing soil conditions [12]. Other reports suggest that soil quality may influence the response of plant communities to browsing by wild ungulates [15,16,17].
The logic in this regard is that soil is a center for the process of material and energy exchange and circulation in terrestrial ecosystems. It provides the water and nutrients necessary for plants to grow and develop, thus influencing tree regeneration [18,19].
Soil nutrient status is highly related to vegetation growth and plant diversity [20,21] and may also lead to a shift in community composition [22]. Thus, soil quality operates as a filter for the pool of species that can flourish in a specific location. For instance, poor soils may lead to lower quality and quantities of browse, which can, in turn, increase browsing intensity on individual plants [4,23]. Indirectly, soil conditions influence the share of various tree species in the forest canopy, thus altering light availability on the forest floor. Shade-tolerant tree species dominate the forest canopy in nutrient-rich ecosystems, allowing less light to reach the forest floor [24]. In contrast, shade-intolerant tree species usually form the canopy layer in poorer habitats, and the amount of light beneath their canopies is greater. As a result, forest floor vegetation in poorer habitats may be more productive and have higher biomass than that in richer environments [25,26], which, in turn, can affect ungulate browsing relations. Niche theory predicts that plant species are adapted for survival and growth in a particular environment and have different habitat preferences [27,28], and their variation is expected elsewhere.
Many studies have examined the effects of forest cover and specific tree species on soil properties [23,29,30,31,32]. Others have investigated the effects of ungulate browsing on soil properties in general [33] and on soil organic matter and nutrient cycling [34].
However, the effect of soil quality on the intensity of ungulate browsing on saplings in temperate forests has not been well studied and, where it has been studied, the reports have been inconsistent. There are conflicting results in the existing literature. While some studies have suggested that soil properties indirectly affect the amount of browsing on certain tree species, others have found no significant effects [6,18,35,36]. This discrepancy indicates that there is a gap in our knowledge of the precise mechanistic relationship between soil quality and browsing intensity by wild ungulates in natural forest ecosystems, and generalizations have remained elusive.
Thus, the novelty of this study lies in answering the following questions: (1) Does the impact of ungulate browsing on different tree species vary across a gradient of soil quality? (2) Does soil quality along with the species identity of a tree affect the intensity of browsing and reduce the risk of the elimination of palatable species due to ungulate browsing pressure? We used a novel approach to investigate the relationship between browsing intensity on tree seedlings and soil quality. Because this relationship was investigated in depth by assessing the measurable values of browse abundance, this study can be replicated on a large scale and used for generalizations. Answering these questions is also important to improve our understanding of the complex interactions between ungulate browsing and soil quality and inform practical efforts to manage and conserve natural ecosystems. To answer these questions, we formulated two hypotheses:
Hypothesis 1 (H1). 
Ungulate browsing on tree saplings is less intense on fertile soils because of higher vegetation productivity and higher availability of fodder.
Hypothesis 2 (H2). 
In temperate forests, where light availability plays a major role in the development of ground vegetation, browsing on woody plants is more intense on fertile soils, because ground vegetation is sparse.

2. Materials and Methods

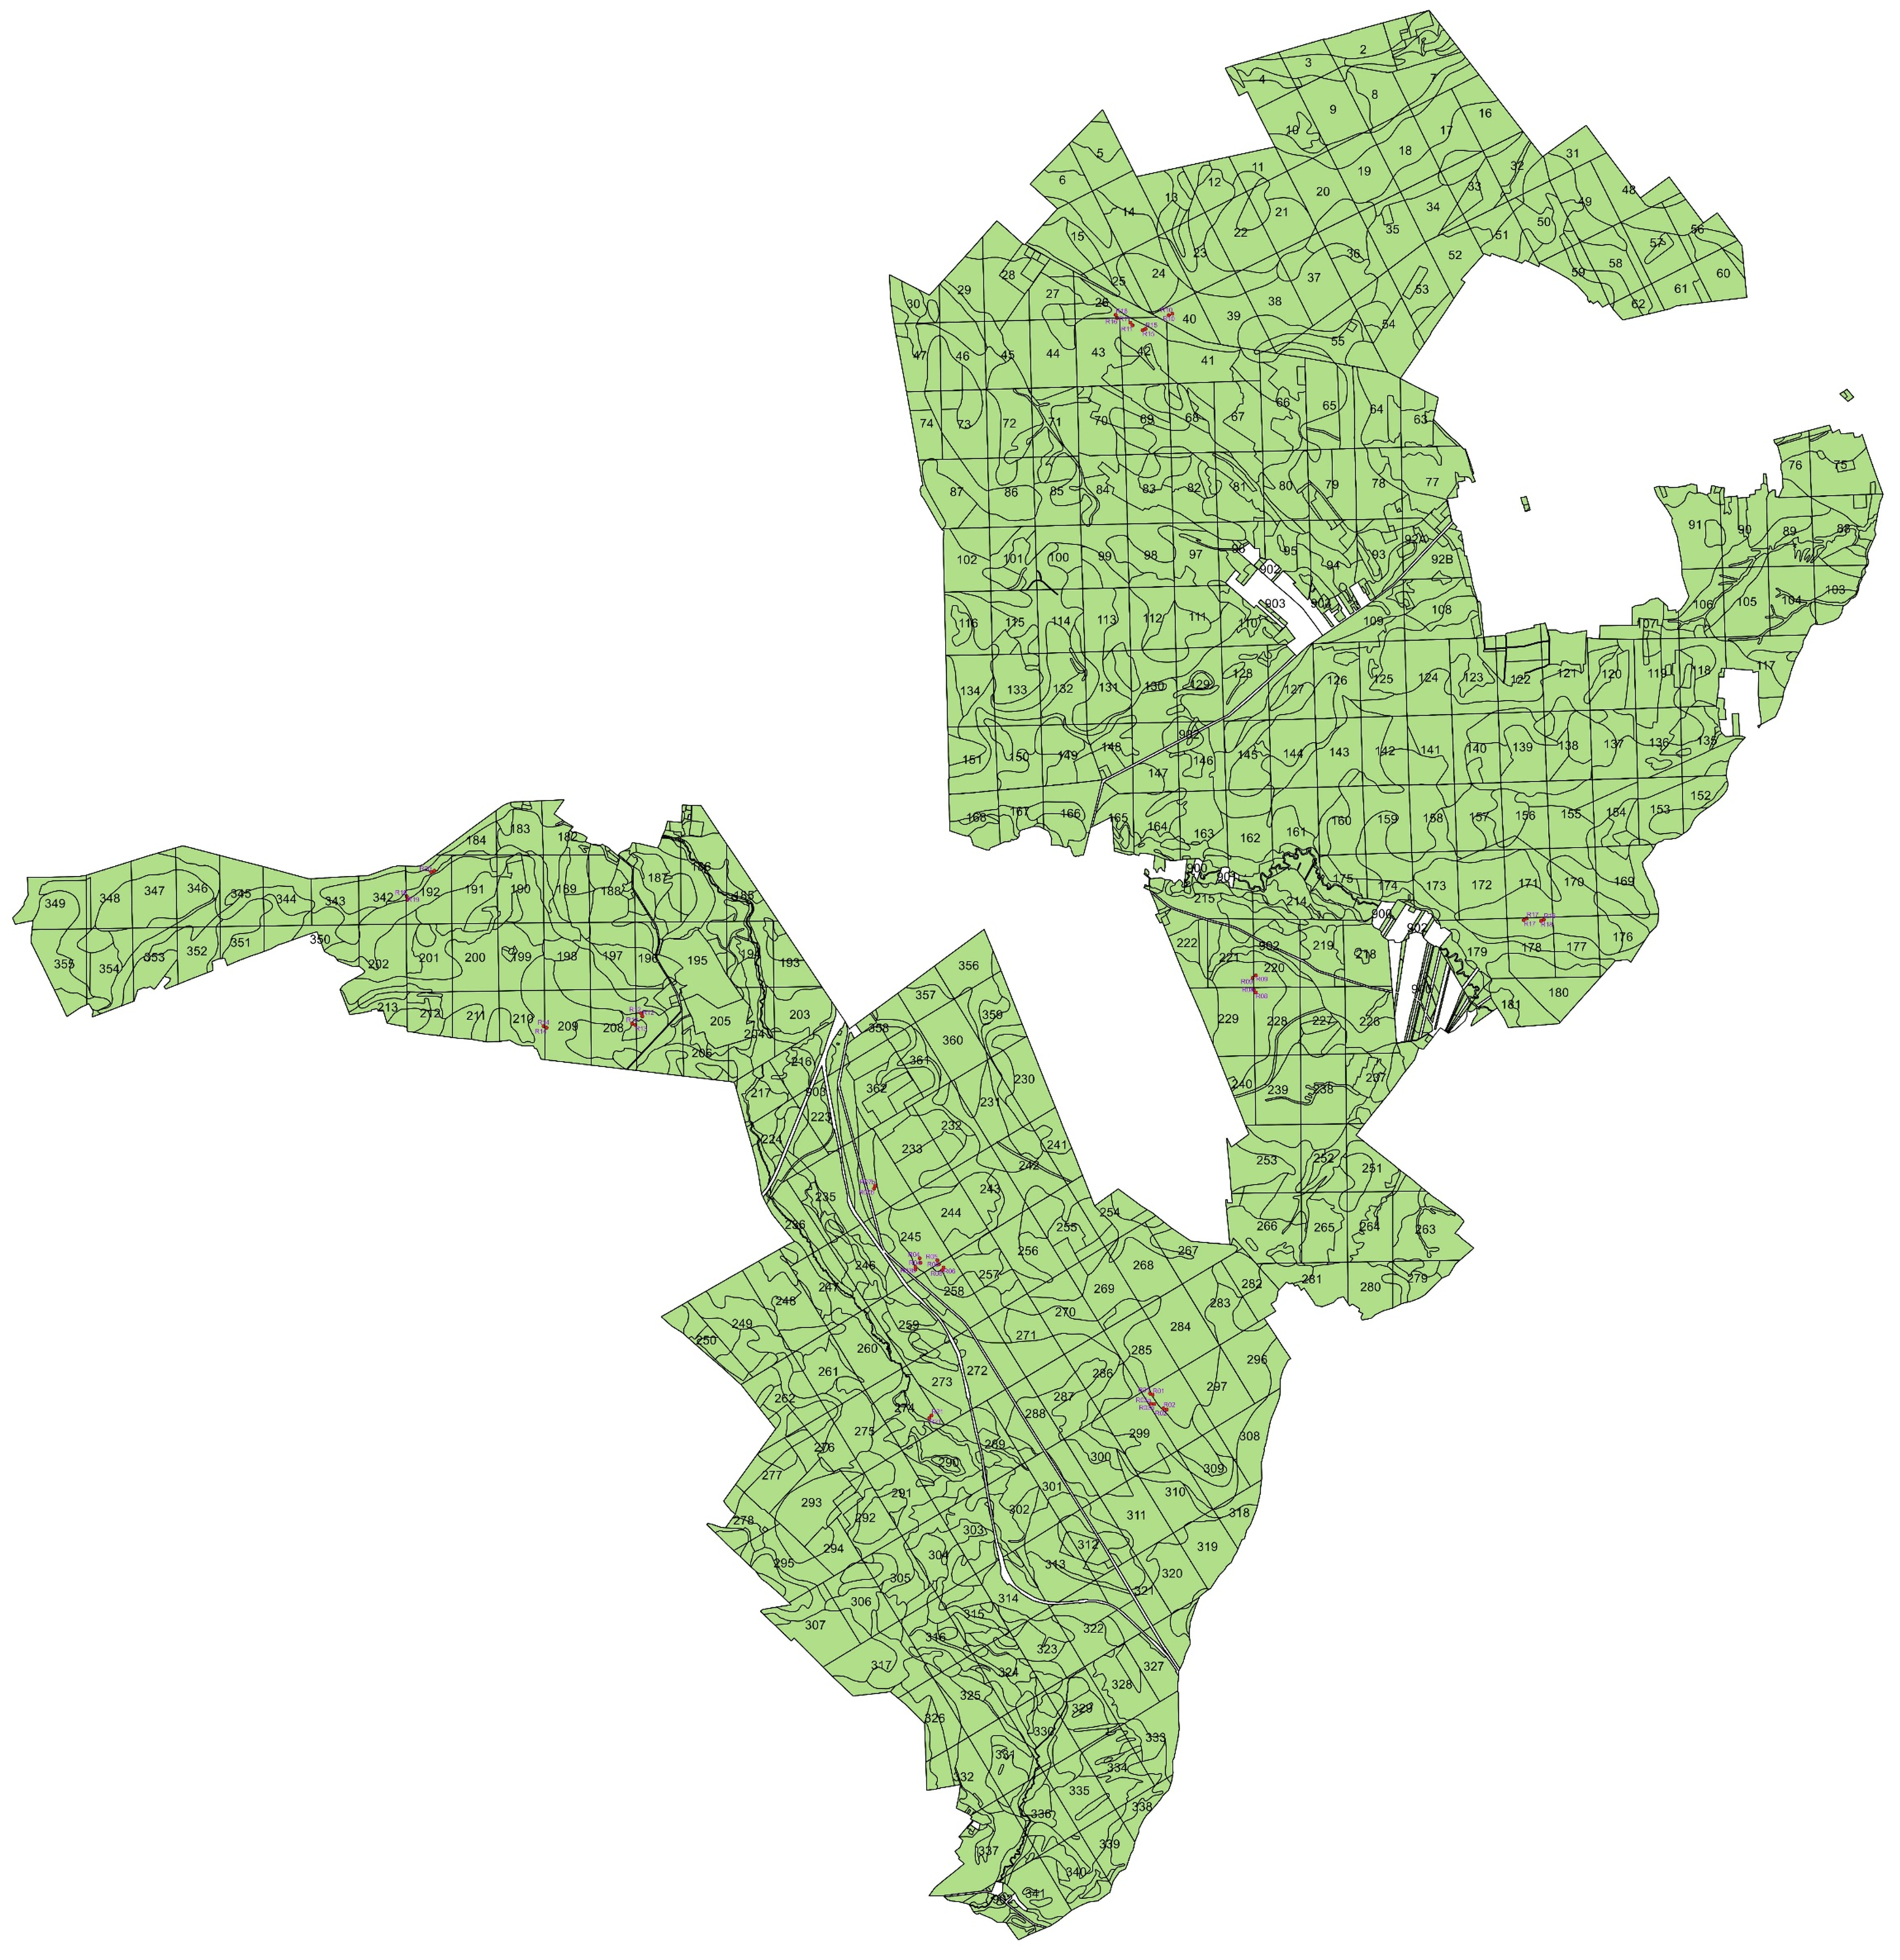
2.1. Study Site Description

This research was carried out in Roztoczańskie National Park, situated in the Roztocze region of Poland, where more than 95% of the park’s expanse is covered by forests. This park covers 8483 hectares and is divided into five strict protection zones. The park experiences an average yearly air temperature within the range of 7.4–7.5 °C, coupled with an annual precipitation of 600–650 mm [37]. The highest elevation in the region is 360 m above sea level.
Within the natural forest stands of Roztoczańskie National Park, the European beech (Fagus sylvatica) and Silver fir (Abies alba) are notably abundant tree species, regenerating naturally. European hornbeam (Carpinus betulus), Sycamore maple (Acer pseudoplatanus) and Rowan (Sorbus aucuparia) occur mostly as admixtures but are also present among the younger generations of trees [38]. Furthermore, this national park serves as a habitat for various herbivores, such as red deer, roe deer, and wild boar, as well as all the major carnivores characteristic of Central Europe. According to unpublished official data for the study area, in 2019, there were 380 red deer and 360 roe deer. In 2021, the number of red deer increased to 400, while the number of roe deer decreased to 277.

2.2. Study Design and Plot-Level-Data

A total of 22 belt transects were established in the years 2020–2022 to study the relationship between ungulate herbivores’ browsing intensity on tree saplings and soil properties (Figure 1). Each transect had a width of 5 m and a length of 30 m. Within these designated areas, tree saplings ranging in height from 0.5 m to 3 m were measured. For each tree species, a maximum of 30 individual saplings (located closest to the long axis of the transect) were examined. Accordingly, a total of 1060 tree saplings of all species showing signs of recent (within a year) browsing were found in all transects. The measurements conducted on saplings included sapling height (cm), basal diameter (mm), diameter of the browsed shoot (mm), crown length (cm), and maximum crown width (cm). Furthermore, any visible signs of browsing, such as bite marks on the top and side branches of the saplings with a diameter greater than 1 mm, were recorded, with a maximum of 50 browsing signs being tallied for each sapling within a transect.
Concurrently, soil samples were collected from the same transects to investigate the correlation between soil properties and the browsing potential of various tree saplings from different species. For each transect, the parent material is similar. The general characteristics of the tested soils are mineral soils with light grain size (from loose sand to sandy loam). In each transect, two soil samples (one soil sample at each of the 15 m intervals along the 30 m belt transect) were taken. The soil on the forest floor contains a considerable amount of undecomposed and partially decomposed litter. Therefore, soil samples were taken after the litter cover had been removed. Due to the varying thickness of the soil horizons at different locations of a transect, samples were taken from the top 30 cm of soil depth, which included the A horizon. These individual samples were then combined to form a single representative aliquot.

2.3. Data Generation and Soil Lab Analysis

The species density was calculated by using the number of saplings and the transect area (30 m × 5 m). Then, the relative density was calculated by dividing each species’ density by the sum of all species’ densities per transect and multiplying the result by 100 (Equations (1) and (2)).
Tree   species   density .   S D = n i A
Tree   species   relative   density   . .   R D = S D i S D i 100
SD stands for the species density, ni is the number of individuals of the i-th species per transect, A is the transect area (150 m2), and RD is the relative density of the i-th species per transect.
According to the results of our earlier studies, there are huge differences in the intensity of browsing among tree saplings. In some instances, we recorded up to fifty browsed shoots per sapling, while there were only single shoots that had been browsed in other cases. Therefore, we needed a quantitative measure of browsing intensity; we took into account both the number of browsed shoots and their thickness (as a proxy for their mass) and related these values to the sapling size (with the squared basal diameter of sapling serving as a proxy for the total dry mass of a plant).
Browsing intensity index (BI) was calculated using the following formula (Equation (3)).
Browsing   intensity   index     B I = i = 1 N d i 2 D 2
where d is the diameter of the browsed shoot (mm), N is the number of browsed shoots per plant, and D (mm) is the basal diameter of the tree sapling (mm). As a result, the sum of the BIs and mean BI for each species per transect were calculated.
The measurements taken for tree saplings, such as height (cm), basal diameter (mm), crown length (cm), and crown width (cm), were employed to compute the total dry mass of twigs for each species per transect and then per m2. This computation was carried out using newly established allometric equations specific to the particular tree species and study location [39].
The soil samples were subjected to laboratory analyses to determine factors such as soil textures, soil reaction, organic matter content (OC), and various soil chemical attributes like nitrogen (N), phosphorus (P), calcium (Ca), magnesium (Mg), and potassium (K) content. These analyses were conducted according to established soil laboratory procedures in the Geochemistry of Forest Environment and Reclaimed Areas (Department of Ecology and Silviculture) laboratory at the University of Agriculture in Krakow, Poland.
The soil samples were air-dried and sieved through a 2.0 mm sieve. The pH of the samples was measured in H2O (pHH2O) and a 1 M KCl solution (pHKCl) (soil/liquid ratio 1:5, v/v) using a digital pH meter (CPC-411, ELMETRON) at 20 °C. Exchangeable acidity (EA) was determined in 1 M of Ca(OAc)2; the basic exchangeable cations (Ca2+, Mg2+, K+, and Na+) were determined in 1 M of NH4Ac using ICP-OES (iCAP™ 6000 Series). The cation exchange capacity (CEC) was determined by calculating the sum of exchangeable cations and exchangeable acidity (EA). Organic carbon (OC) and total nitrogen (N) content were measured using a LECO TruMac® CNS analyzer. The percentage of base saturation (BS%) was computed by multiplying the sum of basic exchangeable cations by 100 and then dividing the resulting value by the cation exchange capacity (BS% = BEC * 100/CEC). C:N ratio, and N2/C were calculated based on existing values. Soil texture was analyzed with a Fritsch GmbH Laser Particle Sizer ANALYSETTE 22. Bulk density was calculated based on the soil depth and organic carbon content, employing the formula developed by [40]:
Bulk   density   of   the   soil   . .   D = 1.3773 E x p 1 0.0547 x ,
where D stands for the soil bulk density (g m−3), and x stands for the content of organic carbon (%).
Soil properties were then used to calculate the soil quality index (SQI). The method of calculating the SQI was developed for soil profiles that are 1.5 m deep. As our samples were taken from the upper 30 cm of the soil profile, the content of fine fractions (grains <0.02 mm), base cations (Ca, Mg, K, and Na), and soil acidity obtained from our analyses were then multiplied by 5 to make them comparable with the SQI values obtained based on regular soil profiles according to the approach described in [41].
The soil quality index was considered to be the main factor influencing the relative density of tree species and browse availability per m2. These relationships were thus, used to test the relationship between the soil quality index and the browsing intensity of tree saplings by ungulates. The SQI values were interpreted based on the descriptions (Table 1).

2.4. Statistical Analysis

In order to draw conclusions on the relationship between browsing intensity and soil quality index, we used the relationship of relative density of tree species and twig dry mass (g) with soil quality index as important indicators. Therefore, tree species’ relative density and twig dry mass (g) were fitted to the soil quality index across soil quality gradients one by one. These variables, which indicate the level of browse abundance, were then fitted to ungulate browsing intensity on the saplings. The relationship between the soil quality index and browsing intensity was analyzed by fitting the data with the linear model.
The linear regression model was used in this study because it makes it easier to interpret complex relationships and multiple comparisons. It is used to estimate the relationship between an independent variable and a dependent variable. This model has been applied in similar data analyses [32,34,42]. The linear model with the Ordinary Least Squares method was used based on the assumptions of a normal distribution, independence between variables, and equal variance across the regression line. Hence, the normality of the data was checked using the Shapiro–Wilk test, and for those variables that were not normally distributed, log transformation was conducted.
The goodness of fit of the regression was determined using beta coefficients as well as the adjusted R2. To control for the family-wise error rate (FWER) when performing multiple comparisons, the Bonferroni correction was used, which adjusts the significance level (α). All of the statistical computations were executed using the R programming language (version R4.3.1).

3. Results

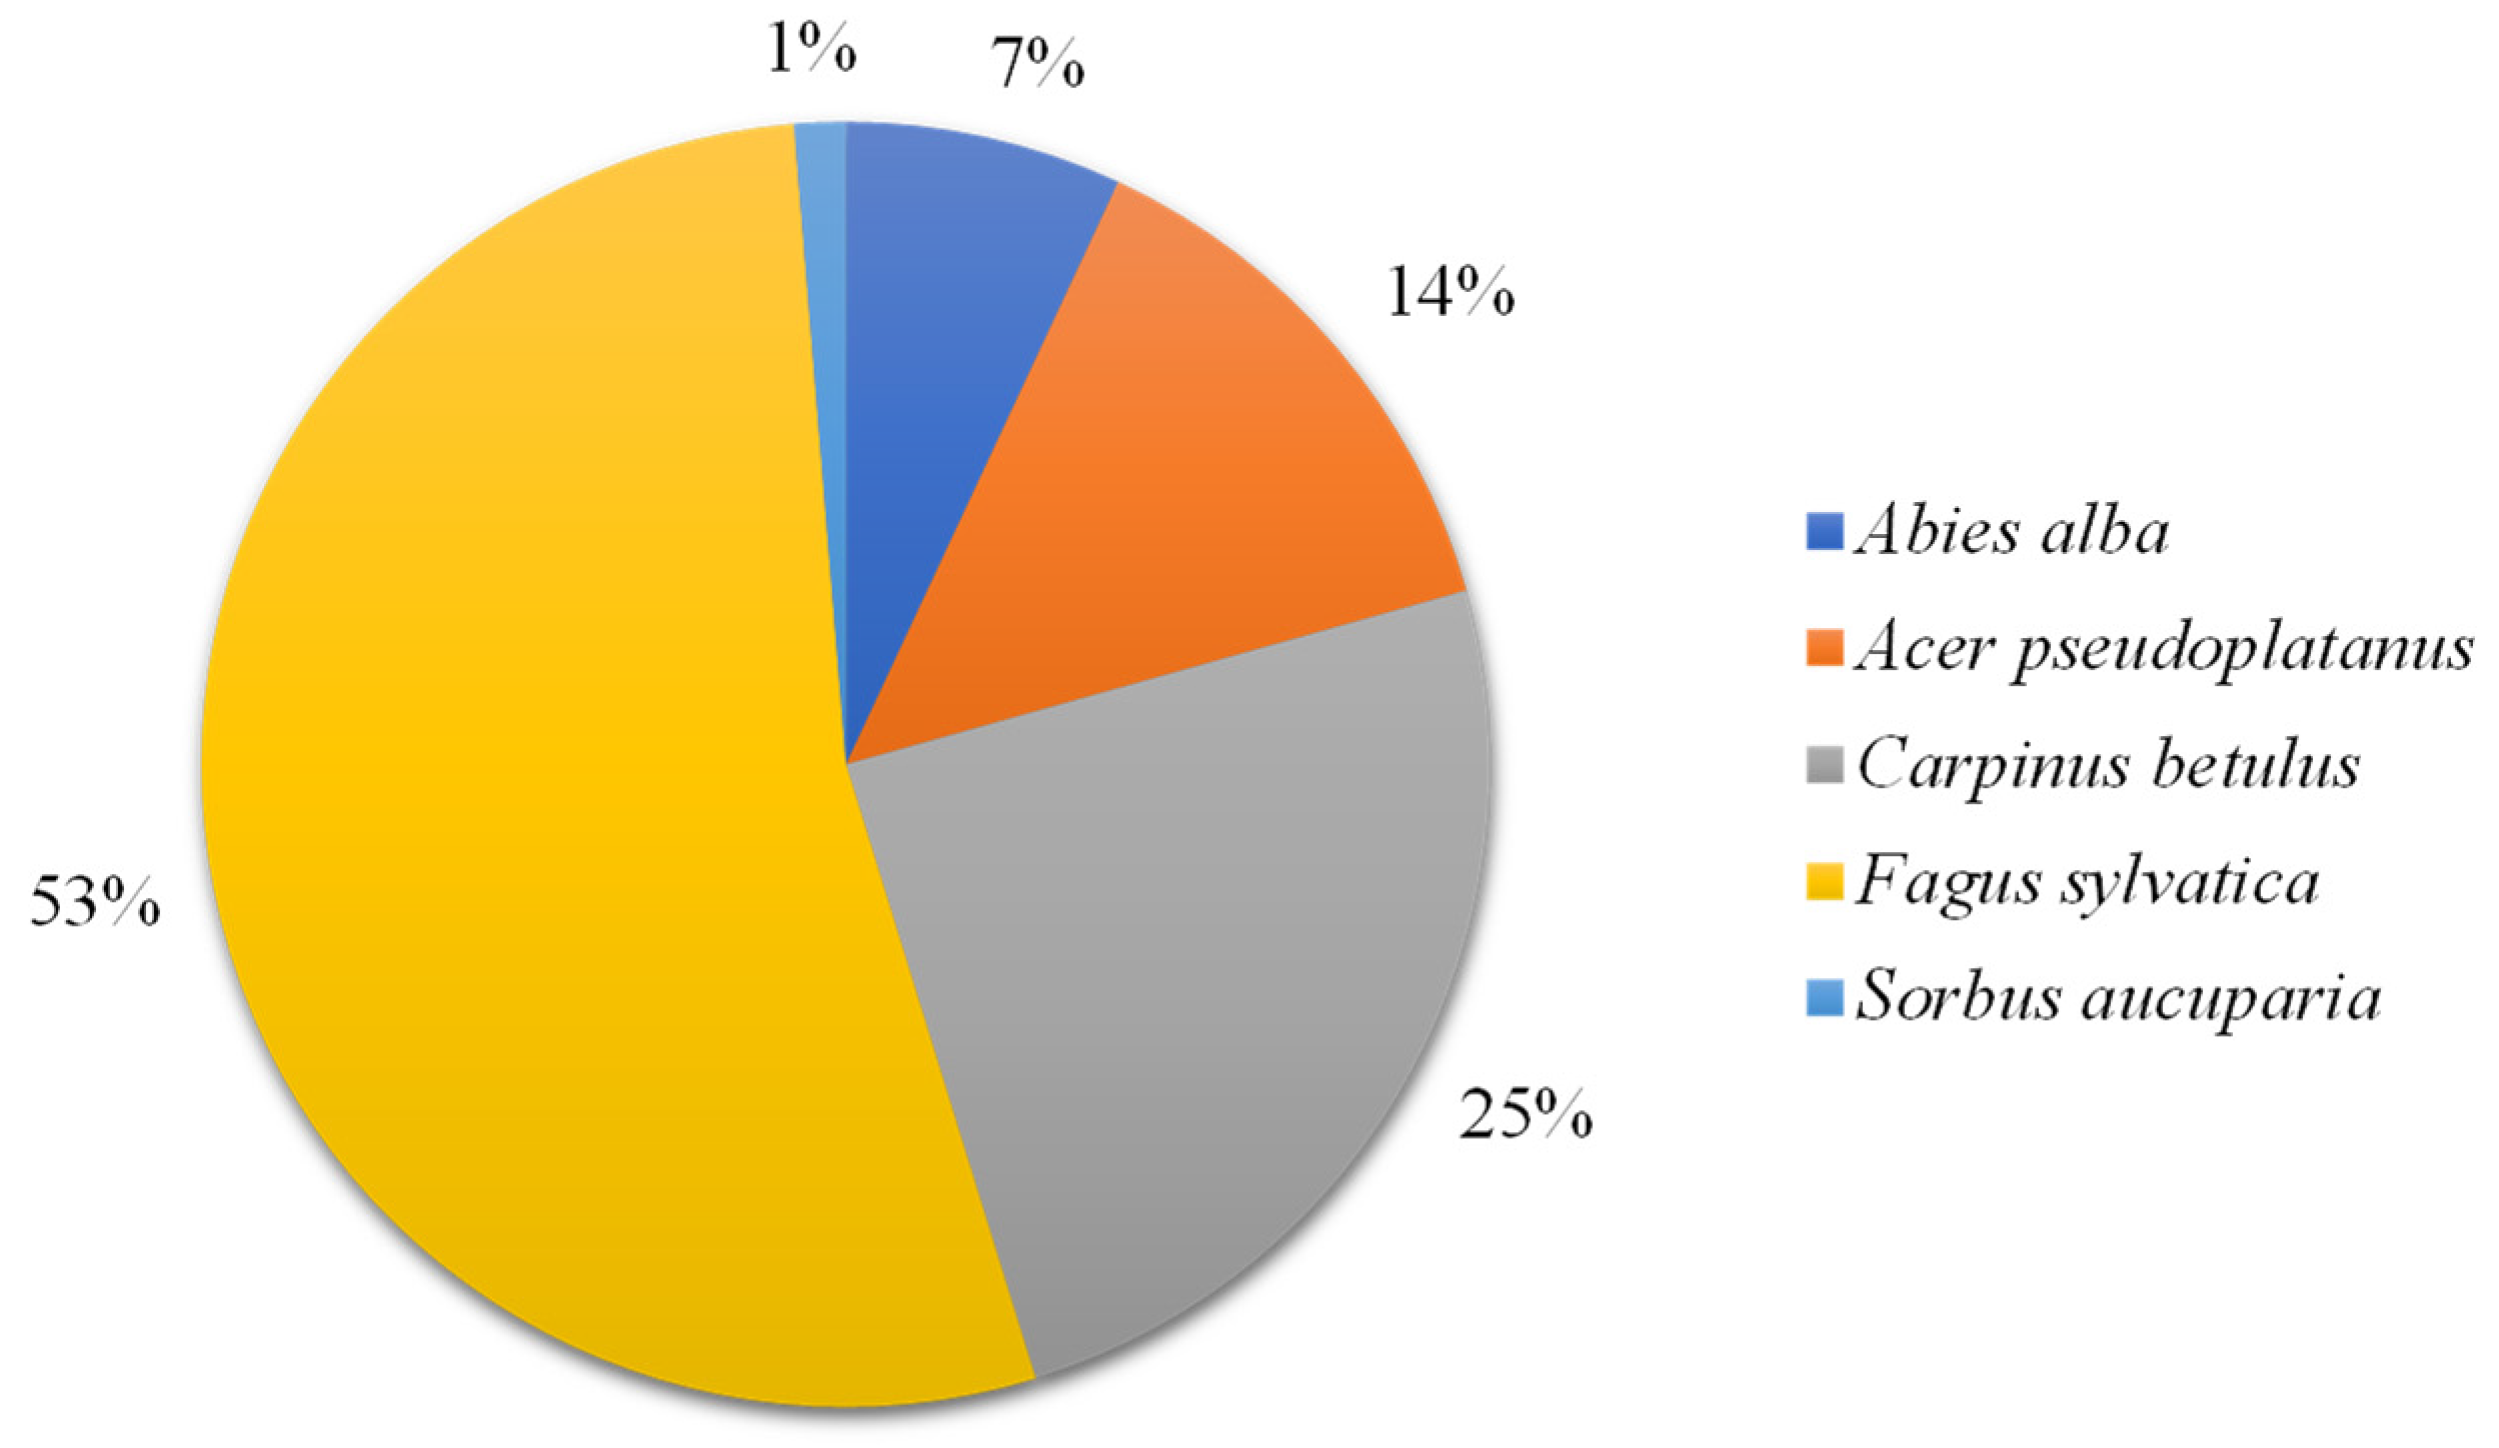
3.1. The Relative Proportion of Tree Species and Descriptive Summary of the Soil Properties

During the field measurements, several tree species were noted within the transects. However, we focused on five specific tree species that were abundant enough to permit statistical analyses: A. alba, A. pseudoplatanus, C. betulus, F. sylvatica, and S. aucuparia. Nevertheless, these species were not evenly distributed throughout the forest community; F. sylvatica (53%), C. betulus (25%), and A. pseudoplatanus (14%) were the predominant tree species in most of the transects (Figure 2).
The ascertained soil properties (Table 2) were used to derive the soil quality index for our study plots. The table below also describes the chemical and physical properties of the soil in our study transects.

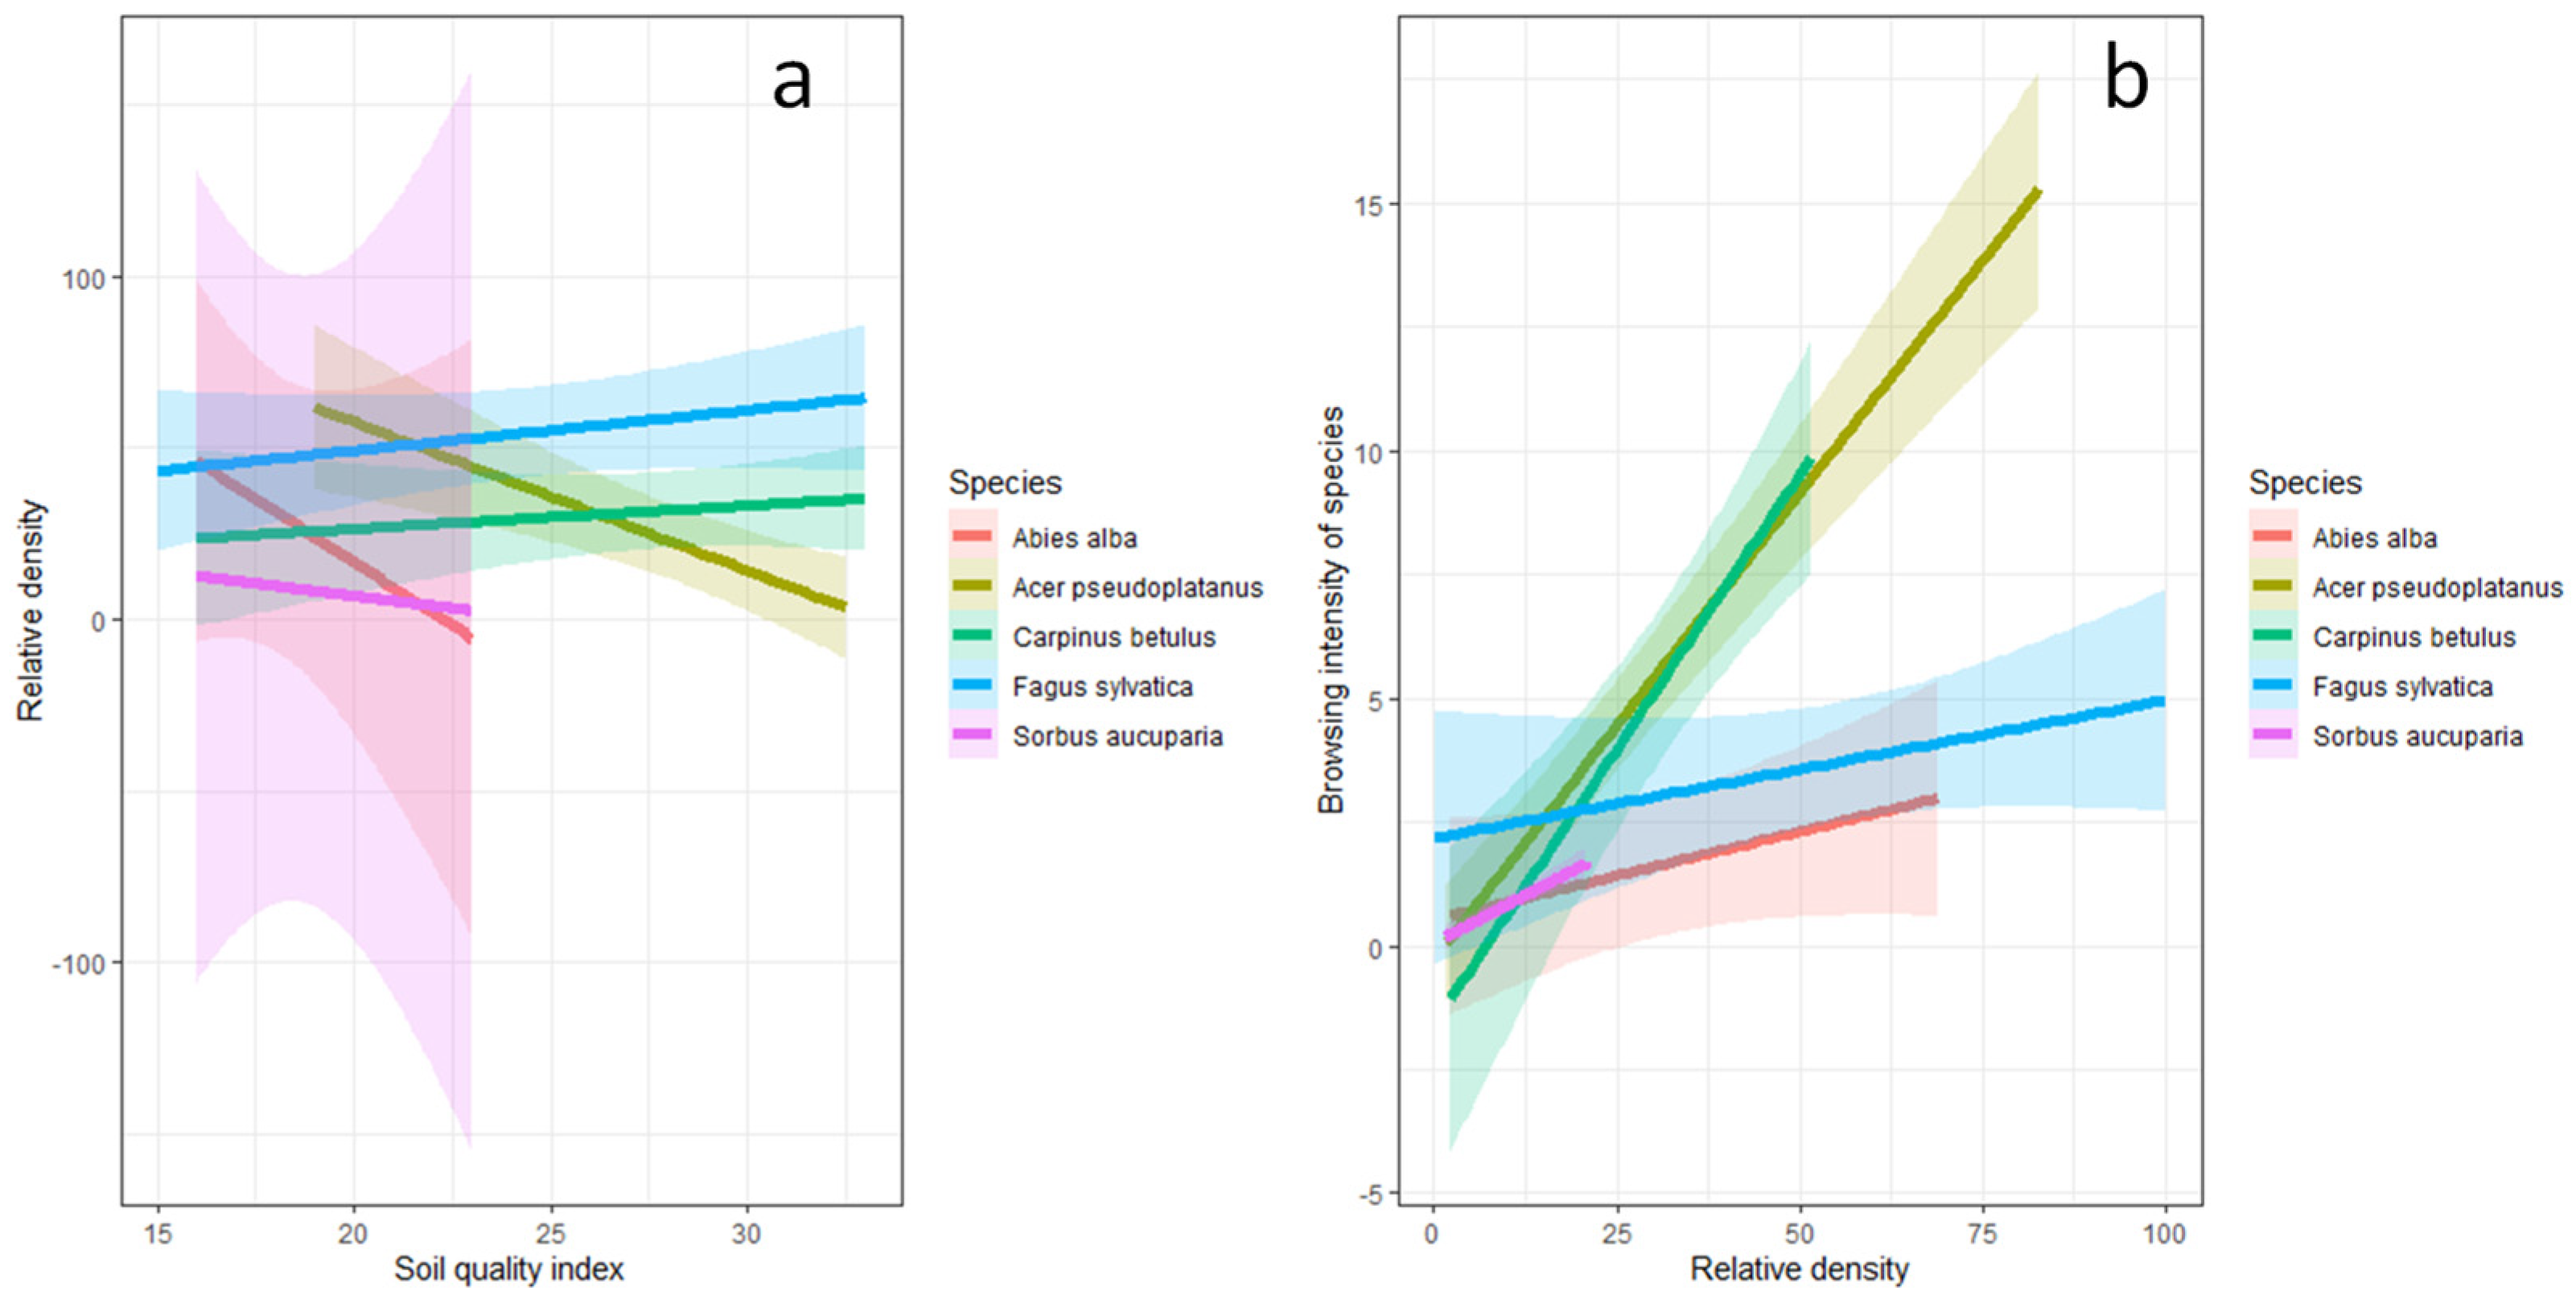
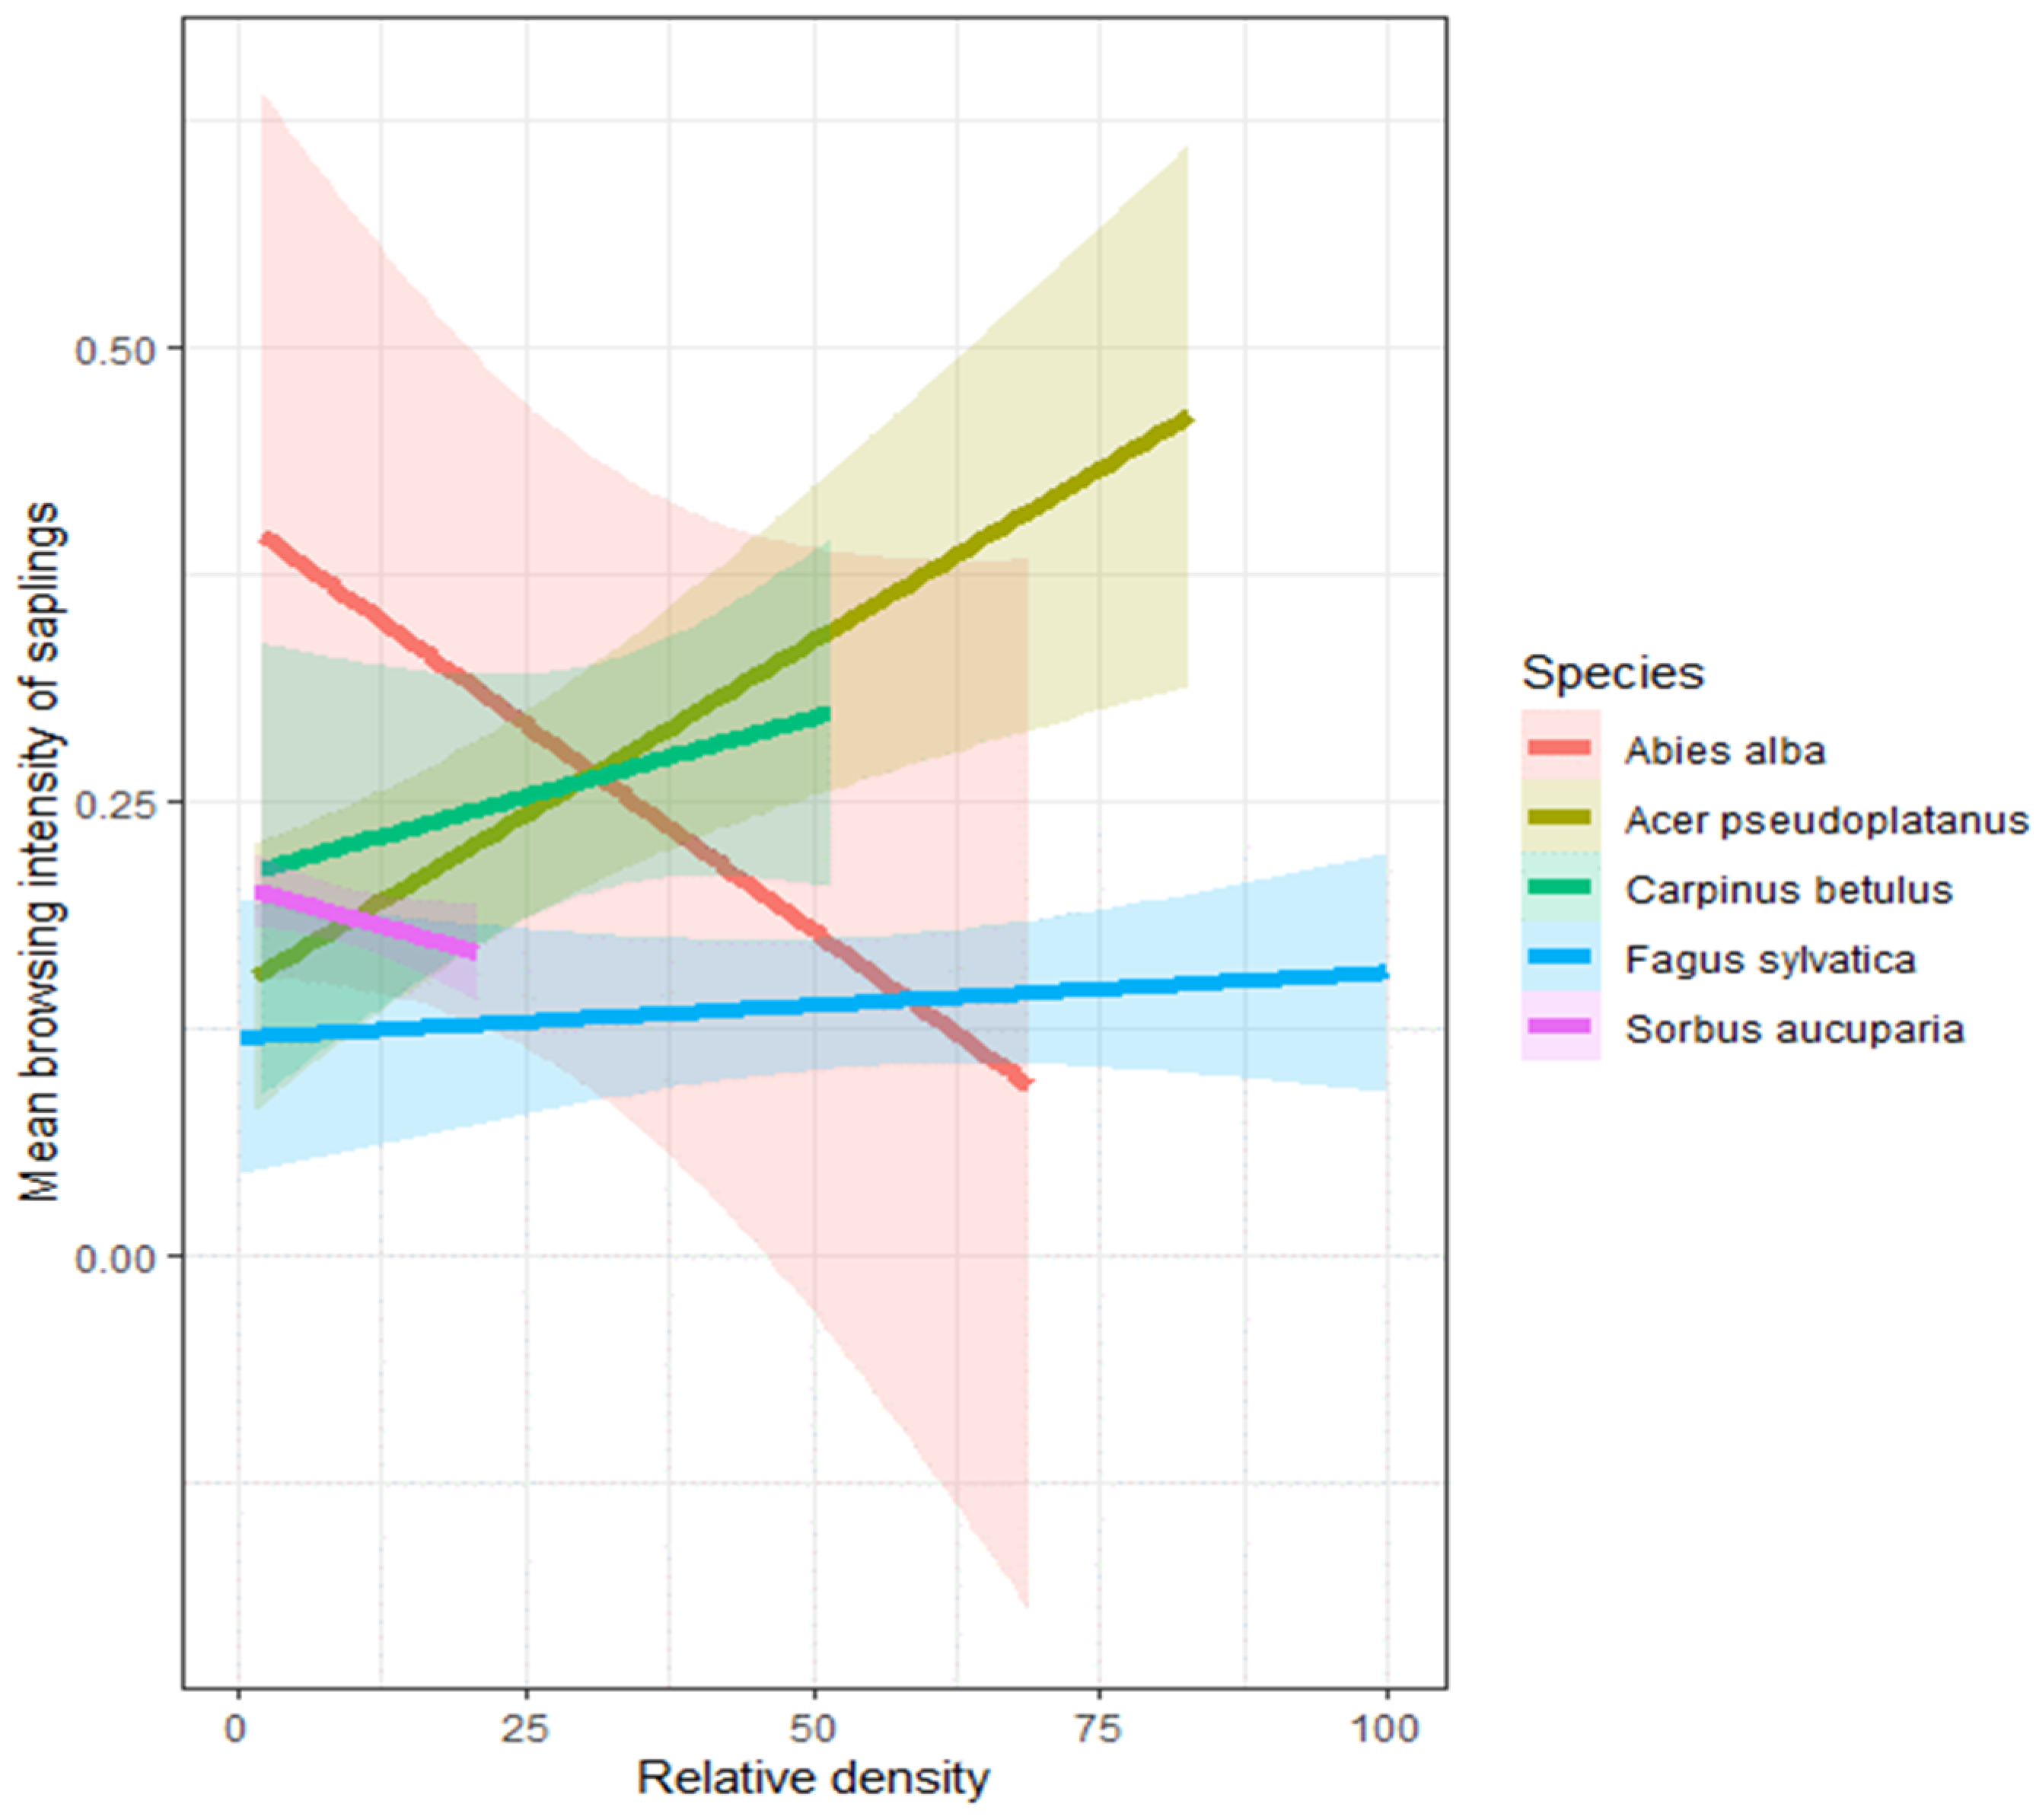
3.2. Relationship between Soil Quality Index, Tree Species Relative Density, and Browsing Intensity

The relationship between the soil quality index and the relative species density showed variation among tree species (Figure 3a). The relative densities of F. sylvatica and C. betulus, which were distributed across the whole range of habitats, tended to increase from poorer to richer soil quality. In contrast, the relative densities of A. alba and S. aucuparia tended to decrease and their distribution was restricted to locations with poor soil quality. However, neither of the aforementioned relationships were statistically significant. On the other hand, the relationship for A. pseudoplatanus, which was distributed from moderate to rich soils, was significantly decreased along the soil quality gradient with 95% confidence (Table 3(a)).
The relationship between the relative density of tree species and total browsing intensity per transect (Figure 3b) was strongly positive for A. pseudoplatanus and C. betulus, corresponding to a 99.9% confidence level, while that for S. aucuparia was significant at a 90% confidence level. For F. sylvatica and A. alba, on the other hand, browsing intensity did not change significantly with an increasing species relative density, although a high value of the adjusted R-squared (51.9%) indicates the better fit of the regression model in the case of A. alba (Table 3(b)).
The relationship between mean browsing intensity and the relative density of the species varied between tree species (Figure 4). Table 4 shows that there was a strong positive relationship between relative density and mean browsing intensity in the case of A. pseudoplatanus, whereas for S. aucuparia and A. alba, the relationship was negative and weakly significant, corresponding to a 90% confidence. However, according to the Bonferroni correction test for multiple comparisons, the relationship between relative density and mean browsing intensity of tree species was not significant for all species except A. pseudoplatanus.

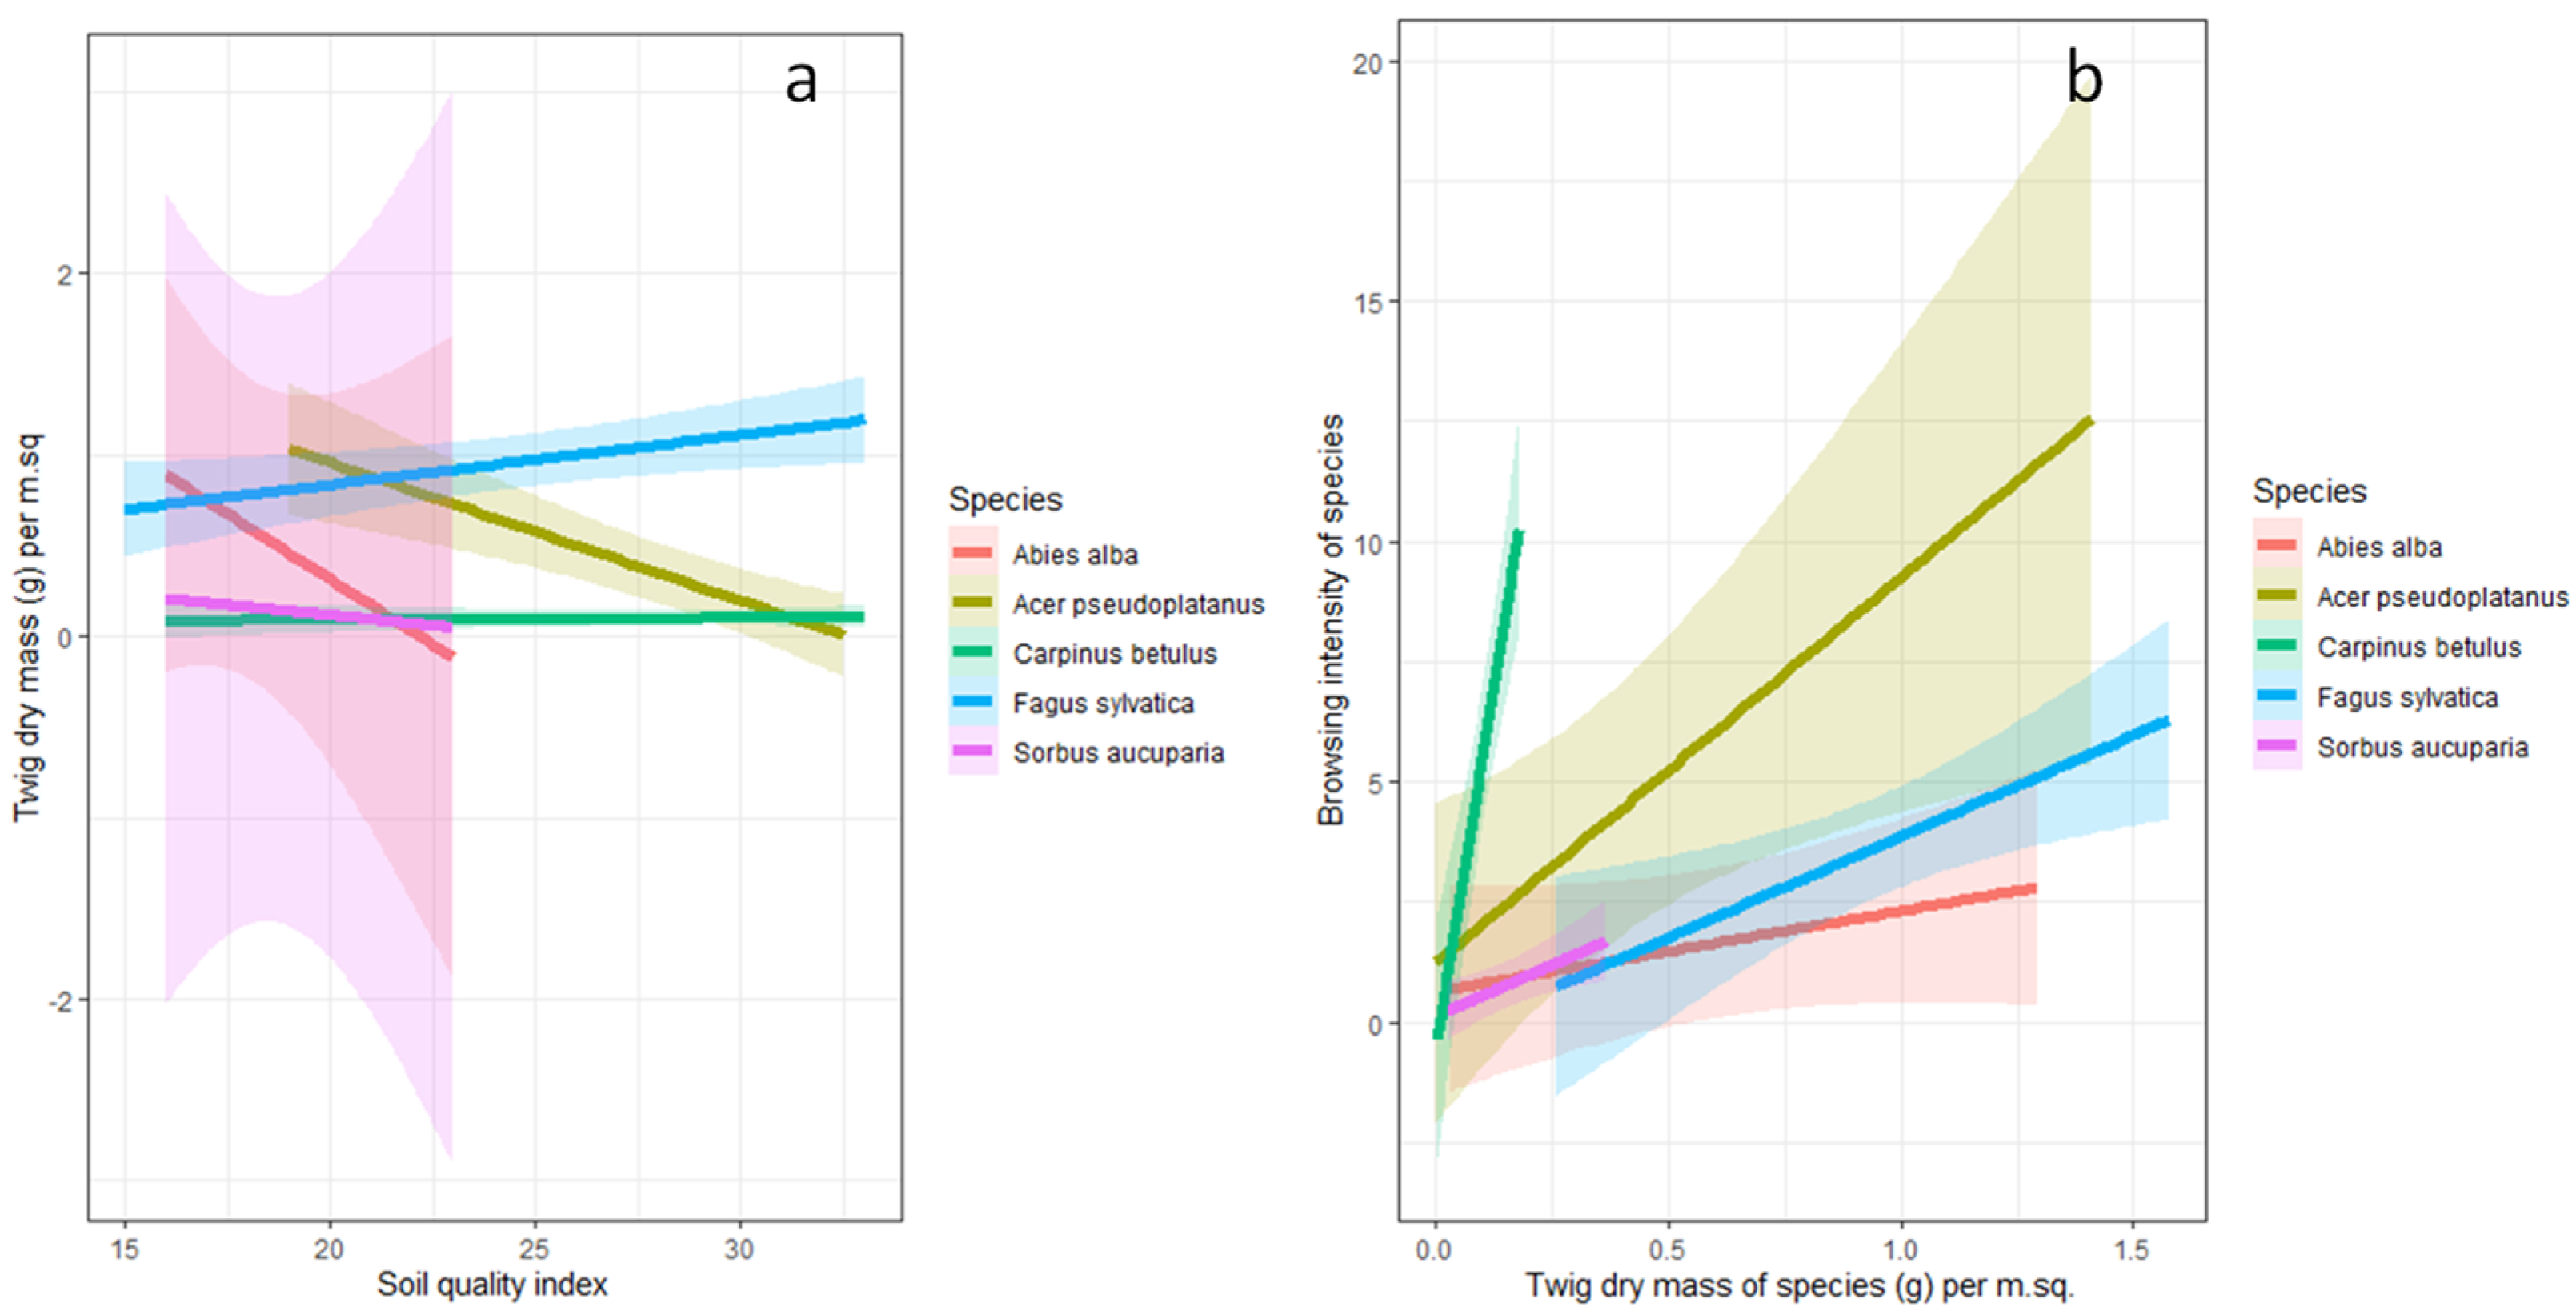
3.3. The Relationship between Soil Quality Index, Twig Dry Mass and Browsing Intensity

The species-specific relationship between soil quality and the dry mass of twigs m−2 for A. pseudoplatanus was significantly negative at the 95% confidence level, while it was weakly positive at the 90% confidence level for F. sylvatica (Table 5(a)). For the rest of the species, the relationship was not statistically significant despite a rapid decrease along the soil quality gradient in the case of A. alba (Figure 5a).
According to the adjusted p-values (Figure 5b), the browsing intensity of ungulates on the tree species increased significantly with an increasing twig dry mass m−2 for F. sylvatica and C. betulus at the 95% confidence level and at the 90% confidence level for A. pseudoplatanus. However, the relationship was not significant for S. aucuparia and A. alba (Table 5(b)).

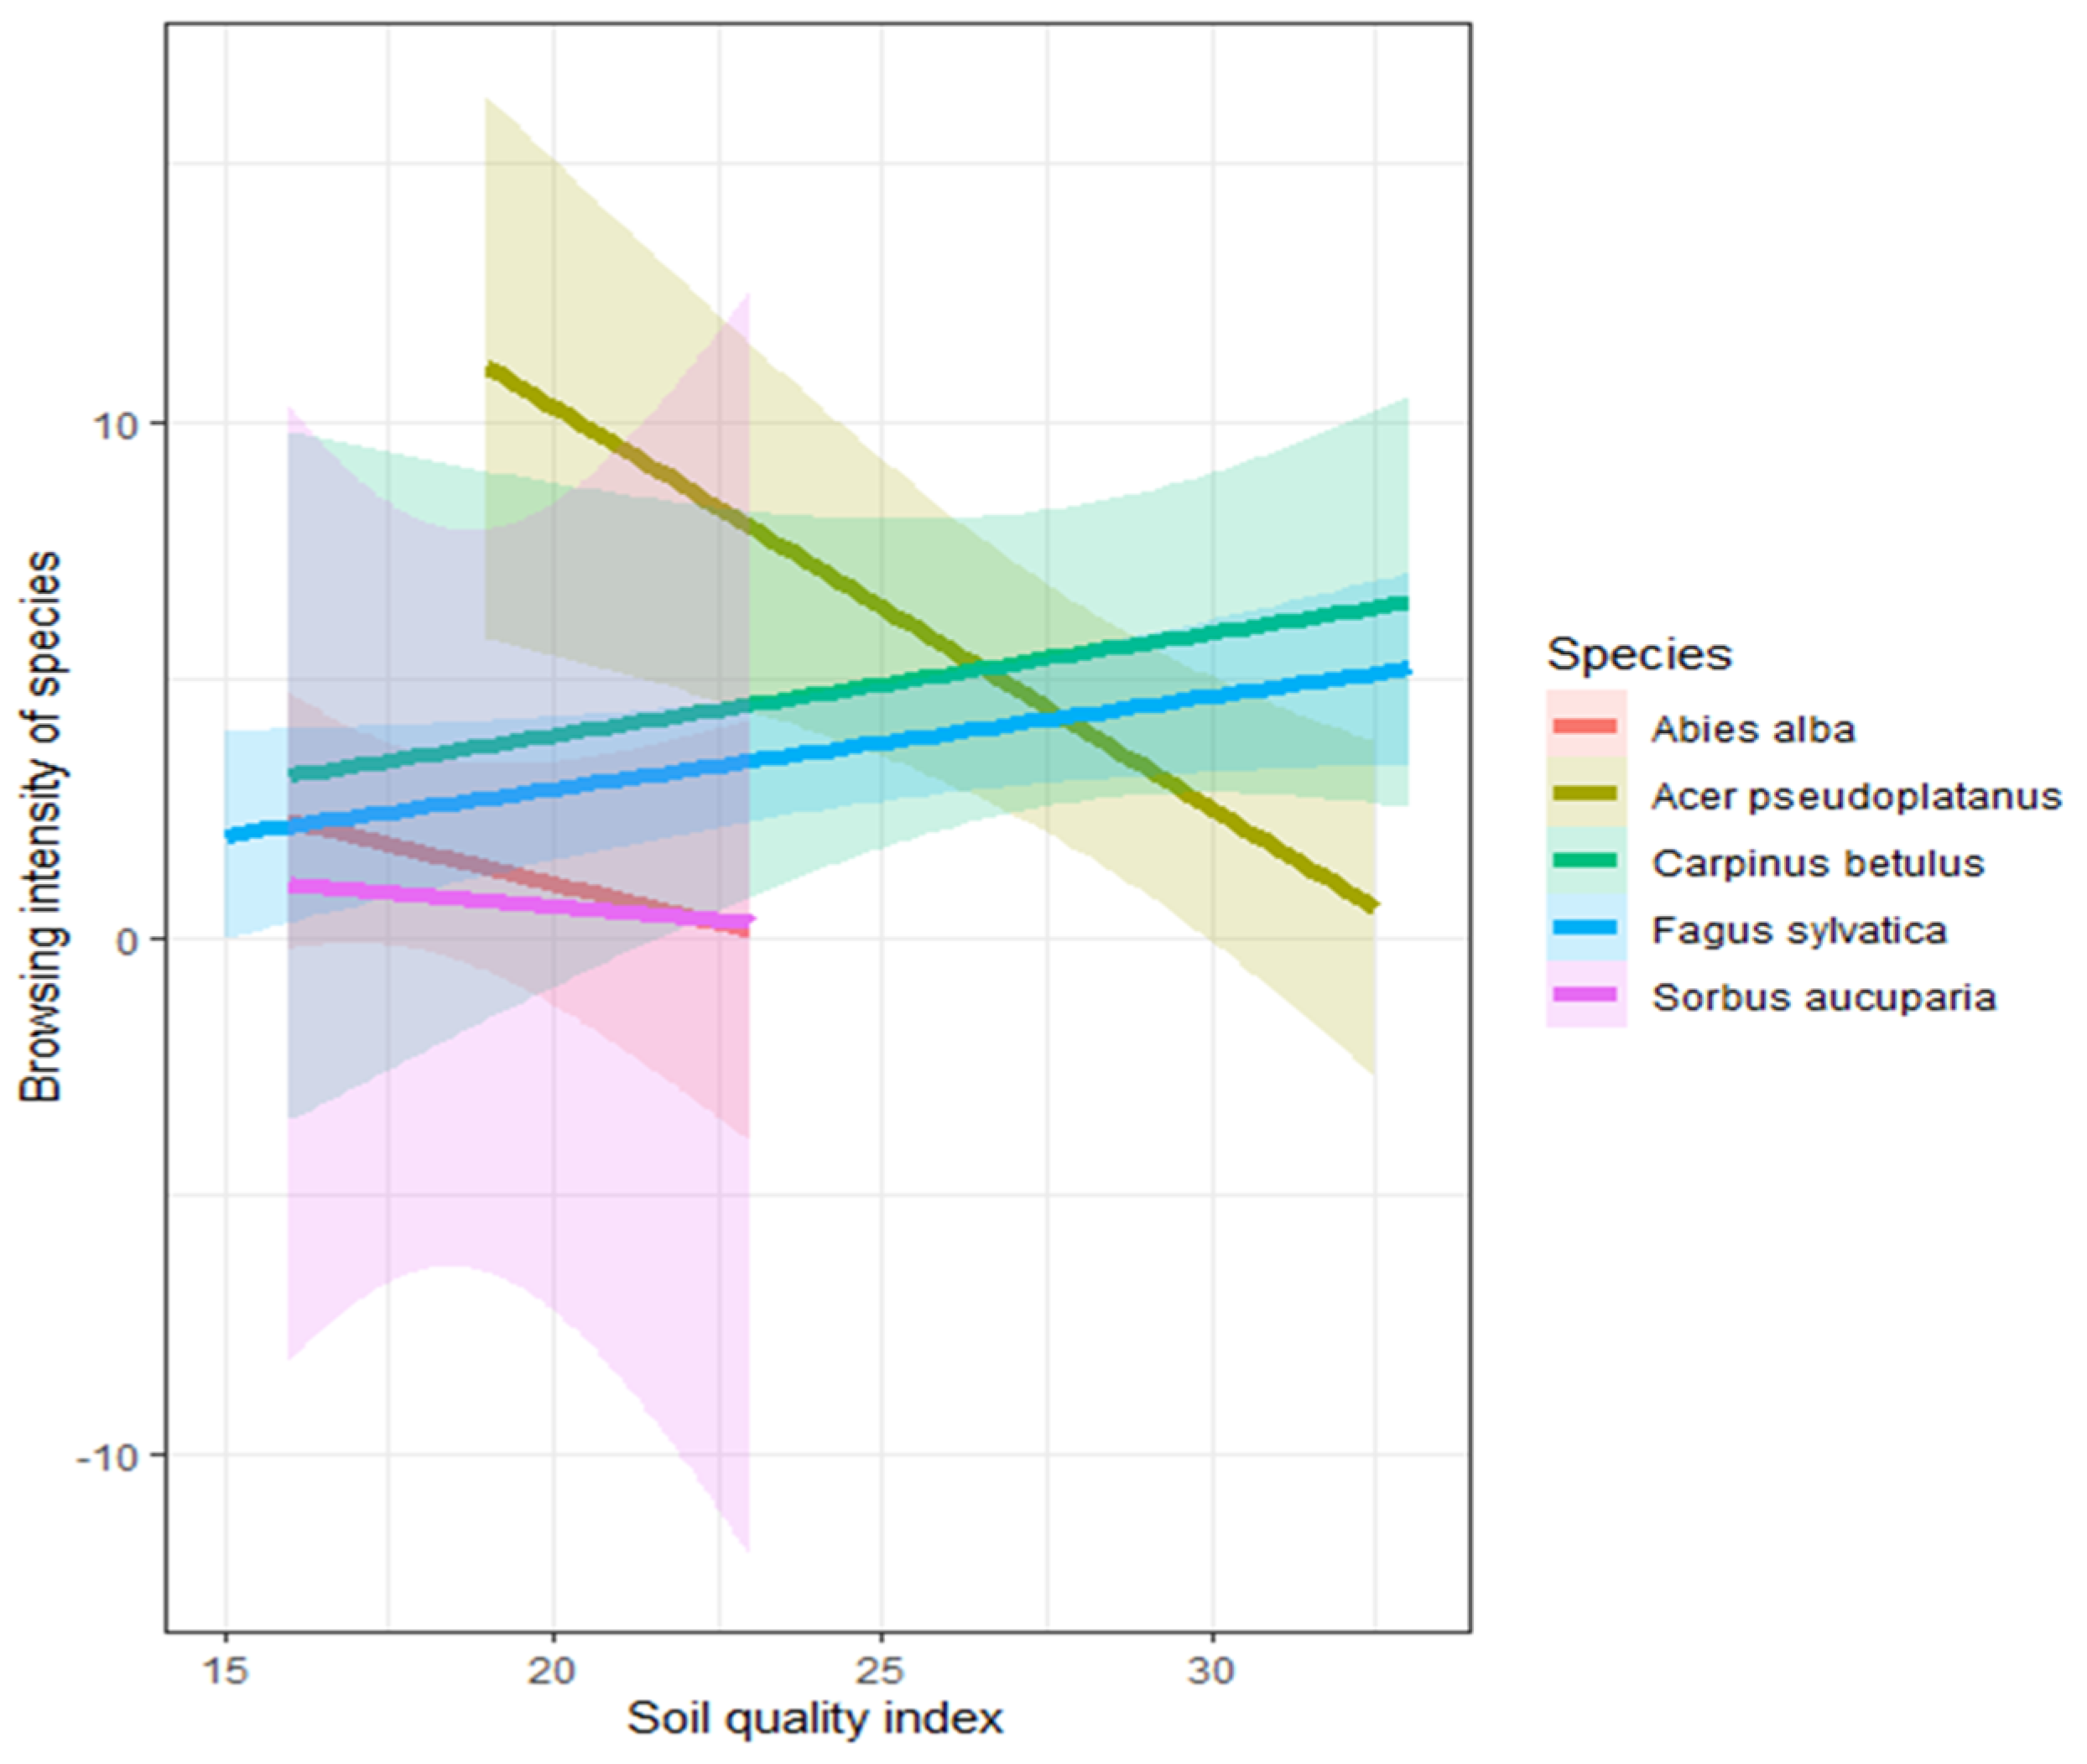
3.4. The Relationship between Soil Quality Index and Browsing Intensity

The results showed variation among the tree species regarding the relationship between the soil quality index and browsing intensity of the tree species (Figure 6). The browsing intensity for A. pseudoplatanus per transect significantly decreased along the gradient from moderate to richer soil quality, whereas in the case of F. sylvatica, it significantly increased. However, the relationship for the other species was weak and insignificant: positive in the case of C. betulus and negative in the case of S. aucuparia and A. Alba (Table 6).

4. Discussion

4.1. Relationship between Soil Quality Index, Tree Species Relative Density, and Browsing Intensity

Our results on the relationship between soil quality index and tree species’ relative density showed different responses for different tree species along the soil quality gradients. The increasing tendency of species relative density for F. sylvatica and C. betulus and the decreasing tendency for A. alba and S. aucuparia, whose distributions were restricted to poor-quality soil, as well as to medium-to-richer-quality soil for A. pseudoplatanus, indicate that soil quality is one of the important factors determining the distribution and abundance of saplings for various tree species. This finding is consistent with a report stating that soil is positively correlated with vegetation richness in coniferous, mixed coniferous, and deciduous forests [42], indicating that soil directly determines the survival and growth of plant species. Similarly, there is some evidence of niche partitioning between silver fir and beech, suggesting that corresponding forests are likely to reach an alternative stable state dominated by beech within a few decades, although many processes may be masked by the avoidance strategy of A. alba [43].
The relationship between the relative density of tree species and browsing intensity of tree species per transect provides insight into browse abundance and ungulate attraction to available resources. Our results contrast with the findings in [44], in which it was reported that browsing intensity decreased with increasing winter food availability for deer, calculated as the number of available saplings. In our study, browsing intensity on A. pseudoplatanus, C. betulus, and S. aucuparia saplings increased significantly with an increasing relative density. Browsing intensity on F. sylvatica and A. alba showed a trend similar to the other species’ trends, although the relationship was not statistically significant. This suggests that ungulate herbivores are likely to concentrate their foraging activities in areas with abundant resources, which may vary for different tree species as a function of soil quality. These findings are consistent with the report by [45], which stated that an abundance of browse allows ungulates to spend more time opportunistically foraging in places with ample food supply, thereby increasing the level of damage.
The current findings highlight that soil quality plays a fundamental role in determining the distribution and abundance of tree saplings, which, in turn, influence the browsing intensity for different tree species within their respective soil-quality niches. For example, the higher relative density of A. pseudoplatanus in the low–medium soil-quality ranges is associated with increased browsing pressure, whereas it is lowest in the high soil-quality range.

4.2. The Relationship between Soil Quality Index, Twig Dry Mass, and Browsing Intensity

Our findings show a general decrease in browse availability (m−2) along the soil quality gradient, although this relationship is not statistically significant. However, the relationship between soil quality index and browse availability varies between species. This is due to the tree species’ habitat preferences in the forest ecosystem [25,42,46]. Accordingly, the browse availability for the two broadleaved species significantly increases for F. sylvatica, while for C. betulus, the increase along the soil quality gradient was not strongly significant. These two species are distributed over a broad range of soil quality levels and provide higher browse resources in places with higher soil quality. This finding is in agreement with reports by some authors [47,48].
In the case of A. pseudoplatanus, which was found in moderate-to-rich soils, a higher availability of browse was found in lower-quality soil, and it declined more rapidly in richer soils. This phenomenon may be due to an increase in competition between tree species and the lower light availability under canopies dominated by shade-tolerant trees in richer soils [49]. In full light, A. pseudoplatanus can out-compete beech, but under a dense canopy where light is limited, it can remain a small seedling with high survival and slow growth [50], resulting in low browse availability of this species.
The availability of browse from A. alba is limited to poor-to-medium soils. This browse exhibits a higher availability in the lower soil quality ranges, which then decreases with an increasing soil quality index. S. aucuparia also follows a similar trend, but the contribution of this species to browse is minimal within the same range of soil quality. This finding suggests that soil quality plays a crucial role in determining the distribution and abundance of browse in forest habitats through the shaping of species’ ecological niches in temperate forests [47]. On the other hand, the lower impact of browsing on A. alba in nutrient-rich soils is a strong indication that this species is less abundant in fertile habitats, partly due to competition from shade-tolerant species, and this finding agrees with a report that light availability on the forest floor is associated with soil quality [25].

4.3. The Relationship between Soil Quality Index and Browsing Intensity

The range of adaptation to different levels of soil quality varies among tree species. Out of the five tree species analyzed in our study, three (F. sylvatica, C. betulus, and A. pseudoplatanus) cover a broad range of soil quality levels, although A. pseudoplatanus does not occur in the poorest-quality soils. The other two species (A. alba and S. aucuparia) are confined to poorer- to medium-quality soils. This result corresponds to the ecological characteristics of these species [51] but also reflects their abundance within the study area.
The total browsing intensity per species per transect shows a significant negative correlation between the soil quality index and browsing intensity for A. pseudoplatanus. This finding indicates that A. pseudoplatanus saplings are not only more heavily browsed but also more abundant in habitats with moderate soil quality. As rapid canopy cover is partly explained by soil quality status, browsing intensity was higher under the more open canopies for A. pseudoplatanus [52]. The lower density of A. pseudoplatanus in transects with high soil quality is probably due to reduced light availability on the forest floor. In rich habitats, the canopy is often very dense and dominated by shade-tolerant species such as F. sylvatica and C. betulus, potentially leading to a lower density of A. pseudoplatanus in such areas. This explanation is supported by the relationship between soil quality, browse availability, and relative species densities revealed in our current study. As a result, following changes in browse access and species composition mediated by soil quality, browsing intensity on tree species gradually shifts from palatable species such as A. pseudoplatanus to less palatable species such as F. sylvatica.
The positive and statistically significant relationship between the soil quality index and the browsing intensity found for F. sylvatica may be due to the increased relative density and twig dry mass (browse availability) of this species in the higher soil quality range. The relationship between the soil quality index and browsing intensity per species per transect is consistent with the results regarding species relative density and browse availability shown in Figure 3a and Figure 5a. On the other hand, F. sylvatica and C. betulus saplings, two shade-tolerant broadleaved species, are abundant in all transects and increase in number with increasing soil quality. This reflects their preference for moderately rich and rich habitats. They are therefore at the forefront of heavy browsing, as their dominance in richer soils makes them the primary food source for ungulates.
Soil quality is a crucial environmental factor influencing the adaptation of A. alba in forest ecosystems and its subsequent browsing pressure with respect to ungulates [53]. In our case, the reduction in browsing intensity for this species in the richer soils is justified by the availability of browse from this species. The majority of A. alba saplings are found in poor habitats, although mature trees of the same species are also present as a small admixture in rich habitats. In the case of A. alba, which is a very shade-tolerant species, the lack of saplings in the richer habitats is probably unrelated to lower light intensities but is instead related to soil factors, possibly indirectly through interactions with fungi [54,55]. Research on the effect of microsites on A. alba survival, density, and ectomycorrhizal status has shown that habitat quality reinforces this interaction. Consequently, sites with an abundance of older regeneration had higher local stand density, lower canopy openness, and lower soil quality [56]. On the other hand, the narrow range of occupied habitats in the case of S. aucuparia can be partly explained by the low number of saplings in our sample (with only 12 individuals).
On the other hand, mean browsing pressure on A. pseudoplatanus increased significantly with an increasing relative density of the species, which was negatively correlated with the soil quality index. In medium-to-rich habitats, where the relative density of this species decreases, the mean browsing intensity significantly decreases. This may be related to the morphology of the species. A. pseudoplatanus, which has few lateral shoots and is even modified by competition in the richer habitats, does not provide much browse for ungulates in comparison to F. sylvatica and C. betulus, but it can survive under dense canopies [57].

5. Conclusions

In this study, we examined the relationship between soil quality and browsing intensity by analyzing the relationship between soil quality and tree species density, as well as soil quality and twig dry mass, which are indicators of browse availability. The findings confirm that ungulate browsing intensity on the tree species in temperate forests varies depending on the soil quality index. The relationship between the soil quality index and browsing intensity was not significant for A. alba, C. betulus, and S. aucuparia. Nevertheless, in the case of A. pseudoplatanus, this finding supports the original hypothesis that browsing intensity decreases with increasing soil quality. However, this phenomenon is not due to an increased productivity or abundance of food resources for this species. Rather, it was due to the soil quality limitations that hindered growth due to increased canopy closure. Similarly, for F. sylvatica, the results provided evidence for the second hypothesis, i.e., that browsing intensity significantly increases with increasing soil quality. The intensity of ungulate browsing on tree species is impacted by soil quality in a species-specific manner as different responses were found among tree species, while the pressure generally increases with increasing browse availability. Furthermore, the soil-quality-mediated changes in browse availability and species composition result in a gradual shift in browsing pressure from palatable tree species such as A. pseudoplatanus to those less palatable like F. sylvatica, thus allowing A. pseudoplatanus to survive and eventually recruit to the forest canopy.
Our method, in which quantitative values of browse are used to correlate browsing intensity with soil quality, is an objective and reliable approach that can be applied in large-scale studies. Additionally, the information in this research is vital for managing tree regeneration in natural forest ecosystems where ungulate herbivores interact with tree recruitment. The relationship between soil quality, browse availability, and browsing intensity is an important consideration in guiding conservation efforts aimed at protecting against and mitigating the impact of ungulate herbivory on tree species. In addition, the results of this research may be useful in developing a conservation strategy, particularly in situations where the regeneration of certain tree species is limited by increasing pressure from wild ungulates in temperate forests.

Author Contributions

All authors (A.B.M., A.G., T.W. and J.S.) contributed to the study in terms of conceptualization, investigation, methodology, data curation, and validation. A.B.M. carried out the formal analysis and visualization and wrote the original draft of the manuscript. J.S. supervised the project activities. All authors have read and agreed to the published version of the manuscript.

Funding

This research was funded by Polish National Science Foundation (NCN) grant No. 2018/31/B/NZ8/02786 (project title: “How do large-scale disturbances influence the relationship between ungulate herbivory and natural regeneration in temperate forests?”) from the Ministry of Science and Higher Education of the Republic of Poland within the framework of statutory activities SUB/040011-D019/2020 of the Department of Forest Biodiversity, University of Agriculture in Krakow.

Data Availability Statement

The data in this study are available from the corresponding author upon request.

Acknowledgments

We acknowledge the Polish National Science Foundation (NCN), the Roztocze National Park, and the Department of Ecology and Silviculture for providing the research facilities and resources for this study.

Conflicts of Interest

The authors declare no conflicts of interest.

References

  1. Didion, M.; Kupferschmid, A.D.; Bugmann, H. Long-term effects of ungulate browsing on forest composition and structure. For. Ecol. Manag. 2009, 258, S44–S55. [Google Scholar] [CrossRef]
  2. Churski, M.; Bubnicki, J.W.; Jędrzejewska, B.; Kuijper, D.P.J.; Cromsigt, J.P.G.M. Brown world forests: Increased ungulate browsing keeps temperate trees in recruitment bottlenecks in resource hotspots. New Phytol. 2017, 214, 158–168. [Google Scholar] [CrossRef] [PubMed]
  3. Hothorn, T.; Müller, J. Large-scale reduction of ungulate browsing by managed sport hunting. For. Ecol. Manag. 2010, 260, 1416–1423. [Google Scholar] [CrossRef]
  4. Angst, J.K.; Kupferschmid, A.D. Assessing Browsing Impact in Beech Forests: The Importance of Tree Responses after Browsing. Diversity 2023, 15, 262. [Google Scholar] [CrossRef]
  5. Akashi, N.; Unno, A.; Uno, H. The browsing ratio as an index of the impact of deer browsing on tree seedlings. Trees For. People 2022, 8, 100276. [Google Scholar] [CrossRef]
  6. Szwagrzyk, J.; Gazda, A.; Muter, E.; Pielech, R.; Szewczyk, J.; Zięba, A.; Zwijacz-Kozica, T.; Wiertelorz, A.; Pachowicz, T.; Bodziarczyk, J. Effects of species and environmental factors on browsing frequency of young trees in mountain forests affected by natural disturbances. For. Ecol. Manag. 2020, 474, 118364. [Google Scholar] [CrossRef]
  7. Heuze, P.; Schnitzler, A.; Klein, F. Is browsing the major factor of silver fir decline in the Vosges Mountains of France? For. Ecol. Manag. 2005, 217, 219–228. [Google Scholar] [CrossRef]
  8. Kupferschmid, A.D. Selective browsing behaviour of ungulates influences the growth of Abies alba differently depending on forest type. For. Ecol. Manag. 2018, 429, 317–326. [Google Scholar] [CrossRef]
  9. Candaele, R.; Ligot, G.; Licoppe, A.; Lievens, J.; Fichefet, V.; Jonard, M.; André, F.; Lejeune, P. Interspecific Growth Reductions Caused by Wild Ungulates on Tree Seedlings and Their Implications for Temperate Quercus-Fagus Forests. Forests 2023, 14, 1330. [Google Scholar] [CrossRef]
  10. Ramirez, J.I.; Jansen, P.A.; Poorter, L. Effects of wild ungulates on the regeneration, structure and functioning of temperate forests: A semi-quantitative review. For. Ecol. Manag. 2018, 424, 406–419. [Google Scholar] [CrossRef]
  11. Augustine, D.J.; McNaughton, S.J. Ungulate Effects on the Functional Species Composition of Plant Communities: Herbivore Selectivity and Plant Tolerance. J. Wildl. Manag. 1998, 62, 1165–1183. [Google Scholar] [CrossRef]
  12. Kuijper, D.P.J. Lack of natural control mechanisms increases wildlife-forestry conflict in managed temperate European forest systems. Eur. J. For. Res. 2011, 130, 895–909. [Google Scholar] [CrossRef]
  13. Kuijper, D.P.J.; Cromsigt, J.P.G.M.; Churski, M.; Adam, B.; Jedrzejewska, B.; Jedrzejewski, W. Do ungulates preferentially feed in forest gaps in European temperate forest? For. Ecol. Manag. 2009, 258, 1528–1535. [Google Scholar] [CrossRef]
  14. Bodziarczyk, J.; Zwijacz-Kozica, T.; Gazda, A.; Szewczyk, J.; Frączek, M.; Zięba, A.; Szwagrzyk, J. Species composition, elevation, and former management type affect browsing pressure on forest regeneration in the Tatra National Park. For. Res. Pap. 2017, 78, 238–247. [Google Scholar] [CrossRef]
  15. Ristok, C.; Weinhold, A.; Ciobanu, M.; Poeschl, Y.; Roscher, C.; Vergara, F.; Eisenhauer, N.; van Dam, N.M. Plant diversity effects on herbivory are related to soil biodiversity and plant chemistry. J. Ecol. 2023, 111, 412–427. [Google Scholar] [CrossRef]
  16. Frouz, J.; Toyota, A.; Mudrák, O.; Jílková, V.; Filipová, A.; Cajthaml, T. Effects of soil substrate quality, microbial diversity and community composition on the plant community during primary succession. Soil Biol. Biochem. 2016, 99, 75–84. [Google Scholar] [CrossRef]
  17. Yang, Q.; Zhang, H.; Wang, L.; Ling, F.; Wang, Z.; Li, T.; Huang, J. Topography and soil content contribute to plant community composition and structure in subtropical evergreen-deciduous broadleaved mixed forests. Plant Divers. 2021, 43, 264–274. [Google Scholar] [CrossRef] [PubMed]
  18. Lévesque, M.; Walthert, L.; Weber, P. Soil nutrients influence growth response of temperate tree species to drought. J. Ecol. 2016, 104, 377–387. [Google Scholar] [CrossRef]
  19. Holmes, P.M. Shrubland restoration following woody alien invasion and mining: Effects of topsoil depth, seed source, and fertilizer addition. Restor. Ecol. 2001, 9, 71–84. [Google Scholar] [CrossRef]
  20. Augusto, L.; Boča, A. Tree functional traits, forest biomass, and tree species diversity interact with site properties to drive forest soil carbon. Nat. Commun. 2022, 13, 1097. [Google Scholar] [CrossRef]
  21. Jiang, Z.D.; Owens, P.R.; Ashworth, A.J.; Fuentes, B.A.; Thomas, A.L.; Sauer, T.J.; Wang, Q.-B. Evaluating tree growth factors into species-specific functional soil maps for improved agroforestry system efficiency. Agrofor. Syst. 2022, 96, 479–490. [Google Scholar] [CrossRef]
  22. Kardol, P.; Dickie, I.A.; John, M.G.S.; Husheer, S.W.; Bonner, K.I.; Bellingham, P.J.; Wardle, D.A. Soil-mediated effects of invasive ungulates on native tree seedlings. J. Ecol. 2014, 102, 622–631. [Google Scholar] [CrossRef]
  23. Sardar, M.F.; Younas, F.; Farooqi, Z.U.R.; Li, Y. Soil nitrogen dynamics in natural forest ecosystem: A review. Front. For. Glob. Change 2023, 6, 1–16. [Google Scholar] [CrossRef]
  24. Charles, D.C.; Finzi, A.C.; Pacala, S.W.; Burbank, D.H. Causes and consequences of resource hetrogenity in forests: Interespecific variation in light transmission by canopy trees. Can. J. For. Res. 1994, 24, 7823–7830. [Google Scholar]
  25. Coomes, D.A.; Kunstler, G.; Canham, C.D.; Wright, E. A greater range of shade-tolerance niches in nutrient-rich forests: An explanation for positive richness-productivity relationships? J. Ecol. 2009, 97, 705–717. [Google Scholar] [CrossRef]
  26. Dirnböck, T.; Grandin, U.; Bernhardt-Römermann, M.; Beudert, B.; Canullo, R.; Forsius, M.; Grabner, M.; Holmberg, M.; Kleemola, S.; Lundin, L.; et al. Forest floor vegetation response to nitrogen deposition in Europe. Glob. Chang. Biol. 2014, 20, 429–440. [Google Scholar] [CrossRef] [PubMed]
  27. Petren, K. Habitat and Niche, Concept of. Encycl. Biodivers. 2001, 3, 303–315. [Google Scholar] [CrossRef]
  28. Hirzel, A.H.; Le Lay, G. Habitat suitability modelling and niche theory. J. Appl. Ecol. 2008, 45, 1372–1381. [Google Scholar] [CrossRef]
  29. Cremer, M.; Kern, N.V.; Prietzel, J. Soil organic carbon and nitrogen stocks under pure and mixed stands of European beech, Douglas fir and Norway spruce. For. Ecol. Manag. 2016, 367, 30–40. [Google Scholar] [CrossRef]
  30. Vesterdal, L.; Schmidt, I.K.; Callesen, I.; Nilsson, L.O.; Gundersen, P. Carbon and nitrogen in forest floor and mineral soil under six common European tree species. For. Ecol. Manag. 2008, 255, 35–48. [Google Scholar] [CrossRef]
  31. Cools, N.; Vesterdal, L.; De Vos, B.; Vanguelova, E.; Hansen, K. Tree species is the major factor explaining C: N ratios in European forest soils. For. Ecol. Manag. 2014, 311, 3–16. [Google Scholar] [CrossRef]
  32. Gruba, P.; Mulder, J. Tree species affect cation exchange capacity (CEC) and cation binding properties of organic matter in acid forest soils. Sci. Total Environ. 2015, 511, 655–662. [Google Scholar] [CrossRef] [PubMed]
  33. Dodge, V.J.; Eviner, V.T.; Cushman, J.H. Context-dependent effects of a reintroduced ungulate on soil properties are driven by soil texture, moisture, and herbivore activity. Ecol. Evol. 2020, 10, 10858–10871. [Google Scholar] [CrossRef] [PubMed]
  34. Fornara, D.A. Ungulate Browsing as and Ecosystem Process: Browser-Plant-Soil Interactions in a Southern African Savanna. Ph.D. Thesis, University of Pretoria, Pretoria, South Africa, March 2005. [Google Scholar]
  35. Liang, W.; Feng, Y.; Li, F.; Zhao, Y.; Zhu, J.; Yao, J.; Chang, C.; Wei, X. Drivers of vegetation and soil determine natural regeneration of a single plantation at different slope positions. Front. For. Glob. Chang. 2023, 6, 1167284. [Google Scholar] [CrossRef]
  36. Kupferschmid, A.D.; Bütikofer, L.; Hothorn, T.; Schwyzer, A.; Brang, P. Ungulate species and abundance as well as environmental factors determine the probability of terminal shoot browsing on temperate forest trees. Forests 2020, 11, 764. [Google Scholar] [CrossRef]
  37. Grabowski, T.; Jóźwiakowski, K.; Bochniak, A.; Micek, A. Changes in the Amount of Rainwater in the Roztocze National Park (Poland) in 2001–2020 and the Possibility of Using Rainwater in the Context of Ongoing Climate Variability. Water 2022, 14, 1334. [Google Scholar] [CrossRef]
  38. Maciejewski, Z. The role of the Roztocze National Park in shaping and protecting the forest landscapes of the Roztocze region. Hum. Impact Upl. landscapes Lublin Reg. 2010, 109–128. [Google Scholar]
  39. Madalcho, A.B.; Szwagrzyk, J.; Maciejewski, Z.; Gazda, A.; Bodziarczyk, J. Allometric scaling models for tree saplings: Assessing potential fodder for ungulate herbivores. Trees For. People 2023, 13, 100424. [Google Scholar] [CrossRef]
  40. Brożek, S.; Zwydak, M. Atlas Gleb Leśnych Polski; State Forests Information Center (CILP): Warsaw, Poland, 2010; pp. 11–12. Available online: https://www.larix.lublin.pl/gleboznawstwo/18929-atlas-gleb-lesnych-polski.html (accessed on 12 February 2024).
  41. Brożek, S.; Lasota, J.; Blońska, E.; Wanic, T.; Zwydak, M. Waloryzacja siedlisk obszarów górskich na podstawie Siedliskowego Indeksu Glebowego (SIGg). Sylwan 2015, 159, 684–692. [Google Scholar]
  42. Shen, Y.; Li, J.; Chen, F.; Cheng, R.; Xiao, W.; Wu, L.; Zeng, L. Correlations between forest soil quality and aboveground vegetation characteristics in Hunan Province, China. Front. Plant Sci. 2022, 13, 1009109. [Google Scholar] [CrossRef]
  43. Diaci, J.; Adamic, T.; Fidej, G.; Rozenbergar, D. Toward a Beech-Dominated Alternative Stable State in Dinaric Mixed Montane Forests: A Long-Term Study of the Pecka Old-Growth Forest. Front. For. Glob. Chang. 2022, 5, 1–11. [Google Scholar] [CrossRef]
  44. Borowski, Z.; Bartoń, K.; Gil, W.; Wójcicki, A.; Pawlak, B. Factors affecting deer pressure on forest regeneration: The roles of forest roads, visibility and forage availability. Pest Manag. Sci. 2021, 77, 628–634. [Google Scholar] [CrossRef]
  45. Milligan, H.T.; Koricheva, J. Effects of tree species richness and composition on moose winter browsing damage and foraging selectivity: An experimental study. J. Anim. Ecol. 2013, 82, 739–748. [Google Scholar] [CrossRef]
  46. Knoepp, J.D.; Coleman, D.C.; Crossley, D.A., Jr.; Clark, J.S. Biological indices of soil quality: An ecosystem case study of their use. For. Ecol. Manag. 2000, 138, 357–368. [Google Scholar] [CrossRef]
  47. Walthert, L.; Meier, E.S. Tree species distribution in temperate forests is more influenced by soil than by climate. Ecol. Evol. 2017, 7, 9473–9484. [Google Scholar] [CrossRef] [PubMed]
  48. Packham, J.R.; Thomas, P.A.; Atkinson, M.D.; Degen, T. Biological Flora of the British Isles: Fagus sylvatica. J. Ecol. 2012, 100, 1557–1608. [Google Scholar] [CrossRef]
  49. Gottlieb, R.; Gruntman, M. Can plants integrate information on above-ground competition in their directional responses below ground? Ann. Bot. 2022, 130, 763–771. [Google Scholar] [CrossRef] [PubMed]
  50. Hein, S.; Collet, C.; Ammer, C.; Le Goff, N.; Skovsgaard, J.P.; Savill, P. A review of growth and stand dynamics of Acer pseudoplatanus L. in Europe: Implications for silviculture. Forestry 2009, 82, 361–385. [Google Scholar] [CrossRef]
  51. Hawkes, J.C.; Pyatt, D.G.; White, I.M.S. Using Ellenberg Indicator Values to Assess Soil Quality in British Forests from Ground Vegetation: A Pilot Study Author (s): White Published by: British Ecological Society Stable. J. Appl. Ecol. 1997, 34, 375–387. [Google Scholar] [CrossRef]
  52. Ohse, B.; Seele, C.; Holzwarth, F.; Wirth, C. Different facets of tree sapling diversity influence browsing intensity by deer dependent on spatial scale. Ecol. Evol. 2017, 7, 6779–6789. [Google Scholar] [CrossRef]
  53. Kobal, M.; Grčman, H.; Zupan, M.; Levanič, T.; Simončič, P.; Kadunc, A.; Hladnik, D. Influence of soil properties on silver fir (Abies alba Mill.) growth in the Dinaric Mountains. For. Ecol. Manag. 2015, 337, 77–87. [Google Scholar] [CrossRef]
  54. Baranowska, M.; Behnke-Borowczyk, J.; Barzdajn, W.; Szmyt, J.; Korzeniewicz, R.; Łukowski, A.; Memišević-Hodžić, M.; Kartawik, N.; Kowalkowski, W. Effects of nursery production methods on fungal community diversity within soil and roots of Abies alba Mill. Sci. Rep. 2023, 13, 21284. [Google Scholar] [CrossRef] [PubMed]
  55. Kowalski, S. Role of mycorrhiza and soil fungi in natural regeneration of fir (Abies alba Mill.) in Polish Carpathians and Sudetes. Eur. J. For. Pathol. 1982, 12, 107–112. [Google Scholar] [CrossRef]
  56. Paluch, J.G.; Stepniewska, H.J. Effect of microsites on the survival, density, and ectomycorrhizal status of shade-tolerant abies alba regeneration attacked by fungal pathogens. Can. J. For. Res. 2012, 42, 720–732. [Google Scholar] [CrossRef]
  57. Petritan, A.M.; von Lüpke, B.; Petritan, I.C. Influence of light availability on growth, leaf morphology and plant architecture of beech (Fagus sylvatica L.), maple (Acer pseudoplatanus L.) and ash (Fraxinus excelsior L.) saplings. Eur. J. For. Res. 2009, 128, 61–74. [Google Scholar] [CrossRef]
Figure 1. The map of the transects located in the forest area in Roztoczańskie National Park. The red dots stands for the transects used for data collection in each of the permanent research plots.
Forests 15 00708 g001
Figure 2. Relative proportions of tree species among the surveyed saplings.
Forests 15 00708 g002
Figure 3. The relationship between soil quality and tree species relative density (a) and relative density and browsing intensity per species per transect (b).
Forests 15 00708 g003
Figure 4. The relationship between the relative density of species and the mean browsing intensity of species per transect.
Forests 15 00708 g004
Figure 5. The relationship between soil quality index and total twig dry mass of tree species m−2 (a) and between the total twig dry mass of tree species m−2 and browsing intensity on tree species (b).
Forests 15 00708 g005
Figure 6. Relationship between soil quality index and browsing intensity of tree species per transect.
Forests 15 00708 g006
Table 1. The table describes soil quality index ranges, and the corresponding forest habitat types.
Soil Quality RangeForest Habitat TypeTrophic Variety of Soil Subtype
SQI of 4 to 13Coniferous forestsDystrophic
SQI of 14 to 23Mixed coniferous forestsOligotrophic
SQI of 24 to 33Mixed deciduous forestsMesotrophic
SQI of 34 to 40Deciduous forestsEutrophic
Table 2. A descriptive statistical summary regarding the soil. SE stands for standard error, SD stands for standard deviation, and var stands for sample variance.
VariableMeanSEMed.SD.Var.KurtosisSkewnessRangeMinimumMaximum
pH_H2O4.3500.0974.3530.4540.206−0.6910.1831.6403.5455.185
pH_KCl3.9530.1024.0050.4790.2300.102−0.1682.0052.8604.865
Ca3.4240.6572.4093.0809.4851.3861.47610.4060.38310.789
K0.3000.0450.2430.2120.045−0.5620.6730.6770.0610.738
Mg0.2500.0370.2230.1720.030−0.0700.9980.5550.0580.613
Na0.0370.0040.0350.0200.000−0.4510.7850.0640.0170.081
BEC4.0120.7253.0353.39911.5561.0971.37411.3870.52511.912
EA12.3672.5989.63212.184148.44013.5813.52756.6564.81461.470
CEC16.3782.73412.95912.822164.3959.1262.74857.8536.28364.136
BS22.7672.95522.04213.858192.056−0.4140.47749.3322.81352.145
N0.1820.0290.1370.1340.0185.8052.3790.5490.0800.629
OC3.2010.7702.0103.61313.0567.9822.87914.5611.18115.742
C:N13.8520.74512.9873.49312.2023.2211.82213.31210.20623.518
N2:C0.0110.0010.0100.0060.0000.9411.2600.0200.0050.025
Sand76.3643.36883.25015.799249.600−1.592−0.38044.50049.00093.500
Silt19.9322.86713.75013.447180.817−1.4950.42839.0005.50044.500
Clay3.7050.5173.0002.4235.873−1.7830.2496.5001.0007.500
Table 3. The relationship between soil quality and tree species relative density (a) and relative density and browsing intensity (b).
(a) Species Relative Density Predicted Using the Soil Quality Index
SpeciesExplanatory VariableEstimateStd. Errort ValuePr (>|t|)Adj. p ValueAdj. R2
A. pseudoplatanus(Intercept)144.1329.4344.8970.001 ***0.6247
Soil quality index−4.3281.03−4.2010.002 **0.012 *
F. sylvatica(Intercept)25.69424.461.050.3060.02297
Soil quality index1.1780.9641.2220.2361.000
S. aucuparia(Intercept)35.75643.2350.8270.56−0.4333
Soil quality index−1.4422.293−0.6290.6431.000
C. betulus(Intercept)12.84925.6020.5020.626−0.03806
Soil quality index0.6790.9080.7480.471.000
A. alba(Intercept)164.35891.1091.8040.1690.2315
Soil quality index−7.3794.969−1.4850.2341.000
(b) Browsing Intensity per Species per Transect Predicted Using Species Relative Density
A. pseudoplatanus(Intercept)−0.2390.538−0.4440.667
Species relative density0.1880.01611.6220.000 ***0.000 ***0.931
F. sylvatica(Intercept)2.1791.2271.7760.091 .
Species relative density0.0280.021.40.1770.8840.044
S. aucuparia(Intercept)0.0650.0213.0930.199
Species relative density0.0770.00245.090.014 *0.0710.999
C. betulus(Intercept)−1.5761.472−1.0710.307
Species relative density0.2220.0415.4240.000 ***0.001 ***0.703
A. alba(Intercept)0.5210.6520.7990.482
Species relative density0.0360.0152.3060.1040.5220.519
Significance codes: 0 ‘***’ 0.001 ‘**’ 0.01 ‘*’ 0.05 ‘.’ 0.1 ‘ ’ 1.
Table 4. Relationship between a relative density of tree species and mean BI for a given species in a transect.
SpeciesExplanatory VariableEstimateStd. Errort ValuePr (>|t|)Adj. p ValueAdj R2
A. pseudoplatanus(Intercept)0.1480.0344.3920.002 **
Species relative density0.0040.0013.7820.004 **0.021 *0.571
F. sylvatica(Intercept)0.120.0363.2930.004 **
Species relative density00.0010.6110.5481.000−0.031
S. aucuparia(Intercept)0.2030.002115.760.006 **
Species relative density−0.0020−12.340.0520.2570.987
C. betulus(Intercept)0.2090.063.4970.005 **
Species relative density0.0020.0021.050.3161.0000.008
A. alba(Intercept)0.4060.0795.1130.015 *
Species relative density−0.0050.002−2.4060.0950.4760.545
Significance codes: 0 ‘***’ 0.001 ‘**’ 0.01 ‘*’ 0.05 ‘.’ 0.1 ‘ ’ 1.
Table 5. Statistical summary of the relationship between soil quality index and mean twig dry mass of tree species m−2 (a) and between mean twig dry mass of tree species m−2 and browsing intensity on tree species (b).
(a) Total Twig Dry Mass of Tree Species (g) m−2 Explained by the Soil Quality Index
SpeciesExplanatory VariableEstimateStd. Errort ValuePr (>|t|)Adj. p ValueAdj. R2
A. pseudoplatanus(Intercept)2.4800.4495.5290.000 ***0.6923
Soil quality index−0.0760.016−4.8470.001 ***0.005 **
F. sylvatica(Intercept)0.2890.2711.0650.3000.2105
Soil quality index0.0270.0112.5690.018 *0.091
S. aucuparia(Intercept)0.5700.8160.6980.612−0.5718
Soil quality index−0.0230.043−0.5220.6941.000
C. betulus(Intercept)0.0720.0980.7290.481−0.0819
Soil quality index0.0010.0030.3030.7681.000
A. alba(Intercept)3.1971.8671.7120.1850.2006
Soil quality index−0.1440.102−1.4160.2521.000
(b) Browsing Intensity of Tree Species Explained by the Total Twig Dry Mass of Tree Species m−2
A. pseudoplatanus(Intercept)1.2211.4760.8270.4300.430
Twig dry mass (g) m−28.0352.7482.9240.017 *0.084
F. sylvatica(Intercept)−0.3621.434−0.2520.8030.279
Twig dry mass (g) m−24.2201.3983.0200.007 **0.034 *
S. aucuparia(Intercept)0.1140.0532.1490.2770.993
Twig dry mass (g) m−24.2720.24917.1850.037 *0.185
C. betulus(Intercept)−0.6461.215−0.5320.6050.741
Twig dry mass (g) m−260.33410.1415.9490.000 ***0.004 ***
A. alba(Intercept)0.6310.6920.9120.4290.429
Twig dry mass (g) m−21.6820.8402.0020.1390.695
Significance codes: 0 ‘***’ 0.001 ‘**’ 0.01 ‘*’ 0.05 ‘.’ 0.1 ‘ ’ 1.
Table 6. The relationship between soil quality index and browsing intensity of species per transect.
SpeciesExplanatory VariableEstimateStd. Errort ValuePr (>|t|)Adj. p ValuesAdj. R2
A. pseudoplatanus(Intercept)25.8456.4294.020.003 **
Soil quality index−0.7780.225−3.4580.007 **0.036 *0.523
F. sylvatica(Intercept)−0.7072.125−0.3320.743
Soil quality index0.1790.0842.1430.045 *0.027 *0.146
S. aucuparia(Intercept)2.753.3810.8130.565
Soil quality index−0.1070.179−0.5980.6571.000−0.473
C. betulus(Intercept)−0.0246.611−0.0040.997
Soil quality index0.1980.2340.8430.4171.000−0.025
A. alba(Intercept)7.1384.2841.6660.194
Soil quality index−0.3050.234−1.3040.2831.0000.149
Significance codes: 0 ‘***’ 0.001 ‘**’ 0.01 ‘*’ 0.05 ‘.’ 0.1 ‘ ’ 1.
Disclaimer/Publisher’s Note: The statements, opinions and data contained in all publications are solely those of the individual author(s) and contributor(s) and not of MDPI and/or the editor(s). MDPI and/or the editor(s) disclaim responsibility for any injury to people or property resulting from any ideas, methods, instructions or products referred to in the content.

