Article

Integrated Metabolome and Transcriptome Analyses Provide New Insights into the Leaf Color Changes in Osmanthus fragrans cv. ‘Wucaigui’

1
State Key Laboratory of Tree Genetics and Breeding, Nanjing Forestry University, Nanjing 210037, China
2
Co-Innovation Center for the Sustainable Forestry in Southern China, Nanjing Forestry University, Nanjing 210037, China
3
College of Landscape Architecture, Nanjing Forestry University, Nanjing 210037, China
4
College of Forestry and Grassland, College of Soil and Water Conservation, Nanjing Forestry University, Nanjing 210037, China
*
Author to whom correspondence should be addressed.
Forests 2024, 15(4), 709; https://doi.org/10.3390/f15040709
Submission received: 20 March 2024 / Revised: 13 April 2024 / Accepted: 15 April 2024 / Published: 17 April 2024
(This article belongs to the Section Genetics and Molecular Biology)

Abstract

:
Osmanthus fragrans, belonging to the family Oleaceae, is listed as one of the most important traditional ornamental plant species in China. A new cultivar O. fragrans ‘Wucaigui’ has a very diversified form in terms of leaf colors, in which the leaf color changes from red to yellow-green and finally to dark green. To understand the mechanisms involved in leaf color changes, metabolome and transcriptome studies were performed on leaves at different developmental stages. A total of 79 metabolites, two chlorophyll, 26 carotenoids, and 51 anthocyanins, were detected in the 6 different developmental stages. An orthogonal partial least squares discriminant analysis identified key metabolites at different developmental stages, including lutein, pelargonidin-3-O-(6-O-p-coumaroyl)-glucoside, neoxanthin, and α-carotene. A total of 48,837 genes were obtained by transcriptome sequencing, including 3295 novel genes. Using a weighted gene co-expression network analysis to study the correlations between key metabolites and differentially expressed genes, we determined the characteristic modules having the highest correlations with key metabolites and selected associated candidate genes. Five genes (OfSHOU4L, OfATL1B, OfUGE5 OfEIF1AX, and OfUGE3) were finally identified as hub genes using real-time fluorescence quantitative PCR. In addition, we proposed a model based on the changes in key metabolite contents and the network regulatory map during the changes in O. fragrans ‘Wucaigui’ leaf color. The positive regulation of OfUGE3 led to an increase in the lutein content, which resulted in the leaves changing from grayish brown to moderate brown; during the change from moderate brown to dark greenish-yellow, the positive regulation of three genes (OfHOU4L, OfATL1B, and OfUGE5) increased the content of pelargonidin-3-O-(6-O-p-coumaroyl)-glucoside and the red color of the leaves gradually faded to dark greenish-yellow and then to strong yellow-green; the positive regulation of OfEIF1AX increased the content of neoxanthin; the stages in which the color changed from strong yellow-green to yellow-green and then to moderate olive-green were positively regulated by OfUGE3, which resulted in higher α-carotene content. These findings provided new insights into the mechanisms underlying the processes involved in O. fragrans ‘Wucaigui’ leaf color changes at the metabolic and transcriptional levels. This work seeks to contribute to the development of artificial regulate and control technology in the breeding and production of O. fragrans and other ornamental plants.

1. Introduction

As people continue pursuing a better living environment, more plants have been used in the landscaping industry. Ornamental plants with colored leaves have attracted much more attention, owing to their visual appeal [1]. In these plants, the leaves show non-green colors during the entire growing season or at a certain stage of the growing season [2]. Leaf color variation is a common phenomenon in nature that is regulated by both the external environment and heredity. Plant leaves can show different colors in different seasons and they can be divided into three categories based on these changes: the categories are plants with spring leaves, plants with autumn leaves, and plants with normal leaves [3,4]. In plant breeding, leaf color changes can be used as both a marker and an ornamental element to cultivate a variety of colorful plants.
The study of leaf color changes in ornamental plants is one of the most concentrated topics in the horticulture research field. Changes in the type, content, and proportion of the pigments in plant leaves are important causes of changes in leaf color [5]. The pigments in plant leaves mainly include chlorophyll, carotenoids, and anthocyanins [6,7,8]. Chlorophyll is mainly composed of chlorophyll a and chlorophyll b, which play important roles in plant photosynthesis [9,10]. Carotenoids mainly include carotene and lutein, which are yellow pigments. When the carotenoid content is higher than the chlorophyll content, the leaves appear yellow, whereas when the chlorophyll content is higher than the carotenoid content, the leaves appear green [11]. Anthocyanins are a class of water-soluble natural pigments that are mainly found in leaves, petals, and fruits, making these organs blue, purple, or red [12]. Thus, it is very important to determine the contents and types of pigments in leaves to understand leaf color changes in colored plants.
With the rapid development of biotechnology, more and more plant research is involved in molecular biology. Modern biotechnology has been widely used in studying plant pigments, especially in terms of leaf color changes. For example, through the transcriptome sequencing of two different colored leaves (gold and green) of Ginkgo biloba, key genes related to chloroplast development and pigment synthesis were identified [13]. The transcriptomic sequencing of the different leaf colors of Acer mandshuricum was used to analyze the anthocyanin biosynthesis pathway and revealed the mechanisms involved in the A. mandshuricum leaf color [14]. Transcriptome sequencing has been performed on green and colored leaves from the same Osmanthus fragrans plant and, combined with a physiological index analysis, some key genes were identified, which provided insights into the causes of leaf color changes [15]. In addition to transcriptomics, leaf color metabolomics studies have been undertaken. A total of 118 compounds have been identified by the determination of metabolites, including 13 flavonoids (flavonols and isoflavones) in the green and red-purple leaves of Fraxinus angustifolia [16]. In poplar, an analysis of leaf color at different periods identified 273 metabolites, including anthocyanins, flavonoids, flavonols, flavanones, proanthocyanidins, isoflavones, and polyphenols, with the flavonoids related to leaf color being dominant [17]. At present, there are few reports concentrated on the transcriptome and metabolomics of colorful O. fragrans; therefore, it is necessary to study the mechanisms of leaf color changes in this plant species at the multi-omics level.
Osmanthus fragrans, one of the most famous traditional flower plants, has a cultivation history of more than 2000 years in China [18,19]. Owing to natural hybridization, artificial selection, and environmental influences, many characteristics of O. fragrans have mutated, resulting in abundant varietal resources. The ‘Colorful Laurel’ is one of five varietal groups, along with the ‘Golden Laurel’, ‘Silver Laurel’, ‘Red Laurel’, and ‘Four seasons Laurel’ [20]. The O. fragrans colored leaf group is characterized by the distinct color variation in the branches or leaves that can be maintained for more than half or throughout the entire year, with stable morphology and consistent characteristics, resulting in its high ornamental value. We previously conducted transcriptome sequencing on the leaves of O. fragrans ‘Yinbi Shuanghui’ during different periods and identified some important genes [15]. However, the variety and contents of metabolites involved in the processes of color changes of colorful O. fragrans leaves are still unclear. Therefore, in this study, the leaves of O. fragrans ‘Wucaigui’ at different developmental stages were used as materials, and the transcriptome and metabolome were jointly analyzed to identify key genes regulating leaf color changes. This study can provide references for further research on plant leaf color changes.

2. Materials and Methods

2.1. Plant Materials

The plant material O. fragrans ‘Wucaigui’ is a mutant variety of O. fragrans var. thunbergia. Among all the O. fragrans we observed, it has a unique characteristic, which is a long period of leaf color changes. The plants were 5 years old and grown inside a semi-closed greenhouse in Liyang, China (31°43′ N, 119°48′ E). Phenological observations revealed that new leaves of O. fragrans ‘Wucaigui’ changed from red to yellow-green and finally to completely green (Figure 1). The Royal Horticultural Society (RHS) Color Card was used to compare the leaves at six stages (S). These were S1 (grayish-brown RHS 166A), S2 (moderate brown RHS 165A), S3 (dark greenish-yellow RHS 152C), S4 (strong yellow-green RHS) 144B), S5 (yellow-green RHS 143B), and S6 (moderate olive-green RHS 137B). The sampling dates were 25th (S1) of March; 05th (S2), 15th (S3), and 25th (S4) of April; and 05th (S5) and 15th (S6) of May 2022. Leaves with the same growth pattern were all collected at 10:00. Leaf samples from each stage were collected, immediately frozen in liquid nitrogen for 5 min, and then stored in an ultra-low temperature refrigerator for metabolite and transcriptome determination.

2.2. Chlorophyll Extraction and Determination

The extraction and determination of chlorophyll were performed using previously described methods [21]. Briefly, leaves stored in the ultra-low temperature refrigerator were ground into powder, and 0.2 g of powder was weighed and placed into a 10-mL centrifuge tube. A 10-mL mixture of acetone and ethanol (volume ratio of 1:1) was then added and the samples were placed in the dark at room temperature for 24 h until the leaves became completely white. Afterwards, samples were transferred to the comparator dish. A 10-mL mixture of acetone and ethanol without a sample (volume ratio of 1:1) was used as a control. A spectrophotometer was used to determine the absorbance at different wavelengths (470, 663, and 645 nm) and the contents of chlorophyll a and chlorophyll b were calculated.

2.3. Carotenoid Extraction and Determination

The samples stored in the ultra-low temperature refrigerator were removed and ground to a powder using a ball mill (30 Hz, 1 min). Then, 50 mg of the ground sample was accurately weighed and 0.5 mL of a solution containing 0.01% BHT (n-hexane:acetone:ethanol = 1:1:1, v/v/v) was added to extract the carotenoids. After swirling at room temperature for 20 min, the samples were centrifuged at 4 °C for 5 min and the supernatants were kept. The extracted solutions were concentrated and redissolved in 100 μL of solution (methanol:methyl tert-butyl ether = 1:1, v/v), filtered through a 0.22-μm membrane, and stored in a brown vial for liquid chromatography (LC) and tandem mass spectrometry (MS/MS) analysis.
The data acquisition instrument system mainly included an ultra-high performance (UP) LC-MS/MS. The column of the UPLC was YMC C30 (3 μm, 100 mm × 2 mm). The mobile phase consisted of phase A (methanol/acetonitrile (1:3, v/v) with 0.01% BHT and 0.1% formic acid) and phase B (methyl tert-butyl ether with 0.01% BHT). The gradient elution procedure was as follows: A:B was 100:0 (v/v) at 0 min, 100:0 (v/v) at 3 min, 30:70 (v/v)at 5 min, 5:95 (v/v) at 9 min, 100:0 (v/v) at 10 min, and 100:0 (v/v) at 11 min. The sample size was 2 μL, the column temperature was 28 °C, and the flow rate was 0.8 mL/min. The mass spectrum conditions mainly included the following: atmospheric pressure chemical ionization source temperature 350 °C and curtain gas 25 psi. In Q-Trap 6500+, each ion pair was scanned against an optimized de-clustering potential and collision energy.
The collected data were analyzed quantitatively and qualitatively. The quantitative analysis was performed using multiple reaction monitoring by triple quadrupole mass spectrometry. A Metware database was constructed based on standard products and a qualitative analysis of mass spectrometry data was performed.

2.4. Anthocyanin Extraction and Determination

The extraction method used was similar to that for carotenoids. After grinding the sample into a powder, 50 mg was accurately weighed and dissolved in 500 μL extraction solution (50% methanol aqueous solution, containing 0.1% hydrochloric acid), swirled for 5 min, exposed to ultrasound for 5 min, and then centrifuged for 3 min (12,000 rpm, 4 °C). The supernatants were taken and filtered through a 0.22-μm membrane. They were then stored in sample vials for LC-MS/MS analyses.
The data acquisition instrument system included an UPLC-MS/MS. The UPLC column was an ACQUITY BEH C18 (1.7 μm, 100 mm × 2.1 mm). The mobile phase included phase A (ultra-pure water with 0.1% formic acid added) and phase B (methanol with 0.1% formic acid added). The gradient elution procedure was as follows: A:B was 19:1 (v/v) at 0 min, 1:1 (v/v) at 6 min, 1:19 (v/v) at 12 min, and 19:1 (v/v) at 14 min, followed by a 2-min hold. The sample size was 2 μL, the column temperature was 40 °C, and the flow rate was 0.35 mL/min. The mass spectrum conditions mainly included: electrospray ionization temperature of 550 °C, mass spectrum voltage of 5500 V in positive ion mode, and curtain gas 35 psi. In Q-Trap 6500+, each ion pair was scanned against an optimized de-clustering potential and collision energy.
The collected data were analyzed quantitatively and qualitatively. The quantitative analysis was performed using multiple reaction monitoring by triple quadrupole mass spectrometry. A Metware database was constructed based on standard products and a qualitative analysis of mass spectrometry data was performed.

2.5. Transcriptome Sequencing, Assembly, and Analysis

Total RNA was extracted from six different developmental stages of O. fragrans ‘Wucaigui’ leaves using an RNA purification kit (Tiangen Biotech Co., Beijing, China) and three biological replicates were used for each stage. RNA integrity was verified by ribonuclease-free agarose gel electrophoresis and concentrations were determined using a NanoDrop 2000 spectrophotometer (Thermo Scientific, Waltham, MA, USA). After the obtained RNA was reverse-transcribed into cDNA, a cDNA library was constructed using three RNA samples and sequenced using Illumina Novaseq 6000 by Gene Denovo Biotech Co. (Guangzhou, China). The adapter sequences were removed from the original reads, and fastp 0.18.0 version (https://github.com/OpenGene/fastp, accessed on 1 December 2023) was used on each data set to delete low-quality reads (mass fraction in the following 10 bp of more than 40% and/or an unknown bp of more than 10%) to obtain more accurate results. All the final reads were clean and of high quality. A HISAT 2.2.4 (https://daehwankimlab.github.io/hisat2/, accessed on 1 December 2023) was used to map the ends of paired reads to the reference genome. Mapped reads were assembled using String Tie version 1.3.1 (http://ccb.jhu.edu/software/stringtie/, accessed on 1 December 2023) [22,23]. Based on the number of unique mapping reads, the gene expression levels were measured using the exon model per kilobase fragment per million mapping fragments to eliminate the influence of different gene lengths and sequencing differences on gene expression calculations [24,25]. Transcripts with a fold change > 2 and false discovery rate (FDR) < 0.05 were considered to be differentially expressed during plant development [26]. The transcriptome data have been uploaded to the NCBI Sequence Read Archive under accession number PRJNA 1088424.

2.6. Screening of Hub Genes

All the sequences were compared with the Gene Ontology (GO) and Kyoto Encyclopedia of Genes and Genomes (KEGG) databases, with the threshold set to E-value < 1 × 10⁻⁵, to obtain gene-function-related information [27,28,29,30]. Subsequently, the measured metabolome data (chlorophyll, carotenoids, and anthocyanins) and differentially expressed genes (DEGs) were used for a weighted gene co-expression network analysis (WGCNA). Genes with similar expression patterns were put into the same module and a cluster tree was constructed according to gene expression levels and module correlations. We determined the feature modules of interest and calculated the feature module values (MM > 0.9) and gene significance values (GS > 0.5) to identify hub genes.

2.7. Real-Time Fluorescence Quantitative PCR (qRT-PCR) Was Used to Verify Gene Expression

The selected key genes were verified using qRT-PCR and primer 5 software was used to design PCR primers (Table S2). OfRAN was selected as the internal reference gene [31]. The RNA extracted from the leaves of O. fragrans ‘Wucaigui’ was reverse-transcribed into cDNA using SuperMix (Transgen, Beijing, China) and diluted 20 times for gene expression tests. An SYBR Premix Ex Taq (Takara Biotechnology, Najing, China) qRT-PCR assay kit was used. The reaction program was as follows: 95 °C for 3 min, then 40 cycles of 95 °C for 5 s, and 60 °C for 30 s. The relative gene expression was calculated using the 2−∆∆Ct comparative Ct method.

2.8. Data Analyses

Three biological replicates were used for each sample. SPSS 22.0 software was used for data analyses. The metabolome data of O. fragrans ‘Wucaigui’ leaves at different developmental stages were analyzed using an orthogonal partial least squares discriminant analysis (OPLS-DA) with SIMCA 14.1 software.

3. Results

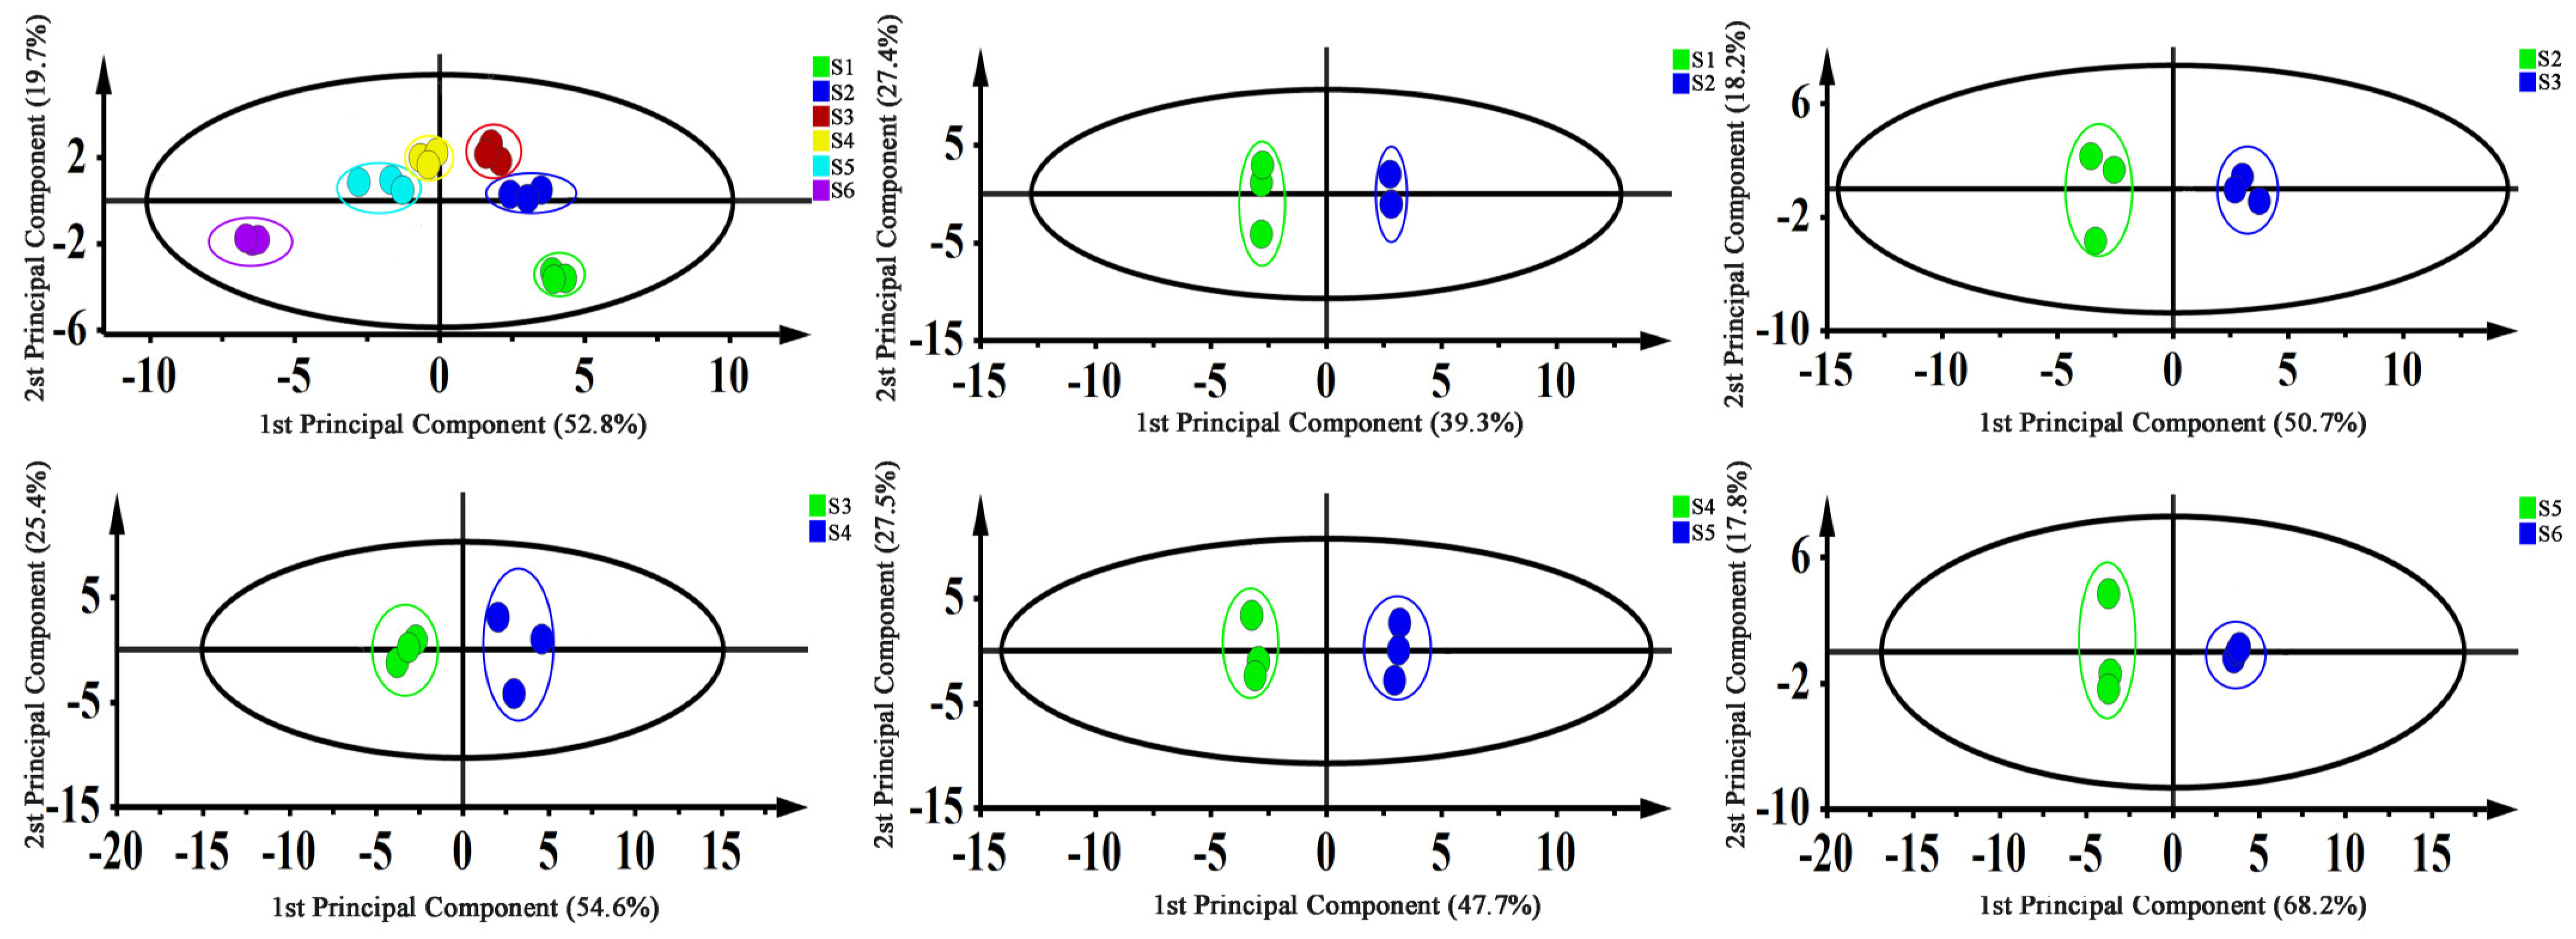
3.1. Metabolome Responses of Leaves at Different Developmental Stages

The O. fragrans ‘Wucaigui’ leaf metabolites, including chlorophyll, carotenoids, and anthocyanins, were determined at different developmental stages. In the process of the leaves changing from red to yellow-green and finally, to dark green, the chlorophyll a and chlorophyll b contents showed rising trends and reached their highest values of 1691.9 μg/g and 642.5 μg/g, respectively, at S6 (Table 1). In total, 26 kinds of carotenoid metabolites showing different change trends during the leaf color-change process were identified (Table 2). When the leaf color was red (S1, S2), the contents of zeaxanthin and lutein were the highest at 78.648 μg/g and 252.6781 μg/g, respectively. When the leaves turned green (S5, S6), the contents of α-carotene, β-carotene, and lutein were the highest at 118.6902 μg/g, 144.4781 μg/g, and 871.3145 μg/g, respectively. The content of lutein remained high throughout the leaf color-change period, suggesting that this substance is a key metabolite. In addition, there were 13 substances with very low contents of less than 0.1 μg/g in the six stages.
Furthermore, 51 anthocyanin metabolites were identified (Table 3). When the leaves were red (S1) and green (S6), the contents of rutin were the highest, reaching 756.2563 μg/g and 343.7775 μg/g, respectively, and its content was higher than those of the other anthocyanins during the whole leaf color-change process. In total, 32 of the anthocyanins had contents lower than 0.1 μg/g.

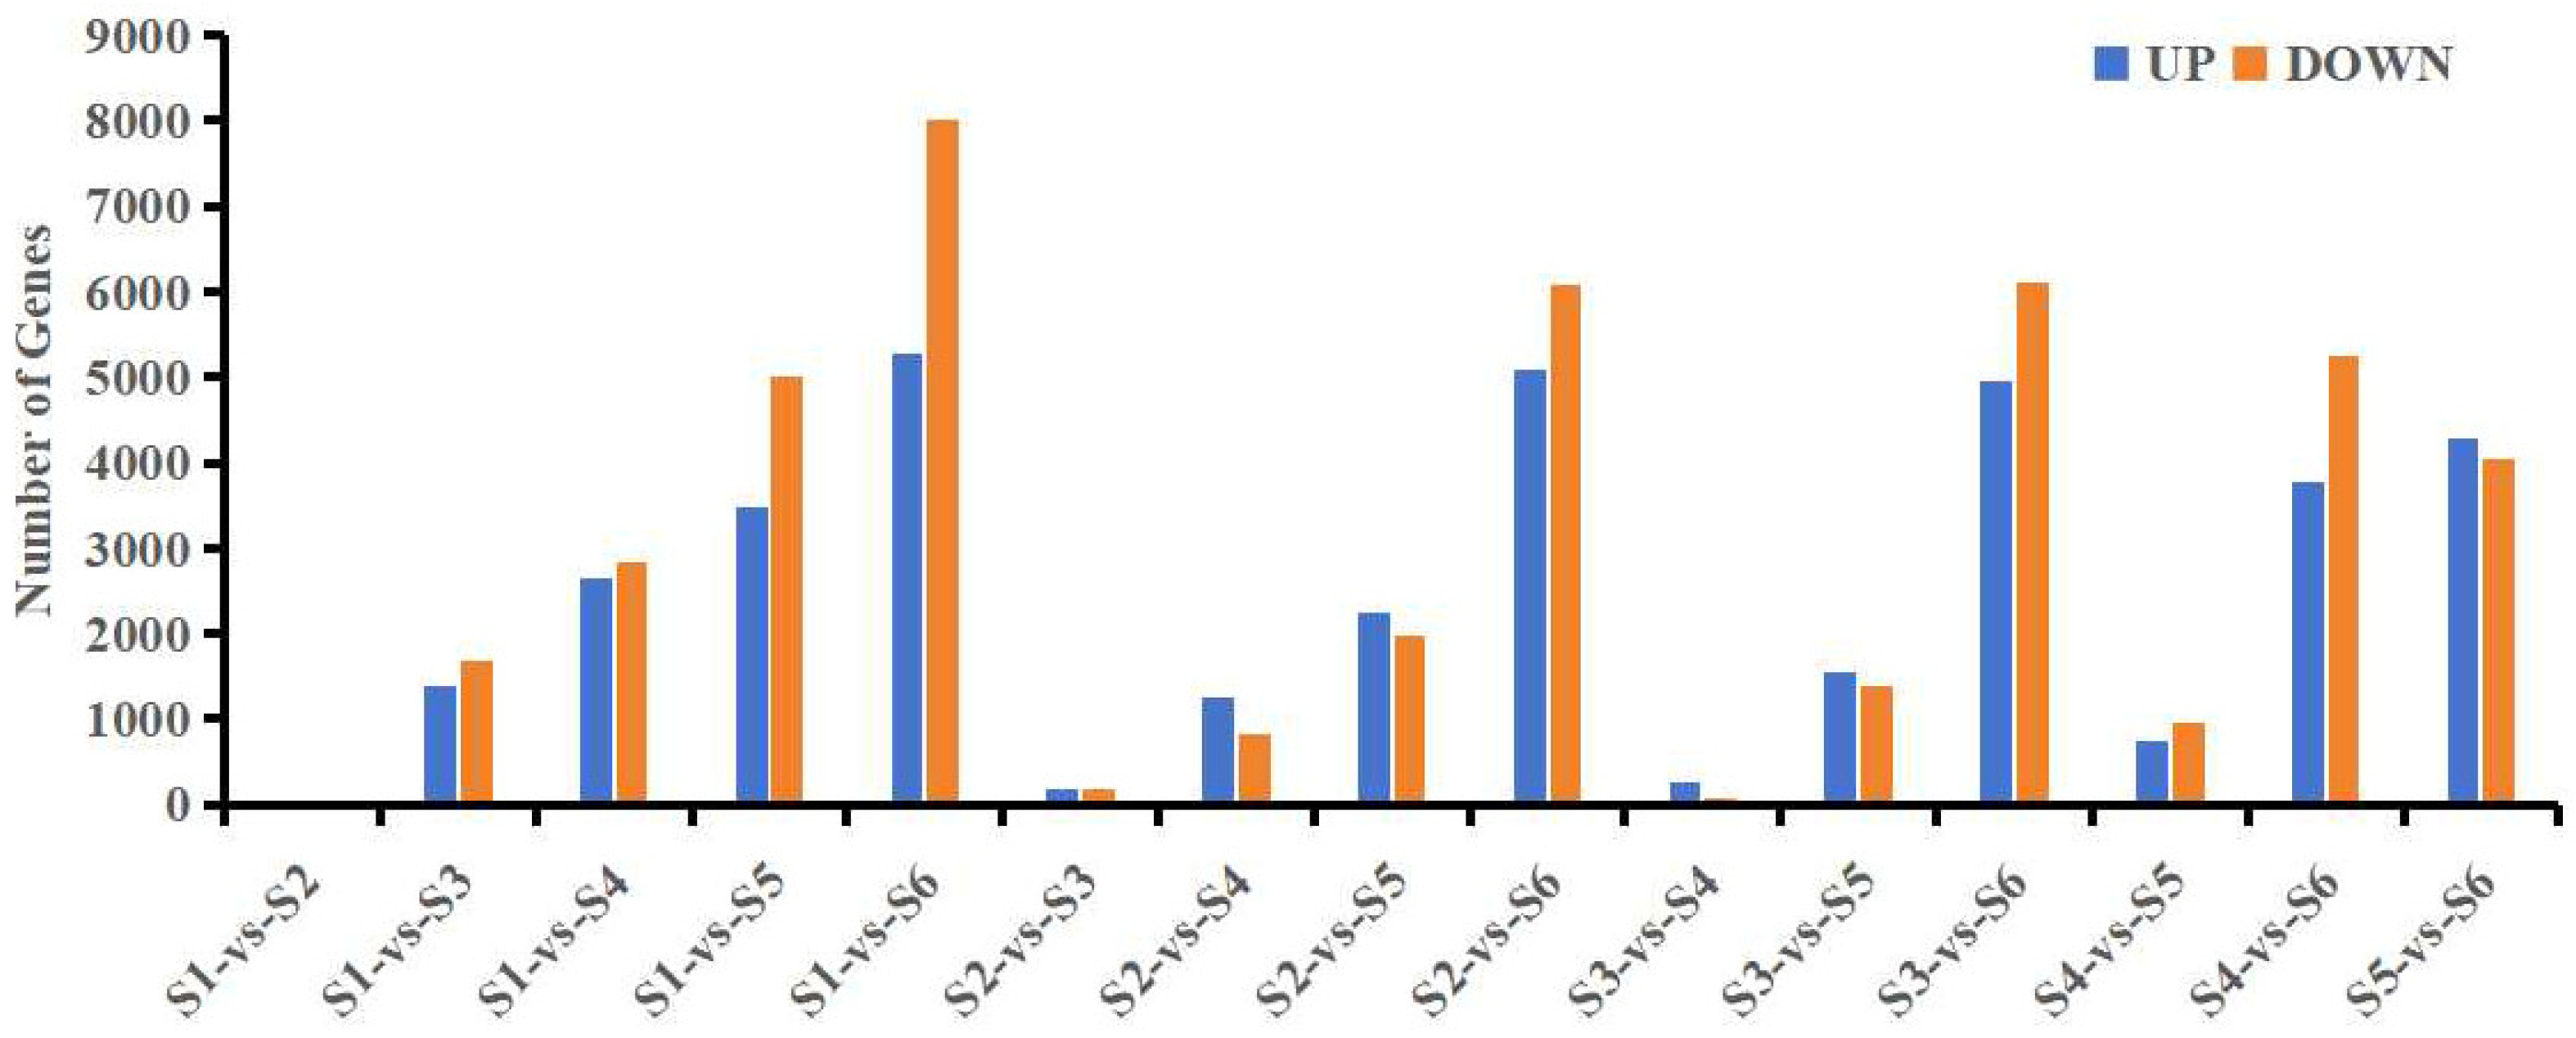
3.2. Transcriptome Analysis of Leaves at Different Developmental Stages

Transcriptome sequencing was performed at different developmental stages of O. fragrans ‘Wucaigui’ leaves. In total, 156,842,293,200 raw reads were obtained, with 155,491,097,578 clean readings remaining after quality control. The GC content of 18 samples was greater than 43%, the Q20 content was greater than 96%, and the Q30 content was greater than 90% (Table 4). In total, 48,837 genes were obtained. After comparison with the previously published genetic data of O. fragrans, 3295 genes were determined to be novel. To investigate the DEGs, pairwise comparisons were made at different stages of leaf development (Figure 2).
In total, 48 up-regulated genes and 28 down-regulated genes were found in S1 vs. S2. There were 1399 up-regulated and 1671 down-regulated genes in S1 vs. S3. There were 2643 up-regulated and 2847 down-regulated genes in S1 vs. S4. There were 3491 up-regulated and 4999 down-regulated genes in S1 vs. S5. There were 5267 up-regulated and 8014 down-regulated genes in S1 vs. S6. There were 188 up-regulated and 178 down-regulated genes in S2 vs. S3. There were 1244 up-regulated and 835 down-regulated genes in S2 vs. S4. There were 2258 up-regulated and 1977 down-regulated genes in S2 vs. S5. There were 5083 up-regulated and 6074 down-regulated genes in S2 vs. S6. There were 264 up-regulated and 84 down-regulated genes in S3 vs. S4. There were 1549 up-regulated and 1398 down-regulated genes in S3 vs. S5. There were 4953 up-regulated genes and 6100 down-regulated genes in S3 vs. S6. There were 757 up-regulated and 955 down-regulated genes in S4 vs. S5. There were 3774 up-regulated and 5240 down-regulated genes in S4 vs. S6. There were 4292 up-regulated and 4036 down-regulated genes in S5 vs. S6.

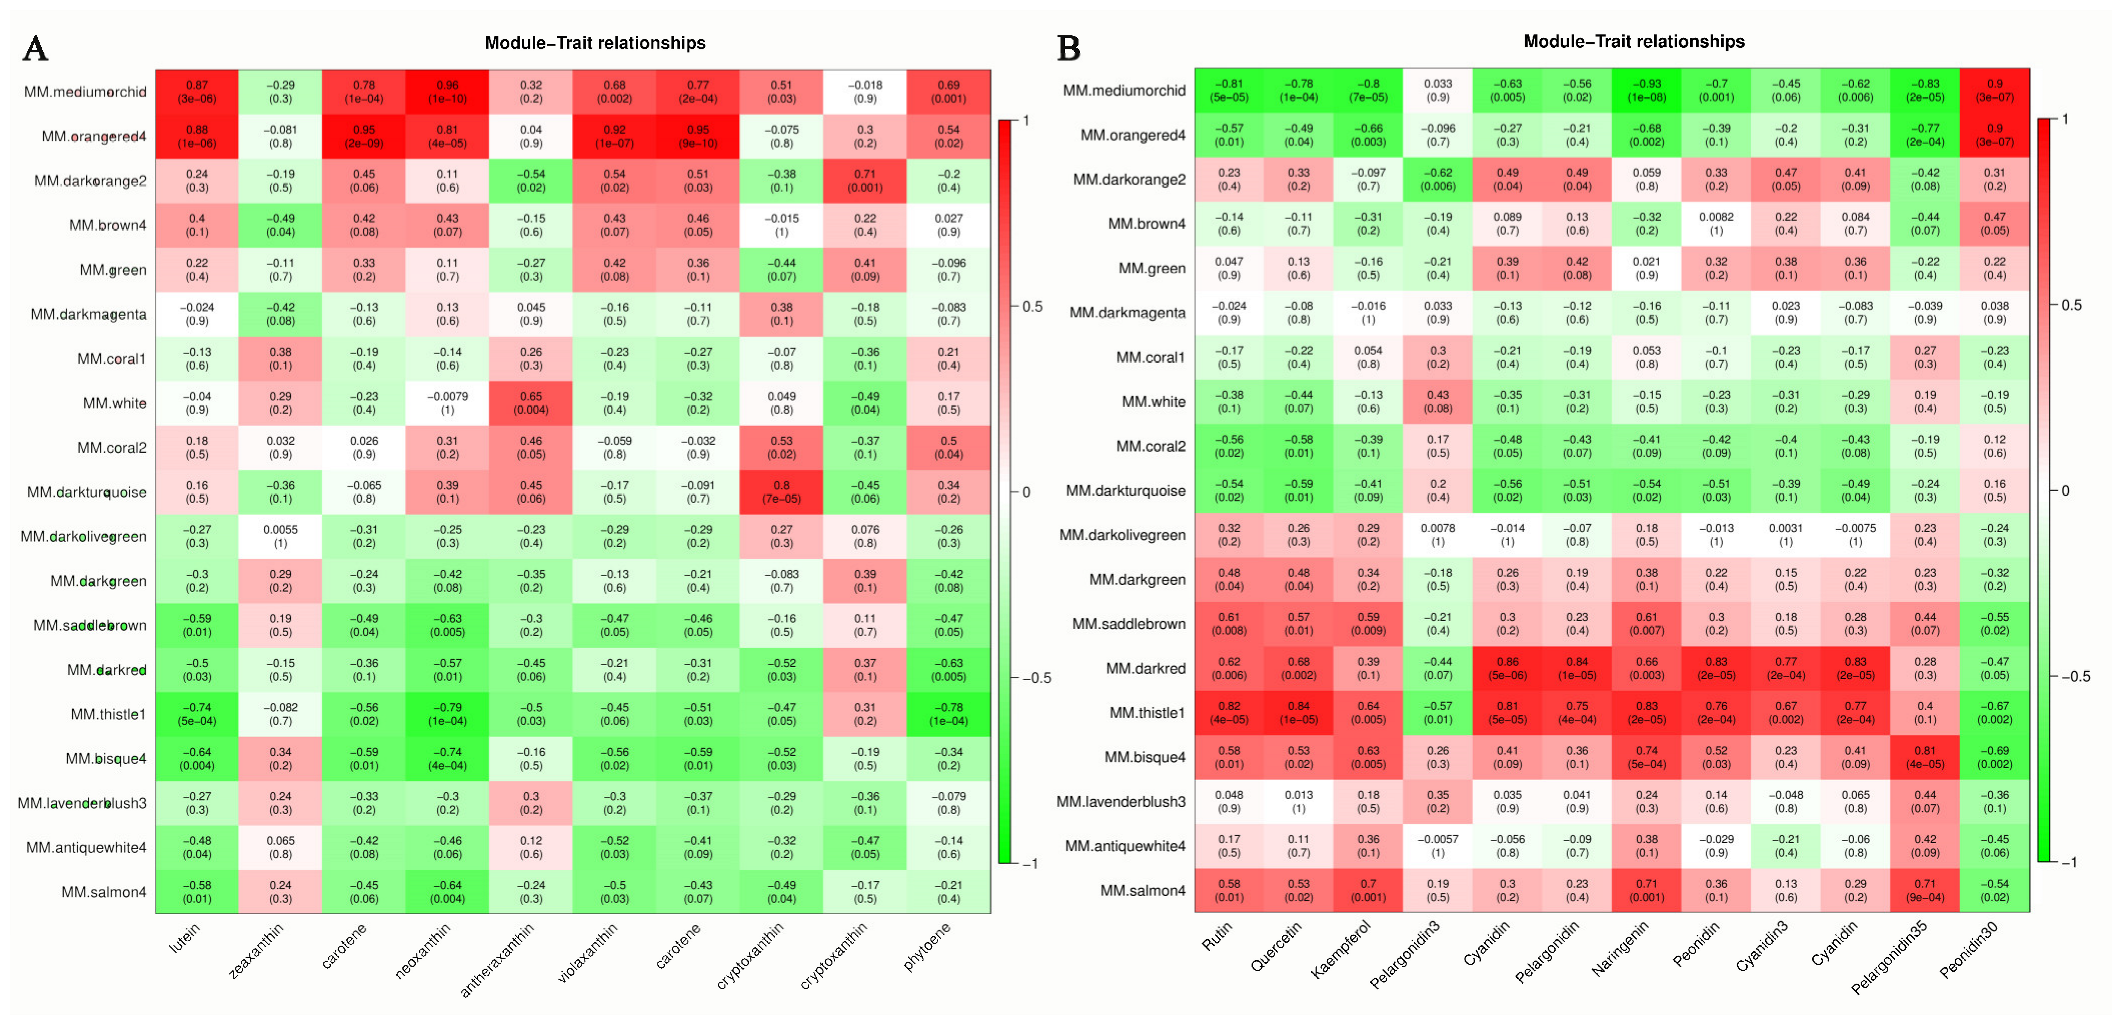
3.3. Key Metabolites in the Leaf Color-Change Process

To further determine the key metabolites of O. fragrans ‘Wucaigui’ involved in the process of color changes, 24 metabolites, two chlorophylls, 10 carotenoids, and 12 anthocyanins, with relatively high contents were selected on the basis of the metabolome data. The OPLS-DA showed (Figure 3) that the six stages were completely separated and the three biological replicates were clustered together, indicating that the data were reliable. Different stages were subjected to pair-wise comparisons and the key metabolic substances in different developmental stages were determined using the VIP value. Among them, lutein was the most important metabolic substance in S1 vs. S2 and pelargonidin-3-O-(6-O-p-coumaroyl)-glucoside was the most important metabolic substance in S2 vs. S3. In S3 vs. S4, neoxanthin was the most important metabolite, whereas in S4 vs. S5 and S5 vs. S6, α-carotene was the most important metabolic substance (Table S1).

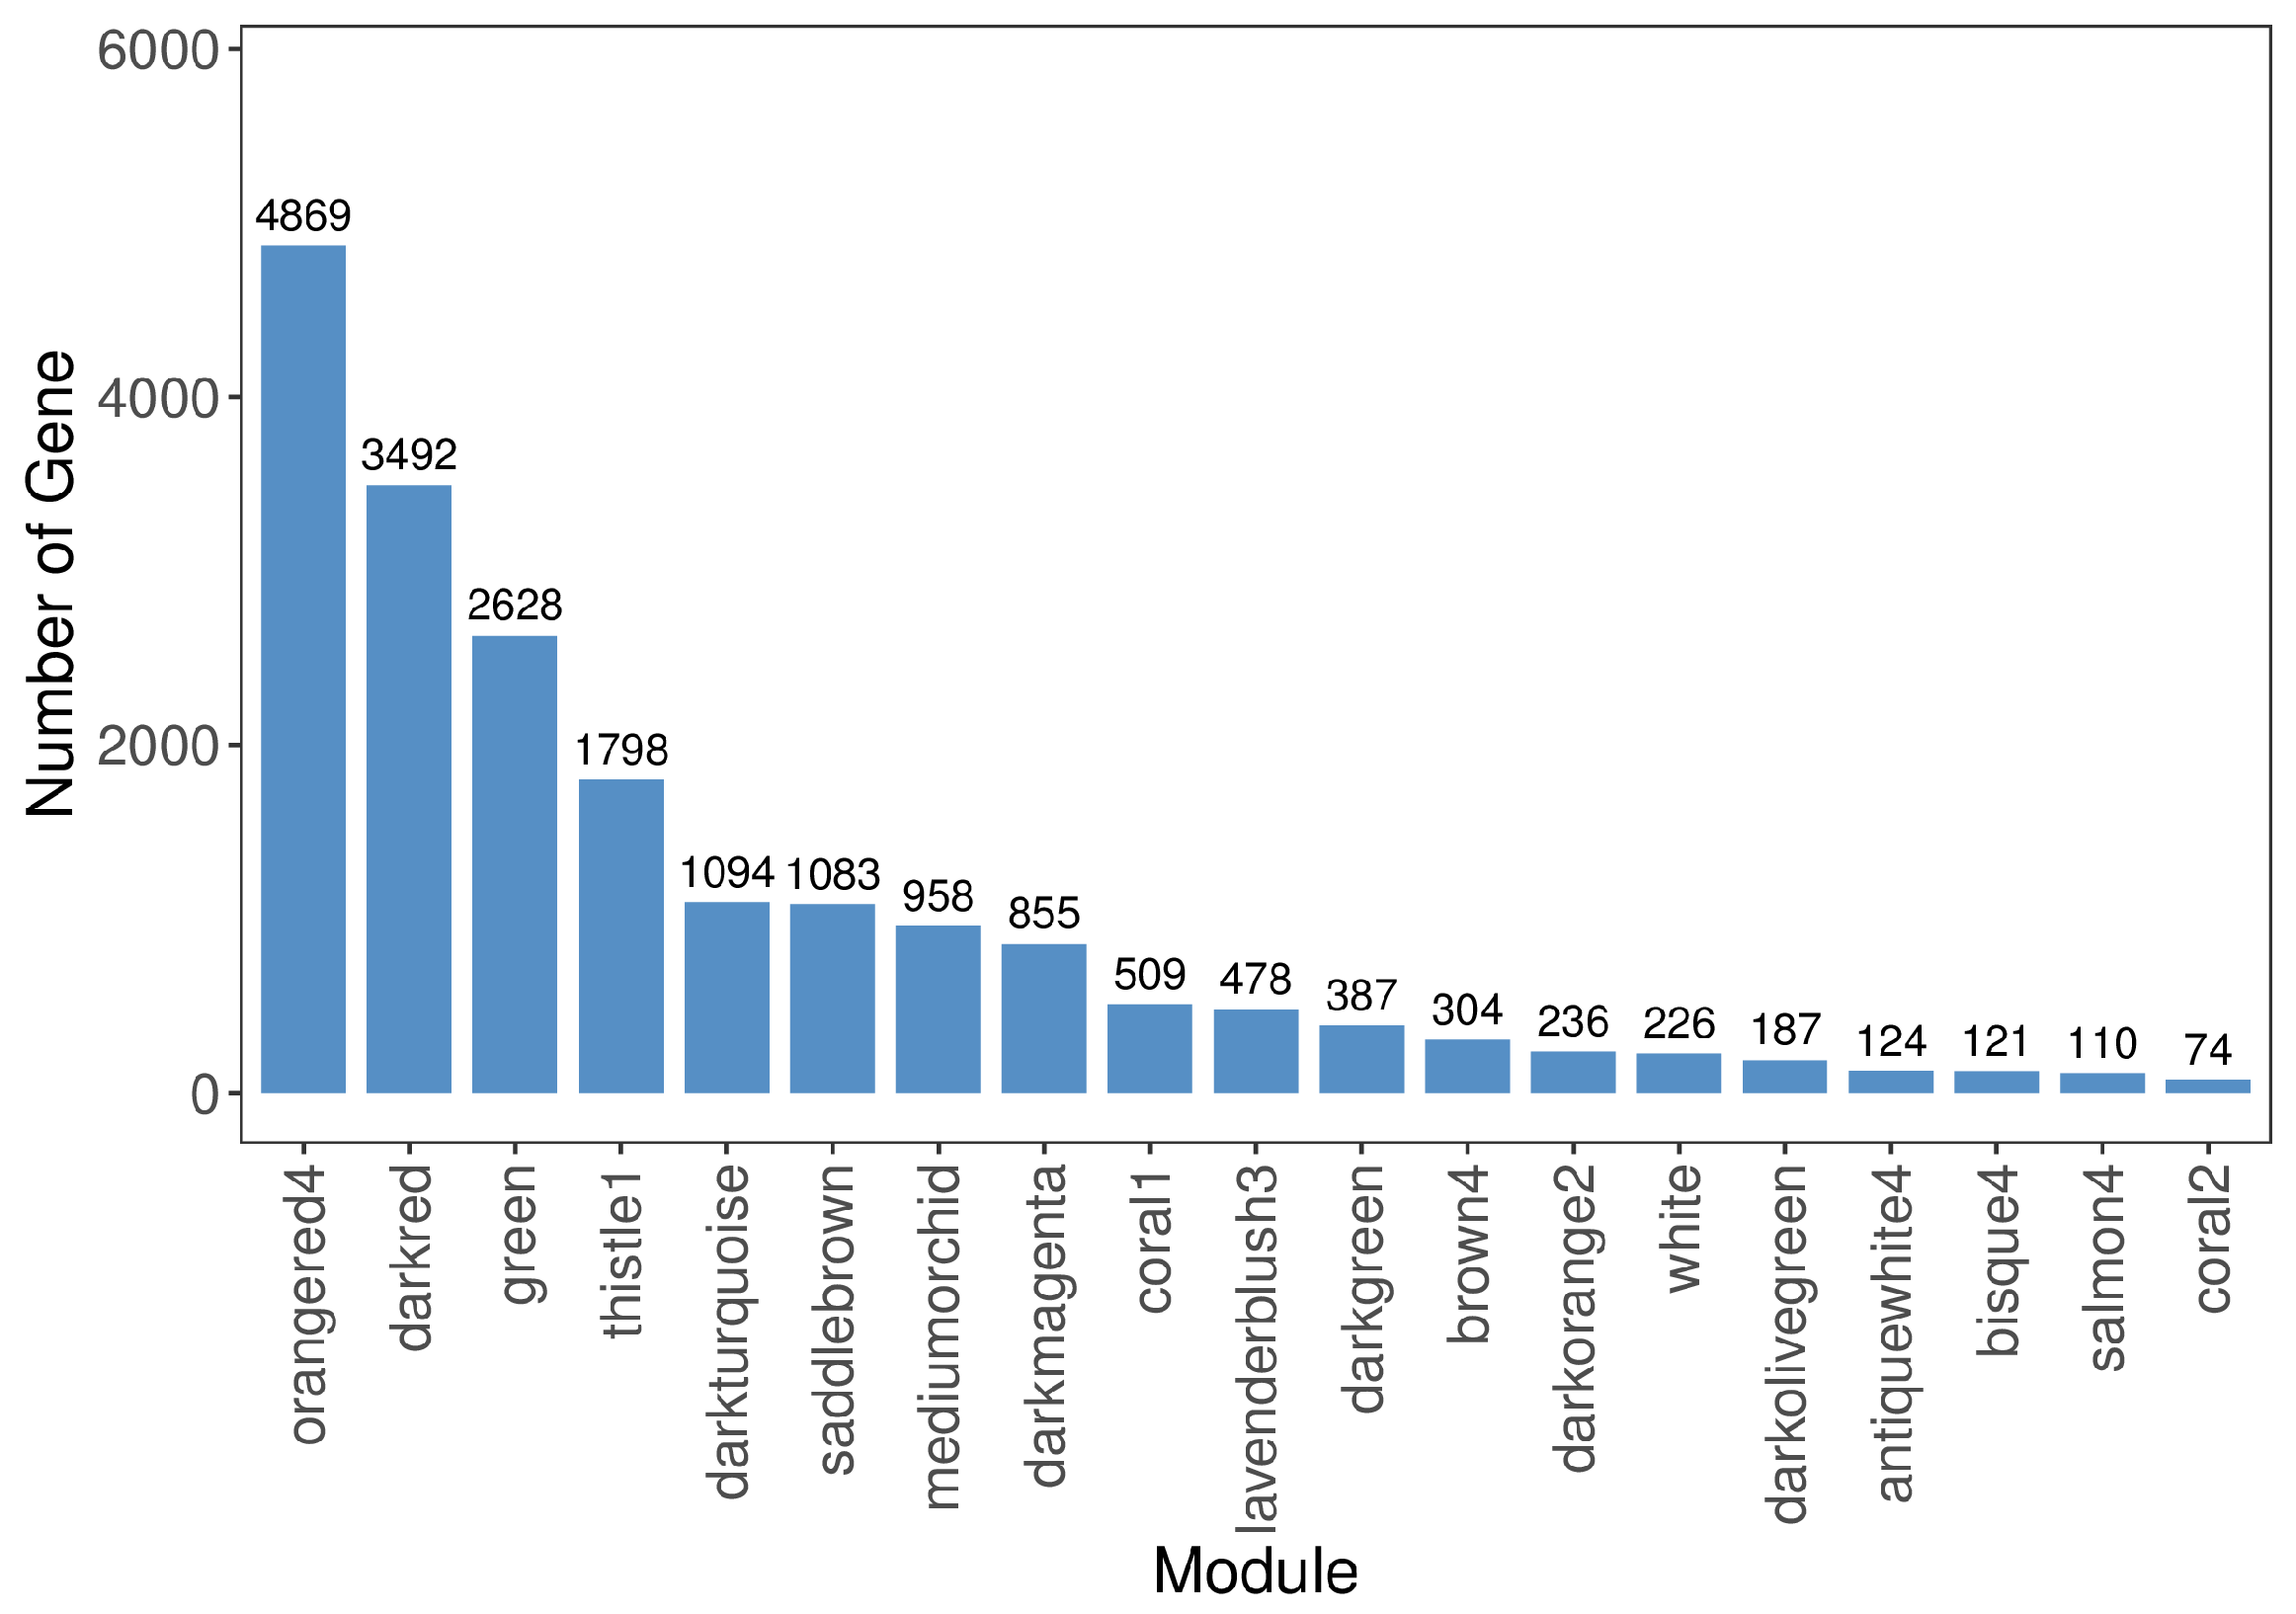
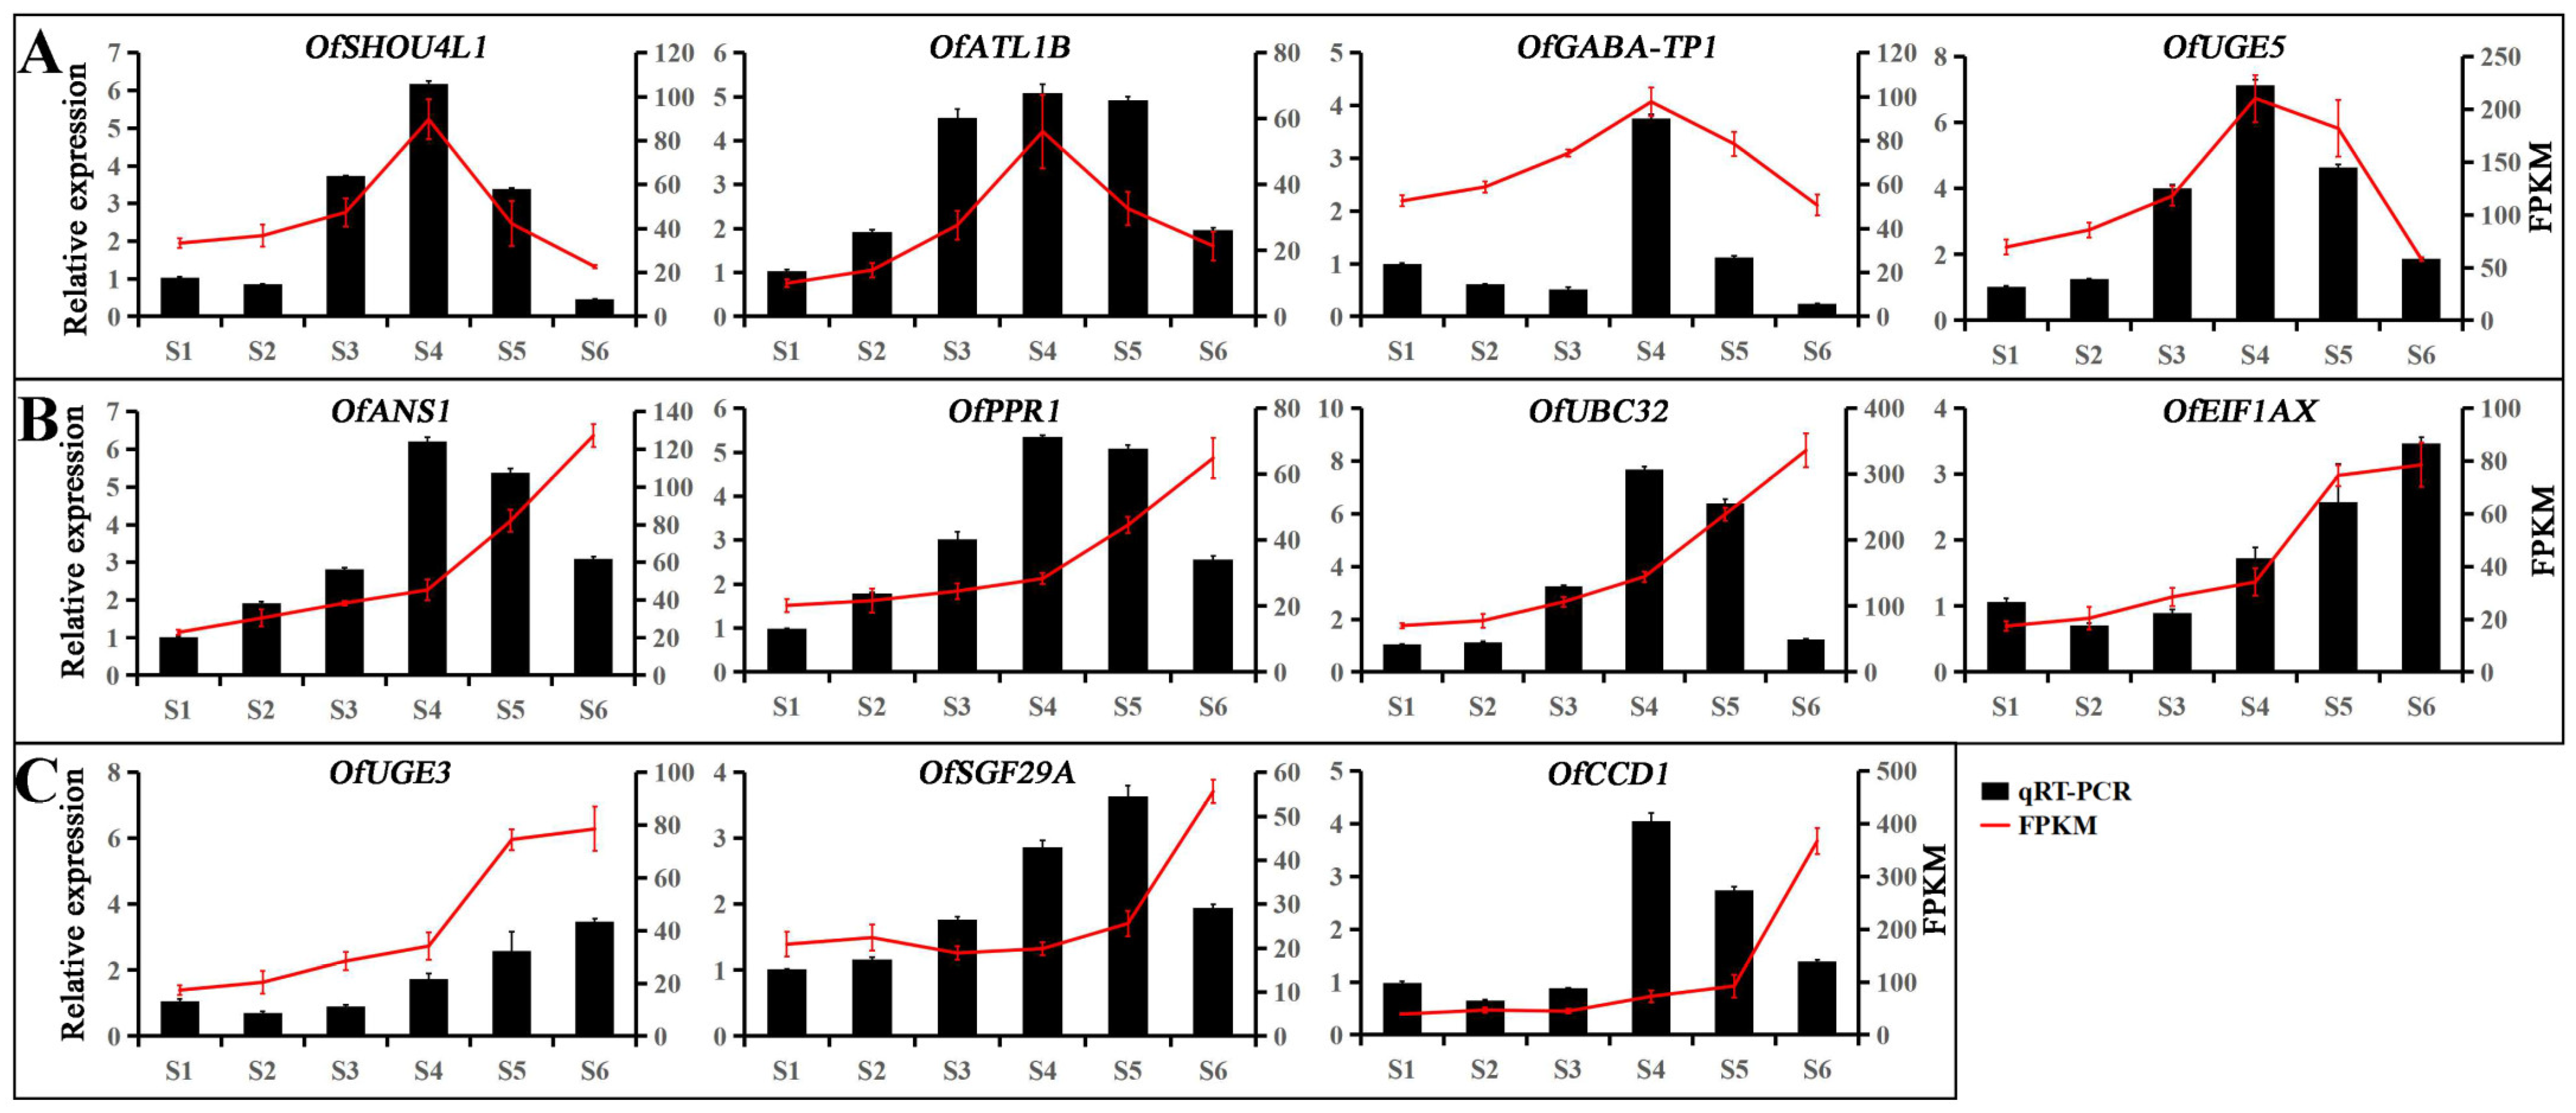
3.4. Hub Genes in the Leaf Color-Change Process

Theoretically, processes of leaf color changes are regulated by genes. To identify the hub genes regulating leaf color changes at different developmental stages in O. fragrans ‘Wucaigui’, we performed WGCNA on transcriptome data and 24 high-content metabolites. Based on the weight values, 19 co-expression modules were obtained, each containing a certain number of genes (Figure 4 and Figure 5), among which the module ‘orangered 4’ had the highest number of genes (4869), the module ‘darkred’ followed with 3492, and the module ‘coral 2’ had the lowest number of genes (74). First, the up-regulated characteristic module ‘orangered 4’, corresponding to lutein, was identified as containing the key gene with an MM > 0.9, which was consistent with the expression trend of metabolic data. Similarly, metabolites pelargonidin-3-O-(6-O-p-coumaroyl)-glucoside were identified. Candidate genes in up-regulated signature modules (‘white’, ‘mediumorchid’, and ‘orangered 4’) were associated with neoxanthin and ɑ-carotene. Finally, 11 candidate genes were selected, with 3, 4, and 4 being in the modules ‘orangered 4’, ‘mediumorchid’, and ‘white’, respectively.

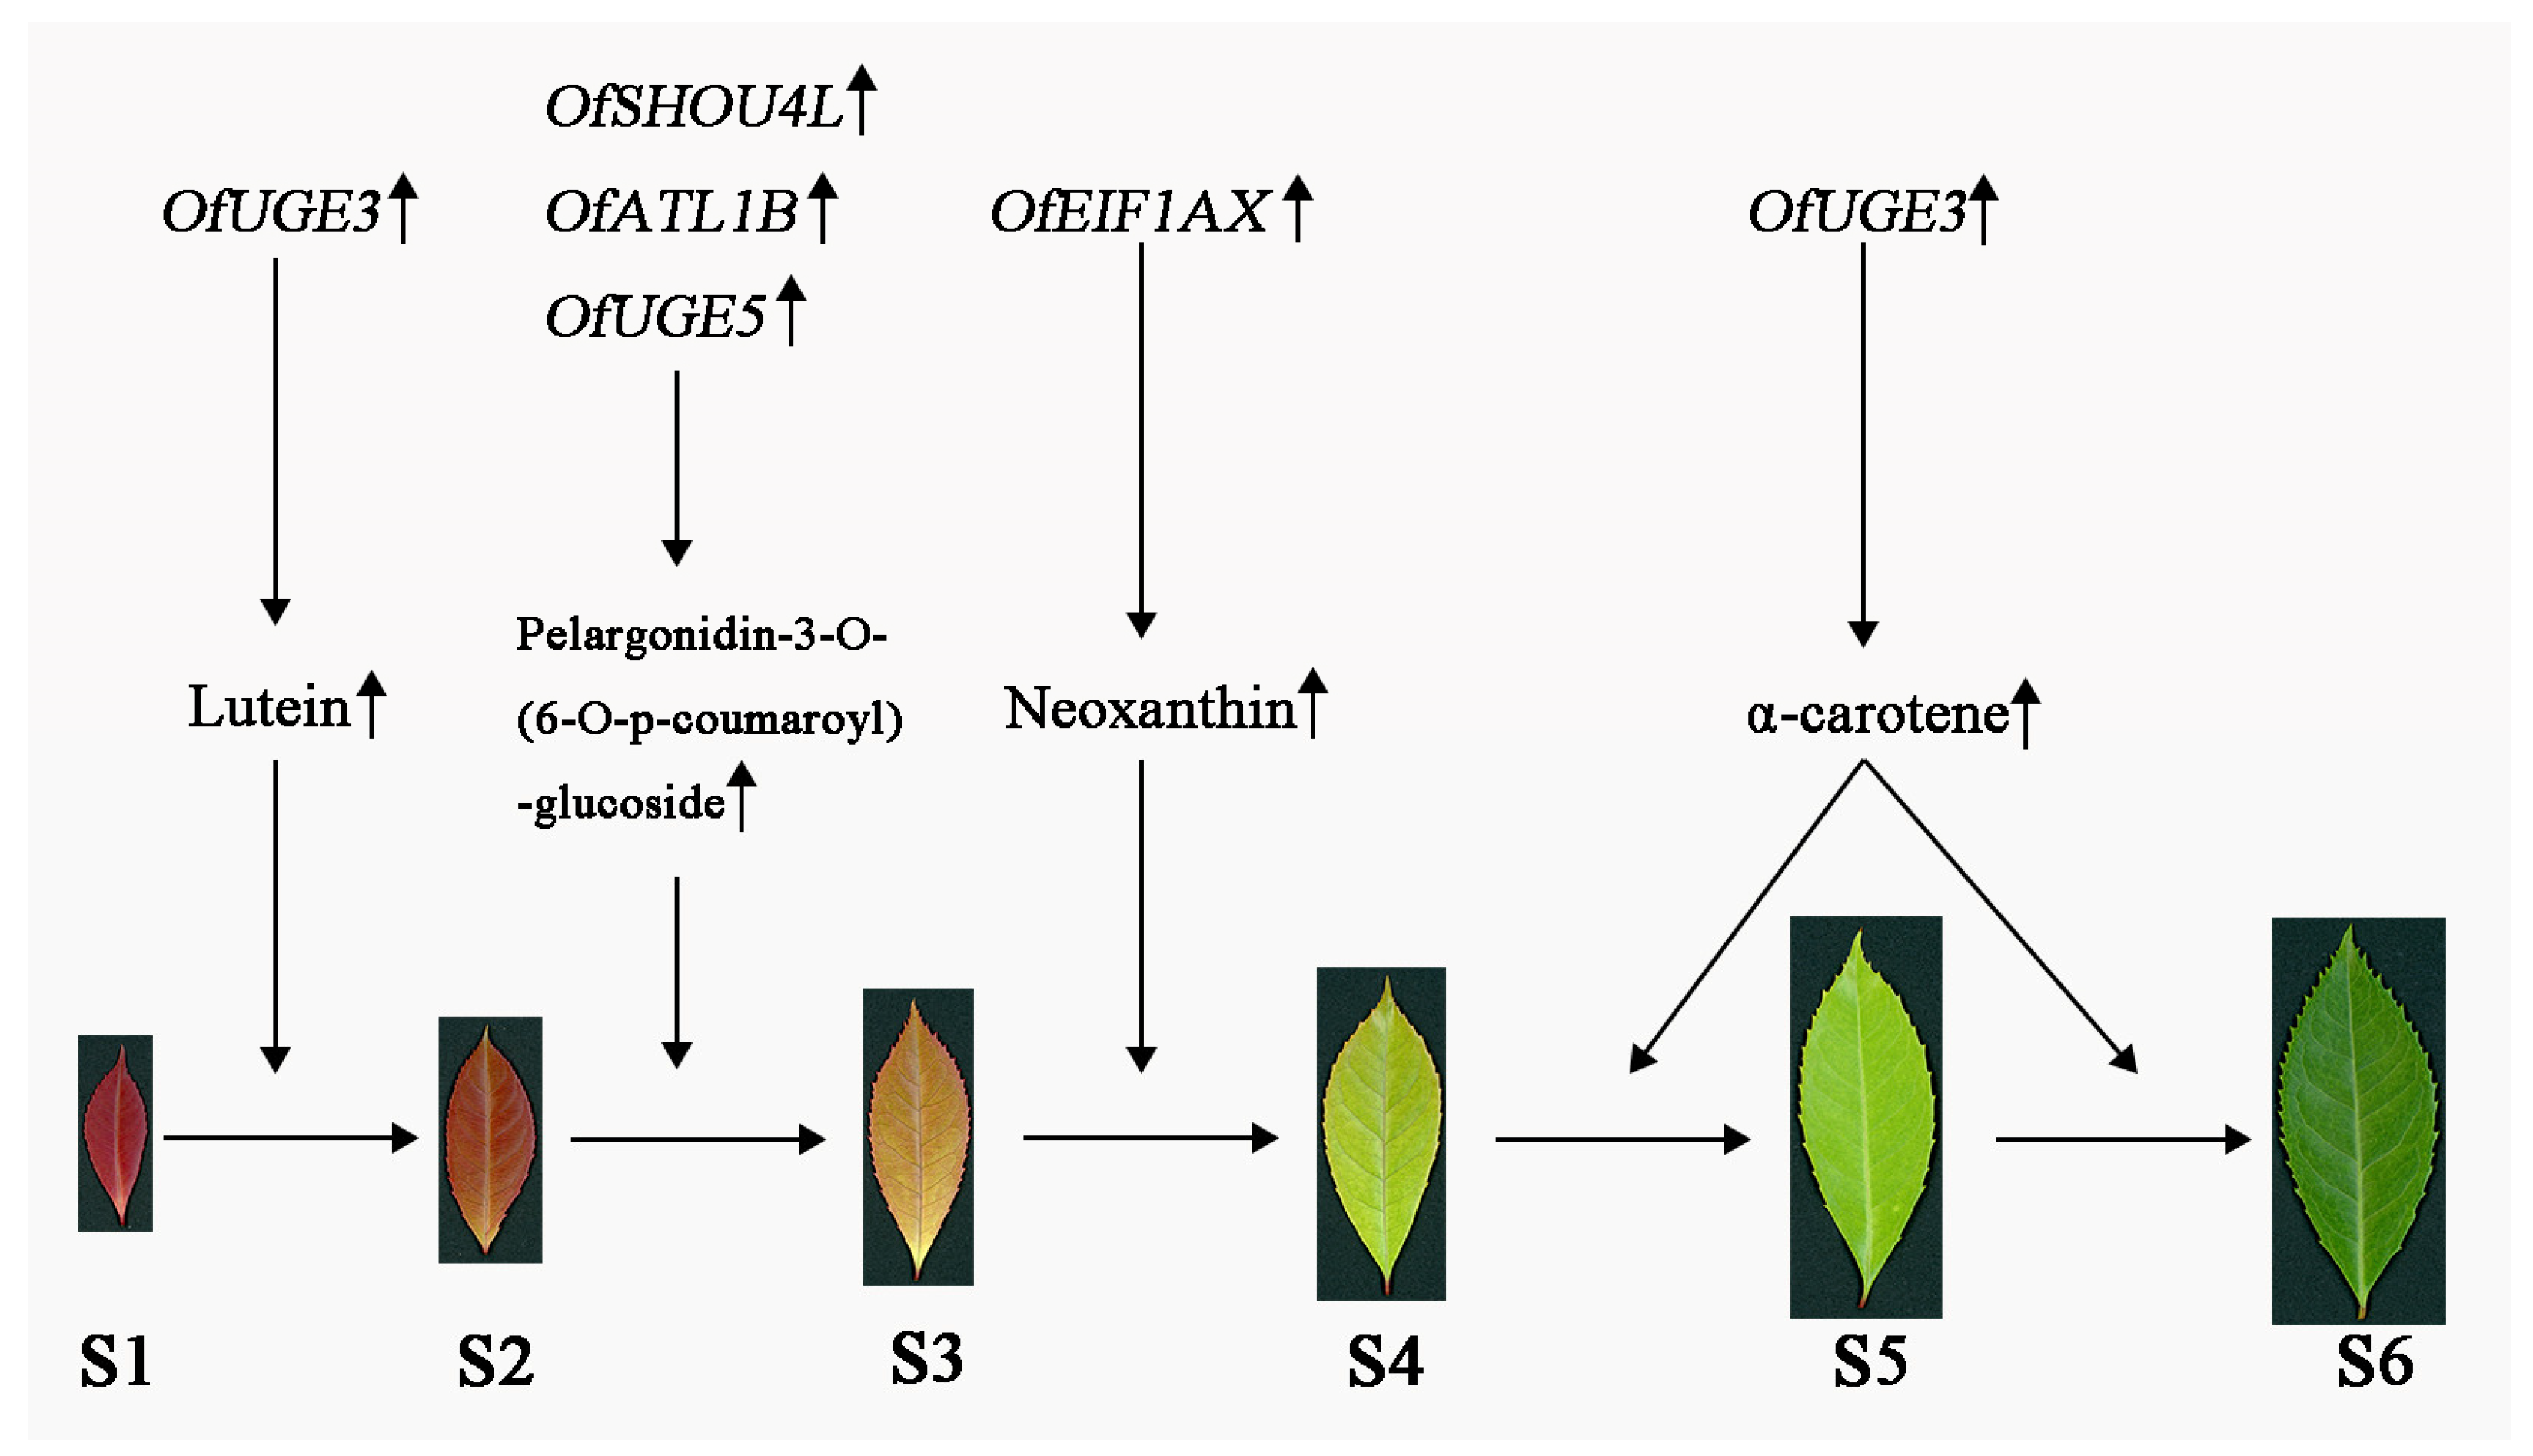
3.5. Hub Genes Regulate Leaf Color Changes

We performed qRT-PCR analysis on the candidate genes selected from three characteristic modules. As shown in Figure 6, the expression levels of 11 candidate genes varied at different leaf developmental stages. The expression trends of three genes in the module ‘white’ (OfSHOU4L, OfATL1B, and OfUGE5) were consistent with the trends in the transcriptome, whereas the expression trend of only one gene in each of the other modules, ‘mediumorchid’ and ‘orangered 4’, OfEIF1AX and OfUGE3, respectively, was consistent with the trend in the transcriptome. We initially proposed a model based on the content changes of key metabolites and the network regulatory map of the processes of leaf color changes in O. fragrans ‘Wucaigui’ (Figure 7). First, the positive regulation of OfUGE3 led to an increase in the lutein content, which resulted in the leaves changing from grayish-brown to moderate brown. During the change from moderate brown to dark greenish-yellow, the positive regulation of three genes (OfHOU4L, OfATL1B, and OfUGE5) increased the content of pelargonidin-3-O-(6-O-p-coumaroyl)-glucoside and the red color of the leaves gradually faded to dark greenish-yellow and then to strong yellow-green. The positive regulation of OfEIF1AX increased the content of neoxanthin. The stages in which the color changed from strong yellow-green to yellow-green and then to moderate olive-green were positively regulated by OfUGE3, which resulted in higher α-carotene content. In the last stage, the leaves turned completely green.

4. Discussion

Leaves are important plant organs and the change in leaf color is jointly determined by their own genetics and environmental factors [32,33]. The colors of plant leaves are related to its internal pigment contents, pigment species, and pigment distribution [34,35]. When the content and proportion of anthocyanins are higher than those of chlorophyll, the leaves appear red, whereas under the opposite conditions, the leaves appear green [36]. Metabolomes can be used for qualitative and quantitative analyses of small molecule metabolites and this has important application values in plant research [37,38]. In recent years, metabolome studies on leaf color changes in plants have been published. Twenty-six metabolites, including anthocyanins, proanthocyanidins, and flavonoids, were simultaneously detected and quantified in different colored leaf species of A. mandshuricum [14]. Recently, 118 compounds were identified in the red and purple leaves of F. angustifolia, and the high contents of flavonoids indicate that they may be the main substances causing leaf color changes [16]. In this study, 26 carotenoids, 51 anthocyanins, and 2 chlorophyll, including zeaxanthin, lutein, α-carotene, and β-carotene, were identified in the processes of O. fragrans ‘Wucaigui’ leaf color changes (Table 1, Table 2 and Table 3). Most of the metabolites have been reported in the leaf color changes of other plants. In the early stage of leaf color changes, the anthocyanin (Rutin and Quercetin-3-O-glucoside) content was high and the leaves of O. fragrans ‘Wucaigui’ appeared red. With development, the anthocyanin content in the leaves gradually decreased and the carotenoid (lutein and zeaxanthin) and chlorophyll (chlorophyll a and chlorophyll b) contents gradually increased until, finally, the leaves appeared green. The results appear to be similar to previous studies [2].
We determined the metabolites involved in the processes of leaf color changes in O. fragrans ‘Wucaigui’. However, the metabolites that play major roles in the whole process of leaf color changes still remained unclear. Consequently, we conducted pair-wise comparisons of six stages of leaf color changes and identified key metabolic substances using OPLS-DA and VIP maximum values (Figure 2 and Figure 3). As shown in Table S2, lutein was the key metabolic substance when the leaf color changed from S1 to S2 and pelargonidin-3-O-(6-O-p-coumaroyl)-glucoside was the key metabolic substance from S2 to S3. Neoxanthin was the key metabolite from S3 to S4 and α-carotene was the key metabolic substance during the change from S4 to S6. These key metabolites provided a foundation for further research on the leaf color changes of O. fragrans ‘Wucaigui’.
When plant leaf color changes, not only do related contents and proportions of pigments in the body change, but the transcription levels also change [39,40,41]. After transcriptome sequencing the different colors of Acer pseudosieboldianum leaves, 50,501 genes were identified [42]. A total of 53,550 genes were identified by transcriptome sequencing different colors of Acer fabri leaves and three key genes related to anthocyanin synthesis were identified [2]. We conducted transcriptome sequencing for six stages of leaf color changes of O. fragrans ‘Wucaigui’ and compared the results with the whole genome of O. fragrans. In total, 48,837 genes were identified, including 3295 novels. Both up-regulated and down-regulated genes are involved in the process of leaf color changes from red to yellow-green in O. fragrans ‘Wucaigui’.
WGCNA can divide genes with similar transcriptome expression patterns into different groups and then, co-expression networks related to studied traits can be constructed. These can be used to identify hub genes [43,44,45]. For example, in the study on the leaf color changes of O. fragrans ‘Yinbi Shuanghui’, WGCNA was performed on physiological and biochemical indicators and transcriptomic data and key genes in the chlorophyll and carotenoid metabolic pathways were identified [15]. From two studies on Acer palmatum leaf color changes, three candidate genes were identified in the significant association module based on WGCNA [46]. In this study, we initially screened 11 candidate genes from the feature module through WGCNA based on key metabolic substances that play major roles in leaf color changes (Figure 4). Then, using qRT-PCR, five key genes (OfSHOU4L1, OfATL1B, OfUGE5, OfEIF1AX, and OfUGE3) that may be involved in regulating the leaf color changes of O. fragrans ‘Wucaigui’ were finally identified (Figure 6). The hub genes we selected were not found in the studies of leaf color changes in other colorful plants. This may be because the gene regulatory mechanism behind the formation of the O. fragrans ‘Wucaigui’ leaf color is different from those in other plants. In addition, based on the results, we put forward a hypothetical model of the leaf-color-change process in O. fragrans ‘Wucaigui’ (Figure 7). We propose that the five hub genes positively regulate the content changes of key metabolites and we revealed a potential molecular mechanism for the leaf color changes of O. fragrans ‘Wucaigui’. The functional verification of genes cannot be achieved without an efficient and stable genetic transformation system [47,48]. Although the transformation systems of model plants, like Arabidopsis and tobacco, have been fully developed, it is more convincing to verify gene functions in their original species [49,50,51]. At present, we are trying to establish an efficient and stable genetic transformation system for O. fragrans and during upcoming studies, we will further verify the functions of these hub genes, thereby providing new insights into the molecular mechanisms of leaf color changes in O. fragrans.

5. Conclusions

This study is the first report on the combined metabolome and transcriptome analysis of the leaf-color-change process of O. fragrans ‘Wucaigui’. In this study, 79 metabolites were detected using OPLS-DA by analyzing leaves at different developmental stages. A total of 48,837 genes were obtained by transcriptome sequencing, including 3295 novel genes. The transcriptome and metabolome analyses based on WGCNA resulted in the identification of five hub genes (OfSHOU4L, OfATL1B, OfUGE5, OfEIF1AX, and OfUGE3) from the characteristic module species. These genes provided an important basis for further research on the molecular mechanisms of leaf color changes in O. fragrans ‘Wucaigui’.

Supplementary Materials

The following supporting information can be downloaded at: https://www.mdpi.com/article/10.3390/f15040709/s1, Table S1: Principal component analysis of the six developmental stages of O. fragrans ‘Wucaigui’; Table S2: Primer sequences used for qRT-PCR; Table S3: Full names of hub genes; Figure S1: PCA of RNAseq sequencing quality check.

Author Contributions

Conceptualization, X.Y. and L.W.; methodology, S.Z.; software, H.Q.; validation, S.Z., H.Q. and R.W.; formal analysis, S.Z.; investigation, X.Y.; resources, X.Y.; data curation, S.Z.; writing—original draft preparation, S.Z.; writing—review and editing, S.Z.; visualization, H.Q.; supervision, X.Y.; project administration, X.Y. and L.W.; funding acquisition, X.Y. and L.W. All authors have read and agreed to the published version of the manuscript.

Funding

This research was funded by the National Natural Science Foundation of China (Grant Nos. 31870695) and the Priority Academic Program Development of Jiangsu Higher Education Institutions (PAPD).

Data Availability Statement

The original contributions presented in the study are included in the article/Supplementary Materials, further inquiries can be directed to the corresponding author.

Conflicts of Interest

The authors declare no conflicts of interest.

References

  1. Zhu, T.; Wang, X.; Xu, Z.; Xu, J.; Li, R.; Liu, N.; Ding, G.C.; Sui, S.Z. Screening of key genes responsible for Pennisetum setaceum ‘Rubrum’ leaf color using transcriptome sequencing. PLoS ONE 2020, 15, e0242618. [Google Scholar] [CrossRef] [PubMed]
  2. Liu, G.H.; Gu, H.; Cai, H.Y.; Guo, C.C.; Chen, Y.; Wang, L.G.; Chen, G.W. Integrated transcriptome and biochemical analysis provides new insights into the leaf color change in Acer fabri. Forests 2023, 14, 1638. [Google Scholar] [CrossRef]
  3. Luo, J.R.; Duan, J.J.; Huo, D.; Shi, Q.Q.; Niu, L.X.; Zhang, Y.L. Transcriptomic analysis reveals transcription factors related to leaf anthocyanin biosynthesis in Paeonia qiui. Molecules 2017, 22, 2186. [Google Scholar] [CrossRef]
  4. Chen, X.; Xie, J.; Yue, Y.Z.; Yang, X.L.; Wang, L.G. Advances in research on leaf coloration mechanism of colored leaf plants. J. Northwest Plant 2020, 40, 358–364. [Google Scholar]
  5. Zhang, Q.; Wang, L.L.; Liu, Z.G.; Zhao, Z.H.; Zhao, J.; Wang, Z.T.; Zhou, G.F.; Liu, P.; Liu, M.J. Transcriptome and metabolome profiling unveil the mechanisms of Ziziphus jujuba Mill. peel coloration. Food Chem. 2020, 312, 125903. [Google Scholar] [CrossRef]
  6. Li, X.; Li, Y.; Zhao, M.H.; Hu, Y.B.; Meng, F.J.; Song, X.S.; Tigabu, M.; Chiang, V.L.; Sederoff, R.; Ma, W.J.; et al. Molecular and metabolic insights into anthocyanin biosynthesis for leaf color change in chokecherry (Padus virginiana). Int. J. Mol. Sci. 2021, 22, 10697. [Google Scholar] [CrossRef] [PubMed]
  7. Shao, D.N.; Li, Y.J.; Zhu, Q.H.; Zhang, X.Y.; Liu, F.; Xue, F.; Sun, J. GhGSTF12, a glutathione S-transferase gene, is essential for anthocyanin accumulation in cotton (Gossypium hirsutum L.). Plant Sci. 2021, 305, 110827. [Google Scholar] [CrossRef]
  8. Zhang, Z.; Tian, C.P.; Zhang, Y.; Li, C.Z.Y.; Li, X.; Yu, Q.; Wang, S.; Wang, X.Y.; Chen, X.S.; Feng, S.Q. Transcriptomic and metabolomic analysis provides insights into anthocyanin and procyanidin accumulation in pear. BMC Plant Biol. 2020, 20, 129. [Google Scholar] [CrossRef]
  9. Yang, Y.X.; Chen, X.X.; Xu, B.; Li, Y.X.; Ma, Y.H.; Wang, G.D. Phenotype and transcriptome analysis reveals chloroplast development and pigment biosynthesis together influenced the leaf color formation in mutants of Anthurium andraeanum ‘Sonate’. PhytoKeys 2015, 6, 139. [Google Scholar] [CrossRef]
  10. Nagata, N.; Tanaka, R.; Satoh, S.; Tanaka, A. Identification of a vinyl reductase gene for chlorophyll synthesis in Arabidopsis thaliana and implications for the evolution of Prochlorococcus species. Plant Cell 2005, 17, 233–240. [Google Scholar] [CrossRef]
  11. Celebioglu, B.; Hart, J.P.; Porch, T.; Griffiths, P.; Myers, J.R. Genome-wide association study to identify possible candidate genes of snap bean leaf and pod color. Genes 2023, 14, 2234. [Google Scholar] [CrossRef]
  12. Yan, Y.Y.; Liu, Q.; Yan, K.; Wang, X.Y.; Xu, P. Transcriptomic and metabolomic analyses reveal how girdling promotes leaf color expression in Acer rubrum L. BMC Plant Biol. 2022, 22, 498. [Google Scholar]
  13. Li, W.X.; Yang, S.B.; Lu, Z.G.; He, Z.C.; Ye, Y.L.; Zhao, B.B.; Wang, L.; Jin, B. Cytological, physiological, and transcriptomic analyses of golden leaf coloration in Ginkgo biloba L. Hortic. Res. 2018, 5, 32. [Google Scholar] [CrossRef] [PubMed]
  14. Zhang, S.K.; Zhan, W.; Sun, A.R.; Xie, Y.; Han, Z.M.; Qu, X.B.; Wang, J.Y.; Zhang, L.F.; Tian, M.S.; Pang, X.H.; et al. Combined transcriptome and metabolome integrated analysis of Acer mandshuricum to reveal candidate genes involved in anthocyanin accumulation. Sci. Rep. 2021, 11, 23148. [Google Scholar] [CrossRef] [PubMed]
  15. Chen, X.; Yang, X.L.; Jie, J.; Ding, W.J.; Li, Y.L.; Yue, Y.Z.; Wang, L.G. Biochemical and comparative transcriptome analyses reveal key genes involved in major metabolic regulation related to colored leaf formation in Osmanthus fragrans ‘Yinbi Shuanghui’ during development. Biomolecules 2020, 10, 549. [Google Scholar] [CrossRef] [PubMed]
  16. Wang, Y.L.; Zhen, J.P.; Che, X.Y.; Zhang, K.; Zhang, G.W.; Yang, H.J.; Wen, J.; Wang, J.X.; Wang, J.M.; He, B.; et al. Transcriptomic and metabolomic analysis of autumn leaf color change in Fraxinus angustifolia. PeerJ 2023, 11, e15319. [Google Scholar] [CrossRef] [PubMed]
  17. Zhang, S.W.; Yu, X.R.; Chen, M.J.; Chang, C.F.; Zhu, J.L.; Zhao, H. Comparative transcriptome and metabolome profiling reveal mechanisms of red leaf color fading in Populus × euramericana cv. ‘Zhonghuahongye’. Plants 2023, 12, 3511. [Google Scholar] [CrossRef] [PubMed]
  18. Yang, X.L.; Yue, Y.Z.; Li, H.Y.; Ding, W.J.; Chen, G.W.; Shi, T.T.; Chen, J.H.; Park, M.S.; Chen, F.; Wang, L.G. The chromosome-level quality genome provides insights into the evolution of the biosynthesis genes for aroma compounds of Osmanthus fragrans. Hortic. Res. 2018, 5, 72. [Google Scholar] [CrossRef] [PubMed]
  19. Gu, H.; Ding, W.J.; Shi, T.T.; Ouyang, Q.X.; Yang, X.L.; Yue, Y.Z.; Wang, L.G. Integrated transcriptome and endogenous hormone analysis provides new insights into callus proliferation in Osmanthus fragrans. Sci. Rep. 2022, 12, 7609. [Google Scholar] [CrossRef]
  20. Guo, P.; Huang, Z.Q.; Zhao, W.; Lin, N.; Wang, Y.H.; Shang, F.D. Mechanisms for leaf color changes in Osmanthus fragrans ‘Ziyan Gongzhu’ using physiology, transcriptomics and metabolomics. BMC Plant Biol. 2023, 23, 453. [Google Scholar] [CrossRef]
  21. Zhang, X.Z. Comparative study on determination methods of plant chlorophyll content. J. Shenyang Agr. Univ. 1985, 4, 84–87. [Google Scholar]
  22. Pertea, M.; Pertea, G.M.; Antonescu, C.M.; Chang, T.C.; Mendell, J.T.; Salzberg, S.L. StringTie enables improved reconstruction of a transcriptome from RNA-seq reads. Nat. Biotechnol. 2015, 33, 290–295. [Google Scholar] [CrossRef] [PubMed]
  23. Pertea, M.; Kim, D.; Pertea, G.M.; Leek, J.T.; Salzberg, S.L. Transcript-level expression analysis of RNA-seq experiments with HISAT, StringTie and Ballgown. Nat. Protoc. 2016, 11, 1650–1667. [Google Scholar] [CrossRef] [PubMed]
  24. Kanehisa, M.; Goto, S. KEGG: Kyoto encyclopedia of genes and genomes. Nucleic Acids Res. 2000, 28, 27–30. [Google Scholar] [CrossRef] [PubMed]
  25. Kanehisa, M. Toward understanding the origin and evolution of cellular organisms. Protein Sci. 2019, 28, 1947–1951. [Google Scholar] [CrossRef] [PubMed]
  26. Kanehisa, M.; Furumichi, M.; Sato, Y.; Ishiguro-Watanabe, M.; Tanabe, M. KEGG: Integrating viruses and cellular organisms. Nucleic Acids Res. 2021, 49, D545–D551. [Google Scholar] [CrossRef] [PubMed]
  27. Buchfnk, B.; Xie, C.; Huson, H.D. Fast and sensitive protein alignment using diamond. Nat. Methods 2014, 12, 59–60. [Google Scholar] [CrossRef] [PubMed]
  28. Mistry, J.; Finn, R.D.; Eddy, S.R.; Bateman, A.; Punta, M. Challenges in homology search: HMMER3 and convergent evolution of coiled-coil regions. Nucleic Acids Res. 2013, 41, 121. [Google Scholar] [CrossRef] [PubMed]
  29. Wu, Y.Q.; Guo, J.; Zhou, Q.; Xin, Y.; Wang, G.B.; Xu, L.A. De novo transcriptome analysis revealed genes involved in flavonoid biosynthesis, transport and regulation in Ginkgo biloba. Ind. Crop. Prod. 2018, 124, 226–235. [Google Scholar] [CrossRef]
  30. Wang, L.K.; Feng, Z.X.; Wang, X.; Wang, X.W.; Zhang, X.G. DEGseq: An R package for identifying diferentially expressed genes from RNA-seq data. Bioinformatics 2010, 26, 136–138. [Google Scholar] [CrossRef]
  31. Zhang, C.; Fu, J.X.; Wang, Y.G.; Bao, Z.Y.; Zhao, H.B. Identifcation of suitable reference genes for gene expression normalization in the quantitative real-time PCR analysis of Sweet Osmanthus (Osmanthus fragrans Lour.). PLoS ONE 2015, 10, 1–17. [Google Scholar]
  32. Cai, W.Q.; Zhang, D.M.; Zhang, X.; Chen, Q.R.; Liu, Y.; Lin, L.; Xiang, L.L.; Yang, Y.J.; Xu, L.; Yu, X.Y.; et al. Leaf color change and photosystem function evaluation under heat treatment revealed the stress resistance variation between Loropetalum chinense and L. chinense var. Rubrum. PeerJ 2023, 11, e14834. [Google Scholar] [CrossRef] [PubMed]
  33. Koyama, T. A hidden link between leaf development and senescence. Plant Sci. 2018, 276, 105–110. [Google Scholar] [CrossRef] [PubMed]
  34. Ge, W.; Wang, X.X.; Li, J.Y.; Zhu, W.P.; Cui, J.T.; Zhang, K.Z. Regulatory mechanisms of leaf color change in Acer pictum subsp. Mono. Genome 2019, 62, 793–805. [Google Scholar] [CrossRef] [PubMed]
  35. Wang, M.; Chen, L.; Liang, Z.J.; He, X.M.; Liu, W.R.; Jiang, B.; Yan, J.Q.; Sun, P.Y.; Cao, Z.Q.; Peng, Q.W.; et al. Metabolome and transcriptome analyses reveal chlorophyll and anthocyanin metabolism pathway associated with cucumber fruit skin color. BMC Plant Biol. 2020, 20, 386. [Google Scholar] [CrossRef] [PubMed]
  36. Li, Y.J.; Zhou, Y.; Chen, H.; Chen, C.; Liu, Z.M.; Han, C.; Wu, Q.K.; Yu, F.Y. Transcriptomic analyses reveal key genes involved in pigment biosynthesis related to leaf color change of Liquidambar formosana Hance. Molecules 2022, 27, 5433. [Google Scholar] [CrossRef] [PubMed]
  37. Schrimpe-Rutledge, A.C.; Codreanu, S.G.; Sherrod, S.D.; McLean, J.A. Untargeted metabolomics strategies-challenges and emerging directions. J. Am. Soc. Mass Spectrom. 2016, 27, 1897–1905. [Google Scholar] [CrossRef] [PubMed]
  38. Xu, L.x.; Chang, C.; Jiang, P.; Wei, K.; Zhang, R.R.; Jin, Y.H.; Zhao, J.N.; Xu, L.S.; Shi, Y.M.; Guo, S.C.; et al. Metabolomics in rheumatoid arthritis: Advances and review. Front Immunol. 2022, 11, 13:961708. [Google Scholar] [CrossRef]
  39. Li, Y.K.; Fang, J.B.; Qi, X.J.; Lin, M.M.; Zhong, Y.P.; Sun, L.M.; Cui, W. Combined analysis of the fruit metabolome and transcriptome reveals candidate genes involved in flavonoid biosynthesis in Actinidia arguta. Int. J. Mol. Sci. 2018, 19, 1471. [Google Scholar] [CrossRef]
  40. Yuan, L.Y.; Zhang, L.T.; Wu, Y.; Zheng, Y.S.; Nie, L.B.; Zhang, S.N.; Lan, T.; Zhao, Y.; Zhu, S.D.; Hou, J.F.; et al. Comparative transcriptome analysis reveals that chlorophyll metabolism contributes to leaf color changes in wucai (Brassica campestris L.) in response to cold. BMC Plant Biol. 2021, 21, 438. [Google Scholar] [CrossRef]
  41. Jiang, Y.; Wang, Q.; Shen, Q.Q.; Zhuo, B.P.; He, J.R. Transcriptome analysis reveals genes associated with leaf color mutants in Cymbidium longibracteatum. Tree Genet. Genomes 2020, 16, 44. [Google Scholar]
  42. Gao, Y.F.; Zhao, D.H.; Zhang, J.Q.; Chen, J.S.; Li, J.L.; Weng, Z.; Rong, L.P. De novo transcriptome sequencing and anthocyanin metabolite analysis reveals leaf color of Acer pseudosieboldianum in autumn. BMC Genom. 2021, 22, 383. [Google Scholar] [CrossRef]
  43. Wu, Q.B.; Pan, Y.B.; Su, Y.C.; Zou, W.H.; Xu, F.; Sun, T.T.; Grisham, M.P.; Yang, S.L.; Xu, L.P.; Que, Y.X. WGCNA identifies a comprehensive and dynamic gene co-expression network that associates with smut resistance in sugarcane. Int. J. Mol. Sci. 2022, 23, 10770. [Google Scholar] [CrossRef] [PubMed]
  44. Wang, X.P.; Liu, H.L.; Zhang, D.; Zou, D.T.; Wang, J.G.; Zheng, H.L.; Jia, Y.; Qu, Z.J.; Sun, B.; Zhao, H.W. Photosynthetic carbon fixation and sucrose metabolism supplemented by weighted gene co-expression network analysis in response to water stress in rice with overlapping growth stages. Front Plant Sci. 2022, 13, 864605. [Google Scholar] [CrossRef]
  45. Zhang, X.Q.; Yang, H.H.; Li, M.M.; Bai, Y.; Chen, C.; Guo, D.L.; Guo, C.H.; Shu, Y.J. A pan-transcriptome analysis indicates efficient downregulation of the FIB genes plays a critical role in the response of alfalfa to cold stress. Plants 2022, 11, 3148. [Google Scholar] [CrossRef]
  46. Zhu, L.; Wen, J.; Ma, Q.Y.; Yan, K.Y.; Du, Y.M.; Chen, Z.; Lu, X.Y.; Ren, J.; Wang, Y.L.; Li, S.S.; et al. Transcriptome profiling provides insights into leaf color changes in two Acer palmatum genotypes. BMC Plant Biol. 2022, 22, 589. [Google Scholar] [CrossRef]
  47. Zhong, S.W.; Dong, B.; Zhou, J.; Miao, Y.F.; Yang, L.Y.; Wang, Y.G.; Xiao, Z.; Fang, Q.; Wan, Q.Q.; Zhao, H.B. Highly efficient transient gene expression of three tissues in Osmanthus fragrans mediated by Agrobacterium tumefaciens. Sci. Hortic. 2023, 310, 111725. [Google Scholar] [CrossRef]
  48. Liu, J.; Hu, X.M.; Qin, P.; Prasad, K.; Hu, Y.X.; Xu, L. The WOX11-LBD16 pathway promotes pluripotency acquisition in callus cells during de novo shoot regeneration in tissue culture. Plant Cell Physiol. 2018, 59, 734–748. [Google Scholar] [CrossRef]
  49. Xu, C.Y.; Cao, H.F.; Zhang, Q.Q.; Wang, H.Z.; Xin, W.; Xu, E.J.; Zhang, S.Q.; Yu, R.X.; Yu, D.X.; Hu, Y.X. Control of auxin-induced callus formation by bZIP59-LBD complex in Arabidopsis regeneration. Nat. Plants 2018, 4, 108–115. [Google Scholar] [CrossRef]
  50. Liu, B.B.; Zhang, J.; Yang, Z.H.; Matsui, A.; Seki, M.; Li, S.B.; Yan, X.Y.; Kohnen, M.V.; Gu, L.F.; Prasad, K.; et al. PtWOX11 acts as master regulator conducting the expression of key transcription factors to induce de novo shoot organogenesis in poplar. Plant Mol. Biol. 2018, 98, 389–406. [Google Scholar] [CrossRef]
  51. Dai, X.H.; Liu, N.; Wang, L.J.; Li, J.; Zheng, X.J.; Xiang, F.N.; Liu, Z.H. MYB94 and MYB96 additively inhibit callus formation via directly repressing LBD29 expression in Arabidopsis thaliana. Plant Sci. 2020, 293, 110323. [Google Scholar] [CrossRef] [PubMed]
Figure 1. Six stages of O. fragrans ‘Wucaigui’ leaf development. S1: grayish-brown; S2: moderate brown; S3: dark greenish-yellow; S4: strong yellow-green; S5: yellow-green; S6: moderate olive-green.
Forests 15 00709 g001
Figure 2. Comparisons of differentially expressed genes from O. fragrans ‘Wucaigui’ leaves at different developmental stages. S1: grayish-brown; S2: moderate brown; S3: dark greenish-yellow; S4: strong yellow-green; S5: yellow-green; S6: moderate olive-green.
Forests 15 00709 g002
Figure 3. The score plot of pigment contents in O. fragrans ‘Wucaigui’ leaves at different developmental stages as determined by an OPLS-DA. S1: grayish-brown; S2: moderate brown; S3: dark greenish-yellow; S4: strong yellow-green; S5: yellow-green; S6: moderate olive-green.
Forests 15 00709 g003
Figure 4. Metabolic substance contents and characteristic modules. (A) Carotenoid characteristic modules. (B) Anthocyanin characteristic modules. Each column represents a metabolic substance and each row represents a genetic module. The number in each grid represents the correlation between the module and the gene. The number in parentheses represents the p-value. The smaller the p-value, the stronger the significance of the representativeness and module correlation.
Forests 15 00709 g004
Figure 5. Number of genes in each feature module.
Forests 15 00709 g005
Figure 6. The qRT-PCR validation of the transcriptome data results for hub genes. (A) Hub genes of anthocyanin up-regulation in the ‘white’ module. (B) Hub genes of carotenoid up-regulation in the ‘mediumorchid’ module. (C) Hub genes of carotenoid up-regulation in the ‘orangered 4’ module. S1: grayish-brown; S2: moderate brown; S3: dark greenish-yellow; S4: strong yellow-green; S5: yellow-green; S6: moderate olive-green.
Forests 15 00709 g006
Figure 7. Proposed model of leaf color changes in O. fragrans ‘Wucaigui’. S1: grayish-brown; S2: moderate brown; S3: dark greenish-yellow; S4: strong yellow-green; S5: yellow-green; S6: moderate olive-green.
Forests 15 00709 g007
Table 1. Content of chlorophyll in 6 periods of leaf development of O. fragrans ‘Wucaigui’.
StagesS1S2S3S4S5S6
chlorophyll a216.1 ± 13.95 c232.8 ± 35.54 c306.1 ± 24.8 c357.4 ± 52.07 c810 ± 55.43 b1691.6 ± 198.03 a
chlorophyll b104.4 ± 7.59 c104.4 ± 39.28 c121.6 ± 17.96 c189.5 ± 48.98 bc352.3 ± 21.59 b642.5 ± 79.73 a
S1: greyish-brown, S2: moderate brown, S3: dark greenish-yellow, S4: strong yellow-green, S5: yellow-green, S6: moderate olive-green. Different letters denote significant differences according to Tukey’s test (p < 0.05).
Table 2. Content of carotenoid in 6 periods of leaf development of O. fragrans ‘Wucaigui’.
StagesS1S2S3S4S5S6
α-carotene2.0202 ± 0.22477 b2.1009 ± 0.38257 b1.8701 ± 0.27284 b2.8983 ± 0.45855 b8.8319 ± 0.46579 b118.6902 ± 4.30442 a
ε-carotene0 ± 0 b0 ± 0 b0 ± 0 b0 ± 0 b0 ± 0 b0.3718 ± 0.00919 a
phytofluene0.8395 ± 0.10317 ab0.8021 ± 0.08205 ab1.3913 ± 0.02097 a0.3415 ± 0.34152 bc0.7856 ± 0.12336 ab0 ± 0 c
β-carotene19.2999 ± 0.53642 c25.2141 ± 1.53285 bc20.7461 ± 2.59892 bc35.3598 ± 2.65966 b31.4712 ± 2.27726 bc144.4781 ± 6.79325 a
(E/Z)-phytoene0.6935 ± 0.0633 b0.7769 ± 0.037 b1.7952 ± 0.17079 ab1.9186 ± 0.45996 ab1.9327 ± 0.28795 ab2.5695 ± 0.37205 a
β-cryptoxanthin palmitate0.074 ± 0.0740 ± 00 ± 00 ± 00 ± 00 ± 0
zeaxanthin78.648 ± 13.89694 ab136.2735 ± 29.5574 ab145.9202 ± 17.13689 a144.2718 ± 15.2421 ab66.0319 ± 8.80972 b112.9632 ± 4.70251 ab
violaxanthin3.5234 ± 0.34962 bc3.5538 ± 0.40363 bc2.0529 ± 0.19068 c4.0291 ± 0.42941 b3.0504 ± 0.37767 bc8.796 ± 0.56817 a
neoxanthin9.0619 ± 0.68292 d11.0697 ± 1.9487 d11.8445 ± 0.77803 d23.8524 ± 0.56168 c35.9063 ± 2.81685 b57.4593 ± 2.49658 a
lutein252.6791 ± 12.5571 c327.7297 ± 5.14785 c303.3848 ± 16.24441 c455.4933 ± 14.83089 b458.7924 ± 34.21441 b871.3145 ± 24.57139 a
β-cryptoxanthin2.6305 ± 0.69132 b3.261 ± 0.65776 b3.1777 ± 0.67226 b2.9472 ± 0.29273 b6.5685 ± 0.43987 a3.5697 ± 0.15147 b
8’-apo-beta-carotenal0.0208 ± 0.00159 c0.0246 ± 0.00227 c0.027 ± 0.00337 c0.0348 ± 0.00432 bc0.0895 ± 0.0053 a0.0465 ± 0.00313 b
α-cryptoxanthin1.8543 ± 0.606531.382 ± 0.361170.7002 ± 0.087120.6937 ± 0.045280.7997 ± 0.075941.6454 ± 0.15539
echinenone0.0058 ± 0.0007 c0.0038 ± 0.00029 c0.0079 ± 0.00219 c0.009 ± 0.0022 bc0.028 ± 0.00183 a0.0163 ± 0.00119 b
β-citraurin0.0153 ± 0.002530.0196 ± 0.002260.0205 ± 0.004280.021 ± 0.00110.0171 ± 0.00110.0124 ± 0.00076
antheraxanthin dipalmitate0.0124 ± 0.00623 b0.0198 ± 0.00159 b0.0154 ± 0.00094 b0.0153 ± 0.00259 b0.0101 ± 0.00124 b0.1106 ± 0.01585 a
antheraxanthin2.4446 ± 0.660693.4623 ± 0.72245.7288 ± 1.615158.1202 ± 3.329256.6285 ± 0.708745.1785 ± 0.95917
lutein palmitate0.131 ± 0.02524 a0.1058 ± 0.02103 a0.0661 ± 0.00944 ab0.0649 ± 0.02596 ab0.0063 ± 0.00631 b0.0119 ± 0.01194 b
capsorubin0.0365 ± 0.03652 b0.1045 ± 0.03652 ab0.0703 ± 0.03556 ab0.1482 ± 0.04598 ab0.0719 ± 0.00352 ab0.2089 ± 0.01193 a
lutein myristate0.0483 ± 0.01155 a0.0413 ± 0.00481 ab0.0204 ± 0.00472 bc0.0093 ± 0.00542 c0 ± 0 c0 ± 0 c
β-cryptoxanthin myristate0.0036 ± 0.003620.0035 ± 0.003550 ± 00 ± 00 ± 00.0033 ± 0.00326
β-cryptoxanthin oleate0 ± 00 ± 00 ± 00 ± 00.0043 ± 0.00430.0034 ± 0.0034
rubixanthin palmitate0.0094 ± 0.009440 ± 00 ± 00 ± 00 ± 00 ± 0
violaxanthin dilaurate0 ± 00 ± 00 ± 00 ± 00.014 ± 0.014030 ± 0
zeaxanthin dipalmitate0.026 ± 0.0260 ± 00 ± 00 ± 00 ± 00 ± 0
violaxanthin dibutyrate0 ± 0 b0 ± 0 b0 ± 0 b0 ± 0 b0.0039 ± 0.00392 b0.0329 ± 0.00403 a
S1: greyish-brown, S2: moderate brown, S3: dark greenish-yellow, S4: strong yellow-green, S5: yellow-green, S6: moderate olive-green. Different letters denote significant differences according to Tukey’s test (p < 0.05).
Table 3. Content of anthocyanin in 6 periods of leaf development of O. fragrans ‘Wucaigui’.
StagesS1S2S3S4S5S6
Cyanidin-3,5-O-diglucoside0.4353 ± 0.05688 a0.1801 ± 0.0158 b0.0968 ± 0.00174 bc0.0717 ± 0.00985 bc0.0954 ± 0.02975 bc0.0325 ± 0.00368 c
Cyanidin-3-O-arabinoside0.0855 ± 0.0309 a0.013 ± 0.00199 b0 ± 0 b0 ± 0 b0 ± 0 b0 ± 0 b
Cyanidin-3-O-rutinoside-5-O-glucoside1.445 ± 0.40599 a0.5831 ± 0.06172 b0.4126 ± 0.02887 b0.2424 ± 0.06033 b0.1741 ± 0.03911 b0 ± 0 b
Cyanidin-3-(6″-caffeylsophoroside)-5-glucoside0 ± 0 b0 ± 0 b0 ± 0 b0 ± 0 b0.0011 ± 0.00056 b0.0054 ± 0.00109 a
Cyanidin-3-(6-O-p-caffeoyl)-glucoside0 ± 0 c0.0649 ± 0.00775 b0.0887 ± 0.0103 b0.1063 ± 0.01142 b0.2158 ± 0.01788 a0.1945 ± 0.01243 a
Cyanidin-3-O-(6-O-malonyl-beta-D-glucoside)0.0038 ± 0.001670 ± 00 ± 00.0014 ± 0.001670 ± 00 ± 0
Cyanidin-3-O-sophoroside0.0319 ± 0.016 a0 ± 0 b0 ± 0 b0 ± 0 b0 ± 0 b0 ± 0 b
Cyanidin-3-O-xyloside0.0098 ± 00491 a0 ± 0 b0 ± 0 b0 ± 0 b0 ± 0 b0 ± 0 b
Cyanidin-3,5,3′-O-triglucoside0.0222 ± 0.00307 bc0.048 ± 0.00995 ab0.0879 ± 0.00865 a0.0485 ± 0.01621 ab0 ± 0 c0 ± 0 c
Cyanidin-3-O-sambubioside0.0385 ± 0.01258 a0.0122 ± 0.0016 b0.005 ± 0.00065 b0.0034 ± 0.00088 b0.0018 ± 0.00022 b0.0018 ± 0.00017 b
Cyanidin-3-O-rutinoside20.2637 ± 5.28889 a9.0883 ± 0.79503 b5.0819 ± 0.14054 b2.2312 ± 0.72849 b0.958 ± 0.36382 b0.2357 ± 0.04616 b
Cyanidin-3-O-glucoside2.8567 ± 0.89241 a0.954 ± 0.10062 b0.4329 ± 0.0179 5 b0.2998 ± 0.04351 b0.5354 ± 0.1856 b0.2095 ± 0.02935 b
Delphinidin-3-O-5-O-(6-O-coumaroyl)-diglucoside0.0142 ± 0.00454 a0 ± 0 b0 ± 0 b0 ± 0 b0 ± 0 b0 ± 0 b
Delphinidin-3-O-(6-O-acetyl)-glucoside0 ± 0 b0 ± 0 b0 ± 0 b0 ± 0 b0 ± 0 b0.0367 ± 0.00694 a
Delphinidin-3-O-(6-O-malonyl-beta-D-glucoside)0 ± 0 b0.0038 ± 0.00193 b0.0029 ± 0.0029 b0.0017 ± 0.00167 b0.0064 ± 0.0032 b0.024 ± 0.00289 a
Delphinidin-3,5-O-diglucoside0.0001 ± 0.00008 c0.0018 ± 0.00015 a0.0013 ± 0.00018 a0.002 ± 0.00022 ab0 ± 0 c0.0007 ± 0.00044 bc
Delphinidin-3-O-sambubioside0.0113 ± 0.00136 bc0.0175 ± 0.00123 a0.0189 ± 0.0007 a0.0161 ± 0.002 ab0.0092 ± 0.00116 cd0.0034 ± 0.0004 d
Delphinidin-3-O-rutinoside0.0046 ± 0.00459 b0.0212 ± 0.00155 a0.0076 ± 0.0038 ab0.0057 ± 0.00291 b0.0052 ± 0.0026 b0.0082 ± 0.0008 ab
Delphinidin-3-O-arabinoside0.0068 ± 0.00161 d0.0081 ± 0.00044 d0.0099 ± 0.00123 cd0.0147 ± 0.00068 c0.0217 ± 0.00095 b0.0318 ± 0.00196 a
Delphinidin-3-O-galactoside0.0148 ± 0.00054 b0.0117 ± 0.00091 b0.0133 ± 0.00027 b0.0117 ± 0.00207 b0.0164 ± 0.00101 b0.0249 ± 0.002 a
Delphinidin-3-O-rutinoside-5-O-glucoside0.027 ± 0.00197 ab0.0343 ± 0.00111 a0.0294 ± 0.00128 ab0.0232 ± 0.00281 b0.021 ± 0.00139 b0.0245 ± 0.00217 b
Malvidin-3,5-O-diglucoside0.0145 ± 0.00034 a0.0136 ± 0.00047 a0.0134 ± 0.00043 a0 ± 0 b0.0085 ± 0.00428 ab0.008 ± 0.00398 ab
Malvidin-3-O-glucoside0 ± 0 b0 ± 0 b0 ± 0 b0 ± 0 b0 ± 0 b0.0118 ± 0.00146 a
Malvidin-3-O-galactoside0 ± 0 b0 ± 0 b0 ± 0 b0 ± 0 b0 ± 0 b0.0036 ± 0.00032 a
Pelargonidin-3-O-(6-O-malonyl-beta-D-glucoside)0.0065 ± 0.0064 7 b0.0333 ± 0.00293 a0.0213 ± 0.01075 ab0 ± 0 b0 ± 0 b0 ± 0 b
Pelargonidin-3-O-glucoside0.0175 ± 0.00877 a0 ± 0 b0 ± 0 b0 ± 0 b0 ± 0 b0 ± 0 b
Pelargonidin-3-O-arabinoside0 ± 0 b0 ± 0 b0 ± 0 b0 ± 0 b0 ± 0 b0.0133 ± 0.00094 a
Pelargonidin-3,5-O-diglucoside0.6045 ± 0.08294 bc0.8783 ± 0.00316 a1.0345 ± 0.02331 a0.7947 ± 0.08205 ab0.4928 ± 0.06224 c0.1638 ± 0.01162 d
Pelargonidin-3-O-(6-O-p-coumaroyl)-glucoside127.1063 ± 6.39837 b153.5045 ± 0.44048 a166.2193 ± 1.41302 a163.8305 ± 2.41484 a150.9447 ± 2.57229 a151.7783 ± 3.73283 a
Pelargonidin-3-O-rutinoside13.4871 ± 3.76768 a4.0461 ± 0.51719 b2.4218 ± 0.22746 b1.2958 ± 0.44617 b0.3847 ± 0.07238 b0.084 ± 0.00697 b
Peonidin-3-O-(6-O-p-coumaroyl)-glucoside0.3092 ± 0.04391 d0.699 ± 0.05671 cd2.4569 ± 0.33936 cd4.0014 ± 0.52503 c9.7389 ± 0.44988 b29.25 ± 1.6666 a
Peonidin-3-O-5-O-(6-O-coumaroyl)-diglucoside0 ± 0 c0 ± 0 c0.003 ± 0.00088 c0.0019 ± 0.00028 c0.0241 ± 0.00447 b0.1458 ± 0.00333 a
Peonidin-3,5-O-diglucoside0 ± 0 c0 ± 0 c0.0163 ± 0.00815 bc0.0376 ± 0.00406 a0.0315 ± 0.00334 ab0 ± 0 c
Peonidin-3-O-sophoroside0.0073 ± 0.00438 ab0.0154 ± 0.00061 a0.0043 ± 0.00425 ab0.0026 ± 0.00259 ab0 ± 0 b0 ± 0 b
Peonidin-3-O-glucoside0.0063 ± 0.00252 bc0.0016 ± 0.00077 c0.0099 ± 0.00298 abc0.04 ± 0.01459 ab0.0449 ± 0.0108 a0 ± 0 c
Peonidin0 ± 00.0037 ± 0.001890.0033 ± 0.003350.0046 ± 0.00250.0026 ± 0.002620 ± 0
Peonidin-3-O-rutinoside6.5679 ± 1.95878 a3.5425 ± 0.49228 ab2.8087 ± 0.1773 ab1.9558 ± 0.48003 b1.0596 ± 0.17776 b0.1688 ± 0.0143 b
Peonidin-3-O-galactoside0.0297 ± 0.0037 8 b0.0489 ± 0.00458 b0.0558 ± 0.00145 b0.0383 ± 0.0055 b0.0251 ± 0.0055 b0.1084 ± 0.01434 a
Petunidin-3,5-O-diglucoside0.1003 ± 0.01161 a0.0629 ± 0.00357 b0.0305 ± 0.00901 c0.0106 ± 0.00901 cd0.0059 ± 0.00901 cd0 ± 0 d
Petunidin-3-O-rutinoside0.0256 ± 0.00328 ab0.033 ± 0.00328 a0.0167 ± 0.00322 b0 ± 0 c0 ± 0 c0 ± 0 c
Petunidin-3-O-(6-O-malonyl-beta-D-glucoside)0.0188 ± 0.0014 cd0.0255 ± 0.00087 bc0.0329 ± 0.00145 ab0.0362 ± 0.00109 a0.0338 ± 0.00376 ab0.0099 ± 0.00187 d
Petunidin-3-O-arabinoside0 ± 0 d0 ± 0 d0 ± 0 d0.0195 ± 0.00366 c0.0417 ± 0.00258 b0.1008 ± 0.00655 a
Procyanidin A10 ± 0 b0 ± 0 b0 ± 0 b0 ± 0 b0 ± 0 b0.0118 ± 0.00066 a
Procyanidin B30.0294 ± 0.00109 bc0.0269 ± 0.00241 c0.0329 ± 0.00168 abc0.0352 ± 0.0018 abc0.0368 ± 0.00254 ab0.0403 ± 0.00251 a
Procyanidin B20 ± 00.0097 ± 0.009660 ± 00 ± 00 ± 00 ± 0
Rutin756.2563 ± 64.21963 a882.8901 ± 34.55686 a697.5998 ± 27.95971 ab465.7452 ± 48.99165 bc434.002 ± 81.47855 c343.7775 ± 35.91914 c
Kaempferol-3-O-rutinoside223.141 ± 9.15061 bc334.9178 ± 24.16805 a298.4348 ± 19.96219 ab199.6224 ± 19.96219 c154.9266 ± 33.73202 cd104.0808 ± 6.73921 d
Naringenin-7-O-glucoside3.86060 ± 0.51811 a4.1340 ± 0.29852 a3.60640 ± 0.33668 ab2.28420 ± 0.23061 bc0.96270 ± 0.18936 cd0 ± 0 d
Dihydrokaempferol0.0833 ± 0.00766 a0.0496 ± 0.00684 b0.0303 ± 0.00976 bc0.0153 ± 0.00144 cd0.0059 ± 0.00591 cd0 ± 0 d
Quercetin-3-O-glucoside381.4945 ± 42.41605 a425.5015 ± 17.93373 a320.1362 ± 7.69342 ab211.1826 ± 22.08354 bc198.8025 ± 31.03374 c174.3214 ± 12.57217 c
Naringenin0.3095 ± 0.00357 a0.3234 ± 0.01599 a0.296 ± 0.00785 ab0.2459 ± 0.01469 b0.1831 ± 0.01575 c0.0987 ± 0.00329 d
S1: greyish-brown, S2: moderate brown, S3: dark greenish-yellow, S4: strong yellow-green, S5: yellow-green, S6: moderate olive-green. Different letters denote significant differences according to Tukey’s test (p < 0.05).
Table 4. Summary of sequencing data.
SampleRaw ReadsClean ReadsGC (%)Q20 (%)Q30 (%)
S1-18,696,665,2008,299,815,30344.4596.9691.76
S1-27,528,551,3007,280,491,75944.9096.4190.60
S1-36,741,765,0006,594,652,42143.2396.1890.09
S2-16,712,422,9006,565,193,54744.2897.8293.61
S2-26,504,189,9006,384,983,90343.5197.7693.06
S2-312,265,493,40010,910,017,55147.3397.5593.45
S3-110,777,563,90010,047,579,95545.4797.3492.81
S3-28,863,207,5008,408,586,06844.6797.2992.65
S3-37,874,278,8007,724,751,44443.4897.5092.66
S4-19,042,206,1008,493,640,35644.8997.4893.05
S4-214,078,341,80013,777,599,64643.6997.4492.70
S4-311,819,290,50011,327,978,01443.9397.1692.12
S5-110,417,861,8009,506,739,38347.1397.7893.79
S5-27,561,083,9007,326,157,81944.7597.6893.29
S5-38,346,830,7007,997,110,37044.3797.4892.87
S6-17,765,364,7007,681,276,00644.2497.5492.78
S6-27,433,418,6007,202,084,85743.1696.6291.02
S6-310,267,528,2009,962,439,17643.3597.7993.43
S1: greyish-brown, S2: moderate brown, S3: dark greenish-yellow, S4: strong yellow-green, S5: yellow-green, S6: moderate olive-green. Raw reads: original number of reads obtained by sequencing; clean reads: number of reads after removing low-quality reads and trimming adapter sequences; GC%: percentage of G and C in total bases; Q20: Phred score, indicates 99% accuracy of sequenced bases; Q30: Phred score, indicates 99.9% accuracy of sequenced bases.
Disclaimer/Publisher’s Note: The statements, opinions and data contained in all publications are solely those of the individual author(s) and contributor(s) and not of MDPI and/or the editor(s). MDPI and/or the editor(s) disclaim responsibility for any injury to people or property resulting from any ideas, methods, instructions or products referred to in the content.

