Article

Response of Plant Phenology on Microclimate Change Depending on Land Use Intensity in Seoul, Central Korea

1
Forest Ecology Division, National Institute of Forest Science, Seoul 02455, Republic of Korea
2
Division of Forest Biodiversity, Korea National Arboretum, Pocheon 11186, Republic of Korea
3
Department of Bio & Environmental Technology, Seoul Women’s University, Seoul 01797, Republic of Korea
4
National Institute of Ecology, Seocheon 33657, Republic of Korea
*
Author to whom correspondence should be addressed.
Forests 2024, 15(4), 718; https://doi.org/10.3390/f15040718
Submission received: 28 February 2024 / Revised: 12 April 2024 / Accepted: 13 April 2024 / Published: 18 April 2024
(This article belongs to the Section Forest Meteorology and Climate Change)

Abstract

:
The difference in the leaf unfolding date of Mongolian oak obtained through MODIS image analysis between the urban center and the outskirts of Seoul was found to be seven days. The difference in the flowering date of cherry obtained through field observations was also found to be seven days between the urban center and the outskirts. The frequency of the abnormal shoot of Korean red pine differed by 71% between the urban center and the outskirts, and the length growth differed by 8.6 cm. There was a statistically significant correlation between the leaf unfolding date of Mongolian oak, the flowering date of the cherry, and the spatial difference in the frequency and length of the abnormal shoot of the Korean red pine. The temperature difference between the urban center and the outskirts of Seoul based on the mean temperature over the past 30 years was about 5 °C. The spatial difference in plant phenology showed a statistically significant negative relationship with the spatial difference in temperature. On the other hand, the spatial difference in temperature showed a statistically significant positive relationship with the spatial difference in the urbanization rate. These results are interpreted as the result of excessive land use during urbanization causing the heat island phenomenon, and the resulting temperature difference is reflected in the phenology of plants. These results are evidence that urbanization, which uses excessive land and energy, has a very significant impact on climate change. In addition, it is also evidence that sustainable land use could be an important means to achieve climate change adaptation and further solve climate change problems.

1. Introduction

The increase in CO2 concentrations in the atmosphere due to the excessive use of land and fossil fuels is causing abnormalities in the carbon cycle of the Earth, which remained in equilibrium [1,2,3,4,5]. Urbanization is seriously affecting the terrestrial ecosystem [6,7,8,9,10] as one of the major social and scientific changes that have spread around the world [5,8]. Changes in land use due to urbanization are changing carbon storage patterns, releasing greenhouse gases into the atmosphere, and breaking the balance of the carbon budget [5,11,12,13]. The increase in development areas and population causes changes in meteorological factors [10,14,15], which accumulate and lead to climate change [16,17,18].
Urbanization has had a very significant impact on the terrestrial ecosystem as one of the important artificial factors affecting the climate [15,19]. Urbanization not only causes local climate change on daily, seasonal, and annual scales [20,21,22,23] but also increases extreme weather events [24,25,26,27]. Moreover, warming and extreme heat events due to urbanization and increased energy consumption are simulated to be as large as the impact of doubled CO2 in some regions [28]. In those respects, microclimate change due to urbanization could be regarded as climate change at a local level [29].
Local climate change in urban areas is known as urban heat island (UHI), which is increasing in intensity along with climate change. The urban heat island effect is characterized by higher air and surface temperatures in urban areas compared to surrounding rural areas [9,30,31]. The urban heat island phenomenon not only causes an increase in surface temperature but also increases energy and water consumption and environmental pollution, and greatly affects weather phenomena such as precipitation, frequency, and magnitude of flooding [18,21,32,33,34]. Increasing energy consumption due to urban heat island phenomena and increasing medical and social costs due to heat-related diseases such as heatstroke are also emerging serious problems [35,36].
Plant phenology is usually used as an indicator to monitor the response of ecosystems to climate change because they respond sensitively to meteorological factors such as temperature and precipitation [37,38,39,40,41,42,43,44,45]. The phenological characteristics of the plant are closely related to changes in weather factors [19,46,47]; the observation of long-term plant phenology conducted through many studies shows that climate change is affecting the development process of plants [48,49,50,51,52].
In the study of plant phenology, urban areas are important research areas because the potential effect of future climate change on plant development can be evaluated there [19,53]. Temperature increases due to the urban heat island effect can affect plant phenology, such as the start of growing season (SOS), end of growing season (EOS), and GSL (growing season length) [30,54,55,56]. It is very important to understand the effects of the urban heat island phenomena on plant phenology because urban heat island effects are similar to those of temperature changes expected in the near future [9].
The urban sprawl can influence the plant growth and timing of the developmental stage of plants by changing the environment [57]. Previous studies have showed that plant phenology events are influenced by urbanization [30,56,58,59]. Additionally, the growth period of a plant, determined by the unfolding and falling of leaves, is strongly affected by the UHI effect [21,60,61,62,63,64,65,66]. Changes in plant phenology caused by urbanization have been observed worldwide. According to [15], in the mid- and high-latitude areas of the northern hemisphere, the green-up dates of urban areas were 4–9 days earlier than those of rural areas. The authors in [67] found that the growth period of plants in an urban area was 7.6 days longer than that of rural areas in eastern United States broadleaf forests. The growth period of a plant was extended due to urbanization according to the results of many studies [15,64,68,69], most of which are linked to earlier growing dates [29]. In addition, since the leaf unfolding phenomena of the spring season shows distinct characteristics [38,67,70], plant phenology during the spring season could be the most suitable tool for monitoring climate change.
Recent research has identified significant shifts in plant phenology due to the interplay between urbanization, climate change, and the urban heat island effect, with studies across the northern mid-latitudes and China showing altered timing in the start and end of growing seasons [64,71]. Additionally, the response of plant phenology to urbanization has been shown to vary with regional temperature, indicating a complex interaction between climate gradients and urban heat islands [68,72]. Despite these advancements, there remains a significant gap in understanding the specific mechanisms driving these phenological shifts and their ecological consequences, particularly in the context of highly urbanized areas in East Asia. Moreover, the impacts of varying degrees of urbanization within a single metropolitan area on different plant species are still underexplored. Our study aims to bridge these gaps by focusing on the representative tree species in Seoul, South Korea, a city known for its pronounced urban heat island effect. By analyzing spatial differences in plant phenology relative to urbanization degrees, we aim to contribute to elucidating the underlying mechanisms, offering insights for ecosystem management and adaptation strategies to climate change, and enriching the global discourse on urban ecology and phenological change. Although many studies have been conducted on the change in the plant phenology response due to urbanization effects, few studies have been conducted on the response of plant phenology to various levels of urbanization at a fine scale within the urban domain. Therefore, it is necessary to focus on the phenology response to various levels of urbanization using a fine scale. This study aims to identify spatial differences in plant phenology according to the degree of urbanization based on the plant phenology data collected in various areas of Seoul, which show an extreme heat island effect, and to present ecosystem management strategies for climate change adaptation based on the data. To arrive at this goal, we collected data on the phenology of Mongolian oak, cherry, and abnormal growth of Korean red pine seen in various locations with different land use intensities. Therefore, it is necessary to focus on the phenology response to various levels of urbanization using a fine scale. This study aims to identify spatial differences in plant phenology according to the degree of urbanization based on the plant phenology data collected in various areas of Seoul, which show extreme heat island effects, and to present ecosystem management strategies for climate change adaptation based on the data.

2. Materials and Methods
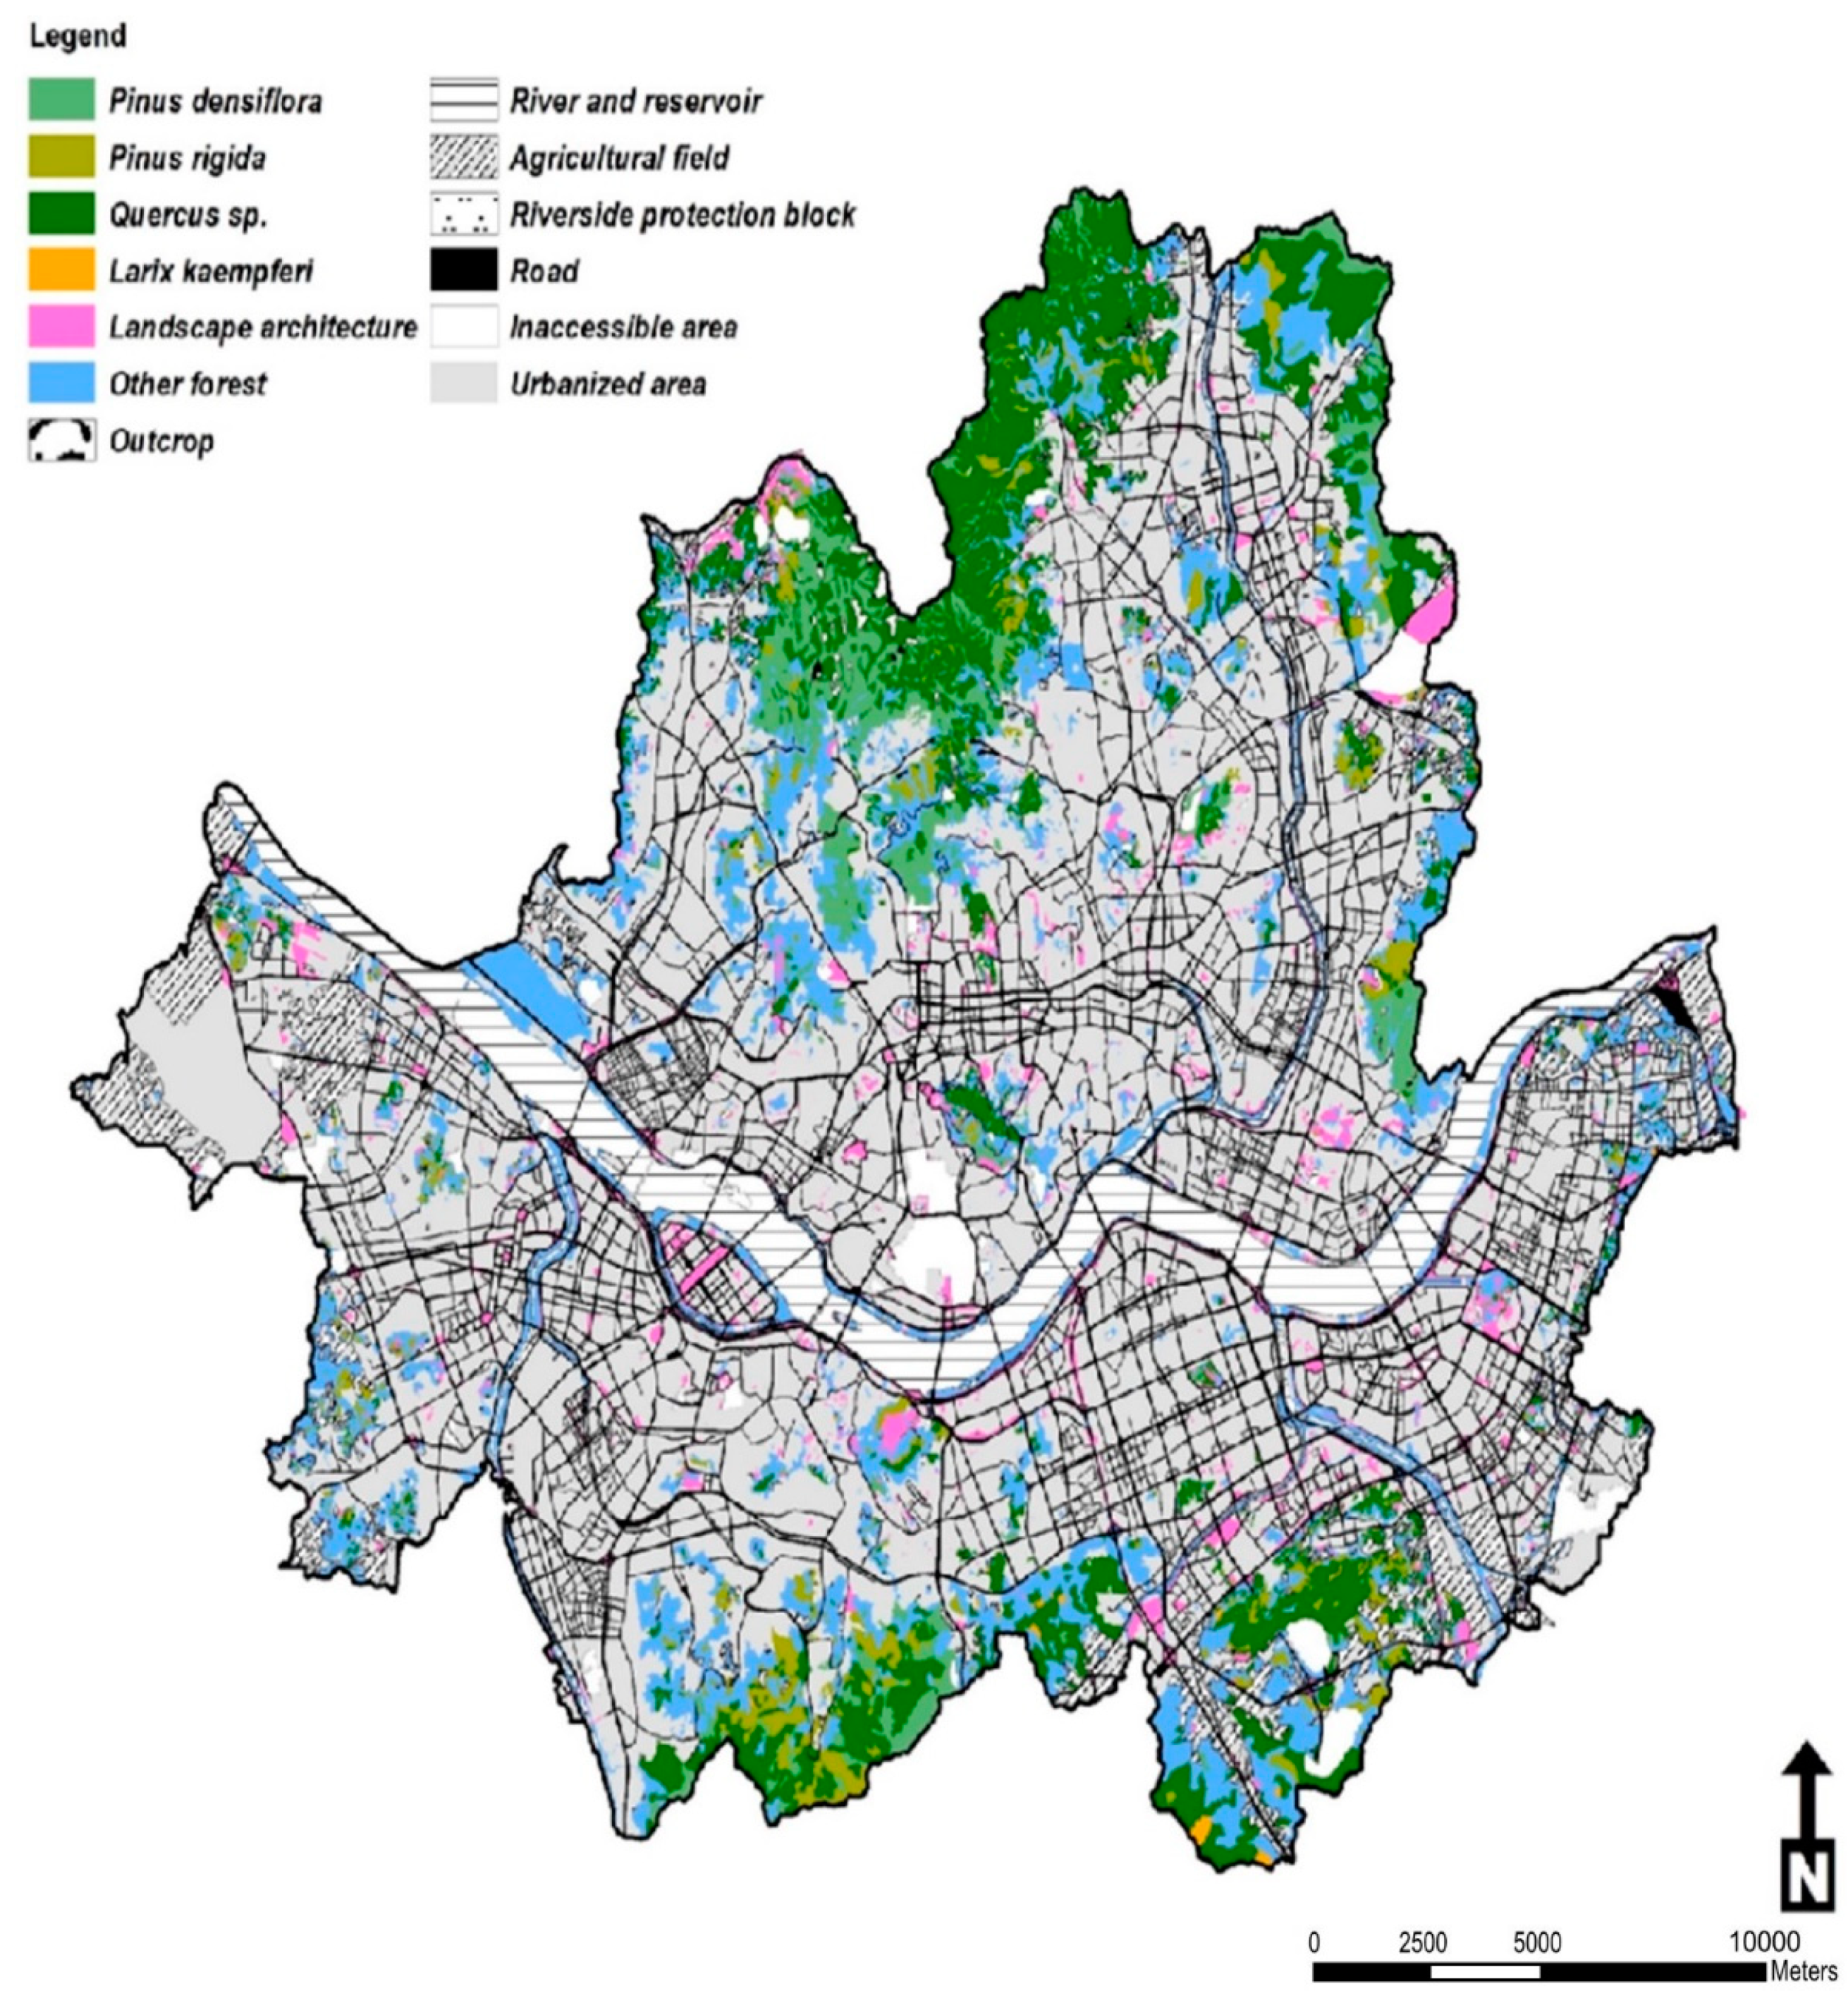
2.1. Study Area

This study was carried out in Seoul, the capital with the most extensive and long urbanization history in Korea. This investigation aims to elucidate the impacts of varying land use intensities on plant phenology. For this purpose, Mongolian oak, a species with a broad distribution, was selected as the primary subject of study. Additionally, cherry and pine trees were chosen as comparative species (Figure 1).
To compensate for the resolution of large-scale MODIS satellite images, the mountain with a high occupancy ratio of Mongolian oak forest among the mountains in Seoul was selected as the study site. The study sites shown on the map represent the place where the widest Mongolian oak community is located within the selected mountain.

2.2. Land Use Pattern in Seoul

Based on the landscape ecological map generated for Seoul, the urban area occupied, at its widest, 60.8% of the total area, followed by secondary forests (12.7%), plantations (8.6%), river and reservoir (5.6%), landscape architectural plantation (4.5%), agricultural fields (2.5%), grasslands (2.4%), inaccessible area (2.3%), and bare ground (0.7%) (Figure 2). Forests, which are composed of secondary forests and plantations and agricultural fields, were usually concentrated to the city’s fringe, and the urban center had little vegetation. Moreover, vegetation in the urban center was of low ecological quality, as most was fragmented into small patches and consisted of species introduced by landscape architects without ecological consideration or exotic plants [73,74]. Therefore, green space showed severe imbalanced spatial distribution (Figure 2).

2.3. Calculation of Urbanization Ratio

The urbanization ratios at the designated study sites were quantified by analyzing the biotope map of Seoul. These ratios were calculated using ArcGIS 10.1 software (ESRI, Redlands, CA, USA), defined as the proportion of urbanized land to the total land area within a 5 km radius from each study site.

2.4. Analysis of Phenology Based on Satellite Image

This research targeted Quercus mongolica Fisch. ex Ledeb., a predominant species in the deciduous broad-leaved forests of Korea, known for its sensitivity to temperature increases associated with climate change [56]. Growing at higher altitudes in South Korea, this species experiences pronounced phenological shifts. Utilizing remote sensing data, the study delineated the annual phenological cycle into four distinct stages: green-up, maturity, senescence, and dormancy (Figure 3) [17,56,61]. Phenological signals are minimal during the dormancy phase, escalating sharply during green-up, stabilizing at high values in maturity, and then declining significantly in the senescence phase, eventually returning to the lowest levels as dormancy recommences. The inflection points on the phenological signal curve, indicative of rapid curvature changes, denote the commencement of each stage [17]. The methodology also encompasses a formula for calculating the curvature K value at these inflection points:
f ( t ) = a + c 1 + e x p ( a + b t ) + d
K = f ( t ) ( 1 + ( f ( t ) ) 2 ) 3 2
where t is time, c is the amplitude of the increase or decrease in green value, d is the baseline value of the dormant season, and a and b control the lower and upper limits of the function [17,64,65,68].

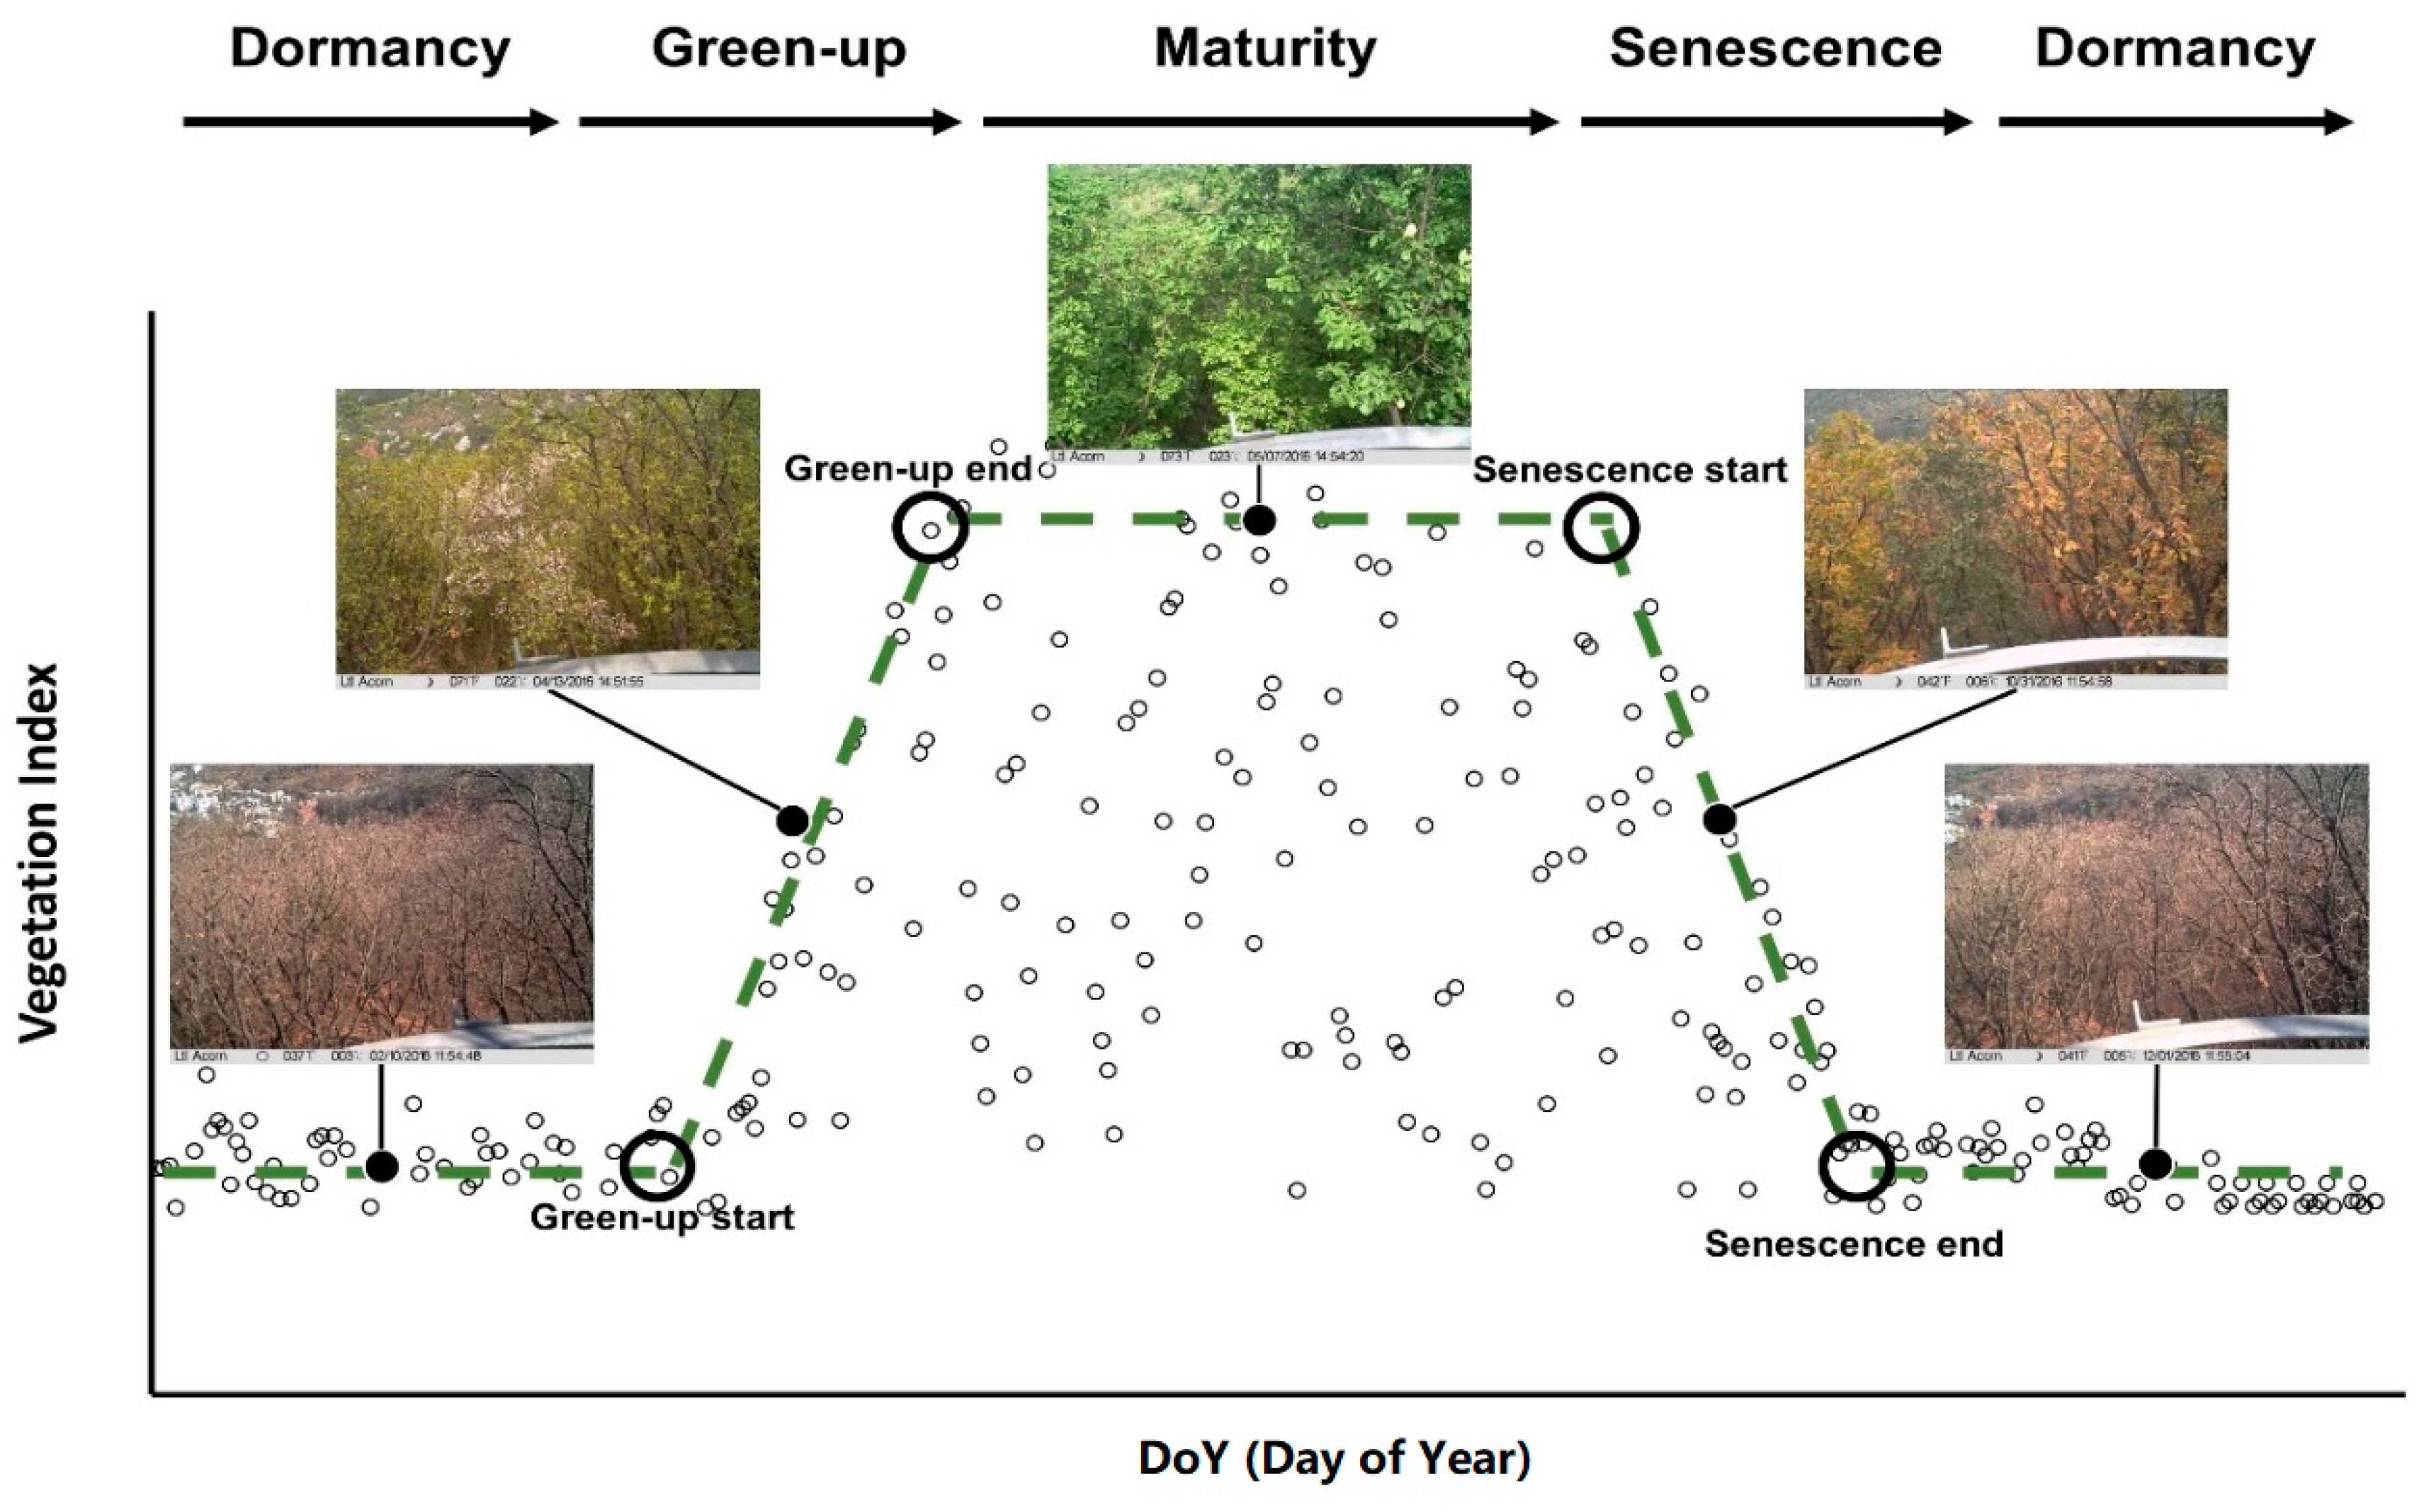
2.5. Calculation of Vegetation Index

The MOD09GA dataset includes seven spectral bands, covering visible and near-infrared light. MODIS EVI calculations use red (Band 1: 620–670 µm), green (Band 4: 545–565 µm), blue (Band 3: 459–479 µm), and near-infrared (Band 2: 841–876 µm) bands. The Enhanced Vegetation Index (EVI) used in the vegetation index makes improvements to traditional indices by reducing spatial variations, especially in diverse regions, using the blue band. This enhances its ability to detect seasonal changes in vegetation and canopy characteristics [60]. The specific formula applied for EVI computation in this analysis is as follows:
EVI = 2.5 × (ρNIRρRED)/{ρNIR + (6 × ρRED − 7.5 × ρBLUE) + 1}
where ρNIR, ρRED, and ρBLUE are values in the near-infrared, red, and blue bands. MODIS satellite images were reprojected to TM (Transverse Mercator) coordinates because they use sinusoidal projection. Based on the extracted data, the EVI for each study site was derived. Subsequently, the EVI was derived by employing the smooth curve fitting technique to mitigate variations and extract trends, as interpretational errors may arise from data inaccuracies and weather-related fluctuations [17]. In this study, the EVI was smoothed to the 80th percentile utilizing an exponentially weighted moving average (EWMA). The EWMA was defined as follows:
St = α × Yt + (1 − α) × St−1 (t > 1, S1 = Y1)
where t is the day of the year (DoY); St is the EWMA value at the DoY; Yt is the EVI value at the DoY; and α is the smoothing coefficient.
Phenological signal curves were derived using the calculated EVI, and the inflection point K, where the value increases rapidly, was confirmed as the green-up date.

2.6. The Flowering of Cherry

In order to investigate the flowering dates of cherry trees, a location with the presence of more than three cherry tree individuals was chosen as the research site. The flowering dates were determined by selecting three individual trees from each site (refer to Figure 1). The flowering date of cherry tree was set as the time when three or more flowers bloomed per tree. The flowering dates of the cherry trees were then interpolated using the Inverse Distance Weighted (IDW) model.

2.7. The Abnormal Growth of Korean Red Pine

Lammas growth is shoots that form after a pause in summer growth [76]. However, often, Lammas growth continues from late summer through to fall and into winter, showing different characteristics from typical Lammas growth. We identified this specific phenological event as abnormal growth.
To assess the frequency and length of abnormal shoot growth in Korean red pine (Pinus densiflora), 40 survey sites were selected (Figure 1). The frequency of abnormal shoot growth was calculated as the proportion of branches exhibiting abnormal shoots relative to the total branch count. The length of the shoots was measured on branches at the third node from the apex. These measurements were conducted using a tape ruler with millimeter precision on three branches from three trees selected at random. Specifically, the terminal shoots on each branch were measured [15,67]. The frequency and length of the abnormal shoots in Korean red pine were then interpolated using the Inverse Distance Weighted (IDW) model.

2.8. Collection and Analysis of Meteorological Data

The monthly mean temperature was determined from temperature data collected in ten-minute intervals from 1997 to 2021 at Automatic Weather Stations (AWSs) (refer to Figure 1). These data were then recalculated to ascertain the mean temperature for each season: spring (March–May), summer (June–August), autumn (September–November), and winter (December–February). This allowed for an analysis of seasonal mean temperature variations. The air temperature data from each AWS were interpolated using the co-kriging (CK) model (Figure 3).

2.9. Statistical Analysis and Mapping

The statistical analysis was carried out using SPSS 19 (IBM Corp, Armonk, NY, USA) and Excel (Microsoft Office 2010, Microsoft Corp., Redmond, WA, USA). Maps were constructed by utilizing the Arcgis 10.1 program. Data were visualized by applying the ‘ggplot2’ package of R program 4.2.2 (R Core Team, Vienna, Austria) [77].

3. Results

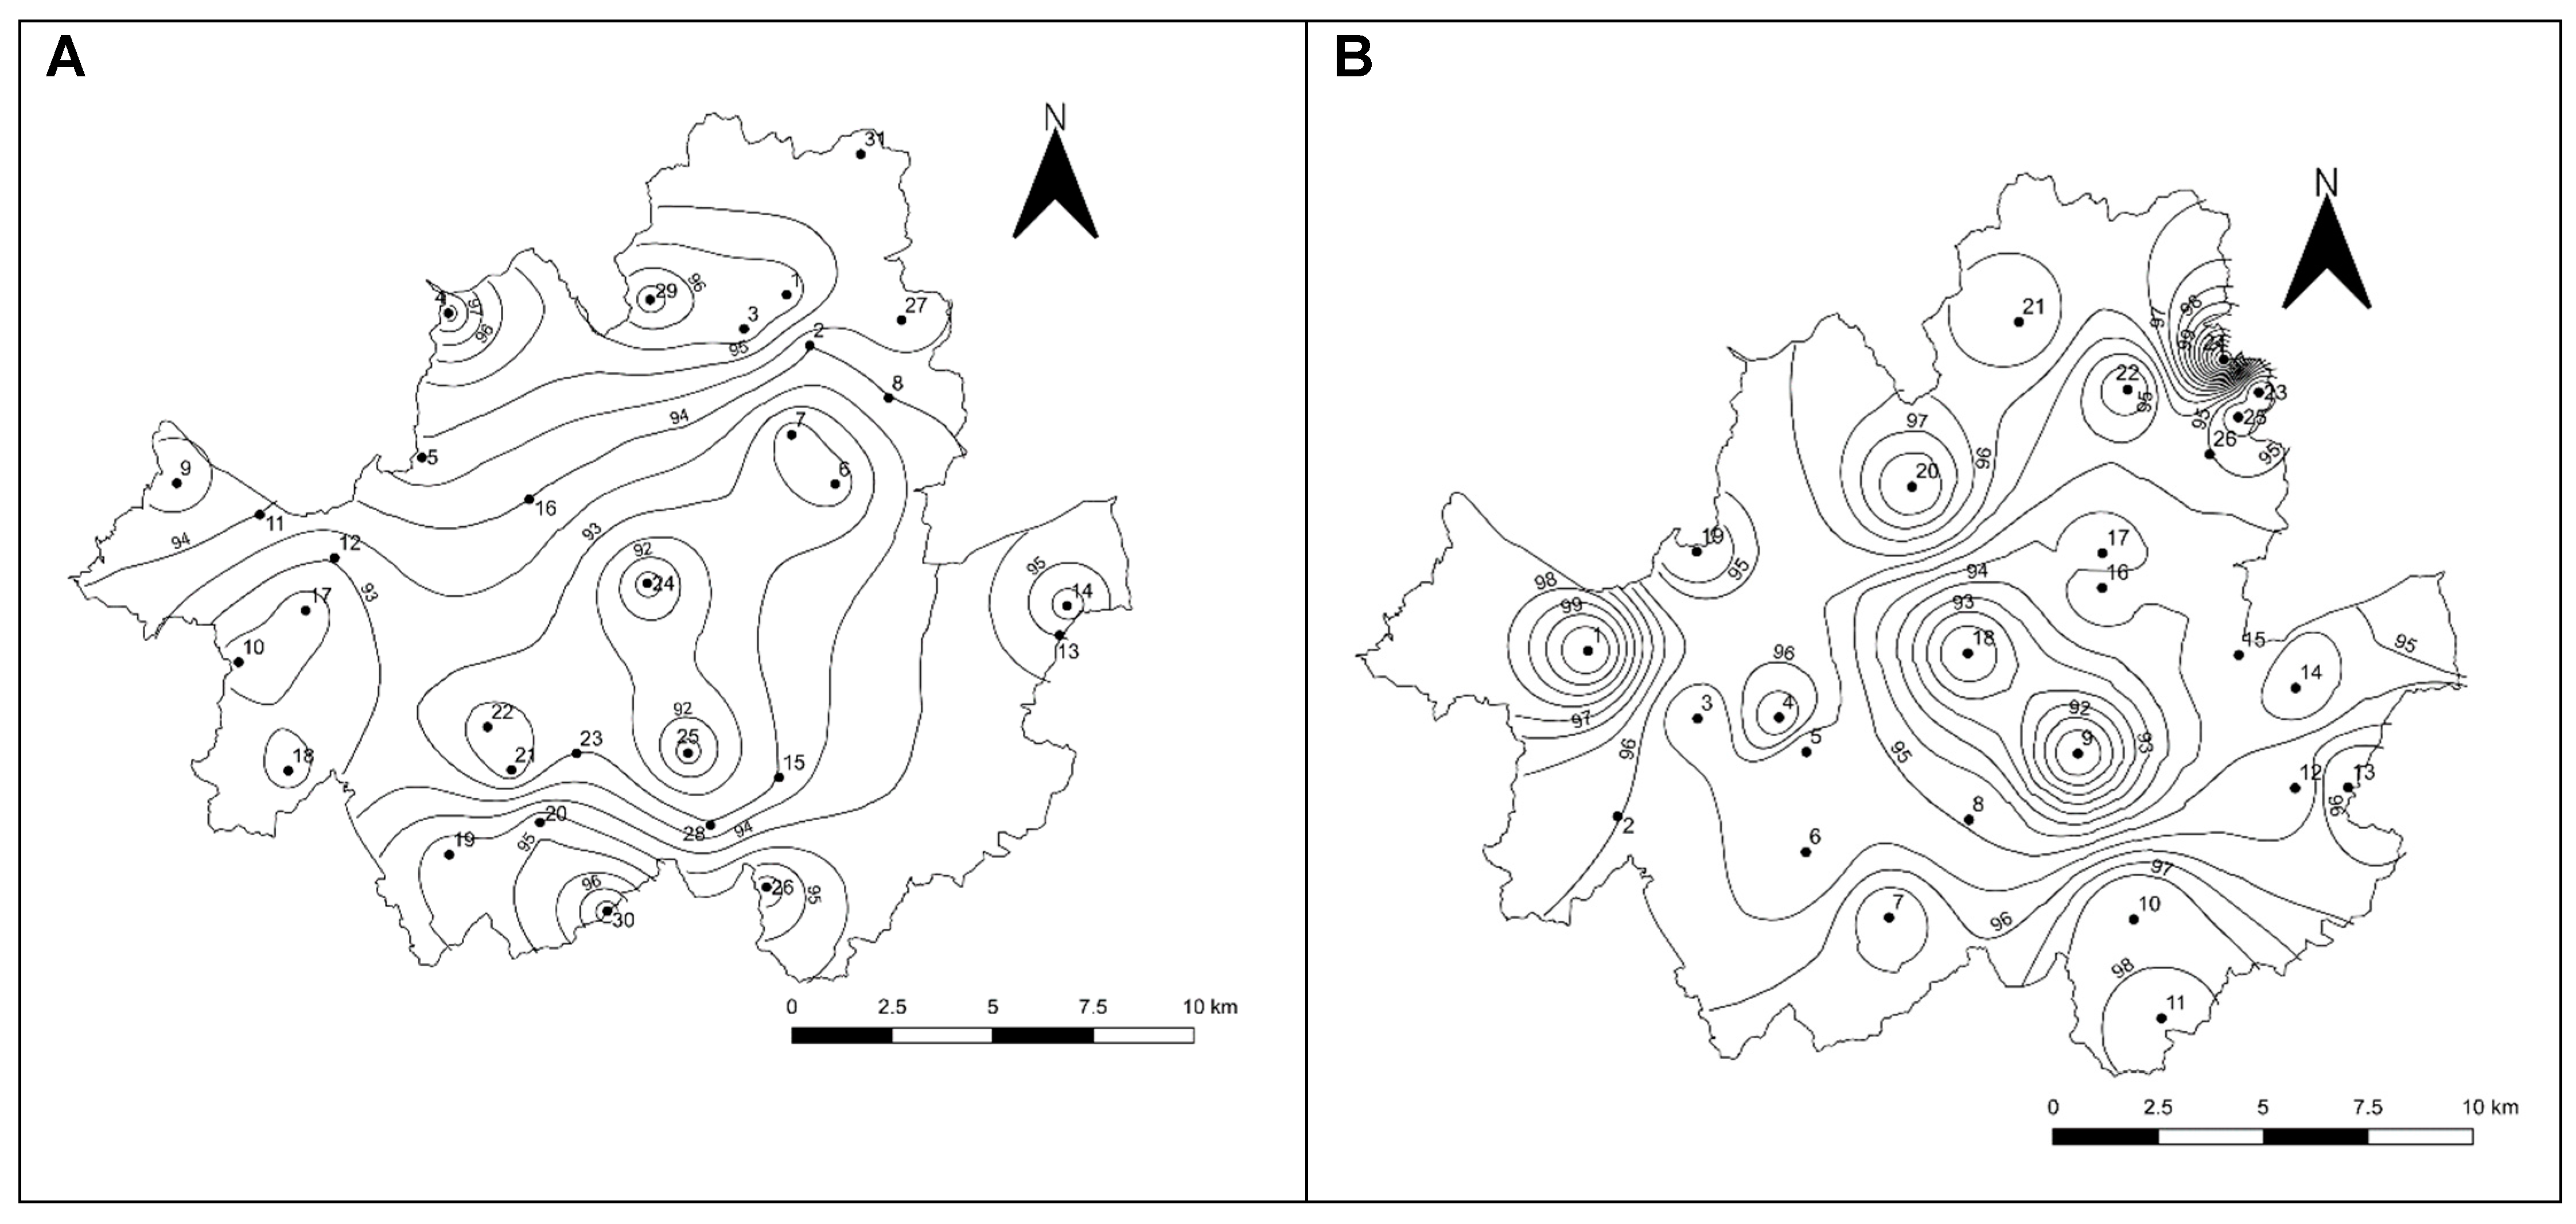
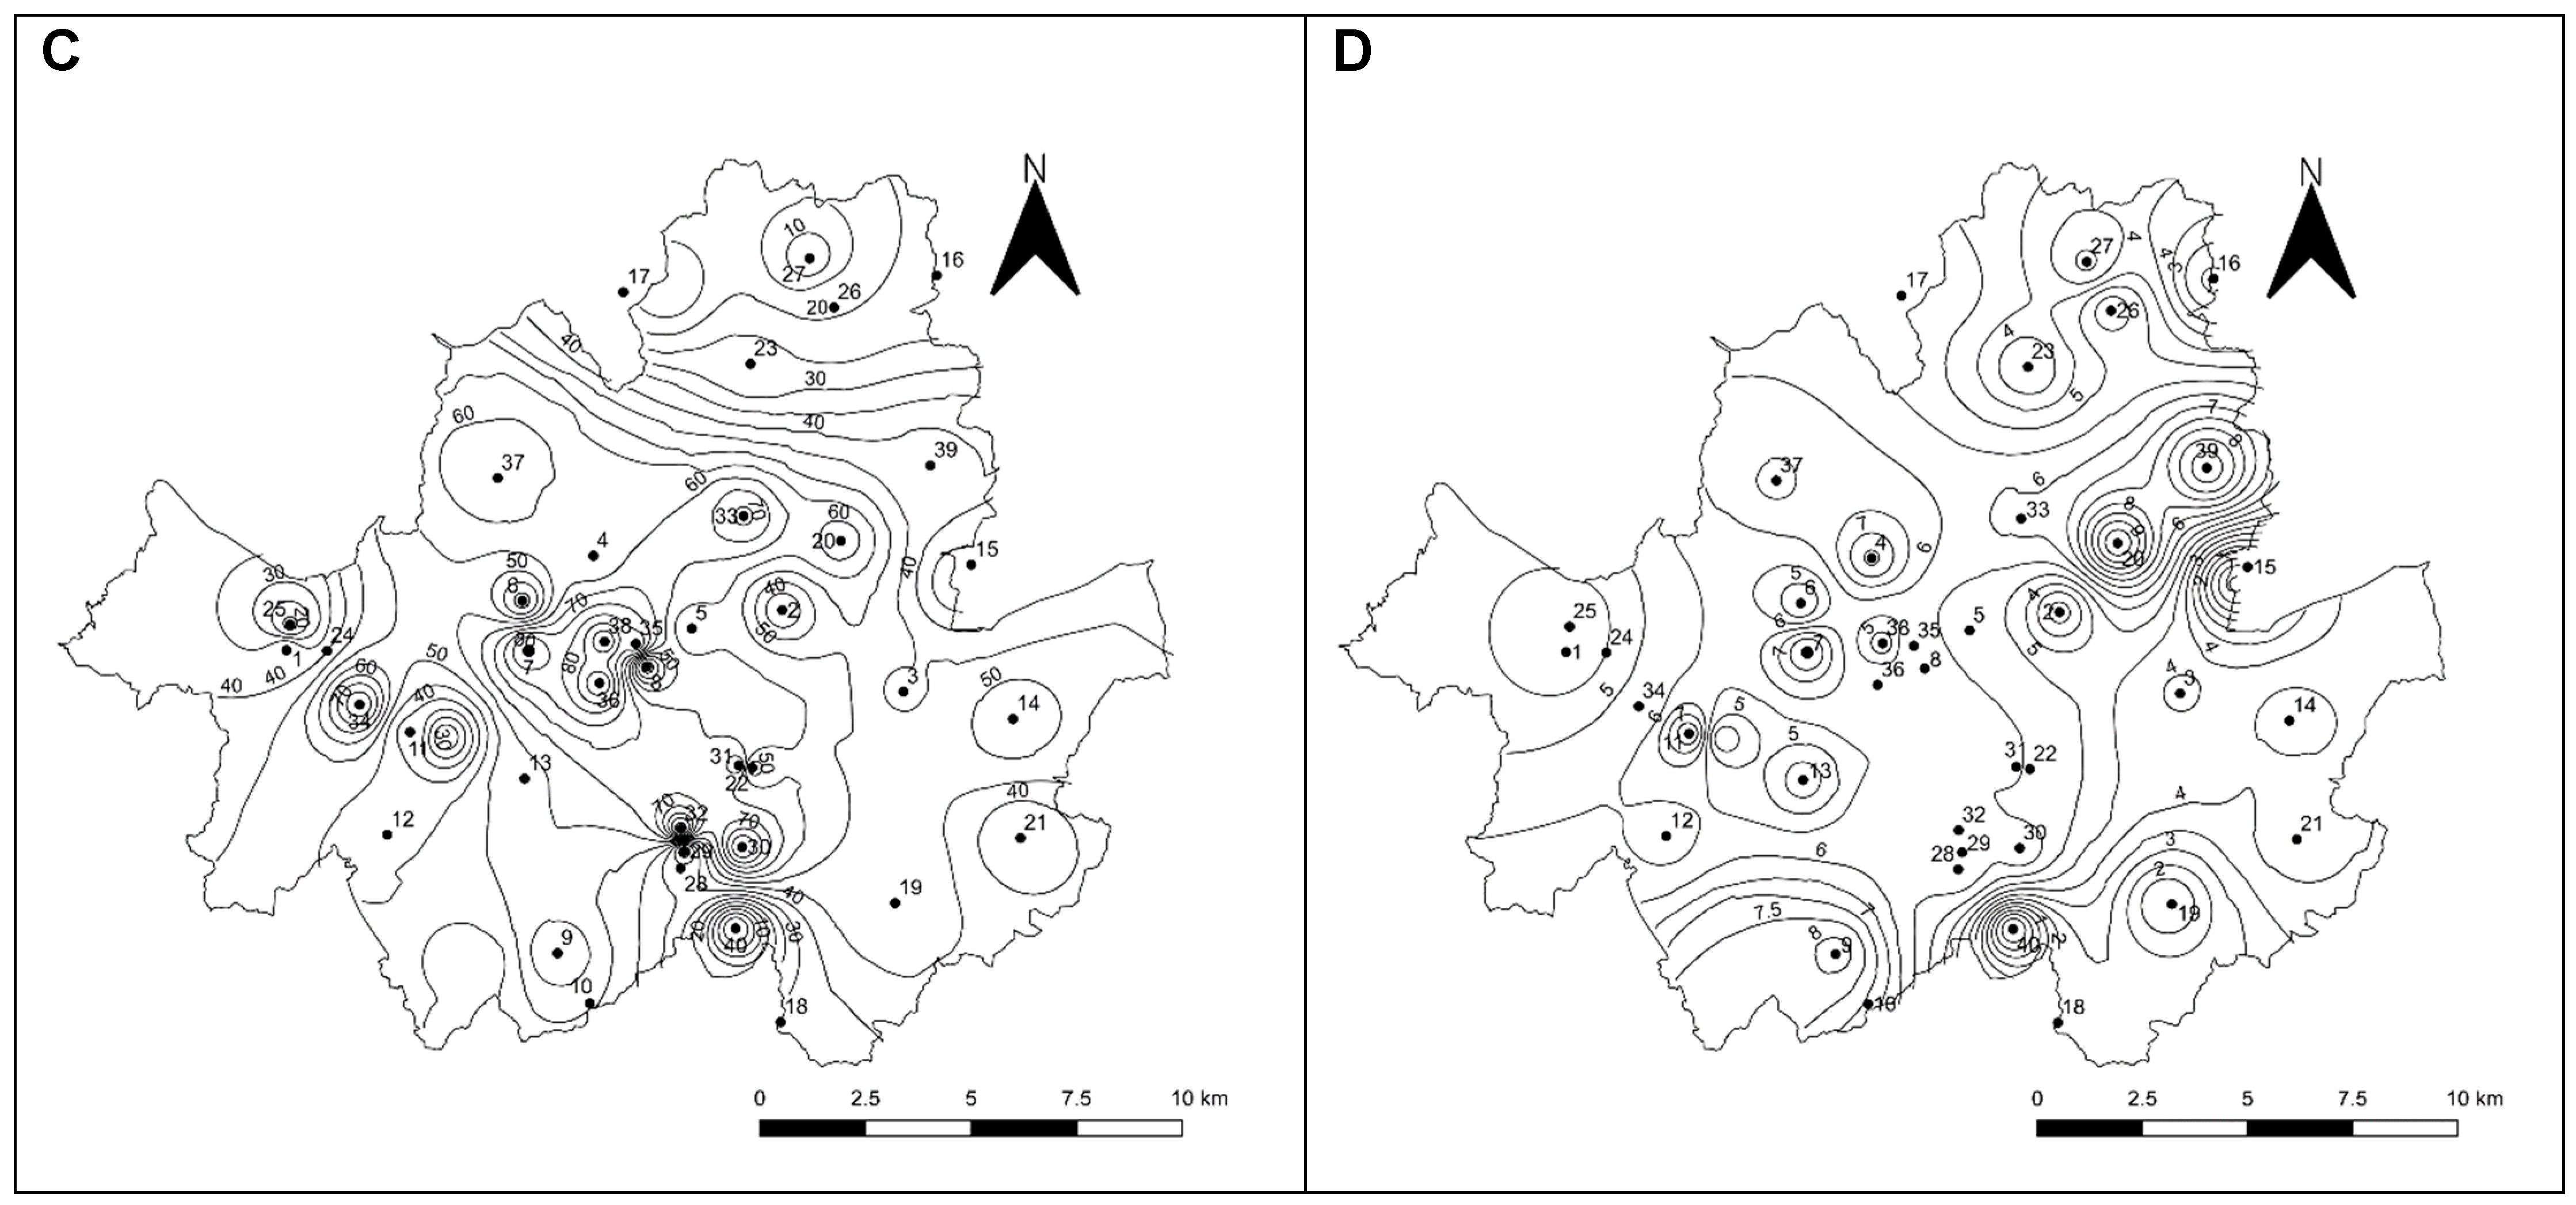
3.1. The Spatial Distribution of Plant Phenology

The green-up dates of Mongolian oak appeared between DoY 91 and 98. In the isopleth map, the green-up date of the Mongolian oak in Seoul was expressed; the date was earlier in the urban center, and it was delayed as it moved toward the outskirts (Figure 4).
The cherry blossom dates appeared between DoY 91 and 98. In the isopleth map, the flowering date of the cherry in Seoul was expressed; the date was earlier in the urban center and tended to be delayed as it moved toward the urban outskirts (Figure 4).
The frequency of abnormal shoots of Korean red pine was higher in the urban center, and the trend tended to decrease as it moved toward the urban outskirts, and the length of the abnormal shoots tended to be similar to the frequency (Figure 4).

3.2. Correlation between Phenology in Different Plants

As a result of analyzing the correlation between the leaf unfolding date of the Mongolian oak, the flowering date of the cherry, and the frequency and length of the abnormal shoot of the Korean red pine trees, there was a significant correlation between the phenology of all the plants (Table 1).

3.3. The Spatial Distribution of Air Temperature within Seoul City

Figure 5 shows the spatial distribution of the air temperature in Seoul measured in the automatic weather station. The air temperatures were higher in the urban center formed along the Han River and tended to lower as they moved toward the urban outskirts of Seoul. A relative cold area was observed in mountainous areas, which are near the borderline of Seoul, except the southwestern and southeastern borderlines where the sprawling expansion of urbanization has already progressed. Such a spatial distribution of air temperature is closely linked to the land use pattern (Figure 5).

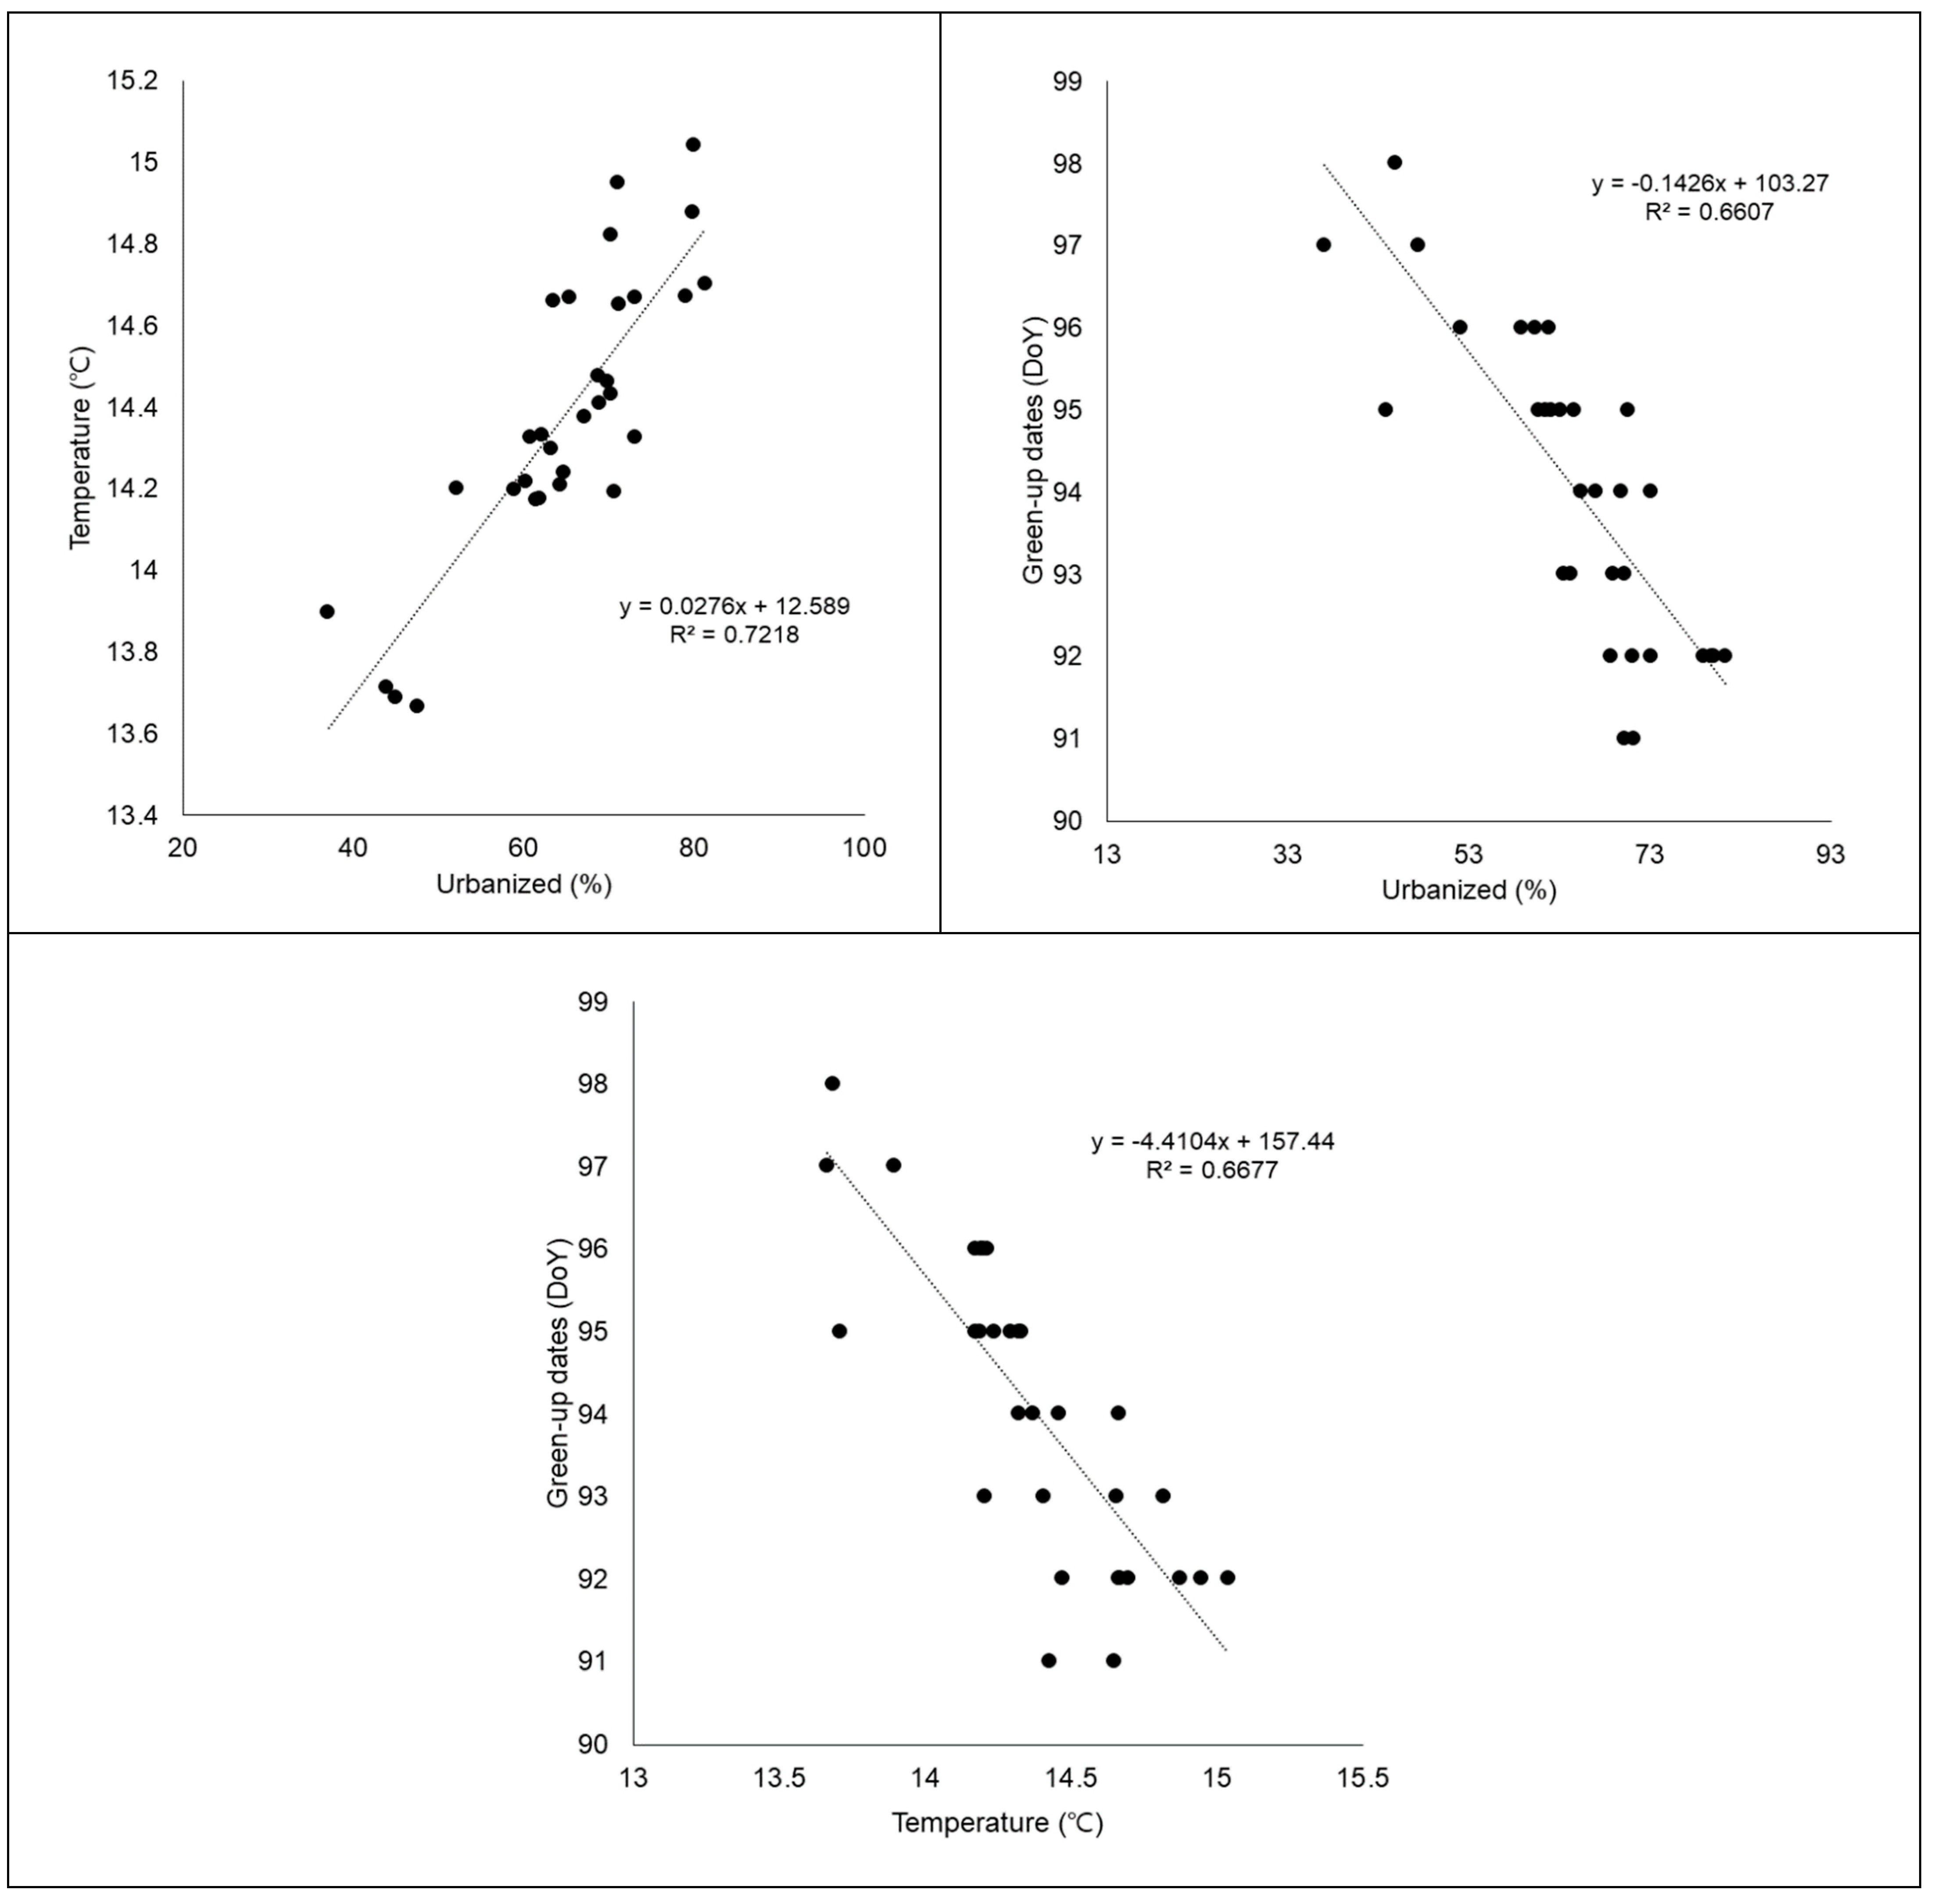
3.4. Relationship between Urbanization Rate and Air Temperature

The urbanization rate of the study sites showed a significant positive correlation with air temperature (p < 0.01) (Figure 6). On the other hand, the leaf unfolding date of the Mongolian oak showed a significant negative correlation with both the urbanization ratio and air temperature (p < 0.01) (Figure 6).

4. Discussion

4.1. Difference in Plant Phenology among Study Sites with Different Urbanization Ratio in Seoul

Climate change can have a great influence on plant phenology as the seasonal events of plants are very sensitive to environmental changes such as temperature changes [38]. Local climate change due to urbanization is causing significant changes in plant phenology [29]. In China, as the Land Surface Temperature (LST) rises by 1 °C, the SOS was advanced by 9–11 days, and the EOS was delayed by 6–10 days [69]. In eastern North America, SOS was shown to advance by three days as the mean temperature rose by 1 °C [15]. In Seoul, the flowering date was advanced by up to 13 days for 20 years between 1991 and 2010, and the falling of leaves during the fall season was delayed by up to 15 days [70]. Cherry has bloomed 8–16 days earlier for the past 100 years in several urban areas of South Korea [29], and the germination and flowering date of 10 common trees in Korea was advanced by 4 to 16 days for about 60 years from 1945 to 2007, and the peak period of leaf coloring was delayed by 7 to 8 days for about 20 years from 1989 to 2007 [78].
In this study, the leaf unfolding date of the Mongolian oak was the earliest in the urban center and slowed down as it approached the urban outskirts (Figure 4). These results were confirmed to be due to the temperature difference caused by the difference in the urbanization degree of each study site (Figure 5). These results showed similar trends to the differences in the occurrence frequency and length of the abnormal shoot in the Korean red pine and the cherry blossom date among sites with different urbanization degrees in Seoul (Table 1).
The cherry blossom dates differed by one to two weeks between urban centers, where greenery spaces were largely scarce, along with the urban outskirts in Seoul (Figure 4). According to a study by Song and Lee [79], the cherry blossom date in downtown Seoul coincided with the cherry blossom date in Gumi, which is located about 200 km south of Seoul. This result could be interpreted in the way that the climate characteristics of downtown Seoul are becoming similar to those of the southern part of the Korean Peninsula due to the urban heat island effect. It was found that the air temperature of downtown Seoul and the outskirts of the city temporarily showed a difference of about 10 °C [80], and an annual mean of 5 °C [81].
In the past, the abnormal shoot growth of the Korean red pine was rarely observed in seedlings cultivated in nurseries. However, the frequency of the abnormal shoot growth of the Korean red pine has increased recently, and it is easily observed throughout South Korea. Abnormal shoot growth may be caused by a variety of factors, but most of them have been known to be associated with late summer rain [76] or warm weather [82]. The abnormal shoot growth of the Korean red pine showed a higher frequency and longer length in urban centers with relatively higher temperatures compared to the urban outskirts (Figure 4). Looking at these results, it is judged that the temperature increases due to urbanization increased the frequency of abnormal shoot occurrence and promoted length growth in Korean red pine.
The early flowering of plants increases the probability of suffering frost damage, affecting the pollen formation and reproduction of plants [78]. Changes in flowering period can also have a very negative impact on the pollination process [83]. Differences in plant phenology between urban and natural areas can lead to reproductive isolation, especially in plants with short flowering periods [56] and those that block or limit gene flow between both areas and accelerate species differentiation [84].
Differences in plant phenology depending on the degree of urbanization identified through this study can be an important basis for proving the impact of urbanization on climate change and assessing the potential impact of urbanization-induced climate change on plant life history in the future. Furthermore, the results of this study are expected to serve as important information in developing climate change adaptation strategies.

4.2. Effects of Urbanization on Climate Change

Although attention is focused on greenhouse gas emissions as a factor affecting climate change, changes in land use due to urbanization also have a significant impact [85]. A study by Fujibe [86] shows that the urban heat island effects in some regions had a greater impact on climate change than greenhouse gases. Urbanization can change ecosystem processes such as the carbon cycle by increasing the mean daily CO2 concentration in the atmosphere of urban areas, and land use changes and increased impermeable surfaces due to urbanization can increase local temperatures [87,88,89]. Urbanization increased the mean daily (24 h) atmospheric CO2 concentration compared with rural areas. The daily temperature increased by 0.6–0.7 °C, 1.0–1.1 °C, and 1.9 °C in semirural, suburban, and urban sites, respectively [90]. In other words, the degree of temperature increase responded to the intensity of land use.
In urban areas, the population is concentrated, and the heat island phenomenon occurs frequently due to the resulting increase in land use intensity. On the other hand, urban sprawl can lead to local climate change by cutting down more forests, destroying habitats, and causing greenhouse gas and carbon emissions [9,12,13,61]. Cities are usually exposed to severer climate change due to local effects such as greenhouse gas-induced radiative forcing and urban heat island effects, and warming and extreme high temperatures caused by urbanization and increased energy consumption have been shown to be as significant as the effects of doubled CO2 levels in some areas [28]. In Korea, from 1971 to 2000, the daily minimum, maximum, and mean temperatures all rose due to the rapid increase in the urbanization rate and population [91]. In particular, in the case of Seoul, where the population density is high and residential and commercial facilities are concentrated, the number of tropical days with a maximum temperature above 30°C has been on the rise since 1970 [92].
Cities are often referred to as urban heat islands, with the urban center having the highest temperatures. This is primarily due to the low amount of vegetation in urban center compared to the suburbs and beyond (Figure 2). Cities also use large amounts of energy, and emit this energy as waste heat, further exacerbating the urban heat island effect. On the other hand, forests and other vegetation types use large amounts of solar energy and evaporate water by means of transpiration to cool leaf surfaces. Evaporative water used through transpiration also contributes to reducing air temperatures in urban areas. Forests and other vegetation can also contribute indirectly to temperature reduction by reducing urban energy consumption through intercepting and using solar energy and by reducing building energy demand through shading and reducing wind speed. Therefore, low vegetation coverage in urban center results in larger temperature gradients between the urban center and urban fringe or beyond [93,94,95]. Indeed, Seoul’s heat island effect is very large [96,97], as the temperature difference between the urban center and boundary was about 5 °C (Figure 4). The urban heat island is closely linked to the land use pattern (Figure 3).
Urbanization is progressing at an unprecedentedly rapid rate, and the resulting climate change is showing the same trend [98,99]. This rapid and uncontrollable acceleration of urbanization has led to environmental degradation, causing pollution as well as unpredictable climate patterns [99,100,101,102]. These environmental changes in cities do not only influence the city itself. In particular, climate change caused due to urbanization is expanding on a global scale [5,8,98]. The loss of vegetation due to urbanization not only causes a decrease in biodiversity but also affects the cycle of water, nitrogen, and other factors, as well as the reduction in biodiversity [4,5,103]. The loss of or reduction in vegetation can also increase CO2 emissions, further deepening microclimate changes in the region, which in turn can accelerate climate change around the world [5].

4.3. Ecosystem Management for Climate Change Adaptation

It is widely recognized that land use is affecting the global climate [104]. Land use and land cover changes (LULCCs) and land management changes (LMCs) modify the physical–chemical and biological processes by altering land surface, resulting in climate change. Depending on socioeconomic drivers and regulatory policies at various levels (local, regional, national, or transnational), human activities interfere with land, resulting in different levels of land use, such as nature, semi-nature, agriculture, urban, and semi-urban areas. In particular, densely populated urban areas can lead to significant environmental impacts, including climate change, due to intensive land use. A further review of the relationship between the two is needed to reveal the impact of land use on climate change, and it is absolutely necessary to prepare a correct climate change adaptation strategy in the future [105].
Environmental degradation from land transformation can cause negative feedback pathways in the ecosystem. For example, massive deforestation in an area can disrupt the carbon cycle of the area. It is widely known that excessive land use, along with the excessive use of fossil fuels, increases the concentration of carbon dioxide in the atmosphere and consequently leads to climate change today. According to the results of a study at the national level in Korea, the intensity of land use by local governments was significantly correlated with the increase in local temperature and carbon budget [106]. As shown in the results of this study (Figure 4, Figure 5 and Figure 6), even at the local level, the increase in temperature tends to be proportional to the land use intensity, and the phenology of plants affected by climate also responded to such changes.
It has been confirmed from various examples that it is closely related to climate change and land use intensity. Climate change can alter weather patterns and affect the disturbance regime. In consequence, climate change is expected to increase disturbance, resulting in ecosystem disturbance [11,107]. This intense disturbance would cause even more disturbance in the ecosystem, worsening the carbon budget and aggravating climate change. It would cause negative feedback effects in so-called climate change. In this context, measures are required to curb climate change through the restoration of damaged ecosystems [105].
Natural areas with a high degree of ecological integrity can better buffer the impacts of climate change [108,109,110]. Therefore, restoring degraded nature as well as conserving existing nature can contribute either to the mitigation or adaptation of climate change [105,111]. Ecological restoration, particularly in terms of the reforestation and restoration of degraded land, is often recognized as one of the important responses to climate change because such activities help influence the planet’s carbon budget in a positive way [105,106,112,113].
Many actions can be taken to mitigate climate change. We can adopt the conservation and restoration of natural ecosystems as a strategy that enables humankind to adapt to climate change impacts [114,115,116]. Natural resources can also help us to adapt to the impacts of climate change that we are already experiencing [114,117,118]. Sound natural systems help us adapt to climate change by absorbing and storing carbon. In fact, it is estimated that approximately 20% of greenhouse gas emissions result from deforestation and forest degradation. Therefore, conserving forests can store substantial amounts of carbon [119,120,121,122,123]. Conserving and sustainably managing our terrestrial and aquatic ecosystems can lead to obtaining the necessary rapid results in order to mitigate climate warming. Even at the small scale of the site level, we can use vegetation to reduce energy use and create thermally pleasant environments by creating shade from the hot summer sun and encouraging evapotranspirational cooling [124,125,126,127]. Jung et al. [128] found that the improvement in land use patterns by the creation of an urban park and a park fountain impacted both the occurrence and the growth of abnormal shoots in the Korean red pine. They interpreted that their results are due to the cooling effects of evapotranspiration from vegetated landscapes and evaporation from a water body.
As we understand the ecological functions that create surface climates and the specific landscape features that alter these functions, we can make the climate favorable for us by taking advantage of natural landscape processes. The field of land use planning that deals with these topics is contributing to climate change adaptation by creating a design in harmony with the environment [125,126,129,130,131,132,133].

5. Conclusions

The urban heat island phenomenon not only causes an increase in surface temperature but also increases energy consumption and promotes climate change. Urbanization not only causes local climate change on a daily, seasonal, and annual scale but also increases extreme weather events. Moreover, warming and extreme weather events due to urbanization and increased energy consumption are simulated to be as large as the doubled CO2 effects in some regions. In those respects, microclimate change due to urbanization could be regarded as climate change at a local level.
Urbanization also changes ecological processes such as the carbon cycle, increasing the CO2 concentration in the atmosphere (CO2 dome formation). In this respect, the urban area is an important research area where the potential effect of future climate change can also be evaluated. Plant phenology is usually used as an indicator to monitor the response of climate change to ecosystems because they respond sensitively to meteorological factors such as temperature and precipitation. The phenological response of the plants we studied well reflects the local microclimate changes caused by urbanization.
The response shown by the phenology of plants as an indicator of climate change is expected to be an important reference in preparing urban plans to buffer climate change and achieve climate change adaptation in the future. In fact, climate change is not only a global issue but also a local issue. The importance of action at the local level is emerging as a means to secure sustainability at the global level. As the urban nature of consumption and production practices is becoming stronger these days, this call for action is often interpreted as the need to achieve the sustainable development of cities. To achieve urban sustainability, environmental performance has to be improved to not only improve environmental quality within these boundaries but also to reduce the transfer of environmental costs to other people, other ecosystems, or the future. This fact suggests that addressing climate change should be a key component of urban sustainable development.

Author Contributions

Conceptualization, C.-S.L., A.-R.K. and C.-H.L.; methodology, A.-R.K. and C.-H.L.; software, A.-R.K., B.-S.L. and C.-H.L.; validation, G.-S.K. and C.-S.L.; formal analysis, A.-R.K. and C.-H.L.; investigation, A.-R.K., J.S., B.-S.L. and G.-S.K.; data curation, A.-R.K. and C.-H.L.; writing—original draft preparation, A.-R.K. and C.-S.L.; writing—review and editing, A.-R.K. and C.-S.L.; visualization, A.-R.K. and J.S. All authors have read and agreed to the published version of the manuscript.

Funding

This work was supported by a grant (Project No.: FE0100-2021-01) from the National Institute of Forest Science, Republic of Korea.

Data Availability Statement

No new data were created or analyzed in this study. Data sharing is not applicable to this article.

Conflicts of Interest

The authors declare no conflicts of interest.

References

  1. Amthor, J.S. Terrestrial higher-plant response to increasing atmospheric [CO2] in relation to the global carbon cycle. Glob. Chang. Biol. 1995, 1, 243–274. [Google Scholar] [CrossRef]
  2. Houghton, J. Global warming. Rep. Prog. Phys. 2005, 68, 1343. [Google Scholar] [CrossRef]
  3. Socolow, R.; Hotinski, R.; Greenblatt, J.B.; Pacala, S. Solving the Climate Problem: Technologies Available to Curb CO2 Emissions. Environ. Sci. Policy Sustain. Dev. 2004, 46, 8–19. [Google Scholar] [CrossRef]
  4. Kashiwagi, H. Atmospheric carbon dioxide and climate change since the Late Jurassic (150Ma) derived from a global carbon cycle model. Palaeogeogr. Palaeoclimatol. Palaeoecol. 2016, 454, 82–90. [Google Scholar] [CrossRef]
  5. Fu, Q.; Xu, L.; Zheng, H.; Chen, J. Spatiotemporal Dynamics of Carbon Storage in Response to Urbanization: A Case Study in the Su-Xi-Chang Region, China. Processes 2019, 7, 836. [Google Scholar] [CrossRef]
  6. Foley, J.A.; DeFries, R.; Asner, G.P.; Barford, C.; Bonan, G.; Carpenter, S.R.; Chapin, F.S.; Coe, M.T.; Daily, G.C.; Gibbs, H.K.; et al. Global Consequences of Land Use. Science 2005, 309, 570–574. [Google Scholar] [CrossRef]
  7. Grimm, N.B.; Faeth, S.H.; Golubiewski, N.E.; Redman, C.L.; Wu, J.; Bai, X.; Briggs, J.M. Global Change and the Ecology of Cities. Science 2008, 319, 756–760. [Google Scholar] [CrossRef]
  8. Lyu, R.; Clarke, K.C.; Zhang, J.; Jia, X.; Feng, J.; Li, J. The impact of urbanization and climate change on ecosystem services: A case study of the city belt along the Yellow River in Ningxia, China. Comput. Environ. Urban Syst. 2019, 77, 101351. [Google Scholar] [CrossRef]
  9. Meng, L.; Mao, J.; Zhou, Y.; Richardson, A.D.; Lee, X.; Thornton, P.E.; Ricciuto, D.M.; Li, X.; Dai, Y.; Shi, X.; et al. Urban warming advances spring phenology but reduces the response of phenology to temperature in the conterminous United States. Proc. Natl. Acad. Sci. USA 2020, 117, 4228–4233. [Google Scholar] [CrossRef]
  10. Qiu, T.; Song, C.; Li, J. Impacts of Urbanization on Vegetation Phenology over the Past Three Decades in Shanghai, China. Remote Sens. 2017, 9, 970. [Google Scholar] [CrossRef]
  11. Dale, V.H. The relationship between land-use change and climate change. Ecol. Appl. 1997, 7, 753–769. [Google Scholar] [CrossRef]
  12. Pielke, R.A. Land Use and Climate Change. Science 2005, 310, 1625–1626. [Google Scholar] [CrossRef]
  13. Ecology, N.I.E. Ecobank. Available online: https://www.nie-ecobank.kr/spceinfo/main.do (accessed on 12 February 2024).
  14. Seto, K.C.; Güneralp, B.; Hutyra, L.R. Global forecasts of urban expansion to 2030 and direct impacts on biodiversity and carbon pools. Proc. Natl. Acad. Sci. USA 2012, 109, 16083–16088. [Google Scholar] [CrossRef]
  15. Zhang, X.; Friedl, M.A.; Schaaf, C.B.; Strahler, A.H.; Schneider, A. The footprint of urban climates on vegetation phenology. Geophys. Res. Lett. 2004, 31, e020137. [Google Scholar] [CrossRef]
  16. TayanÇ, M.; Toros, H. Urbanization effects on regional climate change in the case of four large cities of Turkey. Clim. Change 1997, 35, 501–524. [Google Scholar] [CrossRef]
  17. Liu, J.; Niyogi, D. Meta-analysis of urbanization impact on rainfall modification. Sci. Rep. 2019, 9, 7301. [Google Scholar] [CrossRef]
  18. Chang, Y.; Xiao, J.; Li, X.; Frolking, S.; Zhou, D.; Schneider, A.; Weng, Q.; Yu, P.; Wang, X.; Li, X.; et al. Exploring diurnal cycles of surface urban heat island intensity in Boston with land surface temperature data derived from GOES-R geostationary satellites. Sci. Total Environ. 2021, 763, 144224. [Google Scholar] [CrossRef]
  19. Lim, C.H.; An, J.H.; Jung, S.H.; Nam, G.B.; Cho, Y.C.; Kim, N.S.; Lee, C.S. Ecological consideration for several methodologies to diagnose vegetation phenology. Ecol. Res. 2018, 33, 363–377. [Google Scholar] [CrossRef]
  20. Yao, X.; Wang, Z.; Wang, H. Impact of Urbanization and Land-Use Change on Surface Climate in Middle and Lower Reaches of the Yangtze River, 1988–2008. Adv. Meteorol. 2015, 2015, 395094. [Google Scholar] [CrossRef]
  21. Li, X.-X.; Koh, T.-Y.; Panda, J.; Norford, L.K. Impact of urbanization patterns on the local climate of a tropical city, Singapore: An ensemble study. J. Geophys. Res. Atmos. 2016, 121, 4386–4403. [Google Scholar] [CrossRef]
  22. Li, J.; Zou, C.; Li, Q.; Xu, X.; Zhao, Y.; Yang, W.; Zhang, Z.; Liu, L. Effects of urbanization on productivity of terrestrial ecological systems based on linear fitting: A case study in Jiangsu, eastern China. Sci. Rep. 2019, 9, 17140. [Google Scholar] [CrossRef] [PubMed]
  23. Krehbiel, C.; Henebry, G.M. A Comparison of Multiple Datasets for Monitoring Thermal Time in Urban Areas over the U.S. Upper Midwest. Remote Sens. 2016, 8, 297. [Google Scholar] [CrossRef]
  24. Ha, K.; Ha, E.; Yoo, C.; Jeon, E. Temperature trends and extreme climate since 1909 at big four cities of Korea. J. Korean Meteorol. Soc. 2004, 40, 1–16. [Google Scholar]
  25. Alexander, L.V.; Zhang, X.; Peterson, T.C.; Caesar, J.; Gleason, B.; Klein Tank, A.M.G.; Haylock, M.; Collins, D.; Trewin, B.; Rahimzadeh, F.; et al. Global observed changes in daily climate extremes of temperature and precipitation. J. Geophys. Res. Atmos. 2006, 111, e006290. [Google Scholar] [CrossRef]
  26. Zhao, N.; Jiao, Y.; Ma, T.; Zhao, M.; Fan, Z.; Yin, X.; Liu, Y.; Yue, T. Estimating the effect of urbanization on extreme climate events in the Beijing-Tianjin-Hebei region, China. Sci. Total Environ. 2019, 688, 1005–1015. [Google Scholar] [CrossRef] [PubMed]
  27. Yang, X.; Ruby Leung, L.; Zhao, N.; Zhao, C.; Qian, Y.; Hu, K.; Liu, X.; Chen, B. Contribution of urbanization to the increase of extreme heat events in an urban agglomeration in east China. Geophys. Res. Lett. 2017, 44, 6940–6950. [Google Scholar] [CrossRef]
  28. McCarthy, M.P.; Best, M.J.; Betts, R.A. Climate change in cities due to global warming and urban effects. Geophys. Res. Lett. 2010, 37, e042845. [Google Scholar] [CrossRef]
  29. Lim, C.H.; Jung, S.H.; Kim, A.R.; Kim, N.S.; Lee, C.S. Monitoring for Changes in Spring Phenology at Both Temporal and Spatial Scales Based on MODIS LST Data in South Korea. Remote Sens. 2020, 12, 3282. [Google Scholar] [CrossRef]
  30. Zipper, S.C.; Schatz, J.; Singh, A.; Kucharik, C.J.; Townsend, P.A.; Loheide, S.P. Urban heat island impacts on plant phenology: Intra-urban variability and response to land cover. Environ. Res. Lett. 2016, 11, 054023. [Google Scholar] [CrossRef]
  31. Voogt, J.A.; Oke, T.R. Thermal remote sensing of urban climates. Remote Sens. Environ. 2003, 86, 370–384. [Google Scholar] [CrossRef]
  32. Willie, Y.A.; Pillay, R.; Zhou, L.; Orimoloye, I.R. Monitoring spatial pattern of land surface thermal characteristics and urban growth: A case study of King Williams using remote sensing and GIS. Earth Sci. Inform. 2019, 12, 447–464. [Google Scholar] [CrossRef]
  33. Orimoloye, I.R.; Mazinyo, S.P.; Nel, W.; Kalumba, A.M. Spatiotemporal monitoring of land surface temperature and estimated radiation using remote sensing: Human health implications for East London, South Africa. Environ. Earth Sci. 2018, 77, 77. [Google Scholar] [CrossRef]
  34. Jeong, S.J.; Ho, C.H.; Choi, S.D.; Kim, J.; Lee, E.J.; Gim, H.J. Satellite Data-Based Phenological Evaluation of the Nationwide Reforestation of South Korea. PLoS ONE 2013, 8, e58900. [Google Scholar] [CrossRef]
  35. Hsu, A.; Sheriff, G.; Chakraborty, T.; Manya, D. Disproportionate exposure to urban heat island intensity across major US cities. Nat. Commun. 2021, 12, 2721. [Google Scholar] [CrossRef] [PubMed]
  36. Tong, S.; Prior, J.; McGregor, G.; Shi, X.; Kinney, P. Urban heat: An increasing threat to global health. BMJ 2021, 375, n2467. [Google Scholar] [CrossRef] [PubMed]
  37. Chuine, I.; Yiou, P.; Viovy, N.; Seguin, B.; Daux, V.; Ladurie, E.L.R. Grape ripening as a past climate indicator. Nature 2004, 432, 289–290. [Google Scholar] [CrossRef]
  38. Menzel, A.; Sparks, T.H.; Estrella, N.; Koch, E.; Aasa, A.; Ahas, R.; Alm-KÜBler, K.; Bissolli, P.; BraslavskÁ, O.G.; Briede, A.; et al. European phenological response to climate change matches the warming pattern. Glob. Chang. Biol. 2006, 12, 1969–1976. [Google Scholar] [CrossRef]
  39. Parmesan, C. Influences of species, latitudes and methodologies on estimates of phenological response to global warming. Glob. Chang. Biol. 2007, 13, 1860–1872. [Google Scholar] [CrossRef]
  40. Zhao, M.; Peng, C.; Xiang, W.; Deng, X.; Tian, D.; Zhou, X.; Yu, G.; He, H.; Zhao, Z. Plant phenological modeling and its application in global climate change research: Overview and future challenges. Environ. Rev. 2013, 21, 1–14. [Google Scholar] [CrossRef]
  41. Ulsig, L.; Nichol, C.J.; Huemmrich, K.F.; Landis, D.R.; Middleton, E.M.; Lyapustin, A.I.; Mammarella, I.; Levula, J.; Porcar-Castell, A. Detecting Inter-Annual Variations in the Phenology of Evergreen Conifers Using Long-Term MODIS Vegetation Index Time Series. Remote Sens. 2017, 9, 49. [Google Scholar] [CrossRef]
  42. Hmimina, G.; Dufrêne, E.; Pontailler, J.Y.; Delpierre, N.; Aubinet, M.; Caquet, B.; de Grandcourt, A.; Burban, B.; Flechard, C.; Granier, A.; et al. Evaluation of the potential of MODIS satellite data to predict vegetation phenology in different biomes: An investigation using ground-based NDVI measurements. Remote Sens. Environ. 2013, 132, 145–158. [Google Scholar] [CrossRef]
  43. Hufkens, K.; Friedl, M.; Sonnentag, O.; Braswell, B.H.; Milliman, T.; Richardson, A.D. Linking near-surface and satellite remote sensing measurements of deciduous broadleaf forest phenology. Remote Sens. Environ. 2012, 117, 307–321. [Google Scholar] [CrossRef]
  44. Ellwood, E.R.; Temple, S.A.; Primack, R.B.; Bradley, N.L.; Davis, C.C. Record-Breaking Early Flowering in the Eastern United States. PLoS ONE 2013, 8, e53788. [Google Scholar] [CrossRef] [PubMed]
  45. Lee, B.; Kim, E.; Lee, J.; Chung, J.-M.; Lim, J.-H. Detecting phenology using MODIS vegetation indices and forest type map in South Korea. Korean J. Remote Sens. 2018, 34, 267–282. [Google Scholar]
  46. Schwartz, M.D.; Reiter, B.E. Changes in North American spring. Int. J. Climatol. 2000, 20, 929–932. [Google Scholar] [CrossRef]
  47. Peñuelas, J.; Filella, I.; Comas, P. Changed plant and animal life cycles from 1952 to 2000 in the Mediterranean region. Glob. Chang. Biol. 2002, 8, 531–544. [Google Scholar] [CrossRef]
  48. Piao, S.; Fang, J.; Zhou, L.; Ciais, P.; Zhu, B. Variations in satellite-derived phenology in China’s temperate vegetation. Glob. Chang. Biol. 2006, 12, 672–685. [Google Scholar] [CrossRef]
  49. Schwartz, M.D.; Ahas, R.; Aasa, A. Onset of spring starting earlier across the Northern Hemisphere. Glob. Chang. Biol. 2006, 12, 343–351. [Google Scholar] [CrossRef]
  50. Cleland, E.E.; Chuine, I.; Menzel, A.; Mooney, H.A.; Schwartz, M.D. Shifting plant phenology in response to global change. Trends Ecol. Evol. 2007, 22, 357–365. [Google Scholar] [CrossRef]
  51. Jeong, S.J.; Ho, C.H.; Jeong, J.H. Increase in vegetation greenness and decrease in springtime warming over east Asia. Geophys. Res. Lett. 2009, 36, e036583. [Google Scholar] [CrossRef]
  52. Piao, S.; Liu, Q.; Chen, A.; Janssens, I.A.; Fu, Y.; Dai, J.; Liu, L.; Lian, X.; Shen, M.; Zhu, X. Plant phenology and global climate change: Current progresses and challenges. Glob. Chang. Biol. 2019, 25, 1922–1940. [Google Scholar] [CrossRef] [PubMed]
  53. Jochner, S.; Caffarra, A.; Menzel, A. Can spatial data substitute temporal data in phenological modelling? A survey using birch flowering. Tree Physiol. 2013, 33, 1256–1268. [Google Scholar] [CrossRef] [PubMed]
  54. Richardson, A.D.; Keenan, T.F.; Migliavacca, M.; Ryu, Y.; Sonnentag, O.; Toomey, M. Climate change, phenology, and phenological control of vegetation feedbacks to the climate system. Agric. For. Meteorol. 2013, 169, 156–173. [Google Scholar] [CrossRef]
  55. Keenan, T.F.; Gray, J.; Friedl, M.A.; Toomey, M.; Bohrer, G.; Hollinger, D.Y.; Munger, J.W.; O’Keefe, J.; Schmid, H.P.; Wing, I.S.; et al. Net carbon uptake has increased through warming-induced changes in temperate forest phenology. Nat. Clim. Chang. 2014, 4, 598–604. [Google Scholar] [CrossRef]
  56. Jochner, S.; Menzel, A. Urban phenological studies—Past, present, future. Environ. Pollut. 2015, 203, 250–261. [Google Scholar] [CrossRef] [PubMed]
  57. Zhao, S.; Liu, S.; Zhou, D. Prevalent vegetation growth enhancement in urban environment. Proc. Natl. Acad. Sci. USA 2016, 113, 6313–6318. [Google Scholar] [CrossRef] [PubMed]
  58. Frank, M.C.; Thomas, R.Â.t. Annual and spatial variability of the beginning of growing season in Europe in relation to air temperature changes. Clim. Res. 2002, 19, 257–264. [Google Scholar]
  59. Dallimer, M.; Tang, Z.; Gaston, K.J.; Davies, Z.G. The extent of shifts in vegetation phenology between rural and urban areas within a human-dominated region. Ecol. Evol. 2016, 6, 1942–1953. [Google Scholar] [CrossRef]
  60. Jeong, S.J.; Park, H.y.; Ho, C.H.; Kim, J.w. Impact of urbanization on spring and autumn phenology of deciduous trees in the Seoul Capital Area, South Korea. Int. J. Biometeorol. 2019, 63, 627–637. [Google Scholar] [CrossRef]
  61. Buyantuyev, A.; Wu, J. Urbanization diversifies land surface phenology in arid environments: Interactions among vegetation, climatic variation, and land use pattern in the Phoenix metropolitan region, USA. Landsc. Urban Plan. 2012, 105, 149–159. [Google Scholar] [CrossRef]
  62. Han, G.; Xu, J. Land Surface Phenology and Land Surface Temperature Changes Along an Urban–Rural Gradient in Yangtze River Delta, China. Environ. Manag. 2013, 52, 234–249. [Google Scholar] [CrossRef]
  63. Yao, R.; Wang, L.; Huang, X.; Guo, X.; Niu, Z.; Liu, H. Investigation of Urbanization Effects on Land Surface Phenology in Northeast China during 2001–2015. Remote Sens. 2017, 9, 66. [Google Scholar] [CrossRef]
  64. Zhou, D.; Zhao, S.; Zhang, L.; Liu, S. Remotely sensed assessment of urbanization effects on vegetation phenology in China’s 32 major cities. Remote Sens. Environ. 2016, 176, 272–281. [Google Scholar] [CrossRef]
  65. Briber, B.M.; Hutyra, L.R.; Dunn, A.L.; Raciti, S.M.; Munger, J.W. Variations in Atmospheric CO2 Mixing Ratios across a Boston, MA Urban to Rural Gradient. Land 2013, 2, 304–327. [Google Scholar] [CrossRef]
  66. Wang, X.; Du, P.; Chen, D.; Lin, C.; Zheng, H.; Guo, S. Characterizing urbanization-induced land surface phenology change from time-series remotely sensed images at fine spatio-temporal scale: A case study in Nanjing, China (2001–2018). J. Clean. Prod. 2020, 274, 122487. [Google Scholar] [CrossRef]
  67. Hu, S.; Liu, C.; Zheng, H.; Wang, Z.; Yu, J. Assessing the impacts of climate variability and human activities on streamflow in the water source area of Baiyangdian Lake. J. Geogr. Sci. 2012, 22, 895–905. [Google Scholar] [CrossRef]
  68. White, M.A.; Nemani, R.R.; Thornton, P.E.; Running, S.W. Satellite Evidence of Phenological Differences Between Urbanized and Rural Areas of the Eastern United States Deciduous Broadleaf Forest. Ecosystems 2002, 5, 260–273. [Google Scholar] [CrossRef]
  69. Li, X.; Zhou, Y.; Asrar, G.R.; Mao, J.; Li, X.; Li, W. Response of vegetation phenology to urbanization in the conterminous United States. Glob. Chang. Biol. 2017, 23, 2818–2830. [Google Scholar] [CrossRef]
  70. Ho, C.-H.; Lee, E.J.; Lee, I.; Jeong, S.J. Earlier spring in Seoul, Korea. Int. J. Climatol. 2006, 26, 2117–2127. [Google Scholar] [CrossRef]
  71. Qiu, T.; Song, C.; Zhang, Y.; Liu, H.; Vose, J.M. Urbanization and climate change jointly shift land surface phenology in the northern mid-latitude large cities. Remote Sens. Environ. 2020, 236, 111477. [Google Scholar] [CrossRef]
  72. Li, D.; Stucky, B.J.; Deck, J.; Baiser, B.; Guralnick, R. The Effect of Urbanization on Plant Phenology Depends on Regional Temperature. Nat. Ecol. Evol. 2019, 3, 1661–1667. [Google Scholar] [CrossRef]
  73. Lee, C.S.; Cho, Y.C.; Lee, A.N. Restoration Planning for the Seoul Metropolitan Area, Korea. In Ecology, Planning, and Management of Urban Forests: International Perspectives; Carreiro, M.M., Song, Y.-C., Wu, J., Eds.; Springer: New York, NY, USA, 2008; pp. 393–419. [Google Scholar]
  74. Kim, G.S.; Son, H.K.; Lee, C.H.; Cho, H.J.; Lee, C.S. Ecological comparison of Mongolian oak (Quercus mongolica Fisch. ex Ledeb.) community between Mt. Nam and Mt. Jeombong as a Long Term Ecological Research (LTER) site. J. Ecol. Environ. 2011, 34, 75–85. [Google Scholar] [CrossRef]
  75. Seoul City. Biotop Map. Available online: http://gis.seoul.go.kr/SeoulGis/Naver/MetroInfo.jsp (accessed on 3 February 2024).
  76. Kaya, Z.; Adams, W.T.; Campbell, R.K. Adaptive significance of intermittent shoot growth in Douglas-fir seedlings. Tree Physiol. 1994, 14, 1277–1289. [Google Scholar] [CrossRef]
  77. Wickham, H.; Chang, W.; Wickham, M.H. Package ‘ggplot2’. Available online: http://cran.r-project.org/web/packages/ggplot2/ggplot2.pdf. (accessed on 3 March 2024).
  78. Lee, K.-M.; Kwon, W.-T.; Lee, S.-H. A study on plant phenological trends in South Korea. J. Korean Assoc. Reg. Geogr. 2009, 15, 337–350. [Google Scholar] [CrossRef]
  79. Song, H.G.; Lee, C.S. Diagnosis on climate change: Climate change based on the flowering response of cherry tree. Clim. Chang. Ecol. Ser. Long Term Ecol. Res. 2014, 7, 60–74. [Google Scholar]
  80. Kim, H.H. Urban heat island. Int. J. Remote Sens. 1992, 13, 2319–2336. [Google Scholar] [CrossRef]
  81. Lee, C.S.; Jung, S.; Lim, B.S.; Kim, A.R.; Lim, C.H.; Lee, H. Forest decline under progress in the urban forest of Seoul, Central Korea. In Forest Degradation Around the World; Nazip Suratman, M., Abd Latif, Z., De Oliveira, G., Brunsell, N., Shimabukuro, Y., Antonio Costa Dos Santos, C., Eds.; IntechOpen: London, UK, 2019. [Google Scholar]
  82. Ray, D.; Wainhouse, D.; Webber, J.; Gardiner, B. Impacts of climate change on forests and forestry in Scotland. In Forest Research; Forestry Commission: Scotland, UK, 2008. [Google Scholar]
  83. Primack, R.B.; Higuchi, H.; Miller-Rushing, A.J. The impact of climate change on cherry trees and other species in Japan. Biol. Conserv. 2009, 142, 1943–1949. [Google Scholar] [CrossRef]
  84. Neil, K.; Wu, J. Effects of urbanization on plant flowering phenology: A review. Urban Ecosyst. 2006, 9, 243–257. [Google Scholar] [CrossRef]
  85. Kalnay, E.; Cai, M. Impact of urbanization and land-use change on climate. Nature 2003, 423, 528–531. [Google Scholar] [CrossRef]
  86. Fujibe, F. Urban warming in Japanese cities and its relation to climate change monitoring. Int. J. Climatol. 2011, 31, 162–173. [Google Scholar] [CrossRef]
  87. Coomes, D.A.; Burslem, D.F.; Simonson, W.D. Forests and Global Change; Cambridge University Press: Cambridge, UK, 2014. [Google Scholar]
  88. Jiang, Y.; Fu, P.; Weng, Q. Assessing the Impacts of Urbanization-Associated Land Use/Cover Change on Land Surface Temperature and Surface Moisture: A Case Study in the Midwestern United States. Remote Sens. 2015, 7, 4880–4898. [Google Scholar] [CrossRef]
  89. Kaye, J.P.; McCulley, R.L.; Burke, I.C. Carbon fluxes, nitrogen cycling, and soil microbial communities in adjacent urban, native and agricultural ecosystems. Glob. Chang. Biol. 2005, 11, 575–587. [Google Scholar] [CrossRef]
  90. Ziska, L.H.; Gebhard, D.E.; Frenz, D.A.; Faulkner, S.; Singer, B.D.; Straka, J.G. Cities as harbingers of climate change: Common ragweed, urbanization, and public health. J. Allergy Clin. Immunol. 2003, 111, 290–295. [Google Scholar] [CrossRef]
  91. Chung, U.; Choi, J.; Yun, J.I. Urbanization Effect on the Observed Change in Mean Monthly Temperatures between 1951-1980 and 1971-2000 in Korea. Clim. Chang. 2004, 66, 127–136. [Google Scholar] [CrossRef]
  92. Lee, S.; Bae, Y.-S.; Shin, S.-Y.; Kim, H.-S. A Study on Strategy in Seoul Vulnerable to Extreme Weather; Seoul Development Institute: Seoul, Republic of Korea, 2010; p. 139. [Google Scholar]
  93. Akbari, H.; Davis, S.; Huang, J.; Dorsano, S.; Winnett, S. Cooling Our Communities: A Guidebook on Tree Planting and Light-Colored Surfacing; Environmental Protection Agency (EPA): Washington, DC, USA, 1992. [Google Scholar]
  94. Boukhabla, M.; Alkama, D.; Bouchair, A. The effect of urban morphology on urban heat island in the city of Biskra in Algeria. Int. J. Ambient Energy 2013, 34, 100–110. [Google Scholar] [CrossRef]
  95. Gunawardena, K.R.; Wells, M.J.; Kershaw, T. Utilising green and bluespace to mitigate urban heat island intensity. Sci. Total Environ. 2017, 584–585, 1040–1055. [Google Scholar] [CrossRef]
  96. Lee, H.Y. A study on the urban temperature in Seoul. Ehwa Bull. Geogr. 1985, 1, 104. [Google Scholar]
  97. Kim, Y.H.; Baik, J.J. Spatial and Temporal Structure of the Urban Heat Island in Seoul. J. Appl. Meteorol. 2005, 44, 591–605. [Google Scholar] [CrossRef]
  98. Bazrkar, M.H.; Zamani, N.; Eslamian, S.; Eslamian, A.; Dehghan, Z. Urbanization and Climate Change. In Handbook of Climate Change Adaptation; Leal Filho, W., Ed.; Springer: Berlin/Heidelberg, Germany, 2015; pp. 619–655. [Google Scholar]
  99. Wang, W.; Wu, T.; Li, Y.; Xie, S.; Han, B.; Zheng, H.; Ouyang, Z. Urbanization Impacts on Natural Habitat and Ecosystem Services in the Guangdong-Hong Kong-Macao “Megacity”. Sustainability 2020, 12, 6675. [Google Scholar] [CrossRef]
  100. Huong, H.T.L.; Pathirana, A. Urbanization and climate change impacts on future urban flooding in Can Tho city, Vietnam. Hydrol. Earth Syst. Sci. 2013, 17, 379–394. [Google Scholar] [CrossRef]
  101. D’amato, G.; Pawankar, R.; Vitale, C.; Lanza, M.; Molino, A.; Stanziola, A.; Sanduzzi, A.; Vatrella, A.; D’amato, M. Climate change and air pollution: Effects on respiratory allergy. Allergy Asthma Immunol. Res. 2016, 8, 391–395. [Google Scholar] [CrossRef]
  102. Miller, J.D.; Hutchins, M. The impacts of urbanisation and climate change on urban flooding and urban water quality: A review of the evidence concerning the United Kingdom. J. Hydrol. Reg. Stud. 2017, 12, 345–362. [Google Scholar] [CrossRef]
  103. Zhang, W.; Xu, H. Effects of land urbanization and land finance on carbon emissions: A panel data analysis for Chinese provinces. Land Use Policy 2017, 63, 493–500. [Google Scholar] [CrossRef]
  104. Jones, K.R.; Watson, J.E.M.; Possingham, H.P.; Klein, C.J. Incorporating climate change into spatial conservation prioritisation: A review. Biol. Conserv. 2016, 194, 121–130. [Google Scholar] [CrossRef]
  105. Lim, C.H.; Lim, B.S.; Kim, A.R.; Kim, D.U.; Seol, J.W.; Pi, J.H.; Lee, H.; Lee, C.S. Climate change adaptation through ecological restoration. In Natural Resources Conservation and Advances for Sustainability; Jhariya, M.K., Meena, R.S., Banerjee, A., Meena, S.N., Eds.; Elsevier: Amsterdam, The Netherlands, 2022; pp. 151–172. [Google Scholar]
  106. Kim, G.S.; Kim, A.R.; Lim, B.S.; Seol, J.; An, J.H.; Lim, C.H.; Joo, S.J.; Lee, C.S. Assessment of the Carbon Budget of Local Governments in South Korea. Atmosphere 2022, 13, 342. [Google Scholar] [CrossRef]
  107. Seidl, R.; Thom, D.; Kautz, M.; Martin-Benito, D.; Peltoniemi, M.; Vacchiano, G.; Wild, J.; Ascoli, D.; Petr, M.; Honkaniemi, J.; et al. Forest disturbances under climate change. Nat. Clim. Chang. 2017, 7, 395–402. [Google Scholar] [CrossRef]
  108. Hughes, A.R.; Inouye, B.D.; Johnson, M.T.J.; Underwood, N.; Vellend, M. Ecological consequences of genetic diversity. Ecol. Lett. 2008, 11, 609–623. [Google Scholar] [CrossRef]
  109. Thompson, I.; Mackey, B.; McNulty, S.; Mosseler, A. Forest resilience, biodiversity, and climate change. In A Synthesis of the Biodiversity/Resilience/Stability Relationship in Forest Ecosystems; Technical Series; Secretariat of the Convention on Biological Diversity: Montreal, QC, Canada, 2009; pp. 1–67. [Google Scholar]
  110. Pelletier, M.C.; Ebersole, J.; Mulvaney, K.; Rashleigh, B.; Gutierrez, M.N.; Chintala, M.; Kuhn, A.; Molina, M.; Bagley, M.; Lane, C. Resilience of aquatic systems: Review and management implications. Aquat. Sci. 2020, 82, 44. [Google Scholar] [CrossRef]
  111. Massad, R.S.; Lathière, J.; Strada, S.; Perrin, M.; Personne, E.; Stéfanon, M.; Stella, P.; Szopa, S.; de Noblet-Ducoudré, N. Reviews and syntheses: Influences of landscape structure and land uses on local to regional climate and air quality. Biogeosciences 2019, 16, 2369–2408. [Google Scholar] [CrossRef]
  112. Watson, R.T.; Noble, I.R.; Bolin, B.; Ravindranath, N.; Verardo, D.J.; Dokken, D.J. Land Use, Land-Use Change, and Forestry: A Special Report of the Intergovernmental Panel on Climate Change; Cambridge University Press: Cambridge, UK, 2000. [Google Scholar]
  113. Munasinghe, M.; Swart, R. Primer on Climate Change and Sustainable Development: Facts, Policy Analysis, and Applications; Cambridge University Press: Cambridge, UK, 2005; Volume 3. [Google Scholar]
  114. MEA. Ecosystems and Human Well-Being: Synthesis; World Resources Institute: Washington, DC, USA, 2005. [Google Scholar]
  115. Fawzy, S.; Osman, A.I.; Doran, J.; Rooney, D.W. Strategies for mitigation of climate change: A review. Environ. Chem. Lett. 2020, 18, 2069–2094. [Google Scholar] [CrossRef]
  116. Yuan, Z.; Cheng, Y.; Mi, L.; Xie, J.; Xi, J.; Mao, Y.; Xu, S.; Wang, Z.; Wang, S. Effects of Ecological Restoration and Climate Change on Herbaceous and Arboreal Phenology. Plants 2023, 12, 3913. [Google Scholar] [CrossRef]
  117. Roman, C.E.; Lynch, A.H.; Dominey-Howes, D. Uncovering the Essence of the Climate Change Adaptation Problem—A Case Study of the Tourism Sector at Alpine Shire, Victoria, Australia. Tour. Hosp. Plan. Dev. 2010, 7, 237–252. [Google Scholar] [CrossRef]
  118. Peterson, D.L.; Halofsky, J.E. Adapting to the effects of climate change on natural resources in the Blue Mountains, USA. Clim. Serv. 2018, 10, 63–71. [Google Scholar] [CrossRef]
  119. MacKinnon, K.; Sobrevila, C.; Hickey, V. Biodiversity, Climate Change, and Adaptation: Nature-Based Solutions from the World Bank Portfolio; World Bank Group: Washington, DC, USA, 2008. [Google Scholar]
  120. Olander, L.P.; Boyd, W.; Lawlor, K.; Madeira, E.M.; Niles, J.O. International Forest Carbon and the Climate Change Challenge: Issues and Options; Nicholas Institute for Environmental Policy Solutions: Durham, NC, USA, 2009. [Google Scholar]
  121. UNEP. The Role of Ecosystems in Developing a Sustainable ‘Green Economy’; UNEP: Nairobi, Kenya, 2010; p. 21. [Google Scholar]
  122. Wang, L.; Li, Z.; Wang, D.; Chen, J.; Liu, Y.; Nie, X.; Zhang, Y.; Ning, K.; Hu, X. Unbalanced social-ecological development within the Dongting Lake basin: Inspiration from evaluation of ecological restoration projects. J. Clean. Prod. 2021, 315, 128161. [Google Scholar] [CrossRef]
  123. Chen, X.; Taylor, A.R.; Reich, P.B.; Hisano, M.; Chen, H.Y.H.; Chang, S.X. Tree diversity increases decadal forest soil carbon and nitrogen accrual. Nature 2023, 618, 94–101. [Google Scholar] [CrossRef]
  124. Kleerekoper, L.; van Esch, M.; Salcedo, T.B. How to make a city climate-proof, addressing the urban heat island effect. Resour. Conserv. Recycl. 2012, 64, 30–38. [Google Scholar] [CrossRef]
  125. Doick, K.; Hutchings, T. Air temperature regulation by urban trees and green infrastructure. In Forestry Commission Research Note; Forestry Commission: Edinburgh, UK, 2013; pp. 1–10. [Google Scholar]
  126. Fallmann, J.; Emeis, S. How to bring urban and global climate studies together with urban planning and architecture? Dev. Built Environ. 2020, 4, 100023. [Google Scholar] [CrossRef]
  127. Ferrini, F.; Fini, A.; Mori, J.; Gori, A. Role of Vegetation as a Mitigating Factor in the Urban Context. Sustainability 2020, 12, 4247. [Google Scholar] [CrossRef]
  128. Jung, S.H.; Kim, A.R.; An, J.H.; Lim, C.H.; Lee, H.; Lee, C.S. Abnormal shoot growth in Korean red pine as a response to microclimate changes due to urbanization in Korea. Int. J. Biometeorol. 2020, 64, 571–584. [Google Scholar] [CrossRef]
  129. Arnfield, A.J. Two decades of urban climate research: A review of turbulence, exchanges of energy and water, and the urban heat island. Int. J. Climatol. 2003, 23, 1–26. [Google Scholar] [CrossRef]
  130. Hamin, E.M.; Gurran, N. Urban form and climate change: Balancing adaptation and mitigation in the U.S. and Australia. Habitat Int. 2009, 33, 238–245. [Google Scholar] [CrossRef]
  131. Ren, Z.; He, X.; Zheng, H.; Zhang, D.; Yu, X.; Shen, G.; Guo, R. Estimation of the Relationship between Urban Park Characteristics and Park Cool Island Intensity by Remote Sensing Data and Field Measurement. Forests 2013, 4, 868–886. [Google Scholar] [CrossRef]
  132. Ellis, C.J.; Eaton, S. Climate change refugia: Landscape, stand and tree-scale microclimates in epiphyte community composition. Lichenologist 2021, 53, 135–148. [Google Scholar] [CrossRef]
  133. Semeraro, T.; Scarano, A.; Buccolieri, R.; Santino, A.; Aarrevaara, E. Planning of Urban Green Spaces: An Ecological Perspective on Human Benefits. Land 2021, 10, 105. [Google Scholar] [CrossRef]
Figure 1. A map showing the study sites. (A) The sites for study of green-up dates of Q. mongolica, (B) the sites for study of flowering date of cherry, (C) the sites for study of abnormal growth of Korean red pine, and (D) the sites where the meteorological data were collected.
Forests 15 00718 g001
Figure 2. A map showing spatial distribution of vegetation and land use types in the Seoul metropolitan area (redrawn from Seoul City [75]).
Forests 15 00718 g002
Figure 3. An illustration of phenological phases extracted from remote sensing data.
Forests 15 00718 g003
Figure 4. The isopleth map of the collected data from the study sites. (A) DoY for green-up date of Q. mongolica, (B) DoY for flowering date of cherry, (C) frequency of the abnormal shoots occurring in Korean red pine, (D) lengths of the abnormal shoots occurring in Korean red pine. Dot numbers indicate site number and numbers on the isopleth line indicate DoY.
Forests 15 00718 g004aForests 15 00718 g004b
Figure 5. A spatial distribution map of the mean air temperature (°C) in Seoul for recent 25 years from 1997 to 2021.
Forests 15 00718 g005
Figure 6. Relationships between urbanization rate, air temperature, and green-up date of Q. mongolica.
Forests 15 00718 g006
Table 1. Correlation coefficients between green-up date of the Q. mongolica, flowering date of cherry, frequency of the abnormal shoots, and abnormal shoot length occurring in Korean red pine.
Flowering DateFrequencyLength
Green-up date0.401 **−0.543 **−0.204 *
Flowering date −0.411 **−0.288 **
Frequency 0.495 **
* denotes significance at the 5% level. ** denotes significance at the 1% level.
Disclaimer/Publisher’s Note: The statements, opinions and data contained in all publications are solely those of the individual author(s) and contributor(s) and not of MDPI and/or the editor(s). MDPI and/or the editor(s) disclaim responsibility for any injury to people or property resulting from any ideas, methods, instructions or products referred to in the content.

