Article

Genetic Divergence and Evolutionary Adaption of Four Wild Almond Species (Prunus spp. L.)

1
State Key Laboratory of Desert and Oasis Ecology, Key Laboratory of Ecological Safety and Sustainable Development in Arid Lands, Xinjiang Institute of Ecology and Geography, Chinese Academy of Sciences, Urumqi 830011, China
2
Xinjiang Key Laboratory of Conservation and Utilization of Gene Resources, Urumqi 830011, China
3
Specimen Museum of Xinjiang Institute of Ecology and Geography, Chinese Academy of Sciences, Urumqi 830011, China
4
College of Marine Life Sciences, Ocean University of China, Qingdao 266003, China
5
University of Chinese Academy of Sciences, Beijing 100049, China
*
Author to whom correspondence should be addressed.
Forests 2024, 15(5), 834; https://doi.org/10.3390/f15050834
Submission received: 5 March 2024 / Revised: 6 May 2024 / Accepted: 9 May 2024 / Published: 10 May 2024

Abstract

:
Parallel evolution usually occurs among related species with similar morphological characters in adaptation to particular environments. Four wild almond species (Prunus) sharing the character of dry mesocarp splitting are distributed in China, most of which occur in arid Northwestern China. In the present study, we aimed to clarify the phylogenetic relationship, evolutionary history, and environmental adaptation of these wild almond species based on genome-wide SNP data and chloroplast genomes. Chloroplast phylogeny showed P. pedunculata and P. tenella were clustered with wild cherry species (Prunus), while P. mongolica and P. tangutica were clustered with wild peach species (Prunus). Genomic phylogeny suggested P. tenella formed an independent clade. An ABC-RF approach showed P. pedunculata was merged with P. tenella and, then, diverged from the ancestor of P. mongolica and P. tangutica. P. tenella was split from other wild almond species at ca. 7.81 to 17.77 Ma. Genetic environment association analysis showed precipitation variables contributed the most to genetic variations between P. mongolica from an arid environment and P. tangutica from a humid environment. Finally, a total of 29 adaptive loci were successfully annotated, which were related to physiological processes in response to abiotic stresses. Inconsistent genomic and chloroplast phylogenetic positions of P. tenella suggested this species could have originated from historical hybridization among different clades of Prunus. Physiological mechanisms promoted P. mongolica in adapting to the arid environment in Northwestern China.

1. Introduction

Parallel phenotypic evolution means that related species lineages evolved similar morphologies from their ancestral state [1,2]. Morphological parallelism has been reported in numerous animal and plant groups, such as cichlid fish [3], sand dune and rocky headland Senecio [4], and alpine and montane Antirrhinum [5], in response to particular environmental conditions. These studies indicate that the suitability of similar morphologies among related species are often due to selection in adaptation to extreme environmental conditions such as drought, infertility, high salinity, and high elevation. Parallel evolution usually results in similar genetic changes from similar or identical adaptive mutations in independent lineages [1,2].
Northwestern China is a typical arid zone on the earth, where several sand and rocky deserts are located, i.e., Taklimakan desert, Gobi Desert, and Alxa desert. To adapt to this extreme arid environment, several phenotypic strategies are developed by plant species in Northwestern China. For example, a type of plant named ephemeral herbs has acquired the ability to utilize the snowmelt for quickly completing its life history during spring season [6]. Many shrubs are mostly developed with a deep root to obtain deep soil water and to stand in strong breezes in deserts [7]. The onset of aridity in Northwestern China can be traced to the Miocene in response to the retreat of the Para-Tethys Sea and the uplift of the Qinghai–Tibet Plateau [8,9]. Following the increasing aridity, the environment of sand and rocky deserts extensively expanded during the Quaternary in this region [10,11]. The increasing aridity triggered the lineage divergence of Caragana, dominant components of the vegetation in Northwestern China, between dry and mesic environments [12]. The Caragana species in dry land has evolved similar leaf hydraulic traits to tolerate drought and adapt to low annual precipitation environments [13].
Almond species traditionally belong to the Prunus subgenus Amygdalus with the morphological character of dry mesocarp splitting at maturity [14,15]. In contrast, peach species with a fleshy non-splitting mesocarp are also included in the Prunus subgenus Amygdalus. In China, four wild almond species are distributed, i.e., P. mongolica, P. tangutica, P. tenella, and P. pedunculata (Figure 1). Except for P. tangutica, the three other species occur in arid Northwestern China. The morphological character of dry mesocarp splitting could be considered an adaptation to arid and semi-arid environments [15,16]. Based on several DNA fragments and chloroplast genomes, previous molecular phylogenetic studies found that these wild almond species were not a well-accepted monophyletic group in the genus Prunus [17,18,19]. They hypothesized that the morphological character of dry mesocarp splitting could have resulted from the parallel evolution of the Prunus species in adaptation to aridity. Up to now, there is a lack of biparentally inherited nrDNA sequence data to clarify the phylogenetic relationship among these four wild almond species in comparison with maternally inherited chloroplast genomes. Moreover, it is unclear, on a genetic basis, how these wild almond species have adapted to an arid environment during their evolutionary history.
To properly understand the history of parallel evolution, we initially need to know the phylogenetic relationships among the related species. However, a highly resolved phylogenetic tree is usually hampered by low genetic variations, incomplete lineage sorting, and hybridization among these closely related taxa with parallel evolutionary history [20,21]. Genome-wide SNP data and complete plastid genomes provide numerous nucleotide variations for phylogenetic tree reconstruction to address these phylogenetic questions [5,22]. In addition, the genetic basis of parallel evolution is crucial to understand how these closely related species have adapted to similar environments. Ecological genomic approaches make it feasible to answer this question for species (or closely related species) with whole genomic information [1,2]. By association analysis between genomic data and environmental variables, they can determine the main environmental factors influencing the genetic variations and identify the underlying genomic loci adaptations to the particular environment.
In the present study, we focus on the phylogeny, evolution, and environmental adaptation of four wild almond species (Prunus spp. L.) from China, which share the morphological character of dry mesocarp splitting at maturity. Using genome-wide SNP data and chloroplast genomes, it aims to address these questions: (1) Did these related species have consistent phylogenetic relationships from both biparentally and maternally inherited genomic sequences? (2) Did these related species share a similar history of evolution and speciation? (3) How did the xeric species P. mongolica adapt to extremely dry environments in the sand and rocky deserts of Northwestern China?

2. Materials and Methods

2.1. Plant Sampling and DNA Extraction

A total of 13 populations were collected from four wild almonds, including seven populations of P. mongolica, two populations of P. tangutica, three populations of P. tenella, and one population of P. pedunculata (Table 1; Figure 1). Another morphologically related species, P. triloba, was also sampled (Table 1). For these five species, P. mongolica, P. tangutica, and P. tenella are diploid Prunus species. P. pedunculata and P. triloba are polyploid Prunus species. In addition, three other Prunus species, P. tomentosa, P. tianshanica, and P. cerasifera, were sampled in this study (Table 1). Voucher specimens were deposited in the Herbarium of the Xinjiang Institute of Ecology and Geography Chinese Academy of Sciences (XJBI). Leaf materials of 181 individuals for these species were collected from the field and were dried and stored with silica gel. The seven populations of P. mongolica were formerly collected in Zhang et al. [23]. In the laboratory, total genomic DNA was extracted from leaf materials using the DNeasy Plant Mini Kit (Qiagen, Hilden, Germany) following the manufacturer’s instructions.

2.2. Sequencing, Chloroplast Genome Assembly and Phylogenetic Construction

For chloroplast genome assembly, one individual of each population was sequenced from P. mongolica, P. tangutica, P. tenella, and P. pedunculata. One individual of P. cerasifera was also sequenced. The total genomic DNA was sequenced on Illumina NovaSeq 6000 platform by constructing a library with 2 × 150 bp paired-end (PE) reads. Raw data were trimmed and filtered using FastQC v. 0.11.5 software (http://www.bioinformatics.babraham.ac.uk/projects/fastqc/; accessed on 12 September 2023). Then, chloroplast genomes of these samples were assembled using GetOrganelle v. 1.7.1 [24]. The annotations of chloroplast genomes were preliminarily conducted using PGA (https://github.com/quxiaojian/PGA; accessed on 12 September 2023) and, then, manually checked by Geneious version 9.1.7 [25].
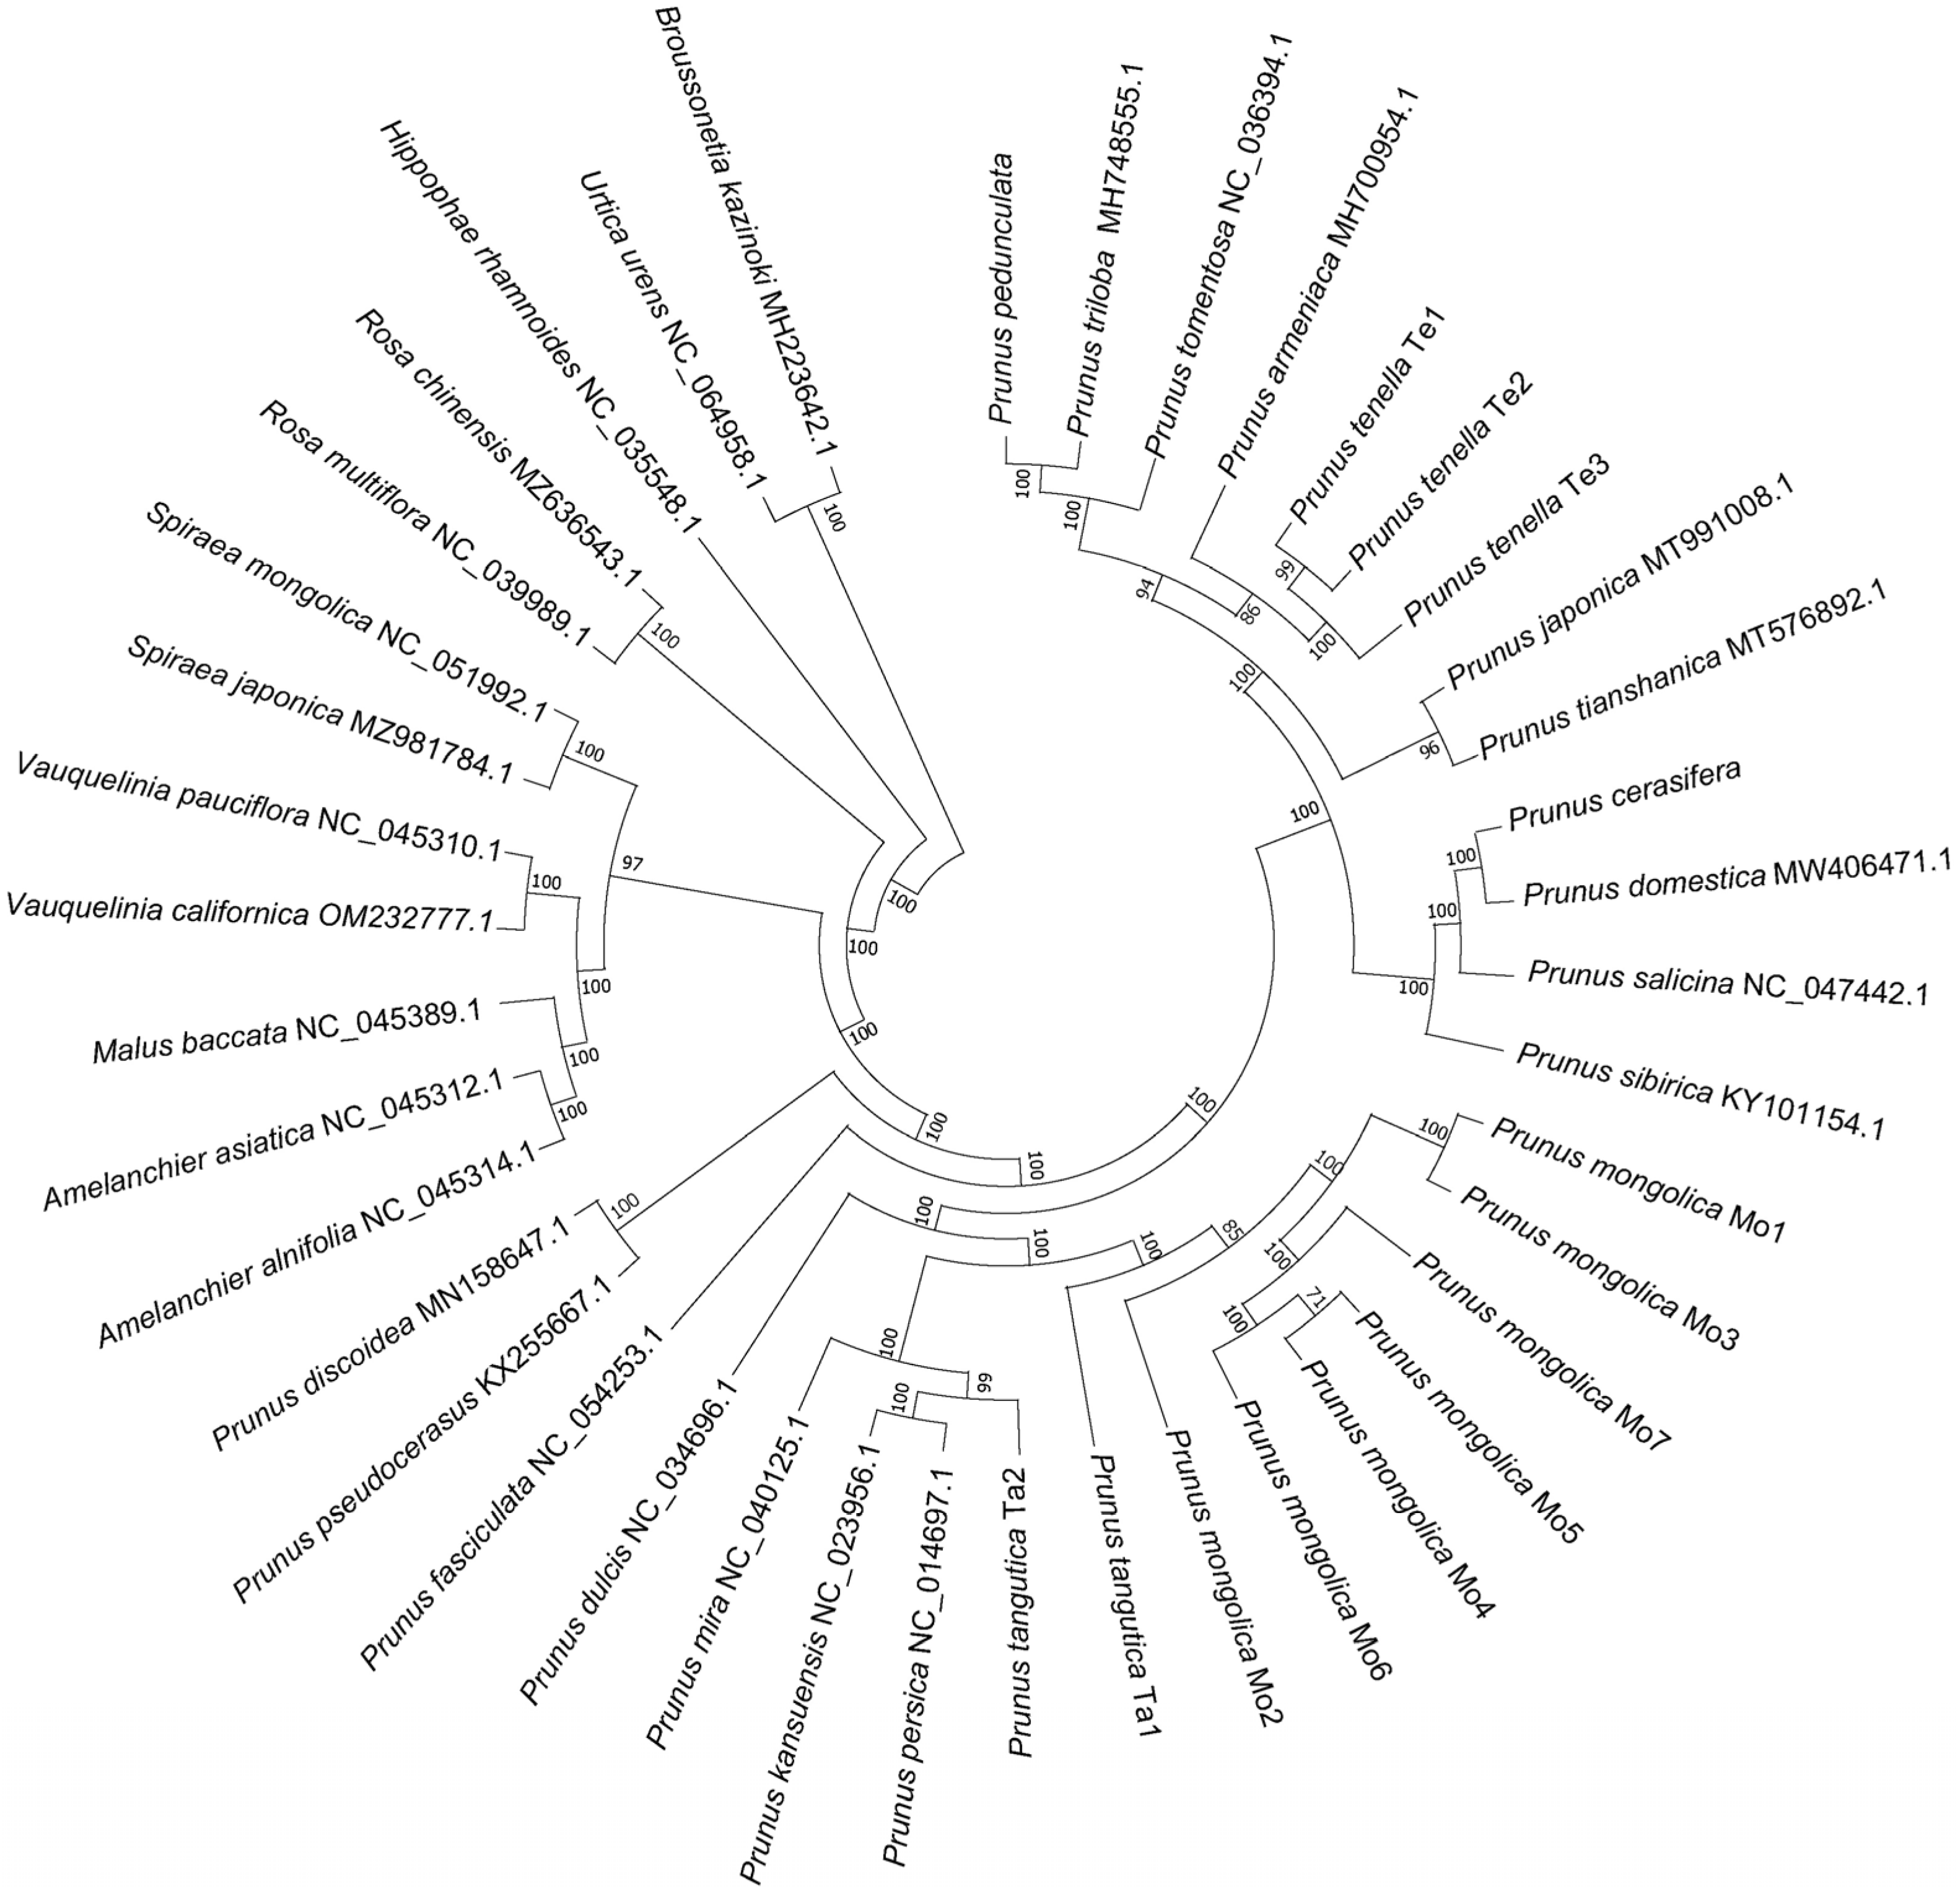
To infer the phylogenetic relationship among these wild almond species, the chloroplast genomes of 16 other Prunus species and 12 outgroups were downloaded from NCBI (Figure 2). A total of 41 complete chloroplast genome sequences were aligned by MAFFT v. 7 [26] and, then, used to construct a maximum likelihood (ML) tree using IQ-TREE version 2.0.6 with 1000 ultrafast bootstrap replicates [27]. The optimal substitution model (TVM+F+R2) was recommended by the software’s ModelFinder algorithm.

2.3. RAD Sequencing and SNP Calling

The library preparation of genomic DNA for each sample was implemented through RAD sequencing [28] at Novogene Co., Ltd. (Tianjin, China) and Personal Gene Technology Co., Ltd. (Shanghai, China). Paired-end (150 bp) sequencing was conducted on Illumina NovaSeq 6000 platform. In the present study, a total of 181 individuals were used in the RAD-seq dataset, including the data of 70 P. mongolica individuals obtained from Zhang et al. [23].
After raw reads were generated, the sliding window method was employed to control the data quality using fastp version 0.23.2 software [29] under the parameters “-l 50-5-W 5 m 20”. The filtered clean reads of these 181 individuals were then mapped to the reference genome of P. dulcis (https://www.rosaceae.org/organism/Prunus/dulcis; accessed on 12 September 2023) using BWA v. 0.7.15 software [30]. SNPs were called for these 181 individuals based on genomic alignments using SAMtools v. 1.17 [31]. The output of SNPs was further filtered under the parameters “dp8-max-miss 0.1-maf 0.05”. Further, we excluded SNPs with strong linkage disequilibrium (LD; pairwise genotype correlation r2 > 0.2) in PLINK [32] under the parameters “-indep-pairwise 50 10 0.2” to reduce the bias of LD during the following genetic structure analysis. The final dataset contained 8452 high-quality unlinked SNPs.

2.4. Genetic Structure Analyses

The genetic structure of the 181 individuals was clustered using the ADMIXTURE v. 1.3.0 software [33]. The ancestry of the 181 individuals was inferred by this program based on the final high-quality unlinked SNP dataset using a block relaxation algorithm. During the running of ADMIXTURE, a K value was defined to indicate the number of ancestral populations. When the K value was set ranging from 1 to 10, values of cross-validation (CV) error were obtained for each K value. The PCA was also performed for the 181 individuals using the GCTA version 1.93.2 based on the final high-quality unlinked SNP dataset [34]. The phylogenetic tree of the 181 individuals was constructed using the maximum likelihood (ML) algorithm by the program of IQ-TREE version 2.0.6 with 1000 ultrafast bootstrap replicates [27]. The optimal substitution model (TVMe+R3) was recommended by the software’s ModelFinder algorithm.

2.5. Demographical History Analysis

Based on the results of lineage grouping (see the Section 3), we divided these 181 samples into five groups: P. tenella (group 1), P. mongolica (group 2), P. tangutica (group 3), P. pedunculata, P. triloba, P. tomentosa, and P. tianshanica (group 4), and P. cerasifera (group 5). To test the scenarios of lineage divergence, an ABC random forest (ABC-RF) approach was employed to compare four alternate hypotheses for these five groups, which was implemented in DIYABC Random Forest v1.0 software [35]. Four possible scenarios were assumed for the lineage divergence of the five groups: (Scenario 1) group 4 was merged into group 5, and then, this combined group merged into group 1. Their ancestor diverged from the ancestor of group 2 and group 3; (Scenario 2) group 4 was merged into group 1, and then, this combined group merged into group 5. Their ancestor diverged from the ancestor of group 2 and group 3; (Scenario 3) group 2 was merged into group 3, and then, this combined group merged into group 1. Their ancestor diverged from the ancestor of group 4 and group 5; (Scenario 4) group 4 was merged into group 5, while group 2 and group 3 were merged into another combined group. Their ancestors were simultaneously diverged from group 1. In these scenarios, N1, N2, N3, N4, and N5 represent the effective population sizes of group 1 to group 5. t1, t2, t3, and t4 are the time points when lineage divergences occur. Here, an average generation time of 7 years for Prunus was used to convert t from generations to years [36]. The best scenario was chosen by the highest number of classification votes in the ABC-RF analysis.

2.6. Genetic Environment Association Analysis

Among these four wild almonds, P. mongolica is distributed in the driest habitat in arid Northwestern China (Figure 1). This species usually has habitats in sand and Gobi deserts. According to the phylogenetic relationship of these wild almonds (see the Section 3), we chose the close relative P. tangutica to compare with P. mongolica in order to infer its adaptation to arid environments. Then, we extracted the sub-dataset of SNPs with 92 individuals from six P. mongolica populations and two P. tangutica populations. To retain the SNPs in most of the individuals, the threshold of max-missing 0.95 was set to purify the sub-dataset of SNPs. Finally, 3233 SNPs were used in the genetic environment association analysis. Here, gradient forest (GF) analysis was employed to assess the effect of environmental factors on the population’s genetic variations. This analysis was implemented in the R package “gradientForest” and determined the change in allele frequency along the environmental gradients [37,38]. GF analysis reported a value of R2 weighted importance, which measures the influence of predicted environmental variables on population genetic variations. We downloaded the 19 bioclimatic variables from the PalaeoClim Database (http://www.palaeoclim.org/; accessed on 12 September 2023; [39]). After removing the variables with high colinearity, eight least correlated variables (Spearman’s < 0.9) remained in the GF analysis.
At the same time, redundancy analysis (RDA) was used to estimate the contribution of environmental variables to genetic variations. Six important environmental variables were used in the RDA analysis, which explained the large proportion of genetic variations in the GF analysis. They included precipitation of the warmest quarter (bio 18), precipitation seasonality (bio 15), mean temperature of the coldest quarter (bio 11), mean temperature of the warmest quarter (bio 10), mean temperature of the driest quarter (bio 9), and precipitation of the coldest quarter (bio 19). RDA was conducted with the rda function in the R package “Vegan” [40]. The anova.cca function was used to test significance with 999 iterations.

2.7. Potential Loci Related to Local Adaptation

Based on the sub-dataset of SNPs with 92 individuals from six P. mongolica populations and two P. tangutica populations, we inferred candidate loci for the wild almond species that adapt to arid environments. Latent factor mixed modelling (LFMM) was used to test for significant associations between outlier loci and environmental variables in the R package “LEA” [41]. Six important environmental variables from GF analysis were used in the LFMM analysis. The “optimal” number of latent factors was set as K = 7 according to the recommendation from the LFMM analysis. Outliers were identified when SNPs had q-values less than 0.01, which was transformed from the p value using the R package “qvalue” [42].
At the same time, we also identified candidate loci that adapt to local environments by the RDA approach using the R function “rdadapt” [43]. Here, the sub-dataset of SNPs with 92 individuals from six P. mongolica populations and two P. tangutica populations is used as the response matrix, while an environmental dataset of six bioclimatic variables from GF analysis is used as the explanatory matrix. The first four axes were used to test significant association between outlier loci and environmental variables. The loadings of these SNPs along the four axes were then transformed into Mahalanobis distances. An outlier was considered when its q-value was lower than 0.1. Finally, we selected the outliers overlapped by both LFMM analysis and the RDA approach as reasonable outlier loci. To annotate the gene functions of these adaptive loci, we aligned these loci to the annotation file of the reference genome of P. dulcis (https://www.rosaceae.org/organism/Prunus/dulcis; accessed on 12 September 2023).

3. Results

3.1. Chloroplast Phylogeny

According to the ML phylogenetic tree of 41 complete chloroplast genome sequences (Figure 2), P. pedunculata, P. triloba, and P. tenella were clustered with wild cherry species (P. tomentosa, P. japonica, and P. tianshanica). P. cerasifera was clustered with plum species, including P. domestica and P. salicina. These wild cherry species and plum species formed a clade. In the phylogenetic tree, P. mongolica and P. tangutica were clustered with wild peach species (P. persica, P. kansuensis, and P. mira). The clade of wild peach species was a sister to the clades of wild cherry species and plum species. These clades were highly supported in the ML phylogenetic tree (Figure 2).

3.2. Genetic Structure and Demographical History

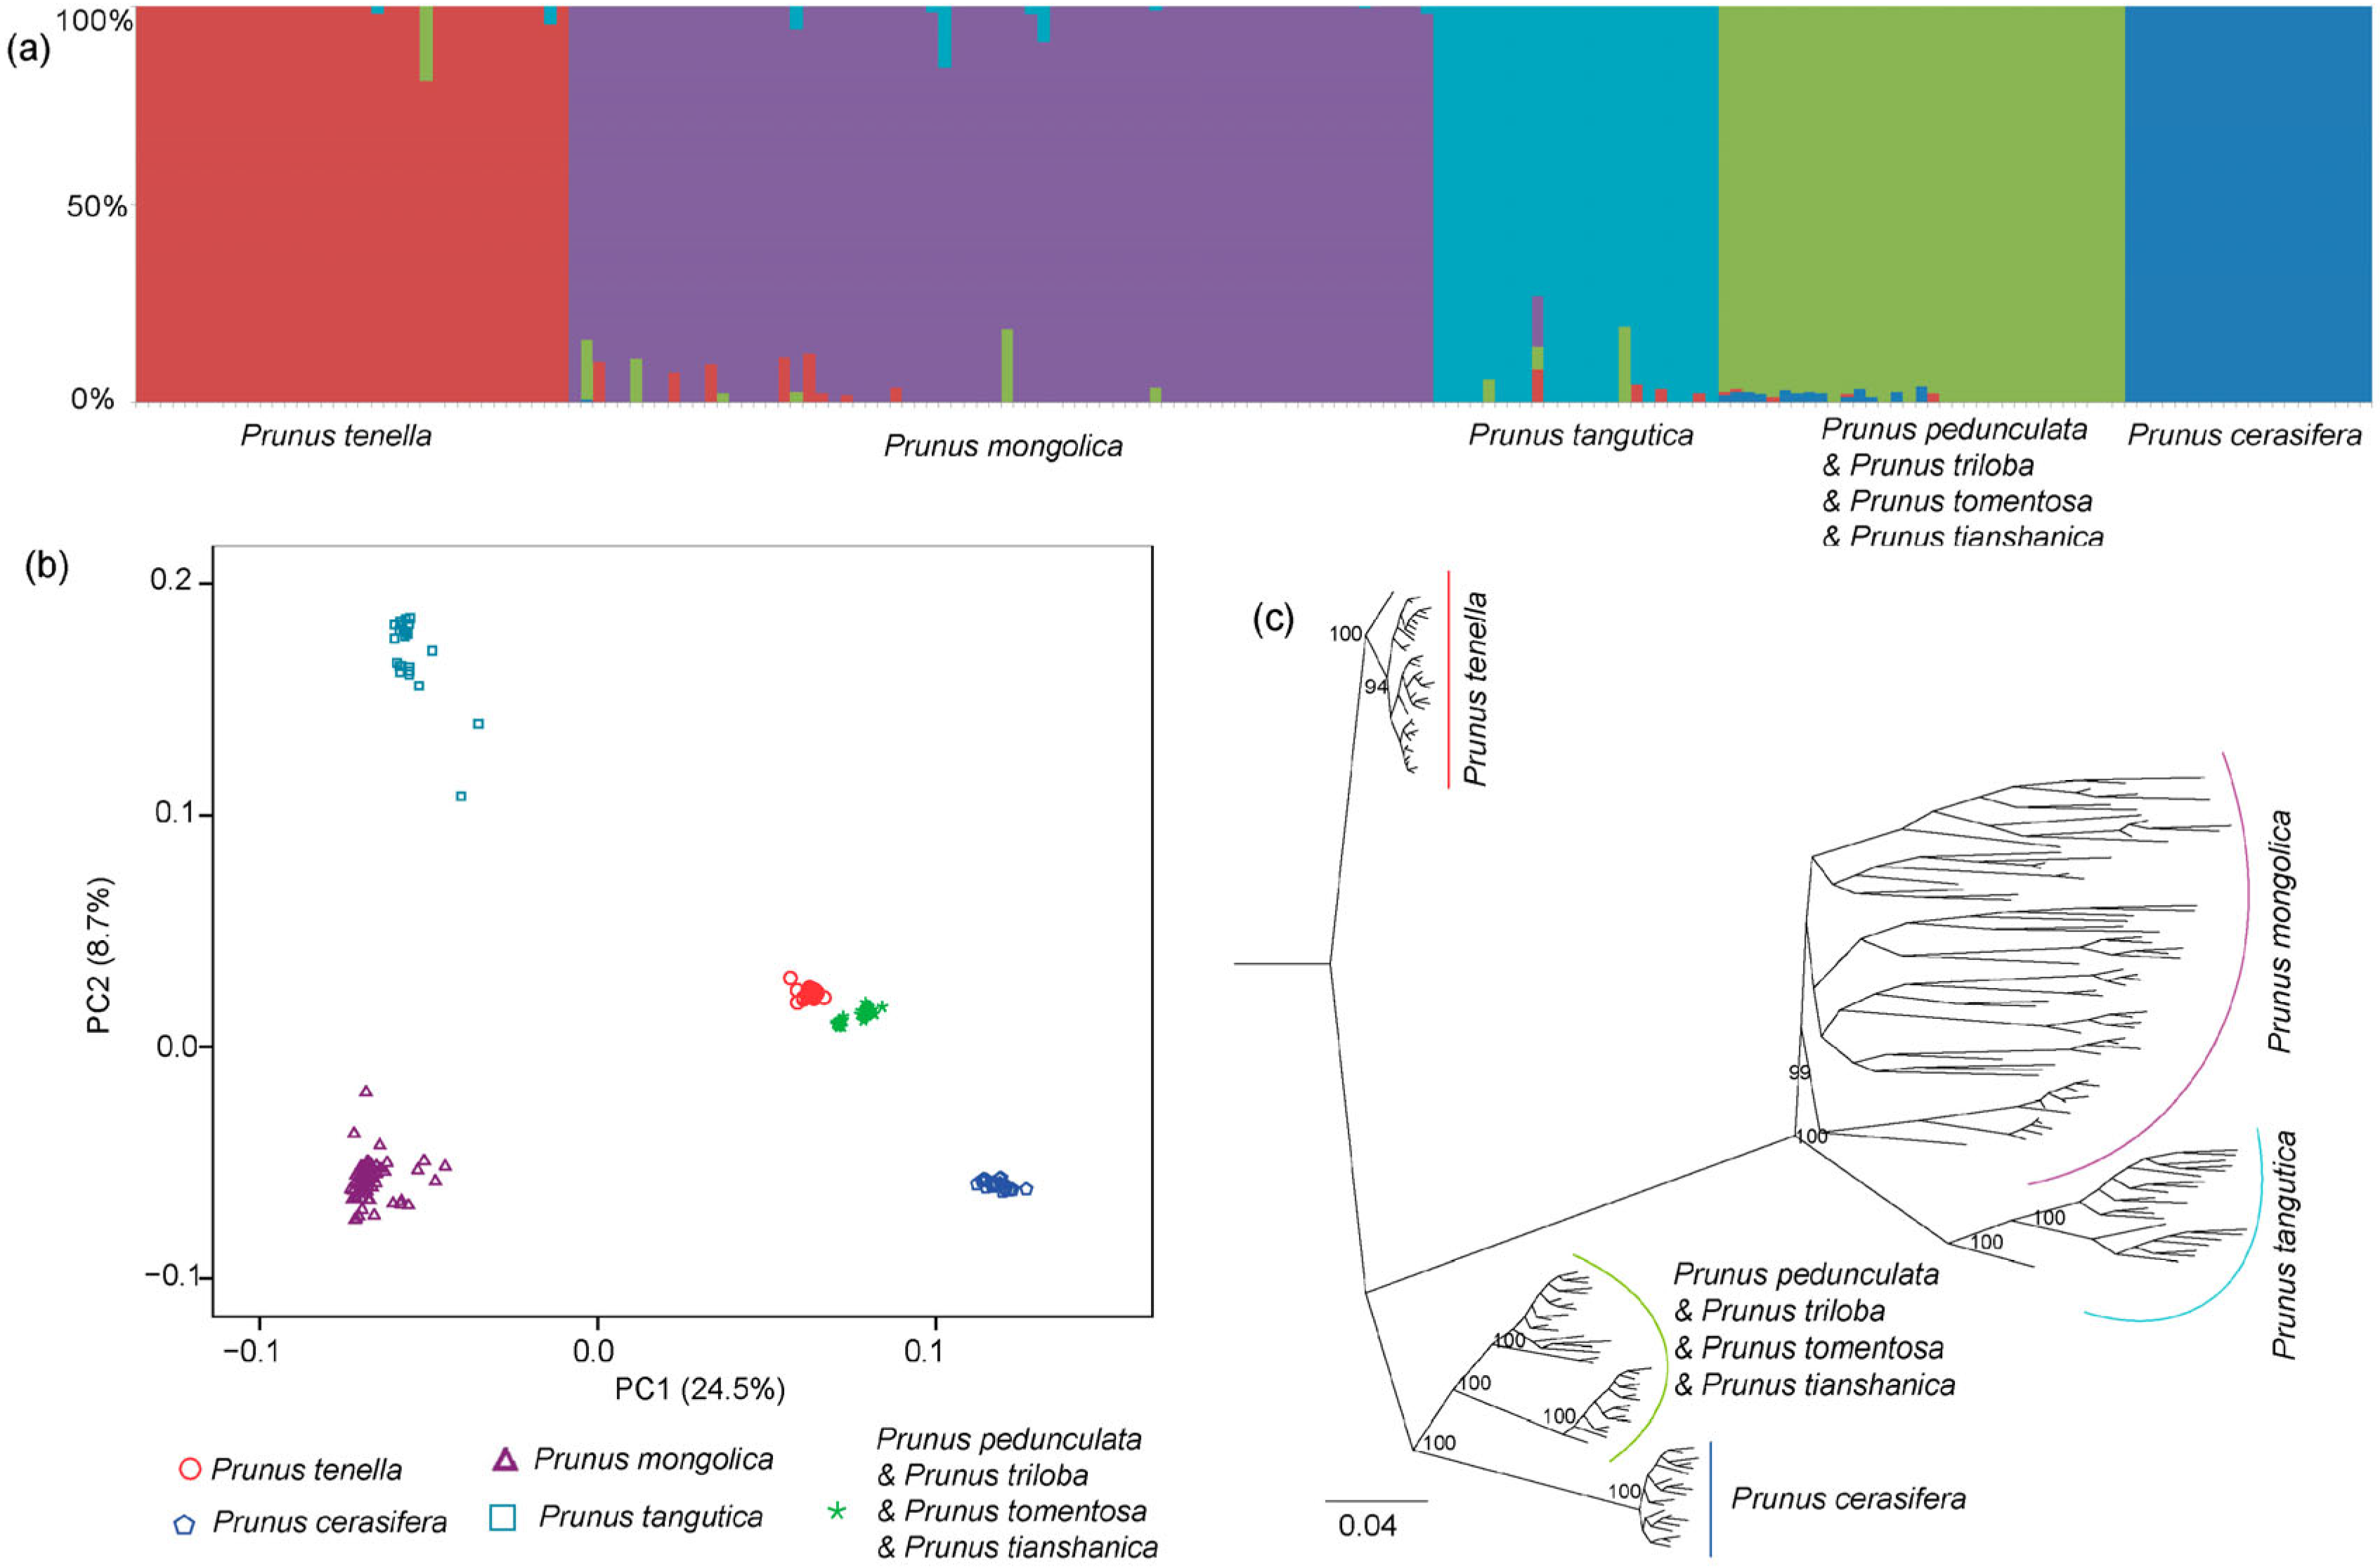
Based on the high-quality unlinked genomic SNP dataset of 181 individuals, ADMIXTURE analysis yielded a lower CV error value when K = 5. However, the CV error values were fluctuating when K values changed from 7 to 10. When K ≥ 6, genetic grouping showed two populations of P. mongolica were isolated from other P. mongolica populations. Thus, we chose the optimal genetic clustering for these 181 individuals when K = 5 (Figure 3a). According to the obtained clustering, each of these sampled Prunus species formed an independent genetic group except the four species of P. pedunculata, P. triloba, P. tomentosa, and P. tianshanica, which formed a genetic group. For the PCA analysis, individuals of P. pedunculata, P. triloba, P. tomentosa, and P. tianshanica formed a genetic cluster, while each of the other Prunus species formed independent genetic clusters (Figure 3b). The first two axes explained 24.5% and 8.7% of the genetic variations. The ML phylogenetic tree (Figure 3c) showed the similar structure of genetic grouping with the results from the ADMIXTURE analysis and the PCA analysis. The clades were supported by high bootstrap values.
Among the four alternate hypotheses of lineage divergences for these five genetic groups, the ABC-RF approach supported Scenario 1 as the best demographical model (proportion of votes: 0.822; posterior probability: 0.865). According to the hypotheses of Scenario 1 (Figure 4), group 4 (P. cerasifera) was firstly merged into group 5 (P. pedunculata & P. triloba & P. tomentosa & P. tianshanica), and then, this combined group merged into group 1 (P. tenella). The ancestor of these three groups (P. cerasifera, P. pedunculata & P. triloba & P. tomentosa & P. tianshanica, and P. tenella) was diverged from the ancestor of group 2 (P. mongolica) and group 3 (P. tangutica). The best-fitting demographical model (Scenario 1) estimated posterior modes (95% HPDs) of t1 (time of lineage divergence P. mongolica vs. P. tangutica), t2 (time of lineage divergence P. cerasifera vs. P. pedunculata & P. triloba & P. tomentosa & P. tianshanica), t3 (time of lineage divergence P. tenella vs. P. cerasifera + P. pedunculata & P. triloba & P. tomentosa & P. tianshanica), and t4 (time of lineage divergence P. mongolica + P. tangutica vs. P. tenella + P. cerasifera + P. pedunculata & P. triloba & P. tomentosa & P. tianshanica) at 2.93 (0.03–8.95) Ma, 2.36 (0.01–8.58) Ma, 7.81 (0.05–27.97) Ma and 17.77 (0.20–47.29) Ma, respectively (Table 2).

3.3. Genetic Environment Association

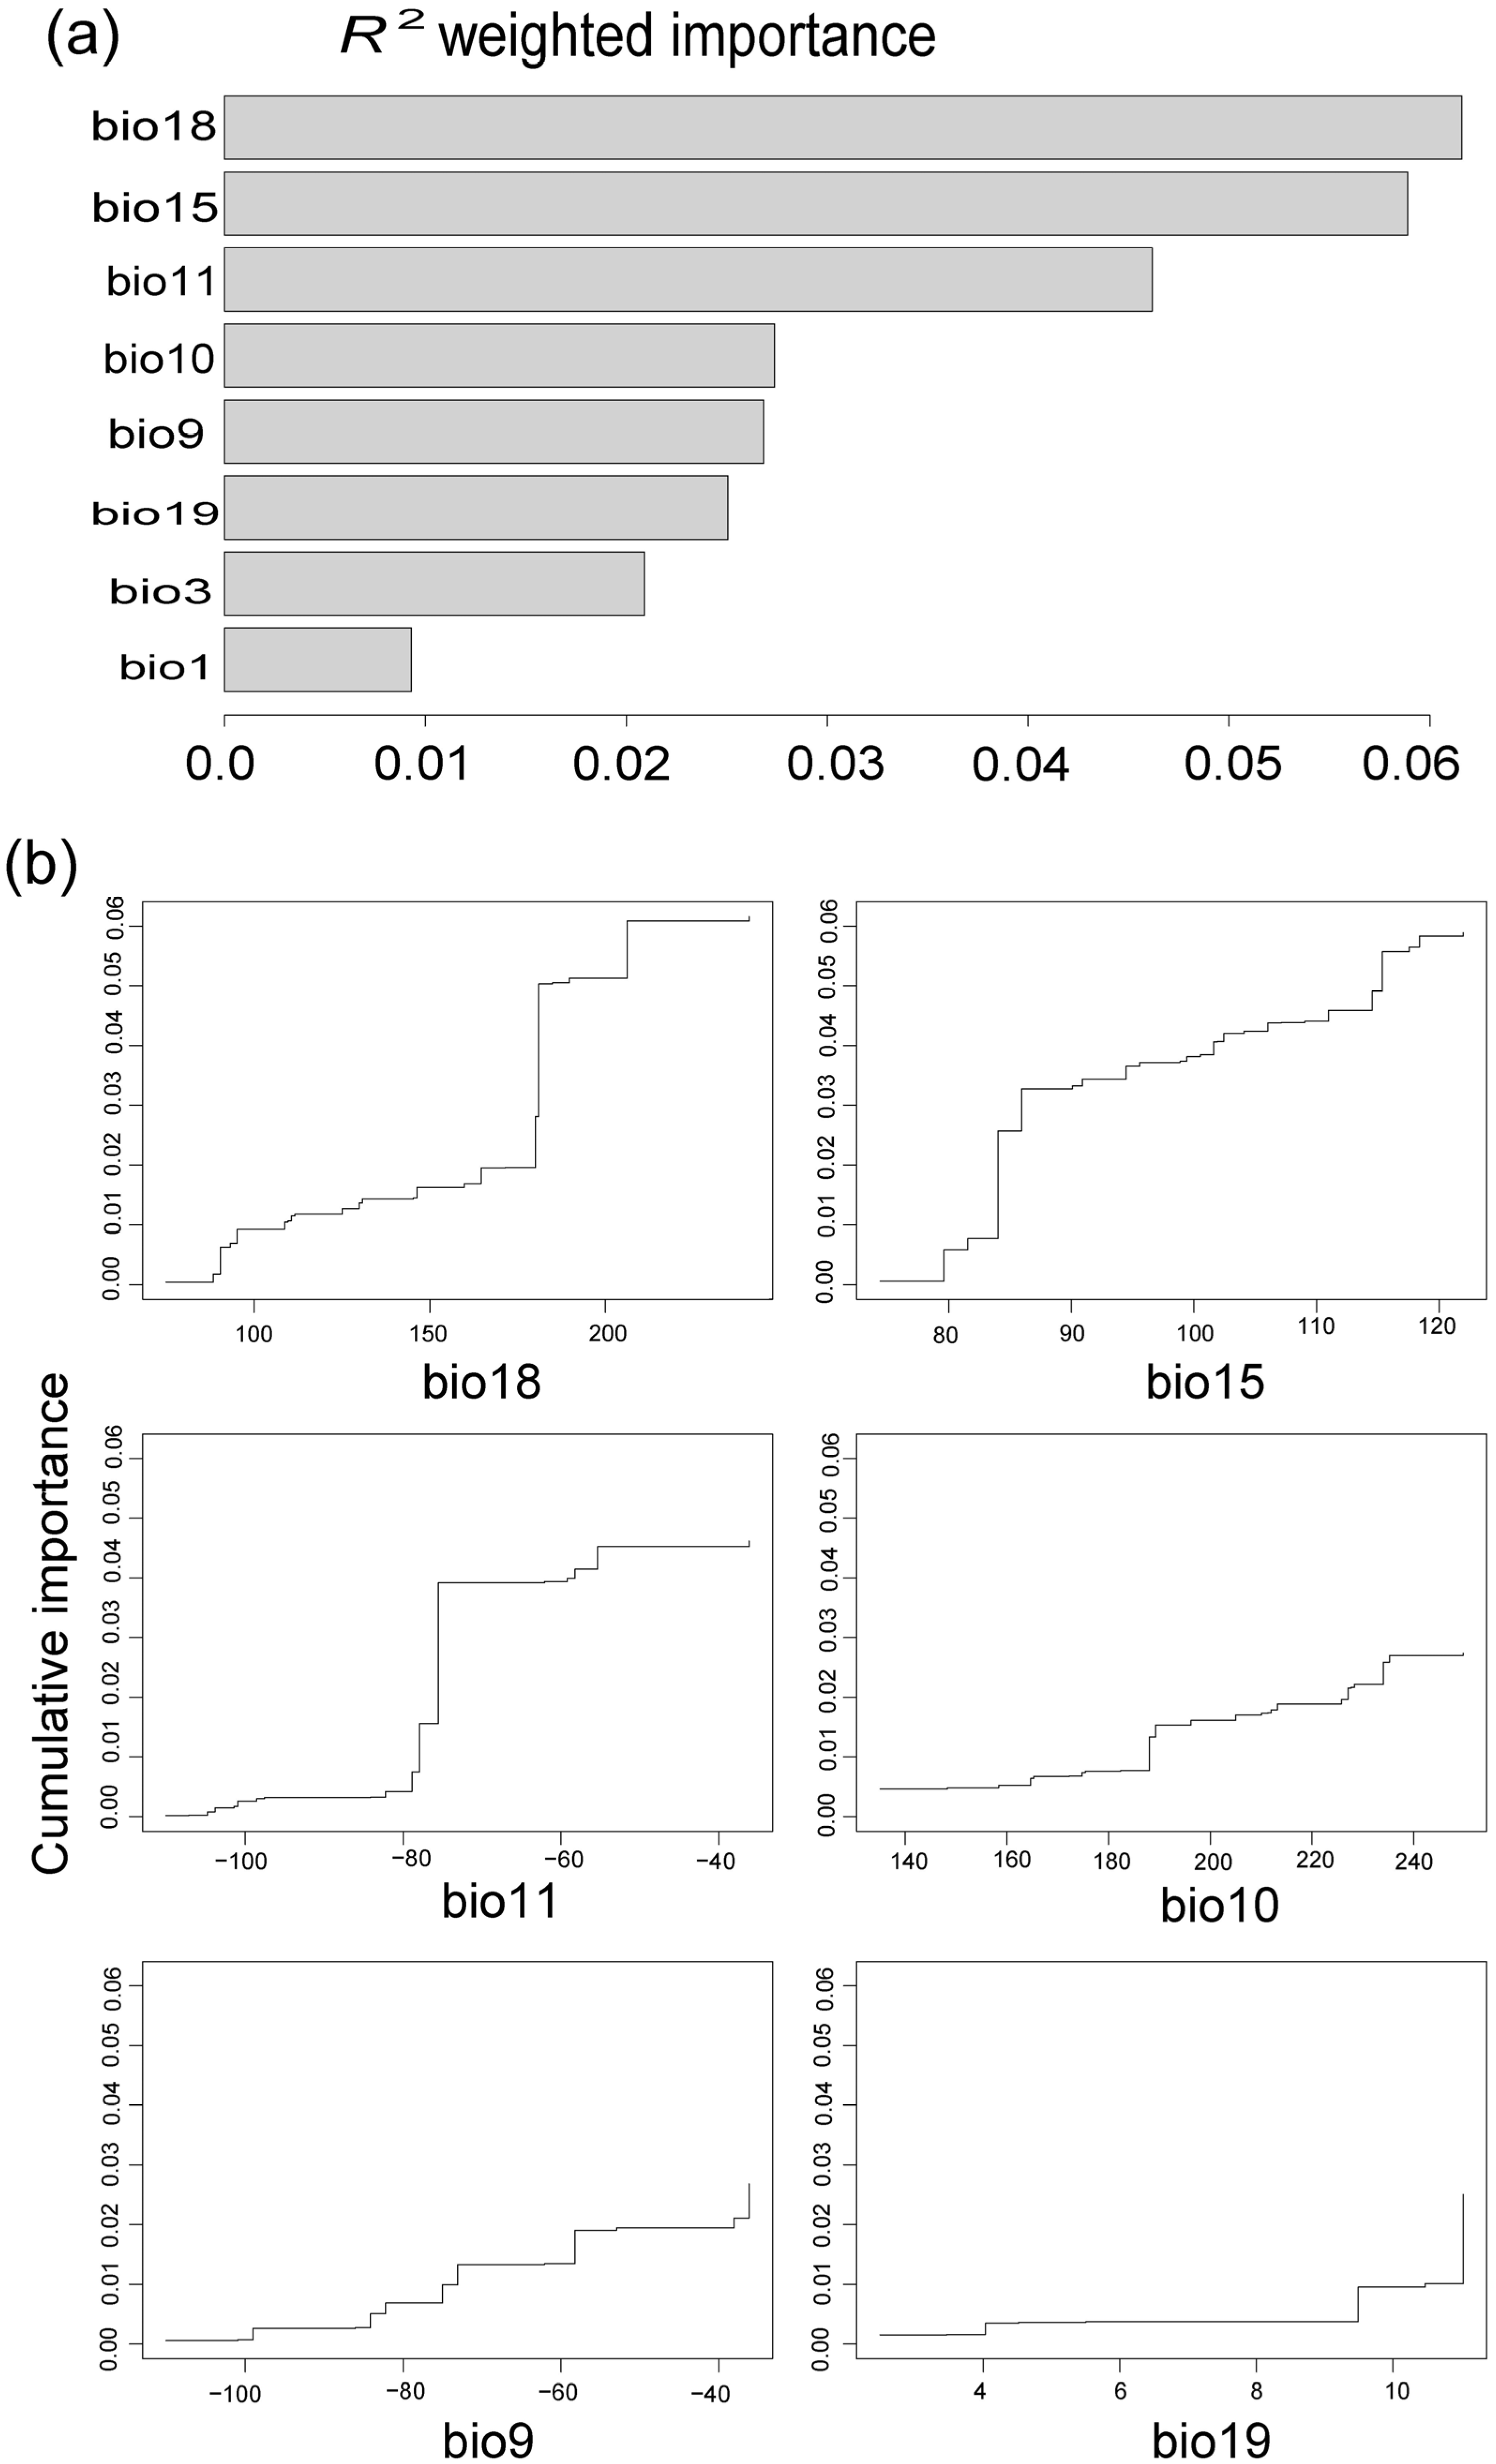
GF analysis showed bio 18 (precipitation of warmest quarter), bio 15 (precipitation seasonality), and bio 11 (mean temperature of the coldest quarter) were the most important environmental factors influencing the change in allele frequency of the sub-dataset of SNPs with 92 individuals from six P. mongolica populations and two P. tangutica populations. The values of R2 weighted importance of these three important environmental factors were higher than those of the other five factors (Figure 5a). Figure 5b showed the steplike curves for cumulative allele frequency change along the environmental gradient of six important environmental factors. RDA indicated that genetic variation was significantly correlated with these six important environmental factors (p = 0.001). The first two axes explained a larger proportion of the genetic variation (RDA1: 35.8%; RDA2: 20.7%; Figure 6). The first two axes explained 56% of the genetic variation, while the first three axes explained 70%. Six axes can explain 100% of the genetic variation. RAD also indicated bio 18 (precipitation of warmest quarter), bio 15 (precipitation seasonality), and bio 11 (mean temperature of the coldest quarter) contributed the most to genetic variations.
LFMM analysis obtained 218 candidate loci that adapted to local environments for P. mongolica and P. tangutica populations, while the RDA approach identified 144 adaptive loci. A total of 95 candidate loci overlapped between these two analyses and were used for gene annotation. When aligned to annotation files of the P. dulcis reference genome, 29 adaptive loci were successfully annotated. These adaptive loci were annotated to the gene functions of physiological processes in which plants respond to abiotic stresses (drought or temperature). A lot of these genes were related to physiological adaptation, i.e., oxidoreductase activity, transmembrane transporter activity, calciumion binding, DNA binding, and catalytic activity. They regulated and controlled pathways of endocrine resistance, calcium signaling, and RNA transport. Some genes were related to energy metabolism, i.e., polygalacturonase activity and ATP binding. They regulated and controlled pathways of pentose and glucuronate interconversions and starch and sucrose metabolism.

4. Discussion

4.1. Origin of Polyploid P. pedunculata and P. triloba

Among these wild almond species, P. pedunculata and P. triloba are polyploid, while other species are diploid, including P. mongolica, P. tangutica, and P. tenella [44]. The origin of these two polyploid species still lack adequate genetic support. Yazbek and Oh [19] proposed that P. pedunculata and P. triloba should be excluded from Prunus subg. Amygdalus based on several plastid DNA fragments and one nuclear gene. However, they did not give a specific phylogenetic position in the genus Prunus because they only used species from Prunus subg. Amygdalus, including almonds and peaches.
In our study, the phylogenetic tree of complete chloroplast genome sequences (Figure 2) showed P. pedunculata and P. triloba had a close relationship with wild cherry species (P. tomentosa, P. japonica and P. tianshanica). This result was also confirmed by Wang et al. [17] and Wan et al. [45], who constructed a phylogenetic tree of Prunus species using complete chloroplast genomes. Based on the high-quality unlinked genomic SNP dataset, we found that P. pedunculata and P. triloba are also clustered with wild cherry species (P. tomentosa and P. tianshanica) (Figure 3) in the present study. According to above genomic phylogeny, these two polyploid species, P. pedunculata and P. triloba, should have inherited from the diploid species of wild cherry by both maternal and biparental evidence. Actually, several wild cherry species were diploid, including P. tomentosa [46]. However, we could not determine the ancestors of these two polyploid species and judge whether they originated from the same ancestor, which depended on further studies employing more wild cherry species.

4.2. Evolution of P. tenella

For the molecular phylogeny of Prunus species, P. tenella was shown to have an isolated relationship with core species of subg. Amygdalus [18,45]. Yazbek and Oh [19] also proposed that P. tenella should be excluded from Prunus subg. Amygdalus. According to our results (Figure 2) and previous studies [17,45], P. tenella has a close relationship with wild cherry species (P. tomentosa, P. japonica and P. tianshanica) and apricot species (P. armeniaca) based on complete chloroplast genomes.
However, previous studies did not point out the phylogenetic position from nrDNA evidences, because most of their studies lacked P. tenella in their nrDNA phylogenetic tree. In our study, using the high-quality unlinked genomic SNPs dataset, P. tenella did not show a close phylogenetic relationship with wild cherry species (P. tomentosa and P. tianshanica) and wild plum species (P. cerasifera) (Figure 3). This was inconsistent with the result from complete chloroplast genomes. We speculated that P. tenella could have undergone a deep hybridization event involving different clades of Prunus. Previous studies have identified many Prunus species having signals of hybridization and allopolyploidy among different subgenera [47]. Here, the genome-wide SNP dataset and chloroplast genomic data all indicated P. tenella was more closely related to wild cherry species (P. tomentosa and P. tianshanica) and wild plum species (P. cerasifera) than the other two wild almond species, P. mongolica and P. tangutica, from Prunus subg. Amygdalus (Figure 4). Result of demographical history showed P. tenella had diverged from other Prunus species during the middle Miocene (ca. 7.81 Ma to 17.77 Ma) (Table 2). At present, the distribution of P. tenella covers Central Asia, Western Asia, and Southeastern Europe. According to its distribution pattern, we supposed that the origin and evolution of P. tenella could have responded to the environmental changes along the retreat of the Para-Tethys Sea during the middle Miocene [8,9,48].

4.3. Local Adaptation of P. mongolica to Arid Environment

All of the molecular phylogenetic analyses showed P. mongolica and P. tangutica were clustered in the Prunus subg. Amygdalus [17,19,45]. Our study (Figure 2) and previous studies found these two species were sister taxa and had a close phylogenetic relationship within the Prunus subg. Amygdalus. At present, P. tangutica is distributed in humid mountains around Sichuan Basin, Southwestern China (Figure 1). P. mongolica is fragmentally distributed in the sand and rocky deserts of Northwestern China (Figure 1). This species is a xerophytic plant within the Prunus subg. Amygdalus in China, which is more drought-tolerant than the other three wild almond species. Demographical history shows P. mongolica diverged from P. tangutica during the late Pliocene to the Quaternary (ca. 2.93 Ma; Table 2). It showed the increasing aridity Northwestern China has experienced since the late Miocene, and the extensive dry environment and most of the deserts occurred during the Quaternary [9,10,11]. P. mongolica could have adapted to the dry environment and, then, could have diverged from P. tangutica during this period.
In the present study, two precipitation variables, precipitation of warmest quarter (bio 18) and precipitation seasonality (bio 15), were identified as the most important environmental factors influencing genetic variations among populations from P. mongolica and P. tangutica (Figure 5). The current range of P. tangutica covers humid regions with annual precipitation more than 600 mm, while P. mongolica is distributed in the arid environment with annual precipitation less than 200 mm (Figure 1b). This shows precipitation availability plays an important role in shaping the distributions of P. mongolica [49]. This species could resist drought stress by morphological, physiological, biochemical, and genetic approaches [50]. During its long-term evolutionary history, P. mongolica could have formed a special genetic mechanism to adapt to arid environments. Based on a genetic environment association analysis, several genes were identified to be related to the environmental adaptation of P. mongolica in response to abiotic stresses. These genes regulated and controlled pathways of endocrine resistance, calcium signaling, and RNA transport. The functions of these genes could generate proteins for physiological adaptations, i.e., oxidoreductase activity, transmembrane transporter activity, and catalytic activity. These metabolic and transcriptional pathways are genetic mechanisms of Prunus species to improve tolerance to drought, low temperature, and other environmental stresses [51,52,53]. At the same time, several genes were related to energy metabolism, including pathways of pentose and glucuronate interconversions and starch and sucrose metabolism. The biological process of energy metabolism also plays an important role in drought tolerance for Prunus species [54,55]. Thus, it indicates that physiological adaptations, as indicated by the above adaptive genes, were most likely the main genetic mechanism of P. mongolica in response to the arid environment in Northwestern China.

5. Conclusions

In the present study, we found these four wild almond species were not clustered into the same lineage of Prunus according to chloroplast genomes and the genome-wide SNP dataset. The two polyploid species, P. pedunculata and P. triloba, could have originated from wild cherry species. Phylogeny of chloroplast genomes showed P. tenella had a close relationship with wild cherry species, but genome-wide SNP data did not support this phylogenetic position. It speculated that P. tenella could have originated from historical hybridization among different clades of Prunus. It showed that P. tenella had diverged from other Prunus species during the middle Miocene (ca. 7.81 Ma to 17.77 Ma). P. mongolica and P. tangutica were clustered in the core of Prunus subg. Amygdalus. P. mongolica is the most drought-tolerant plant within the Prunus subg. Amygdalus in China, which is fragmentally distributed in sand and rocky deserts of Northwestern China. P. mongolica diverged from P. tangutica during the late Pliocene to the Quaternary (ca. 2.93 Ma). In comparison with P. tangutica covering humid regions, precipitation variables were the most important environmental factors influencing genetic variations in P. mongolica. Physiological adaptations were most likely the main genetic mechanism of P. mongolica in response to increasing aridity in Northwestern China.

Supplementary Materials

The following supporting information can be downloaded at: https://www.mdpi.com/article/10.3390/f15050834/s1, Figure S1: Projection of the datasets from the training set on the first two linear discriminant analysis (LDA) axes for the four alternate scenarios by ABC random forest (ABC-RF) approach; Figure S2: Evolution of prediction power relatively to the number of trees in the forest by ABC random forest (ABC-RF) approach; Figure S3: Contributions of the 50 most informative statistics to the Random Forest when choosing among the four alternate scenarios.

Author Contributions

Conceptualization, H.-X.Z.; methodology, H.-X.Z., X.-F.Z. and J.Z.; software, H.-X.Z., X.-F.Z. and J.Z.; validation, H.-X.Z., X.-F.Z. and J.Z.; formal analysis, H.-X.Z., X.-F.Z. and J.Z.; investigation, H.-X.Z., X.-F.Z. and J.Z.; resources, H.-X.Z.; data curation, H.-X.Z., X.-F.Z. and J.Z.; writing—original draft preparation, H.-X.Z.; writing—review and editing, H.-X.Z.; visualization, H.-X.Z.; supervision, H.-X.Z.; project administration, H.-X.Z.; funding acquisition, H.-X.Z. All authors have read and agreed to the published version of the manuscript.

Funding

This research was funded by “Western Light” program of the Chinese Academy of Sciences (2022-XBQNXZ-007), the National Natural Science Foundation of China (32170391), Biological Resources Programme, Chinese Academy of Sciences (KFJ-BRP-007-008), the Second Tibetan Plateau Scientific Expedition and Research (STEP) Program (2019QZKK0502), and the Third Xinjiang Scientific Expedition Program (2022xjkk0202).

Data Availability Statement

The new sequenced chloroplast genomes of this study are available in GenBank (https://www.ncbi.nlm.nih.gov/Genbank; accessed on 1 March 2024) under the accession numbers OR876377-OR876390. The new obtained raw RADseq reads were available on National Genomics Data Center (https://ngdc.cncb.ac.cn/; accessed on 1 March 2024) Genome Sequence Archive (GSA) under accession number CRA013629. The performences of ABC random forest (ABC-RF) approach were presented in Figures S1–S3.

Conflicts of Interest

The authors declare no conflicts of interest.

References

  1. Stern, D.L. The genetic causes of convergent evolution. Nat. Rev. Genet. 2013, 14, 751–764. [Google Scholar] [CrossRef]
  2. Elmer, K.R.; Meyer, A. Adaptation in the age of ecological genomics: Insights from parallelism and convergence. Trends Ecol. Evol. 2011, 26, 298–306. [Google Scholar] [CrossRef]
  3. Oke, K.B.; Rolshausen, G.; LeBlond, C.; Hendry, A.P. How parallel is parallel evolution? A comparative analysis in fishes. Am. Nat. 2017, 190, 1–16. [Google Scholar] [CrossRef]
  4. Roda, F.; Ambrose, L.; Walter, G.M.; Liu, H.L.; Schaul, A.; Lowe, A.; Pelser, P.B.; Prentis, P.; Rieseberg, L.H.; Ortiz-Barrientos, D. Genomic evidence for the parallel evolution of coastal forms in the Senecio lautus complex. Mol. Ecol. 2013, 22, 2941–2952. [Google Scholar] [CrossRef] [PubMed]
  5. Duran-Castillo, M.; Hudson, A.; Wilson, Y.; Field, D.L.; Twyford, A.D. A phylogeny of Antirrhinum reveals parallel evolution of alpine morphology. New Phytol. 2022, 233, 1426–1439. [Google Scholar] [CrossRef]
  6. Fan, L.-L.; Tang, L.-S.; Wu, L.-F.; Ma, J.; Li, Y. The limited role of snow water in the growth and development of ephemeral plants in a cold desert. J. Veg. Sci. 2014, 25, 681–690. [Google Scholar] [CrossRef]
  7. Zhou, H.; Zhao, W.; Zhang, G. Varying water utilization of Haloxylon ammodendron plantations in a desert-oasis ecotone. Hydrol. Process. 2017, 31, 825–835. [Google Scholar] [CrossRef]
  8. Song, C.; Hu, S.; Han, W.; Zhang, T.; Fang, X.; Gao, J.; Wu, F. Middle Miocene to earliest Pliocene sedimentological and geochemical records of climate change in the western Qaidam Basin on the NE Tibetan Plateau. Palaeogeogr. Palaeoclim. Palaeoecol. 2014, 395, 67–76. [Google Scholar] [CrossRef]
  9. Tang, Z.-H.; Ding, Z.-L. A palynological insight into the Miocene aridification in the Eurasian interior. Palaeoworld 2013, 22, 77–85. [Google Scholar] [CrossRef]
  10. Yang, X.; Scuderi, L.; Paillou, P.; Liu, Z.; Li, H.; Ren, X. Quaternary environmental changes in the drylands of China—A critical review. Quat. Sci. Rev. 2011, 30, 3219–3233. [Google Scholar] [CrossRef]
  11. Guan, Q.; Pan, B.; Li, N.; Zhang, J.; Xue, L. Timing and significance of the initiation of present day deserts in the northeastern Hexi Corridor, China. Palaeogeogr. Palaeoclimatol. Palaeoecol. 2011, 306, 70–74. [Google Scholar]
  12. Zhang, M.-L.; Fritsch, P.W. Evolutionary response of Caragana (Fabaceae) to Qinghai-Tibetan Plateau uplift and Asian interior aridification. Plant Syst. Evol. 2010, 288, 191–199. [Google Scholar] [CrossRef]
  13. Yao, G.-Q.; Nie, Z.-F.; Turner, N.C.; Li, F.-M.; Gao, T.-P.; Fang, X.-W.; Scoffoni, C. Combined high leaf hydraulic safety and efficiency provides drought tolerance in Caragana species adapted to low mean annual precipitation. New Phytol. 2021, 229, 230–244. [Google Scholar] [CrossRef] [PubMed]
  14. Ladizinsky, G. On the origin of almond. Genet. Resour. Crop Evol. 1999, 46, 143–147. [Google Scholar] [CrossRef]
  15. Yazbek, M.M.; Al-Zein, M.S. Wild almonds gone wild: Revisiting Darwin’s statement on the origin of peaches. Genet. Resour. Crop Evol. 2014, 61, 1319–1328. [Google Scholar] [CrossRef]
  16. Vander Wall, S.B. The evolutionary ecology of nut dispersal. Bot. Rev. 2001, 67, 74–117. [Google Scholar] [CrossRef]
  17. Wang, W.; Yang, T.; Wang, H.-L.; Li, Z.-J.; Ni, J.-W.; Su, S.; Xu, X.-Q. Comparative and phylogenetic analyses of the complete chloroplast genomes of six almond species (Prunus spp. L.). Sci. Rep. 2020, 10, 10137. [Google Scholar] [CrossRef]
  18. Chin, S.-W.; Shaw, J.; Haberle, R.; Wen, J.; Potter, D. Diversification of almonds, peaches, plums and cherries—Molecular systematics and biogeographic history of Prunus (Rosaceae). Mol. Phylogenet. Evol. 2014, 76, 34–48. [Google Scholar] [CrossRef] [PubMed]
  19. Yazbek, M.; Oh, S.H. Peaches and almonds: Phylogeny of Prunus subg. Amygdalus (Rosaceae) based on DNA sequences and morphology. Plant Syst. Evol. 2013, 299, 1403–1418. [Google Scholar] [CrossRef]
  20. Fernandez-Mazuecos, M.; Mellers, G.; Vigalondo, B.; Saez, L.; Vargas, P.; Glover, B.J. Resolving recent plant radiations: Power and robustness of Genotyping-by-Sequencing. Syst. Biol. 2018, 67, 250–268. [Google Scholar] [CrossRef]
  21. Twyford, A.D.; Ennos, R.A. Next-generation hybridization and introgression. Heredity 2012, 108, 179–189. [Google Scholar] [CrossRef] [PubMed]
  22. Srivastav, M.; Clement, W.L.L.; Landrein, S.; Zhang, J.; Howarth, D.G.G.; Donoghue, M.J.J. A phylogenomic analysis of Lonicera and its bearing on the evolution of organ fusion. Am. J. Bot. 2023, 110, e16143. [Google Scholar] [CrossRef] [PubMed]
  23. Zhang, H.-X.; Wang, Q.; Wen, Z.-B. Spatial genetic structure of Prunus mongolica in arid Northwestern China based on RAD sequencing data. Diversity 2021, 13, 397. [Google Scholar] [CrossRef]
  24. Jin, J.-J.; Yu, W.-B.; Yang, J.-B.; Song, Y.; dePamphilis, C.W.; Yi, T.-S.; Li, D.-Z. GetOrganelle: A fast and versatile toolkit for accurate de novo assembly of organelle genomes. Genome Biol. 2020, 21, 241. [Google Scholar] [CrossRef] [PubMed]
  25. Kearse, M.; Moir, R.; Wilson, A.; Stones-Havas, S.; Cheung, M.; Sturrock, S.; Buxton, S.; Cooper, A.; Markowitz, S.; Duran, C.; et al. Geneious Basic: An integrated and extendable desktop software platform for the organization and analysis of sequence data. Bioinformatics 2012, 28, 1647–1649. [Google Scholar] [CrossRef] [PubMed]
  26. Katoh, K.; Standley, D.M. MAFFT multiple sequence alignment software version 7: Improvements in performance and usability. Mol. Biol. Evol. 2013, 30, 772–780. [Google Scholar] [CrossRef] [PubMed]
  27. Nguyen, L.-T.; Schmidt, H.A.; von Haeseler, A.; Minh, B.Q. IQ-TREE: A fast and effective stochastic algorithm for estimating Maximum-Likelihood phylogenies. Mol. Biol. Evol. 2015, 32, 268–274. [Google Scholar] [CrossRef] [PubMed]
  28. Baird, N.A.; Etter, P.D.; Atwood, T.S.; Currey, M.C.; Shiver, A.L.; Lewis, Z.A.; Selker, E.U.; Cresko, W.A.; Johnson, E.A. Rapid SNP discovery and genetic mapping using sequenced RAD markers. PLoS ONE 2008, 3, e3376. [Google Scholar] [CrossRef]
  29. Chen, S.; Zhou, Y.; Chen, Y.; Gu, J. fastp: An ultra-fast all-in-one FASTQ preprocessor. Bioinformatics 2018, 34, 884–890. [Google Scholar] [CrossRef]
  30. Li, H.; Durbin, R. Fast and accurate short read alignment with Burrows-Wheeler transform. Bioinformatics 2009, 25, 1754–1760. [Google Scholar] [CrossRef]
  31. Li, H.; Handsaker, B.; Wysoker, A.; Fennell, T.; Ruan, J.; Homer, N.; Marth, G.; Abecasis, G.; Durbin, R.; 1000 Genome Project Data Processing Subgroup. The Sequence Alignment/Map format and SAMtools. Bioinformatics 2009, 25, 2078–2079. [Google Scholar] [CrossRef]
  32. Purcell, S.; Neale, B.; Todd-Brown, K.; Thomas, L.; Ferreira, M.A.R.; Bender, D.; Maller, J.; Sklar, P.; de Bakker, P.I.W.; Daly, M.J.; et al. PLINK: A tool set for whole-genome association and population-based linkage analyses. Am. J. Hum. Genet. 2007, 81, 559–575. [Google Scholar] [CrossRef] [PubMed]
  33. Alexander, D.H.; Novembre, J.; Lange, K. Fast model-based estimation of ancestry in unrelated individuals. Genome Res. 2009, 19, 1655–1664. [Google Scholar] [CrossRef] [PubMed]
  34. Yang, J.; Lee, S.H.; Goddard, M.E.; Visscher, P.M. GCTA: A tool for genome-wide complex trait analysis. Am. J. Hum. Genet. 2011, 88, 76–82. [Google Scholar] [CrossRef]
  35. Collin, F.-D.; Durif, G.; Raynal, L.; Lombaert, E.; Gautier, M.; Vitalis, R.; Marin, J.-M.; Estoup, A. Extending approximate Bayesian computation with supervised machine learning to infer demographic history from genetic polymorphisms using DIYABC Random Forest. Mol. Ecol. Resour. 2021, 21, 2598–2613. [Google Scholar] [CrossRef]
  36. Yu, Y.; Fu, J.; Xu, Y.; Zhang, J.; Ren, F.; Zhao, H.; Tian, S.; Guo, W.; Tu, X.; Zhao, J.; et al. Genome re-sequencing reveals the evolutionary history of peach fruit edibility. Nat. Commun. 2018, 9, 5404. [Google Scholar] [CrossRef]
  37. Gugger, P.F.; Liang, C.T.; Sork, V.L.; Hodgskiss, P.; Wright, J.W. Applying landscape genomic tools to forest management and restoration of Hawaiian koa (Acacia koa) in a changing environment. Evol. Appl. 2018, 11, 231–242. [Google Scholar] [CrossRef]
  38. Jiang, X.-L.; Gardner, E.M.; Meng, H.-H.; Deng, M.; Xu, G.-B. Land bridges in the Pleistocene contributed to flora assembly on the continental islands of South China: Insights from the evolutionary history of Quercus championii. Mol. Phylogenet. Evol. 2019, 132, 36–45. [Google Scholar] [CrossRef] [PubMed]
  39. Brown, J.L.; Hill, D.J.; Dolan, A.M.; Carnaval, A.C.; Haywood, A.M. PaleoClim, high spatial resolution paleoclimate surfaces for global land areas. Sci. Data 2018, 5, 180254. [Google Scholar] [CrossRef]
  40. Oksanen, J.; Blanchet, F.G.; Friendly, M.; Kindt, R.; Legendre, P.; McGlinn, D.; Minchin, P.R.; O’Hara, R.B.; Simpson, G.L.; Solymos, P.; et al. Vegan v2.6: Community Ecology Package. Available online: https://CRAN.R-project.org/package=vegan (accessed on 5 March 2024).
  41. Frichot, E.; Francois, O. LEA: An R package for landscape and ecological association studies. Methods Ecol. Evol. 2015, 6, 925–929. [Google Scholar] [CrossRef]
  42. Storey, J.D.; Tibshirani, R. Statistical significance for genome wide studies. Proc. Natl. Acad. Sci. USA 2003, 100, 9440–9445. [Google Scholar] [CrossRef] [PubMed]
  43. Capblancq, T.; Luu, K.; Blum, M.G.B.; Bazin, E. Evaluation of redundancy analysis to identify signatures of local adaptation. Mol. Ecol. Resour. 2018, 18, 1223–1233. [Google Scholar] [CrossRef] [PubMed]
  44. Shang, Z.; Su, G. Chromosome numbers of six species in the genus Amygdalus from China. J. Wuhan Bot. Res. 1985, 3, 363–366. [Google Scholar]
  45. Wan, T.; Qiao, B.-X.; Zhou, J.; Shao, K.-S.; Pan, L.-Y.; An, F.; He, X.-S.; Liu, T.; Li, P.-K.; Cai, Y.-L. Evolutionary and phylogenetic analyses of 11 Cerasus species based on the complete chloroplast genome. Front. Plant Sci. 2023, 14, 1070600. [Google Scholar] [CrossRef] [PubMed]
  46. Gu, Y.; Shi, G.; Zhen, L.; Wang, X. Karyotype parameters analysis and genetic relationship discussion of Cerasus (Rosaceae). J. Nanjing For. Univ. Nat. Sci. Ed. 2014, 38, 25–29. [Google Scholar]
  47. Hodel, R.G.J.; Zimmer, E.; Wen, J. A phylogenomic approach resolves the backbone of Prunus (Rosaceae) and identifies signals of hybridization and allopolyploidy. Mol. Phylogenet. Evol. 2021, 160, 107118. [Google Scholar] [CrossRef] [PubMed]
  48. Torfstein, A.; Steinberg, J. The Oligo-Miocene closure of the Tethys Ocean and evolution of the proto-Mediterranean Sea. Sci. Rep. 2020, 10, 13817. [Google Scholar] [CrossRef] [PubMed]
  49. Zhu, G.-P.; Li, H.-Q.; Zhao, L.; Man, L.; Liu, Q. Mapping the ecological dimensions and potential distributions of endangered relic shrubs in western Ordos biodiversity center. Sci. Rep. 2016, 6, 26268. [Google Scholar] [CrossRef] [PubMed]
  50. Wang, J.; Zheng, R.; Bai, S.; Gao, X.; Liu, M.; Yan, W. Mongolian Almond (Prunus mongolica Maxim): The morpho-physiological, biochemical and transcriptomic response to drought stress. PLoS ONE 2015, 10, e0124442. [Google Scholar] [CrossRef] [PubMed]
  51. Sevilla, E.; Andreu, P.; Fillat, M.F.; Luisa Peleato, M.; Marin, J.A.; Arbeloa, A. Identification of early salt-stress-responsive proteins in In Vitro Prunus cultured excised roots. Plants 2022, 16, 2101. [Google Scholar] [CrossRef]
  52. Li, S.; Zheng, G.; Wang, F.; Yu, H.; Wang, S.; Guan, H.; Lv, F.; Xia, Y. Expression and Functional Analysis of the PaPIP1-2 Gene during Dormancy and Germination Periods of Kernel-Using Apricot (Prunus armeniaca L.). Forests 2023, 14, 2306. [Google Scholar] [CrossRef]
  53. Jimenez, S.; Dridi, J.; Gutierrez, D.; Moret, D.; Irigoyen, J.J.; Moreno, M.A.; Gogorcena, Y. Physiological, biochemical and molecular responses in four Prunus rootstocks submitted to drought stress. Tree Physiol. 2013, 33, 1061–1075. [Google Scholar] [CrossRef] [PubMed]
  54. Gao, H.; Yu, W.; Yang, X.; Liang, J.; Sun, X.; Sun, M.; Xiao, Y.; Peng, F. Silicon enhances the drought resistance of peach seedlings by regulating hormone, amino acid, and sugar metabolism. BMC Plant Biol. 2022, 22, 422. [Google Scholar] [CrossRef] [PubMed]
  55. Cao, Y.; Luo, Q.; Tian, Y.; Meng, F. Physiological and proteomic analyses of the drought stress response in Amygdalus Mira (Koehne) Yu et Lu roots. BMC Plant Biol. 2017, 17, 53. [Google Scholar] [CrossRef] [PubMed]
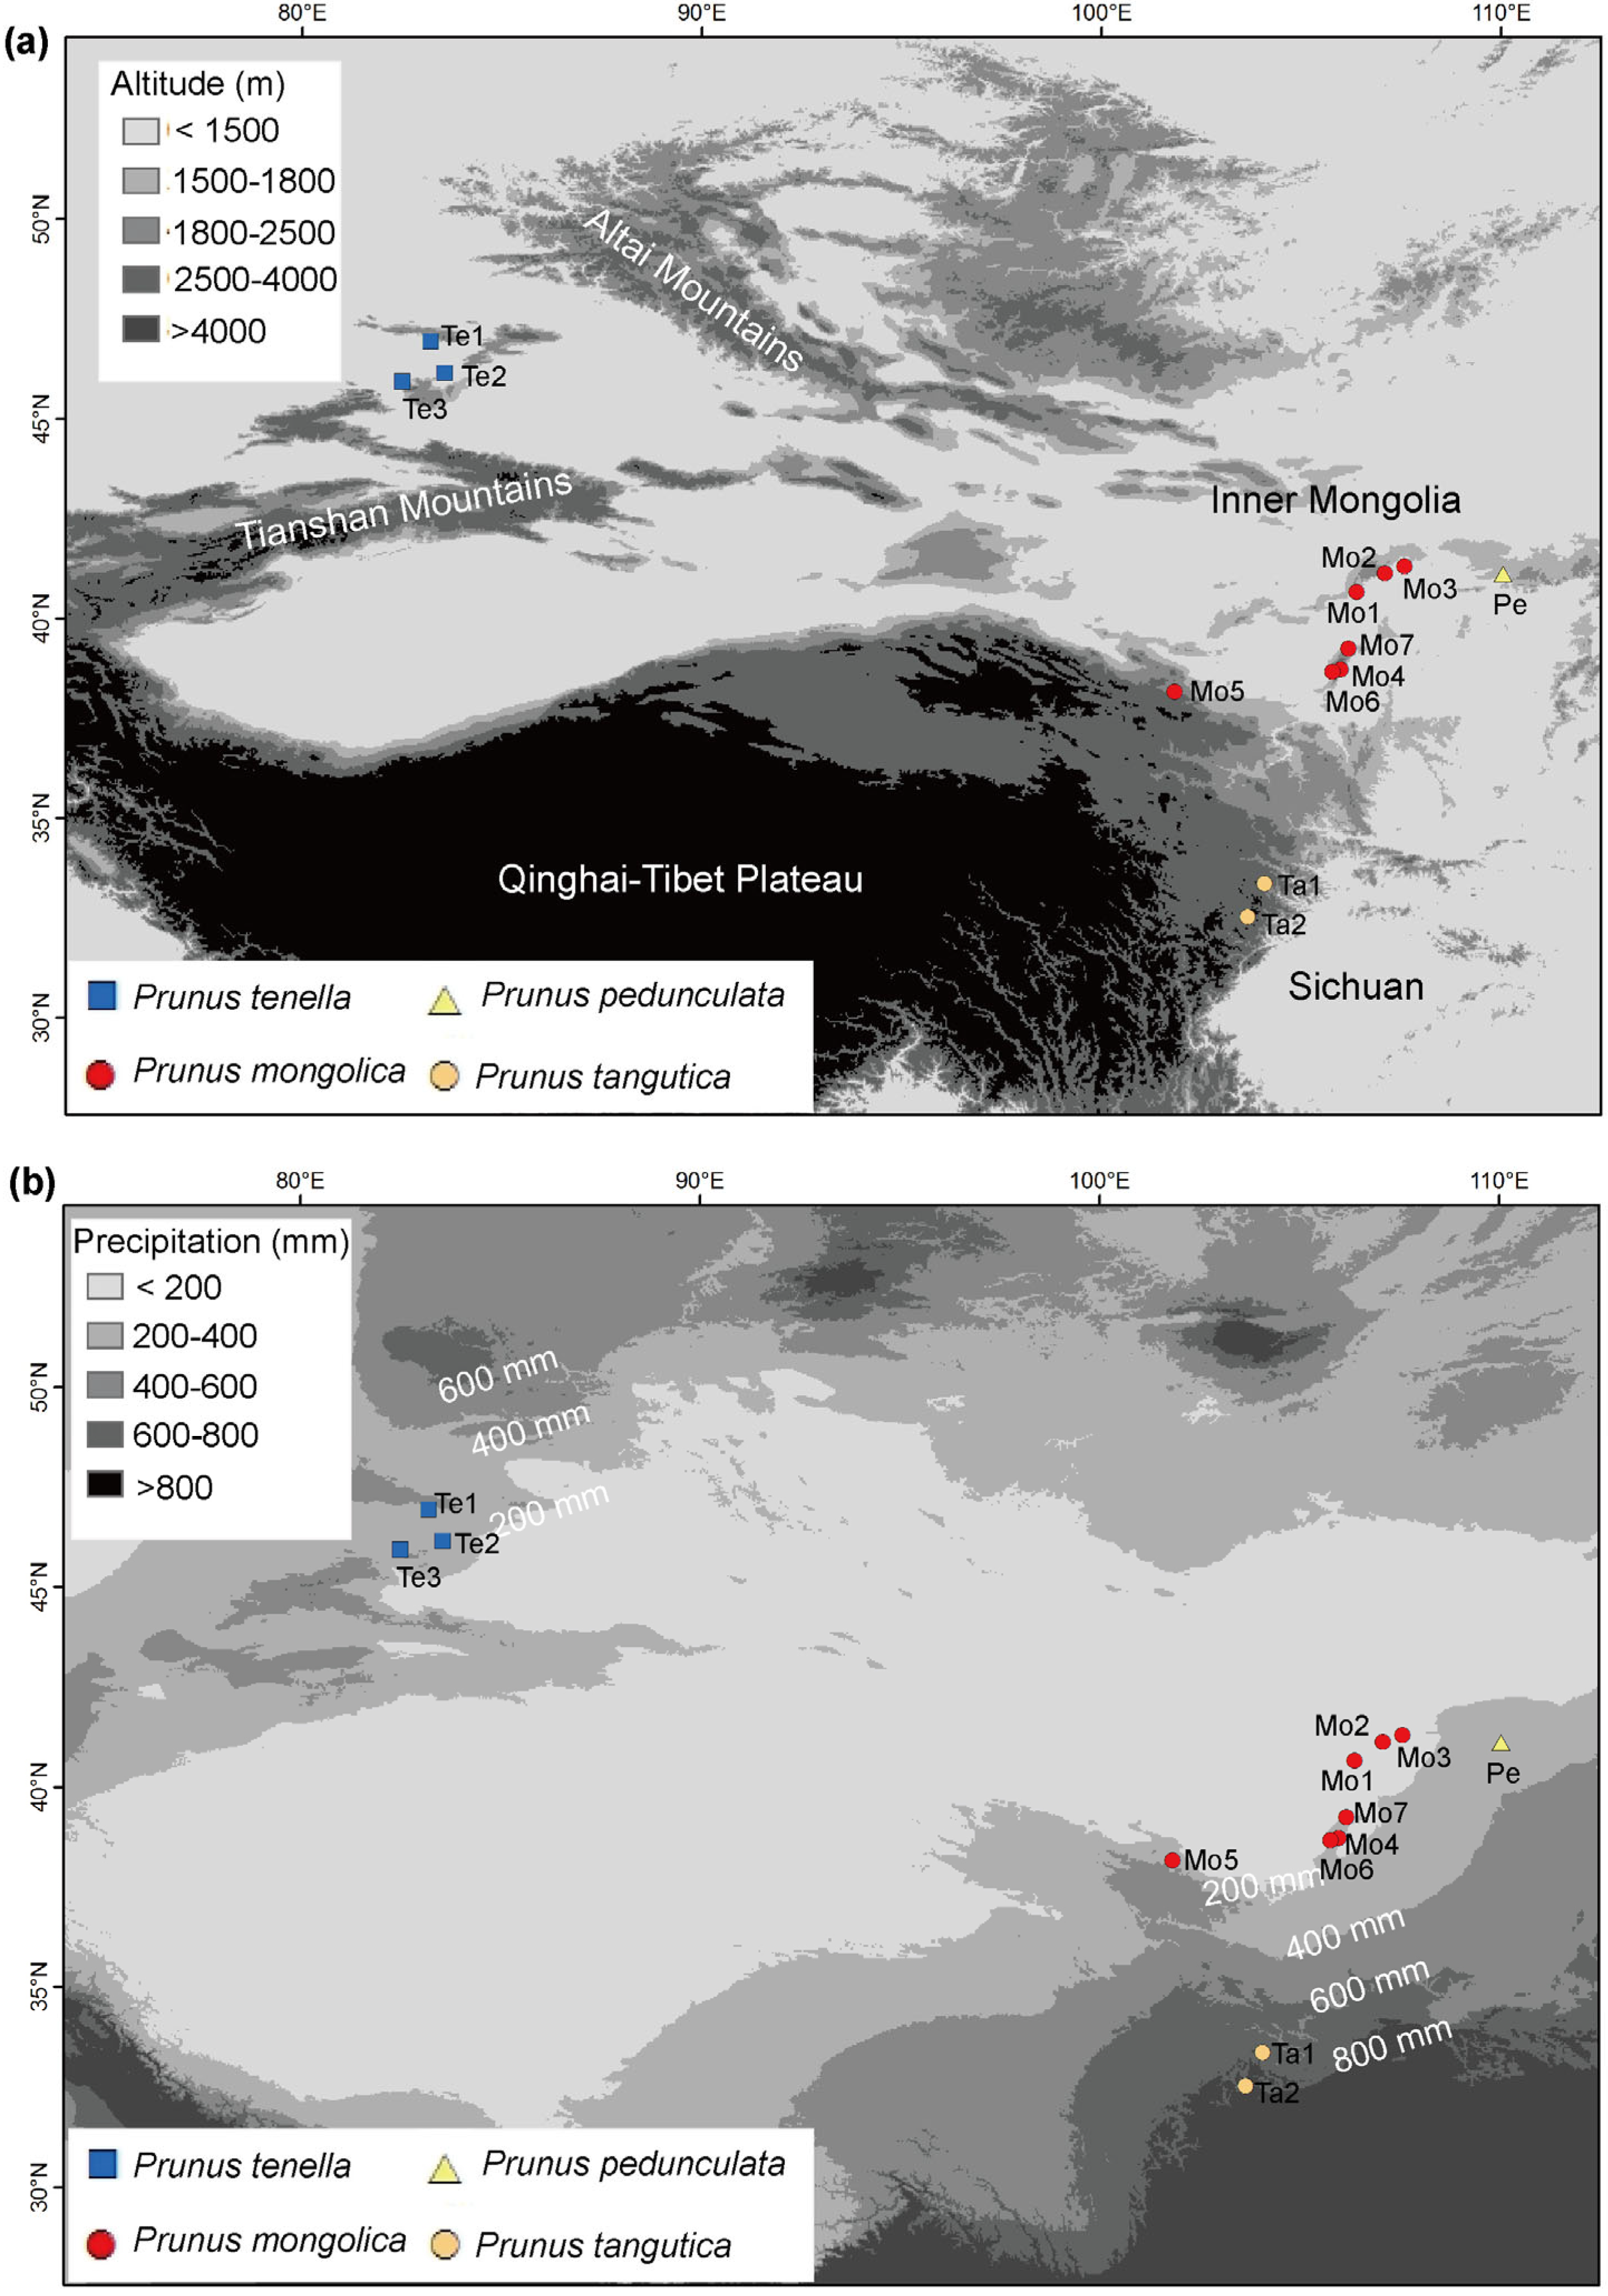
Figure 1. The geographical distribution of sampled populations from four wild almond species (Prunus spp. L.). Population codes are consistent with Table 1. (a) altitude background; (b) precipitation background. Map generated in ESRI ArcGIS 10.8.
Forests 15 00834 g001
Figure 2. Maximum-Likelihood (ML) phylogenetic tree of sampled four wild almond species (Prunus spp. L.), 16 other Prunus species and 12 outgroups based on complete chloroplast genomes.
Forests 15 00834 g002
Figure 3. Genetic structure of the 181 individuals from sampled Prunus species based on genome-wide SNPs data. (a) Genetic clustering of these sampled individuals using ADMIXTURE at K = 5; (b) Principal component analysis (PCA) showing the first two principal components; (c) Maximum-Likelihood (ML) phylogenetic tree of these sampled individuals. The numbers near the branches show the bootstrap values of the nodes (%).
Forests 15 00834 g003
Figure 4. Four alternate demographical scenarios of lineage divergence among these five groups of sampled Prunus species based on genome-wide SNPs data by an ABC random forest (ABC-RF) approach. (ad) represent Scenario 1 to Scenario 4.
Forests 15 00834 g004
Figure 5. The results of gradient forest (GF) analysis. (a) R2-weighted importance of environmental variables that explain genetic gradients; (b) Cumulative importance of allelic change along the first six environmental gradients.
Forests 15 00834 g005
Figure 6. Redundancy analysis showing the relationship between environmental variables and genetic variations. Individuals are larger colored points. Small gray points are SNPs. bio 18: precipitation of warmest quarter, bio 15: precipitation seasonality, bio 11: mean temperature of the coldest quarter, bio 10: mean temperature of the warmest quarter, bio 9: mean temperature of driest quarter, and bio 19: precipitation of the coldest quarter.
Forests 15 00834 g006
Table 1. Species names, population information, and individual numbers (Nind) of sampled Prunus species.
SpeciesPopulation CodeLocationVoucher SpecimenNind
Prunus tenella
Te1Tacheng, Xinjiang, ChinaAN-TC-0111
Te2Tuoli, Xinjiang, ChinaAN-TL-0112
Te3Yumin, Xinjiang, ChinaAN-YM-0112
Prunus mongolica
Mo1Dengkou, Inner Mongolia, ChinaAM-DK-00114
Mo2Wulatehou Banner, Inner Mongolia, ChinaAM-WHQ-00112
Mo3Wulate Middle Banner, Inner Mongolia, ChinaAM-WZQ-0011
Mo4Yinchuan, Ningxia, ChinaAM-YC-00112
Mo5Yongchang, Gansu, ChinaAM-YCX-0018
Mo6Alxa Left Banner, Inner Mongolia, ChinaAM-ZQG-00113
Mo7Alxa Left Banner, Inner Mongolia, ChinaAM-ZQZ-00110
Prunus tangutica
Ta1Jiuzhaigou, Sichuan, ChinaAX-JZG-0115
Ta2Songpan, Sichuan, ChinaAX-SP-018
Prunus pedunculataPeGuyang, Inner Mongolia, ChinaAC-BT-0112
Prunus triloba Botanical Garden in Urumqi, Xinjiang, China4
Prunus tomentosa Helan Mountain, Ningxia, ChinaMYT-YC-012
Prunus tianshanica Tekes, Xinjiang, ChinaCT-TKS-0115
Prunus cerasifera Huocheng, Xinjiang, ChinaPC-HC-0120
Table 2. Expectation and 95% CI values of parameters for the best demographical model (Scenario 1) from ABC random forest (ABC-RF) approach.
ParameterExpectation95% CI
N13.3 × 1052.9 × 103–1.1 × 10⁶
N28.5 × 1061.2 × 105–2.6 × 10⁷
N34.9 × 1057.8 × 102–2.3 × 10⁶
N47.0 × 1063.5 × 104–9.3 × 10⁶
N54.1 × 1061.2 × 102–2.2 × 10⁷
t12.93 Ma0.03–8.95 Ma
t22.36 Ma0.01–8.58 Ma
t37.81 Ma0.05–27.97 Ma
t417.77 Ma0.20–47.29 Ma
N1, N2, N3, N4 and N5 represent the effective population sizes of group 1 to group 5; t1, t2, t3 and t4 are the time points when lineage divergences occur. These parameters are consistent with Figure 4.
Disclaimer/Publisher’s Note: The statements, opinions and data contained in all publications are solely those of the individual author(s) and contributor(s) and not of MDPI and/or the editor(s). MDPI and/or the editor(s) disclaim responsibility for any injury to people or property resulting from any ideas, methods, instructions or products referred to in the content.