Article

Alien Species Introduction and Demographic Changes Contributed to the Population Genetic Structure of the Nut-Yielding Conifer Torreya grandis (Taxaceae)

1
Key Laboratory of Ecology of Rare and Endangered Species and Environmental Protection, Ministry of Education, Guangxi Normal University, Guilin 541006, China
2
Guangxi Key Laboratory of Landscape Resources Conservation and Sustainable Utilization in Lijiang River Basin, Guangxi Normal University, Guilin 541006, China
3
Laboratory of Subtropical Biodiversity, Jiangxi Agricultural University, Nanchang 330045, China
4
State Key Laboratory of Grassland Agro-Ecosystems, School of Life Sciences, Lanzhou University, Lanzhou 730000, China
*
Authors to whom correspondence should be addressed.
Forests 2024, 15(8), 1451; https://doi.org/10.3390/f15081451 (registering DOI)
Submission received: 22 July 2024 / Revised: 13 August 2024 / Accepted: 16 August 2024 / Published: 17 August 2024

Abstract

:
Understanding population genetic structure and its possible causal factors is critical for utilizing genetic resources and genetic breeding of economically important plants. Although Torreya grandis is an important conifer producing nuts in China, little is known about its population structure, let alone the causal factors that shaped its genetic variation pattern and population structure. In this work, we intended to characterize the genetic variation pattern and population structure of the nut-yielding conifer T. grandis throughout its whole geographical distribution and further explore the potentially causal factors for the population structure using multiple approaches. A moderate level of genetic diversity and a novel population structure were revealed in T. grandis based on eleven robust EST-SSR loci and three chloroplast fragments. Alien genetic composition derived from the closely related species T. nucifera endemic to Japan was detected in the Kuaiji Mountain area, where the seed quality of T. grandis is considered the best in China. Demography history and niche modeling were inferred and performed, and the contribution of geographic isolation to its population structure was compared with that of environmental isolation. Significant demographic changes occurred, including a dramatic population contraction during the Quaternary, and population divergence was significantly correlated with geographic distance. These results suggested that early breeding activities and demographic changes significantly contributed to the population structure of T. grandis. In turn, the population structure was potentially associated with the excellent variants and adaptation of cultivars of T. grandis. The findings provide important information for utilizing genetic resources and genetic breeding of T. grandis in the future.

1. Introduction

Ascertaining the population genetic structure and its possible causal factors is critical for understanding genetic variation origins and conserving and utilizing genetic resources, especially for economically important species [1,2,3]. Climatic oscillation, such as glacial cycles during the Quaternary, is considered a common factor that drove population demographic processes concerning population expansions and contractions and range shifts [4,5] and thereby resulted in changes in population genetic composition by creating temporal and spatial heterogeneity in the environment [6,7]. Geographic barriers could further increase the accumulation of endemic variants within populations through mutation, genetic drift, and local adaptation, particularly for species with a broad geographical distribution [8,9], resulting in genetic differentiation increasing with geographic distance due to limited dispersal in plants [10,11].
Furthermore, recent breeding activities are also a non-negligible force influencing genetic diversity and population structure in crops [3,12]. Unlike herbaceous crops, tree crops are perennials and have a long breeding cycle, so introducing excellent variants from wild resources or alien species, such as Citrus crops, Actinidia species, and Pinus armandii, by planting or interspecific hybridization has become a common and efficient breeding strategy [13,14,15]. On the other hand, local adaptive variants were also expected and created by breeding activities and/or heterogeneous environments in response to local selection pressures [16,17], resulting in divergent subpopulations across the distribution under a complex interplay of multiple forces. Therefore, the exploration of population structure is essential for understanding genetic variation patterns that are valuable to genetic breeding in tree crops.
Torreya grandis Fortune ex Lindl. (Taxaceae) naturally grows as semiwild ancient trees, and most of them are more than a hundred years old [18]. Owing to its restriction to habitats in warm–cool, rainy, and moist valleys, the ancient conifer is restricted to only a few mountainous regions with a fragmented distribution but with a broad geographical scale across Zhejiang, Anhui, Jiangxi, Hunan, and Fujian in southeast China [18,19]. Given the complex topography and heterogeneous environments across the broader ranges of southeast China [20,21] and the habitat specificity of T. grandis, the genetic variation pattern of the conifer was expected to be heavily influenced by the climatic environment and geographic isolation. In addition, because of its important economic value related to the production of edible and nutrient-rich seeds, it is regarded as a source of these tidbits and has been utilized by Chinese people for thousands of years [18,22]. T. grandis cv. merrillii, as the only commercial cultivar, was planted through vegetative propagation in which a shoot was grafted onto an old tree or seedling, and the grafted shoot was mainly derived from some excellent variants of ancient T. grandis trees with high seed yield and quality [18,23]. For example, the Kuaiji Mountain area, located between Zhuji and Dongyang, Zhejiang (Figure 1), is known as the cultivation and origin center of T. grandis cv. merrillii, and the seed yield and quality produced in this area are considered the best in China [18,24]. This excellent quality might have benefited from the unique genetic variants of T. grandis in the Kuaiji Mountain area, which were possibly derived from allopatric species T. nucifera, as revealed by population genetic analysis [25].
Although several studies have explored the genetic diversity of T. grandis based on different molecular markers (e.g., SSRs, AFLPs, and ISSRs), all these studies only focused on sampling from local areas, such as the Kuaiji Mountain area or Zhejiang [26,27,28,29], ignoring the genetic variation pattern across its whole geographical range, let alone the causal forces that shaped the genetic variation pattern and population structure of T. grandis. Within the context of breeding activities and climatic changes, multiple underlying forces, such as demographic changes due to historical climatic oscillations, geographic isolation owing to complex topography in southeast China, interspecific hybridization with the sympatric species T. jackii [30,31], and alien species introduction from the most closely related species T. nucifera [25], alone or jointly contributed to the genetic variation pattern and population structure of T. grandis. For these purposes, two types of molecular markers, expressed sequence tag (EST)-SSR markers and chloroplast genes, were chosen in the present study. EST-SSR markers from the nuclear genome are inherited biparentally and are usually related to the function of genes, so they are suitable for measuring functional diversity in relation to adaptive variation [32,33]. In addition, since the markers have few null alleles and often do not deviate significantly from expectations of neutral evolution, they can be powerfully applied to distinguish closely related taxa and ascertain demographic processes [34,35,36]. Although chloroplast genes evolve slower and are less polymorphic than nuclear genes in Torreya, they are maternally inherited and can help in deducing the source of genetic composition in T. grandis [30].
In the present study, based on eleven robust EST-SSR loci developed from a T. grandis transcriptome in our previous study [25] and three chloroplast genes (rpl16, rpoB-trnC and trnL-trnF), we investigated the geographic patterns of genetic variation of T. grandis in combination with data from two closely related species, T. nucifera and T. jackii. We also inferred the demographic changes and geographic isolation using the coalescent-based approach (approximate Bayesian computation (ABC)) and niche modeling and population genetic analyses. We aimed to characterize the population genetic structure of T. grandis with population sampling across its whole geographical distribution and further explore the potentially causal factors, such as breeding activities, demographic changes, and geographic isolation, that alone or jointly contributed to the population genetic structure of T. grandis.

2. Materials and Methods

2.1. Plant Material and DNA Extraction

The natural distribution of T. grandis is mainly restricted to the mountain regions of southeast China. To avoid the influence of recently cultivated plants, including the grafted trees and cultivated seedlings, only natural ancient trees of T. grandis were investigated and sampled across its entire geographical distribution (Figure 1). Given that closely related species could contribute to the genetic structure of T. grandis via interspecific hybridization or other processes, samples from the sympatric species T. jackii and the closest relative T. nucifera were also collected [30].
Fresh leaves of 203 individuals were collected from 16 populations of T. grandis, and those of 6 and 8 individuals were collected separately from one population each of T. jackii and T. nucifera (Table 1). The leaf samples were immediately dried in silica gel after sampling and stored at −80 °C until genomic DNA extraction. Total genomic DNA was extracted from approximately 20 mg of dried leaves of each individual using a modified CTAB procedure [37].

2.2. Locus Amplification and Sequencing

Three chloroplast (cp) DNA fragments, rpl16, rpoB-trnC, and trnL-trnF, were amplified following the protocols in our previous studies [30,38,39] with previously reported primers [40,41]. Sequencing reactions were performed with polymerase chain reaction (PCR) primers by Sangon Biotech (Shanghai, China). Sequences of the same locus were aligned and checked using MEGA X [42]. Because the chloroplast genome is inherited uniparentally in gymnosperms [43], the three cpDNA regions were concatenated into a single matrix for subsequent analyses.
Eleven specific EST-SSR loci for T. grandis were amplified with the primers developed in our previous study [25]. PCR amplification was carried out in a 12 μL volume, including 4 μL of sterile water, 5 μL of 2× Taq PCR MasterMix (Tiangen, Beijing, China), 1 μL of each primer (2.5 μM), and 1 μL of 20–40 ng genomic DNA. The PCR procedure included an initial denaturation for 5 min at 94 °C, followed by 30 cycles of 40 s at 94 °C, 30 s at 56–58 °C for each locus, and 50 s at 72 °C, ending with a final extension of 7 min at 72 °C. The amplified EST-SSR loci labeled with fluorescent dyes were sequenced by capillary electrophoresis using an ABI 3730 DNA Analyzer (Applied Biosystems, Foster City, CA, USA). The chromatograms were determined using GeneMarker v2.2.0 (SoftGenetics, State College, PA, USA).

2.3. Analyses of Genetic Diversity and Population Structure

The genetic diversity of the concatenated chloroplast DNA of T. grandis was estimated using the number of haplotypes (Nh), haplotype diversity (Hd), nucleotide diversity (π), and Watterson’s parameter (θw) in DnaSP 5.10 [44]. The relationships between chloroplast haplotypes were constructed using a median-joining network implemented in Network 10.2.0.0 (http://www.fluxus-engineering.com; accessed on 11 July 2023) [45]. For assessing the polymorphism of EST-SSR loci in each population, the number of alleles (NA), observed (HO) and expected heterozygosity (HE), and Shannon’s information index (I) were calculated using POPGENE v1.32 [46], polymorphism information content (PIC) was determined using CERVUS v3.0.7 [47], and Hardy–Weinberg equilibrium (HWE) was tested using GenAlEx v6.502 with chi-square tests [48].
Population genetic structure with the admixture model was inferred by Structure v2.3.4 [49] based on the 11 EST-SSR loci. The number of clusters (K), varying from 1 to 15, was explored using 20 independent runs per K. The burn-in was set to 20,000 and the Markov chain Monte Carlo (MCMC) run length was set to 200,000. The most likely number of clusters was estimated using LnP(D) [50] and ΔK statistics [51]. Genetic relationships among populations were confirmed by the principal coordinates analysis (PCoA) based on Nei’s genetic distance using GenAlEx v6.502 [48]. The genetic differences (FST, Wright’s fixation index) between pairs of populations were calculated by analysis of molecular variance (AMOVA) in Arlequin v3.5 [52] with 10,000 permutations. The correlation between genetic distances (FST) and geographic distances was further estimated using the Mantel test in GenAlEx v6.502 [48] with 1000 permutations.

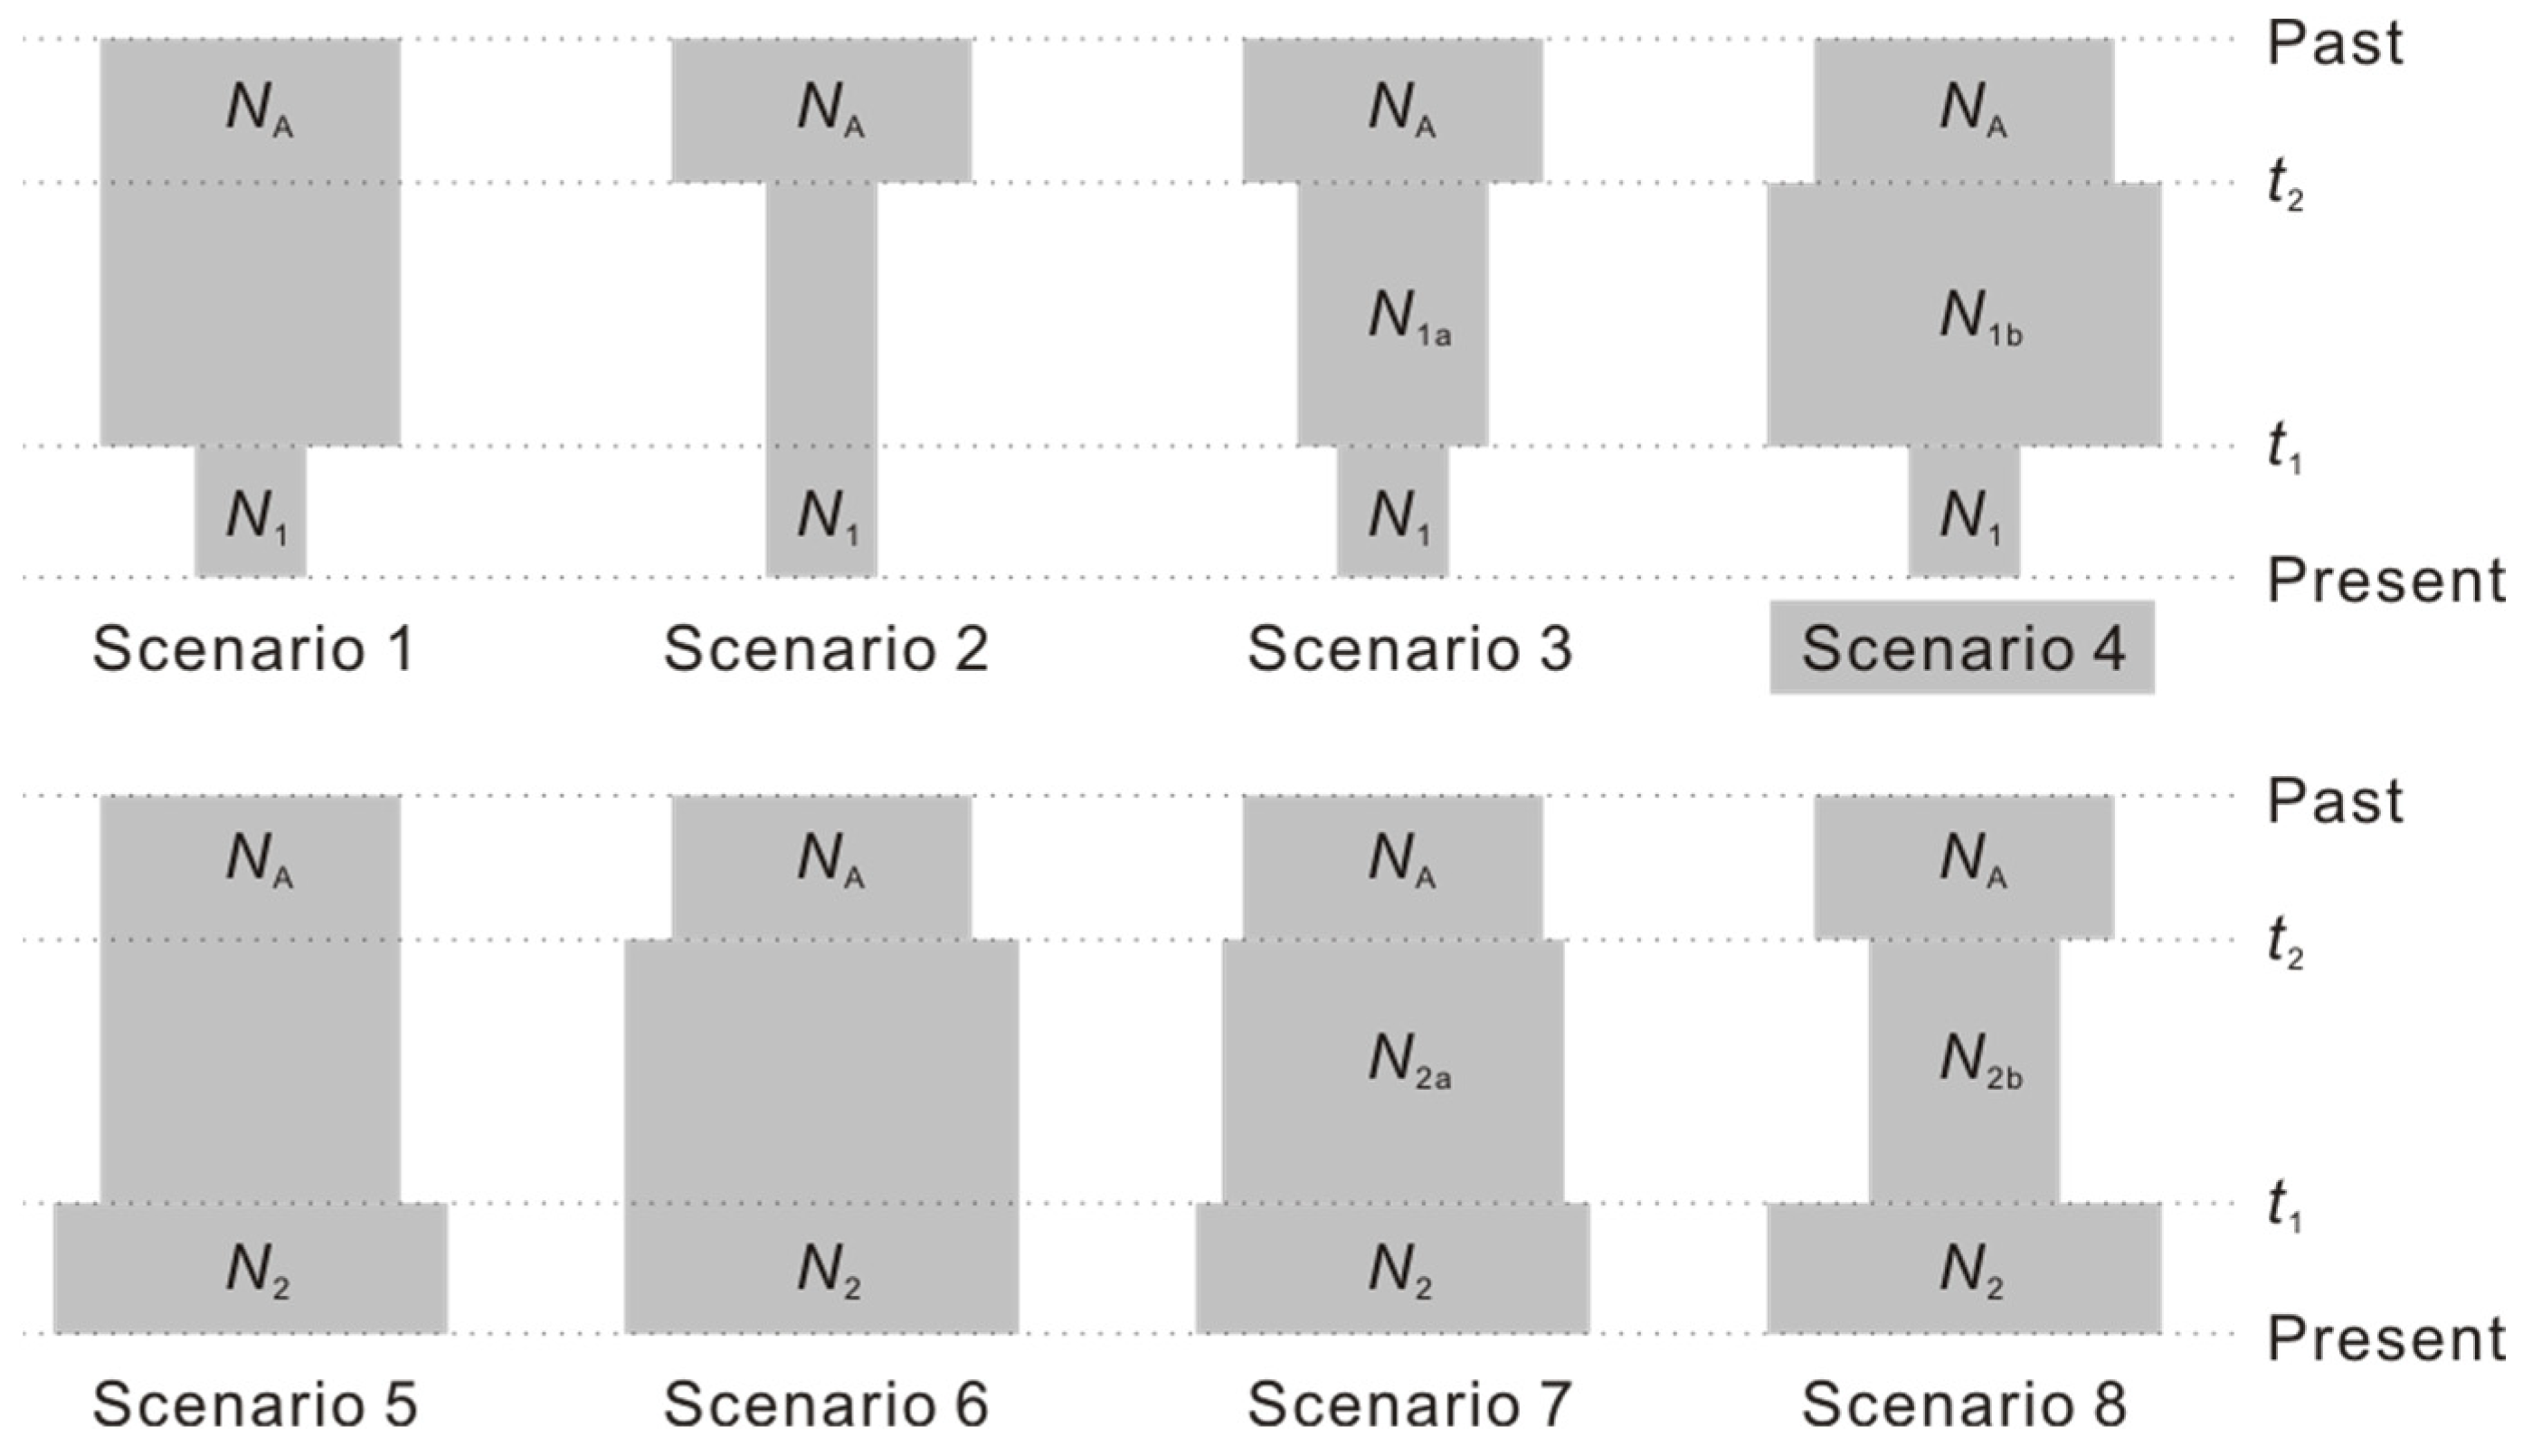
2.4. Inference of Demographic History

To explore the influence of demographic change on the population structure, the demographic history of T. grandis was inferred using an ABC approach based on all EST-SSR loci. According to the analyses of genetic diversity and population structure, eight possible demographic scenarios for population contraction and expansion were formulated and simulated by DIYABC v2.1.0 [53]: (1) a recent population contraction began at time t1, (2) an early population contraction began at time t2, (3) a stepwise population contraction occurred from time t2 to t1, (4) a population expansion began at time t2, followed by a population contraction beginning at time t1, (5) a recent population expansion began at time t1, (6) an early population expansion began at time t2, (7) a stepwise population expansion occurred from time t2 to t1, and (8) a population contraction began at time t2, followed by a population expansion beginning at time t1. The priors of all parameters were set with a uniform distribution (Table S1). All one-sample summary statistics were chosen to compare the observed and simulated datasets. To obtain statistically robust results, at least 3,000,000 simulated datasets were generated for each scenario. The 1% of the simulated datasets closest to the observed data were applied to estimate the relative posterior probability with logistic regression and posterior parameter distributions. A generation time of 25 years, being applied to Taxus wallichiana in the same family (Taxaceae) [54], was used to scale the demographic history of T. grandis.

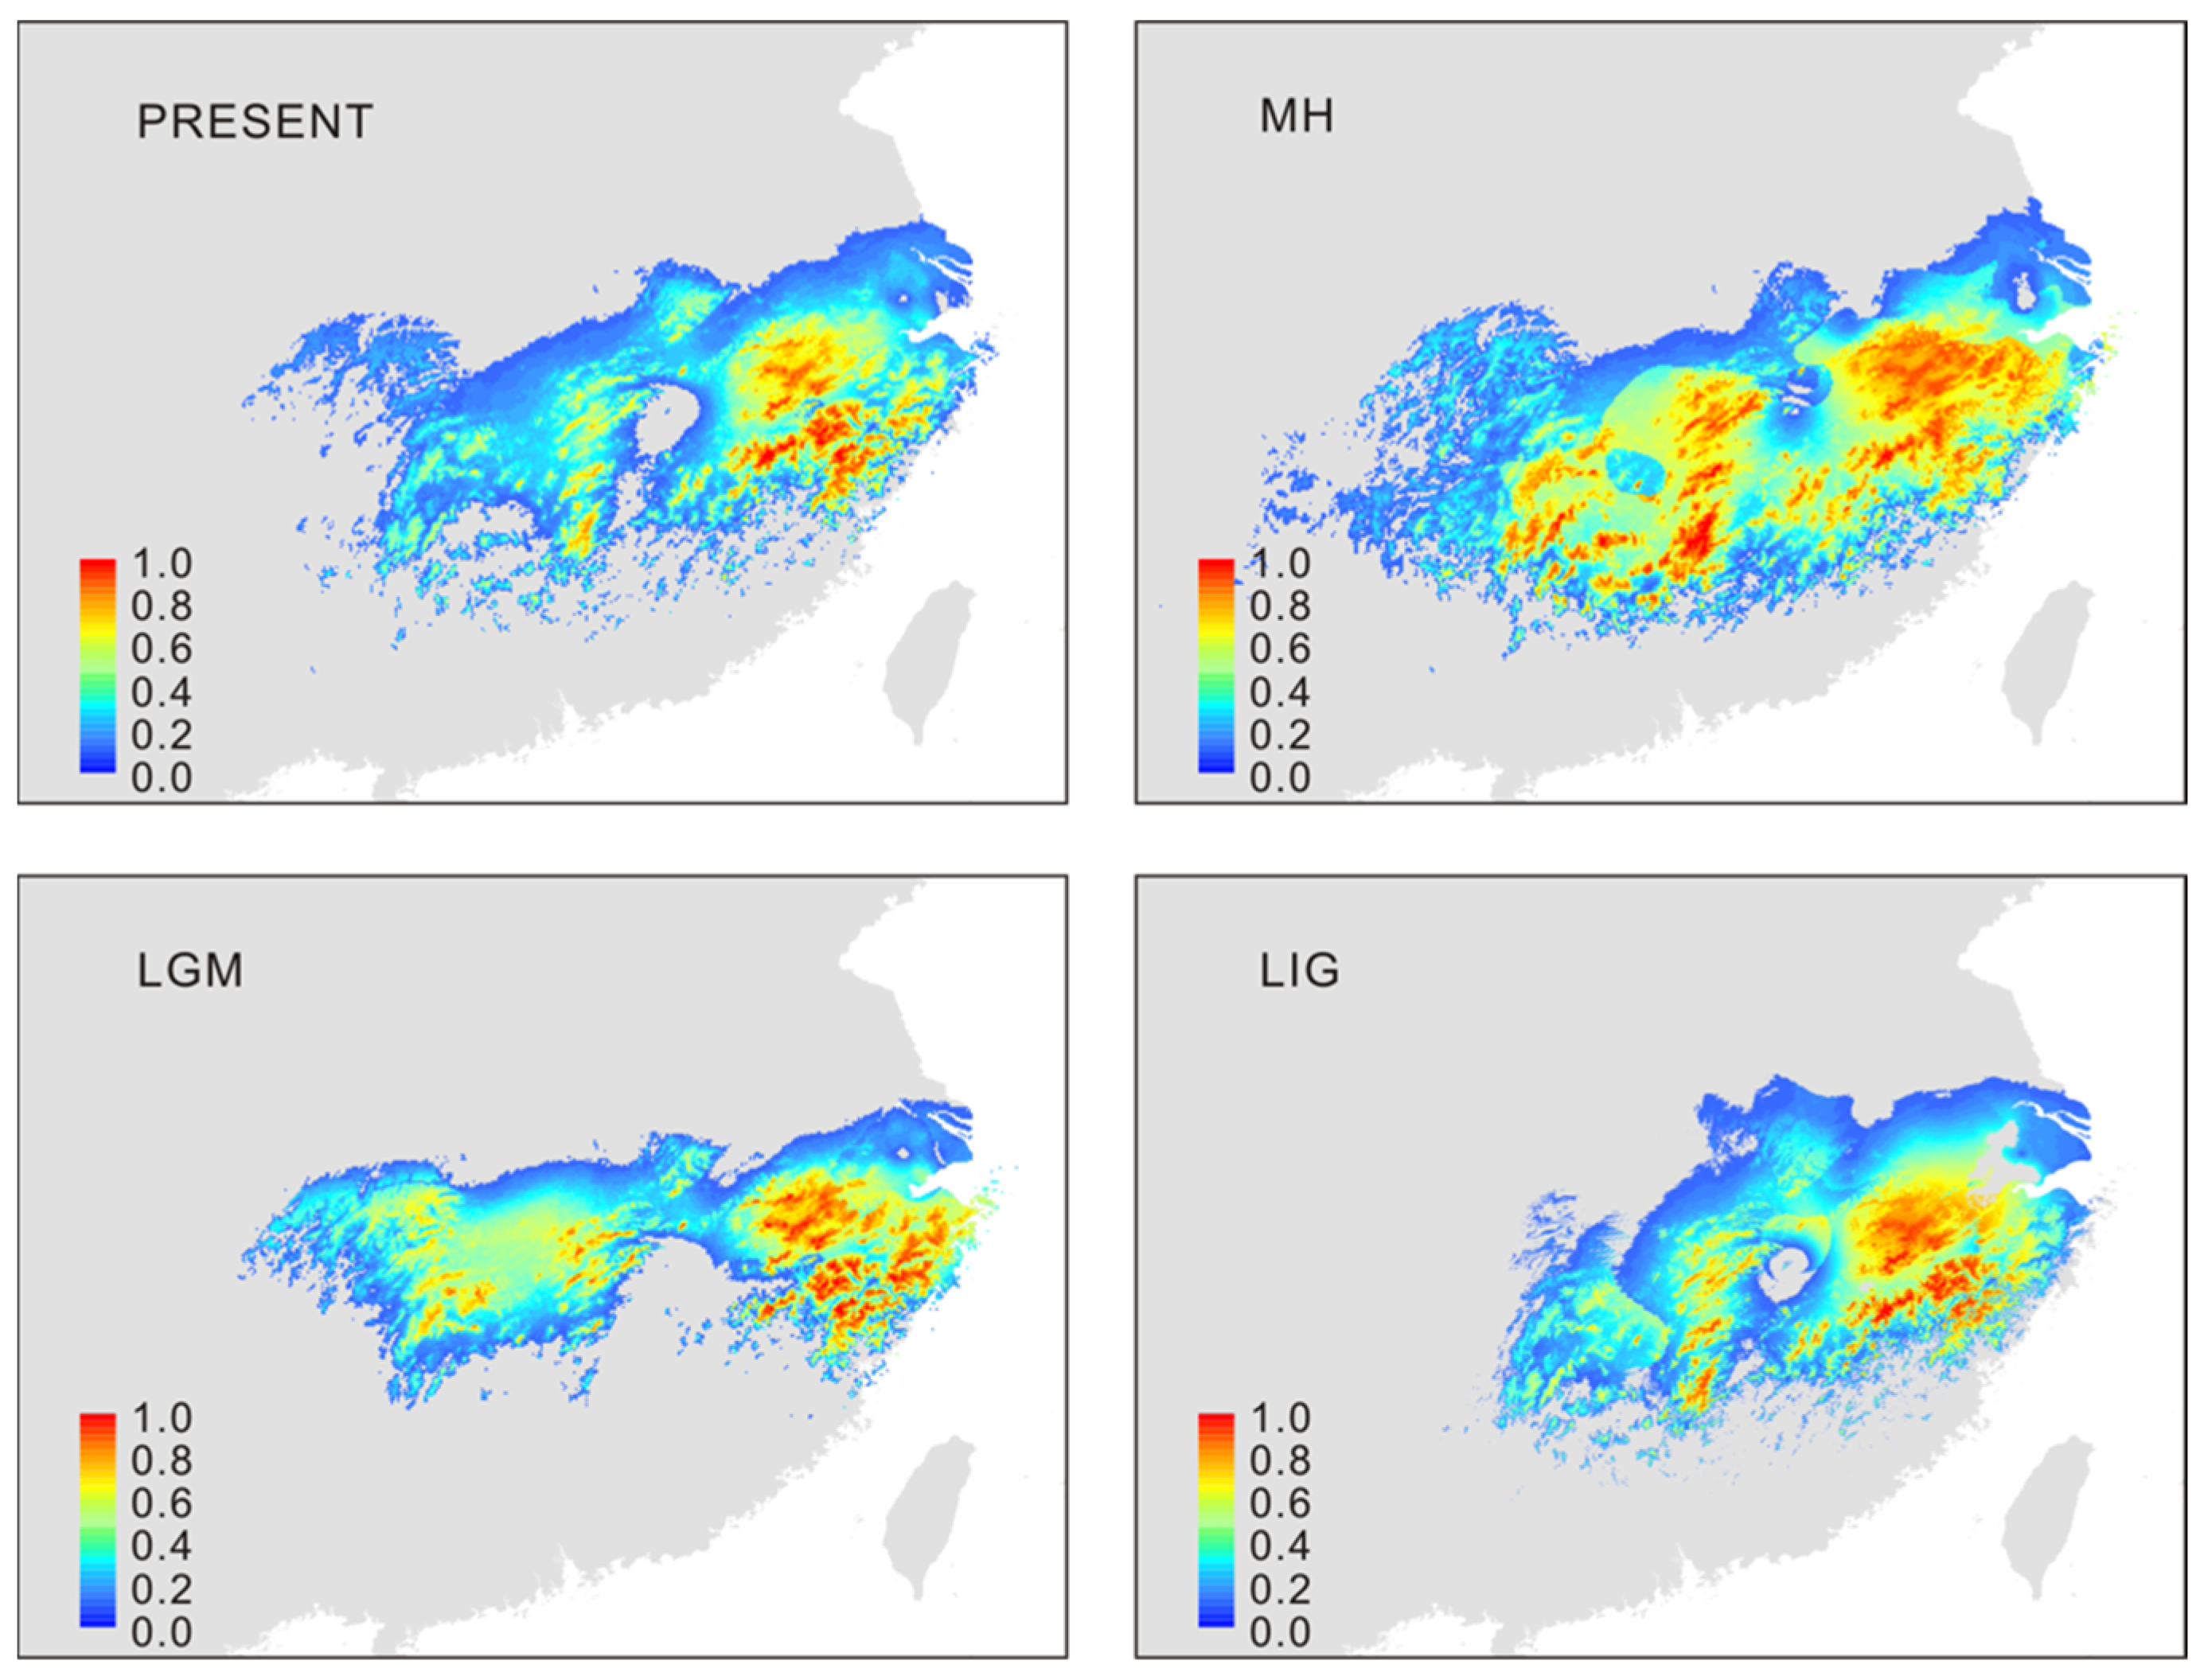
2.5. Ecological Niche Modeling

To explore the effect of climatic change since the Quaternary on the population structure, the climate niches of T. grandis were predicted using ecological niche modeling (ENM) in MAXENT 3.4.3 [55] with the default parameters and included 80% of species records for training and 20% for testing the model. Model accuracy was estimated by the area under the ROC curve (AUC). An AUC value above 0.7 was considered good model performance [56]. Geographical coordinates from 18 sampled records of T. grandis were used as input information. The potential distributions of the species were projected under four historical periods, including the present day, the Mid-Holocene (MH), the Last Glacial Maximum (LGM), and the Last Interglacial (LIG). For each period, 19 climatic variables were retrieved from each environmental layer in the WorldClim database with a resolution of 2.5 min (https://www.worldclim.org; accessed on 11 July 2023) [57]. For the MH, LGM, and LIG periods, paleoclimate data under the MIROC model were employed. To minimize overfitting of niche models, 11 variables (BIO1, BIO2, BIO3, BIO6, BIO7, BIO8, BIO9, BIO14, BIO16, BIO18, and BIO19) with pairwise Pearson correlation coefficients of r ≤ 0.70 were used to construct the species distribution. In addition, principal component analysis (PCA) was performed on the 19 standardized bioclimatic variables in R v3.5.2 to evaluate the effect of environmental adaptation on population structure.

3. Results

3.1. Genetic Diversity

Only seven haplotypes were detected for the three chloroplast fragments (rpl16, rpoB-trnC, and trnL-trnF) across the 18 populations in this study; three (H1, H2, and H5) appeared exclusively in T. grandis, but one (H3) was shared with T. nucifera in populations 15 and 16 (Figure 1). All T. grandis populations had no more than two haplotypes, and most (eleven) populations had only the widespread one (H2) (Figure 1). Haplotype diversity (Hd), nucleotide diversity (π), and Watterson’s parameter (θw) ranged from 0 to 0.536, 0 to 0.00206, and 0 to 0.00156 within populations, respectively, whereas the π and θw within populations 15 and 16 were obviously higher than the others by an order of magnitude (Table 1). In the median-joining network, the seven haplotypes were clearly separated into three groups, which corresponded to T. grandis, T. nucifera, and T. jackii, with more than 18 mutation steps between each species pair (Figure 1). The shared haplotype (H3) between T. grandis and T. nucifera was entirely clustered with the group of the latter species, indicating that most of the individuals in populations 15 and 16 likely arose from T. nucifera.
The genetic diversity was uneven across 16 populations of T. grandis based on the polymorphism of 11 EST-SSR loci (Table 1 and Table S2). The observed heterozygosity (HO), expected heterozygosity (HE), Shannon’s information index (I), and polymorphism information content (PIC) were calculated within populations and averaged. The highest values of HO and HE were observed in population 15 (0.8172 and 0.5048), and the lowest values were observed in population 8 (0.4326 and 0.3511). The maximum value of I was detected in population 16 (0.7352), and its minimum was detected in population 7 (0.5364). For PIC, population 16 showed the highest value (0.3885), but it was only slightly higher than the lowest value, which was observed in population 7 (0.2800) (Table 1). HWE was also tested for each population of T. grandis across all EST-SSR loci. Of the EST-SSR loci, gr48 significantly deviated from HWE in almost all of the populations except populations 3, 4, 8, and 10, while gr81 deviated from HWE in all populations (Table 2). This result was due to the highly heterozygous alleles at the two loci (Table S2) that may be subject to selection. Moreover, HWE was lacking at most of the EST-SSR loci in populations 15 and 16 except for gr12 and gr29 in population 15 and gr44 and gr80 in population 16 (Table 2).

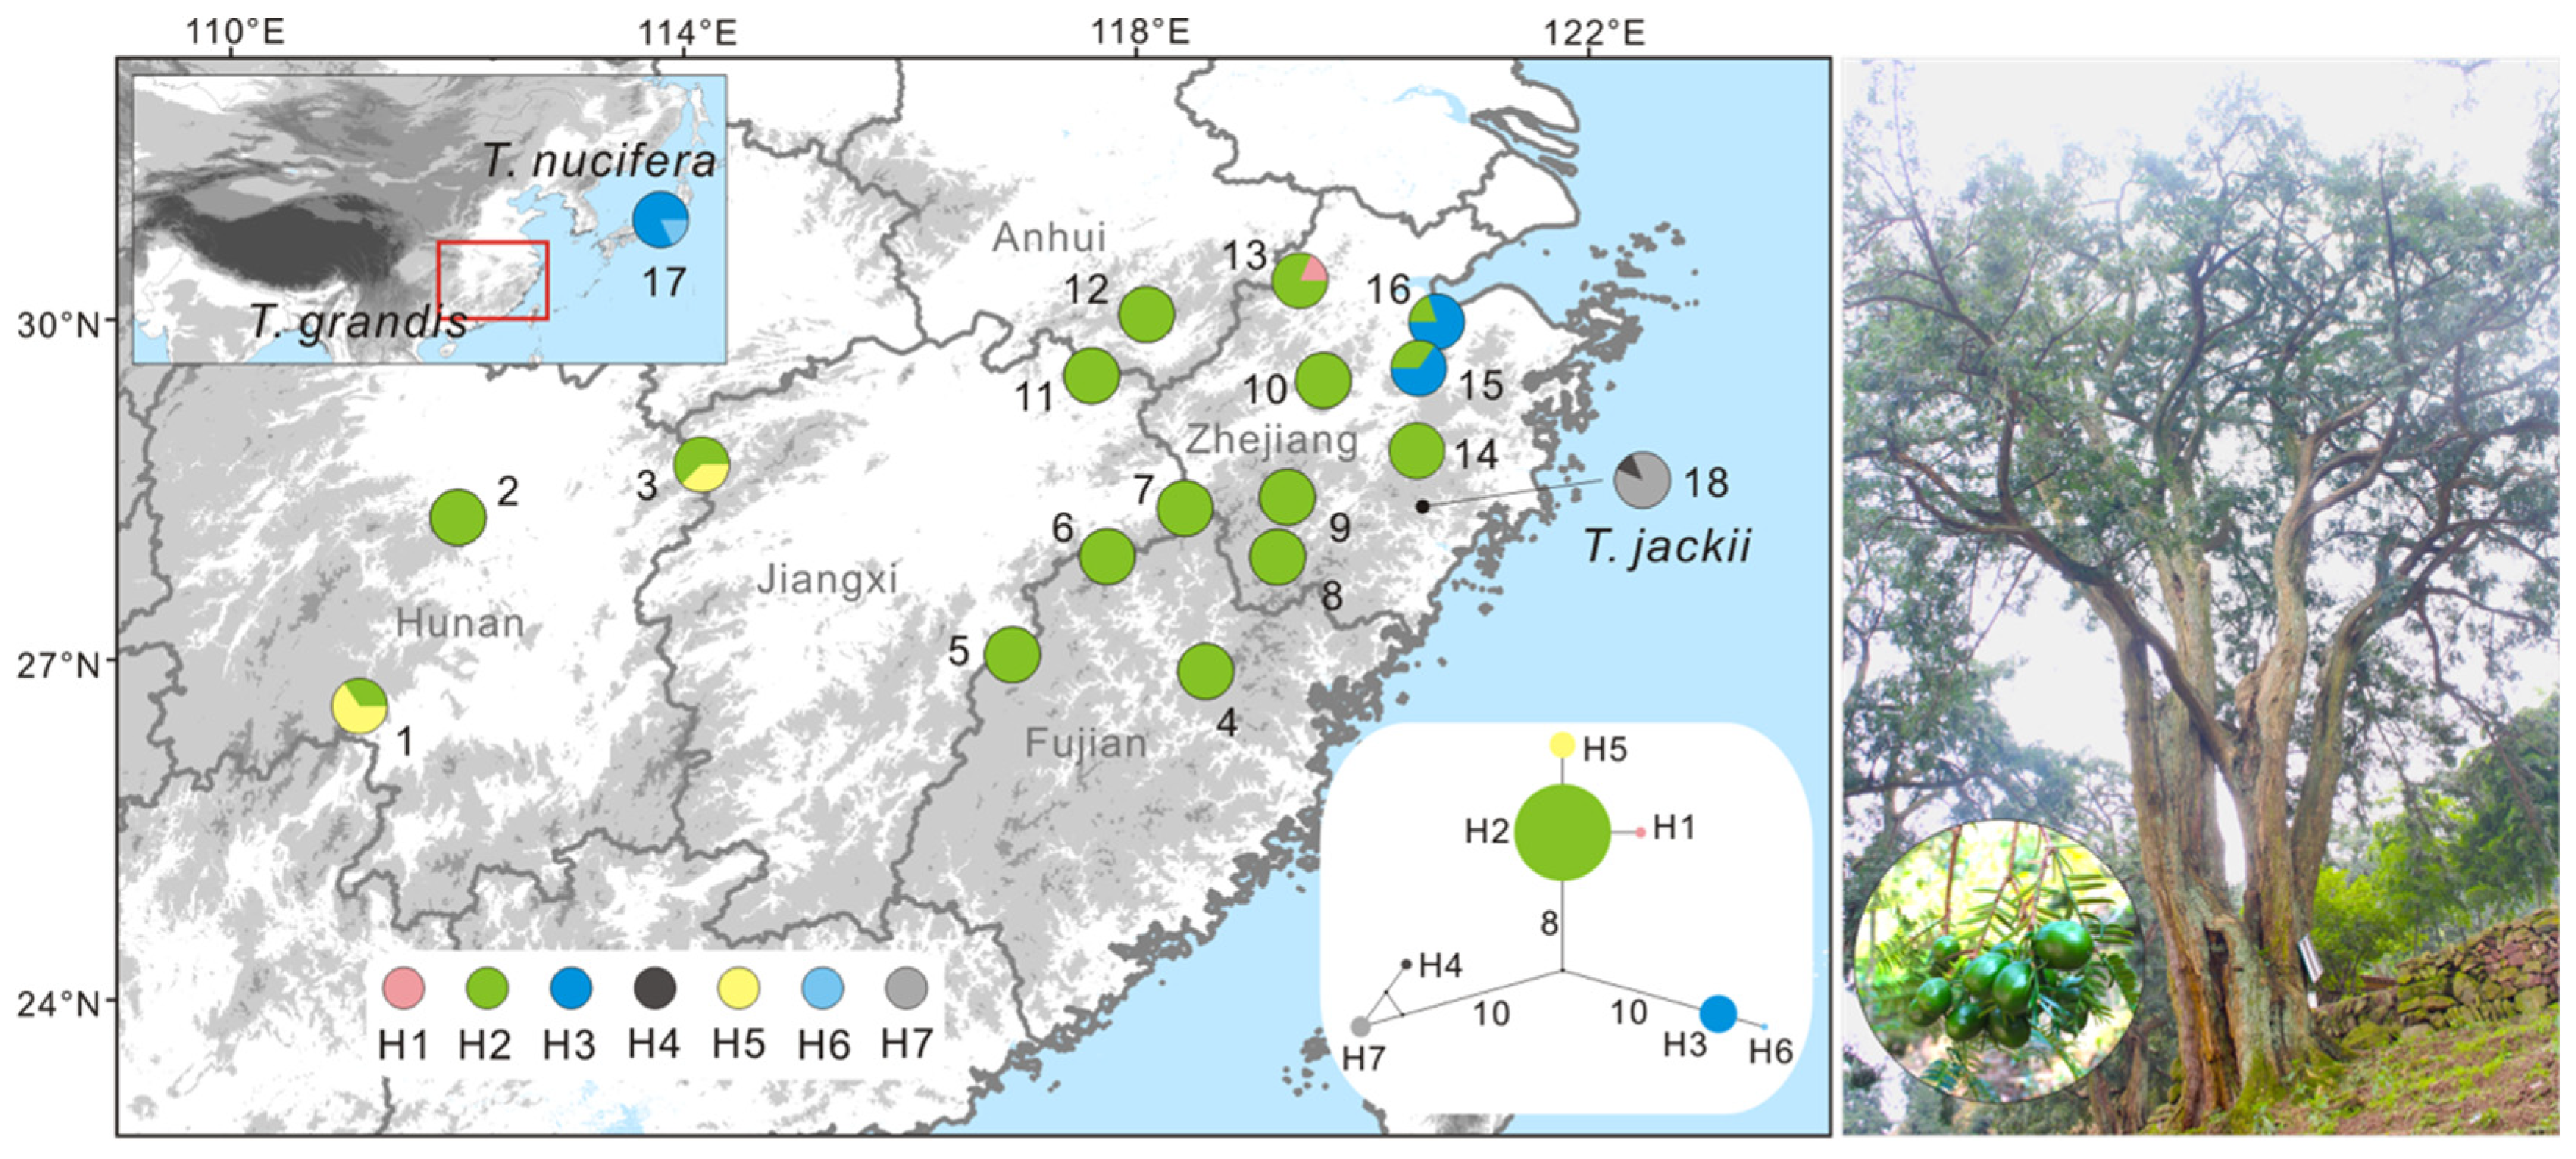
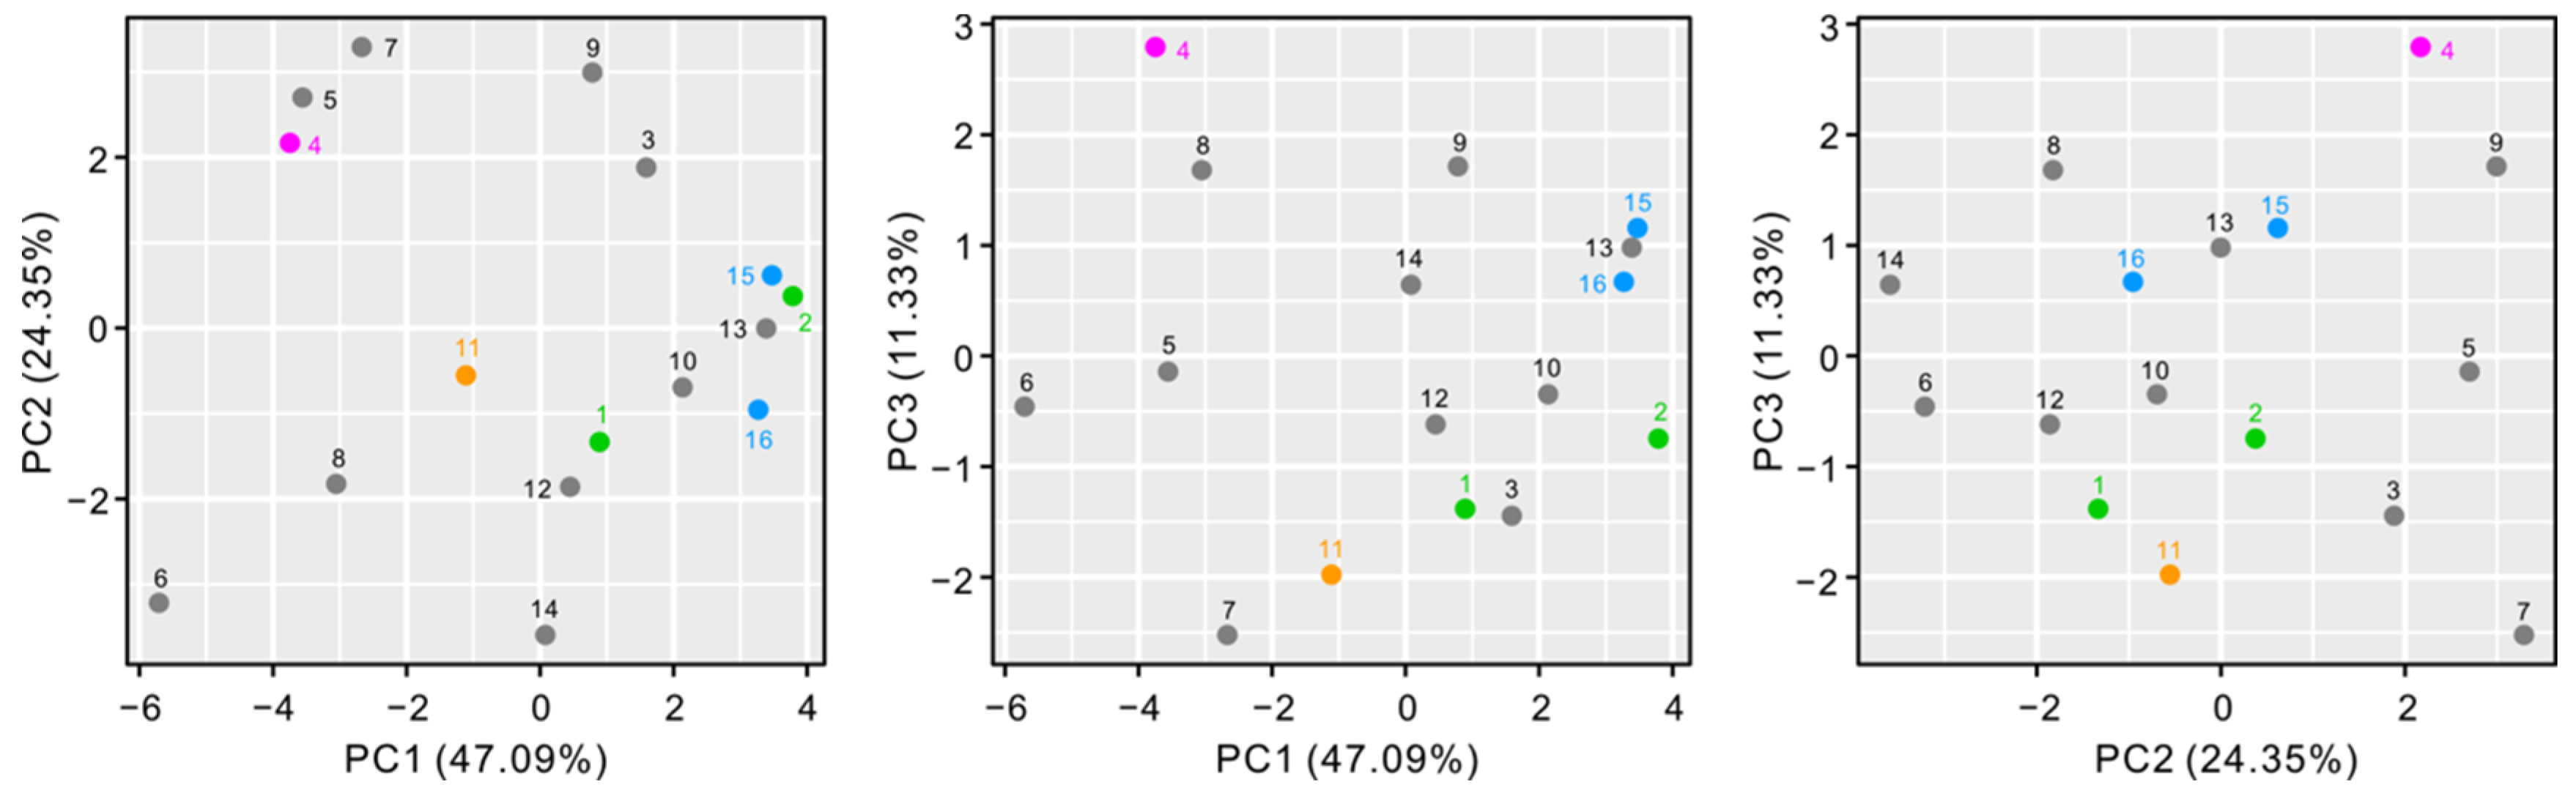
3.2. Population Genetic Structure

The Bayesian clustering algorithm (Structure) revealed that the most likely number of clusters for the entire EST-SSR dataset was K = 2 based on LnP(D) and ΔK statistics. Consistent with the cpDNA network analysis results, almost all individuals from populations 15 and 16 of T. grandis were grouped into a cluster with T. nucifera (Figure 2). In addition, three clear clusters, the first cluster including populations 1 and 2, the second including population 4, and the third including population 11, were observed in T. grandis as the K value increased, and T. jackii maintained a unique cluster (Figure 2). A more detailed pattern of genetic structure was further shown through PCoA based on Nei’s genetic distance, in which the first three coordinates accounted for 76.09% of the total variance (41.39, 24.90, and 9.80%, respectively) (Figure 2). This pattern was approximately identical to that uncovered in the Structure analysis.
The genetic differences (FST) between pairs of populations in T. grandis derived from AMOVAs (Table S3) for the cpDNA fragments revealed significant differentiation between population 1 and others (FST > 0.221, p < 0.01) except for population 3 and between population 15 and 16 and others (FST > 0.628, p < 0.01) (except in the case of self-comparisons). Moreover, significant FST was also detected between almost all pairs of populations based on all EST-SSR loci (Table S3), suggesting that some geographical and/or historical events, such as population contraction and geographic isolation, contributed to the genetic structure of T. grandis. The significant correlation between genetic distances (FST) and geographic distances (r = 0.4564, p < 0.001) (Figure 2) supported the deduction that geographic isolation contributed to the genetic structure of T. grandis after excluding populations 15 and 16 because most of their individuals were likely derived from a closely related species.

3.3. Demographic History

The demographic history of T. grandis was simulated under eight alternative scenarios (Figure 3) using an ABC approach in DIYABC based on all EST-SSR loci and removing populations 15 and 16 because most of their individuals were likely derived from a closely related species. The simulation revealed that scenario 4, with a population expansion followed by a recent contraction, had the highest posterior probability (38.24% estimated by the direct approach and 40.08% by the logistic approach) relative to other scenarios (Figure S1). Posterior parameter estimates for scenario 4 dated the population expansion to 3.75 million years ago (Ma, 95% CI: 0.28–7.35 Ma) and the recent contraction to 0.12 Ma (95% CI: 0.02–0.38 Ma). The effective population size showed a dramatic change between the periods before (6.85 × 10⁵, 95% CI: 1.56–11.80 × 10⁵) and after (1.38 × 10³, 95% CI: 0.24–3.72 × 10³) the population contraction (Table 3; Figure S2). This result indicated that the influence of demographic changes, particularly the more recent population contraction, on the genetic structure of T. grandis could not be excluded.

3.4. Projected Distribution with Niche Modeling

The potential distributions of T. grandis were projected using the MAXENT model under four historical periods (present day, MH, LGM, and LIG). The niche models fit the presence data well, with high AUC values (>0.99) (Figure S3), and the predicted distribution under the present-day period accurately represented the extant distribution of T. grandis (Figure 4). Moreover, the distribution experienced a slight shift during the LIG, dramatic expansion during the MH, and distinct contraction during the present day, but the hotspot distributions in East China were relatively stable since the LIG (Figure 4). Some discrete areas were also found across the whole distribution of T. grandis, for example, the western and southern parts of the distribution (Figure 4). These results showed that climatic changes had strong impacts on the population fluctuation and geographical distribution of T. grandis. In addition, PCA did not reveal any insights into environmental adaptation; for example, four clusters, populations 1 and 2, 4, 11, and 15 and 16, revealed in Structure (Figure 2) were genetically distinct, but the environmental variables were not obviously different among their locations (Figure 5).

4. Discussion

In this study, a moderate level of genetic diversity in T. grandis was revealed based on eleven EST-SSR loci (Table 1) in comparison with that in other conifers [25,58], and the diversity is similar to that revealed in a previous study using the same type of molecular marker [29] and others (e.g., SSR, AFLP, and ISSR) for this species [26,27,28]. However, novel population structure in the conifer was first uncovered in this study based on sampling across its whole geographical distribution. One genetically distinct group (populations 15 and 16) and three secondary groups (corresponding to populations 1 and 2, population 4, and population 11) were detected through population structure analyses based on EST-SSR loci and chloroplast genes (Figure 1 and Figure 2). The FST analyses further supported significant genetic differentiation (p < 0.001) among populations from each two of the four groups and between them and other populations (Table S3). This pattern of genetic variation and population structure, however, seems to be inconsistent with the patterns reported in most other conifers, which maintain relatively high levels of genetic variation within populations and low genetic differentiation among populations [59,60]. Nevertheless, significant population structure is also found in some conifers inhabiting southeast China, such as Amentotaxus argotaenia [61], Pinus kwangtungensis [62], Tsuga chinensis [63], and Pseudotaxus chienii [38]. Remarkably, the genetic composition of the first group (populations 15 and 16) clearly originated from different gene pools, while that of the other three groups originated from T. grandis itself (Figure 1 and Figure 2). These results suggested that the formation of the novel population structure in T. grandis could be attributed to multiple underlying factors (see below).
Introducing excellent variants from wild resources or alien species is a common and efficient breeding strategy in modern plant breeding [3,12], including in T. grandis. First, the genealogical relationship of chloroplast haplotypes showed that 22 of 27 individuals in populations 15 and 16 of T. grandis shared haplotype H3 with T. nucifera. H3 and private haplotypes (H1, H2, and H5) in T. grandis are separated by more than 18 mutation steps, but there is only 1 step between this haplotype and the private haplotype H6 in T. nucifera (Figure 1). Second, the population genetic structure based on EST-SSR loci indicated that the genetic composition of the 22 individuals was almost identical to that of T. nucifera but obviously differed from that of other populations of T. grandis (Figure 2). Third, HWE analysis suggested that populations 15 and 16 significantly deviated from HWE (p < 0.05) at almost all EST-SSR loci (Table 2), implying immigration in the two populations of T. grandis. Combining these results with the maternal inheritance of the chloroplast genome in Torreya [30,64], we can conclude that the genetic composition of T. grandis was partially derived from the closely related species T. nucifera endemic to Japan.
Furthermore, the alien genetic composition in T. grandis was most likely associated with its early breeding activities. The Kuaiji Mountain area, located between Zhuji and Dongyang in Zhejiang, namely, the sites of populations 15 and 16 (Figure 1), is regarded as the cultivation and origin center of T. grandis cv. merrillii [18,24]. Almost all ancient trees of T. grandis in this area are more than a hundred years old, and many of them are even over a thousand years old [18]. The detailed cultivation histories documented by several ancient Chinese classics suggested that T. grandis has been widely planted in the Kuaiji Mountain area since the Tang Dynasty (618–907) of China [18,24], which was the period of most frequent exchanges between China and Japan, including in agriculture. This information implies that the alien genetic composition in T. grandis was most likely introduced into China during this historical period due to breeding activities. In addition, because the quality of T. grandis cv. merrillii produced in the Kuaiji Mountain area is considered the best in China and the excellent variants were mainly derived from semiwild ancient trees of T. grandis through vegetative propagation [18,23], the alien genetic composition from T. nucifera might contribute to the high quality of T. grandis cv. merrillii in the Kuaiji Mountain area.
Apart from the alien genetic composition, three secondary groups in T. grandis were also revealed and dominated by different genetic components that were derived from its own gene pool (Figure 2), suggesting that some recent events, such as climatic and geological events, might be involved in their formation. In this study, the simulation of demographic history using DIYABC indicated that T. grandis experienced significant population demographic changes, a population expansion followed by a recent contraction (Figure 3). The population expansion resulted in a slight increase in effective population size (Ne, from 1.70 × 10⁵ to 6.85 × 10⁵) starting ca. 3.75 Ma, while the recent contraction led to a severe reduction in the Ne (from 6.85 × 10⁵ to 1.38 × 10³) ca. 0.12 Ma (Table 3). The two events were dated to the middle Pliocene and the Pleistocene, when global temperatures began to decline sharply during the Pliocene and then underwent violent oscillations in the Pleistocene [65]. In addition, significant population dynamics of T. grandis were revealed by niche modeling for four historical periods in the Quaternary (Figure 4). Demographic changes due to climatic oscillations during the Quaternary have also occurred in some conifer species in southeast China and had significant impacts on their genetic variation and population structure [38,62,63]. Therefore, it is most likely that the demographic changes resulting from climatic fluctuations, especially since the Quaternary, are a main causal factor for the fragmented distribution and population divergence of T. grandis.
Given that divergent selection due to complex topography and heterogeneous environments can also result in population divergence and substructure [11,39], geographic and environmental isolation were detected as proxies of divergent selection in this study. The Mantel test indicated that the genetic divergence (FST) among populations was significantly correlated with geographic distances (r = 0.4564, p < 0.001) (Figure 2). In contrast, the climatic envelopes were not different among populations, especially among populations 1 and 2, 4, 11, and 15 and 16, which were genetically distinct (Figure 2 and Figure 5). These results suggested that neutral processes associated with geography, such as genetic drift, are stronger forces for population divergence and substructure in T. grandis than processes associated with the environment. In addition, limited gene flow and population connectivity are prerequisites for population divergence triggered by geographic isolation [11], but strong gene flow persists among populations due to wind pollination and the production of edible seeds in T. grandis [27,29]. This conflict between gene flow and population divergence may be attributed to local selection pressures from early artificial breeding for adaptative variants of T. grandis.

5. Conclusions

This study provides important insights into the genetic variation pattern of the nut-yielding conifer T. grandis across its whole geographical distribution. We revealed a novel population genetic structure of T. grandis and further explored how multiple historical factors, including breeding activities, demographic changes, and geographic isolation, potentially contributed to the population genetic structure. These results provide important fundamental information for utilizing genetic resources of T. grandis. Certainly, further research is needed to identify the adaptative variants in T. grandis in response to ongoing climate change. These populations, in isolated local areas and having unique genetic components revealed in this study, should be focused on and have climatic adaptation research carried on them, which will shed light on the genetic breeding of T. grandis in the future.

Supplementary Materials

The following supporting information can be downloaded at: https://www.mdpi.com/article/10.3390/f15081451/s1, Figure S1. Posterior probabilities estimated by the direct approach and the logistic approach for eight alternative scenarios (Figure 3) in DIYABC; Figure S2. Prior and posterior distribution of demographic parameter under scenario 4 in Figure 3 estimated using DIYABC; Figure S3. The ROC curve (AUC) for each predicted distribution, the present-day (PRESENT), the Mid-Holocene (MH_MIROC), the Last Glacial Maximum (LGM_MIROC), and the Last Interglacial (LIG) climatic periods; Table S1. Description of the prior distribution of parameters from eight scenarios in Figure 3 used in approximate Bayesian computation; Table S2. Polymorphism of eleven EST-SSR loci for each population within T. grandis, T. nucifera, and T. jackii; Table S3. Pairwise genetic difference (FST) among populations within T. grandis based on EST-SSR loci (below diagonal) and chloroplast genes (above diagonal).

Author Contributions

Conceptualization, Y.W. and Y.K.; data curation, Y.T., Q.O., X.H. and Y.K.; formal analysis, Y.T., Q.O., X.H. and Y.K.; funding acquisition, Y.K.; investigation, Y.T., Y.W. and Y.K.; supervision, Y.W. and Y.K.; writing—original draft, Y.W. and Y.K. All authors have read and agreed to the published version of the manuscript.

Funding

This work was funded by the National Natural Science Foundation of China (31901222) and the Natural Science Foundation of Guangxi of China (2023JJA130029).

Data Availability Statement

The EST-SSR genotype dataset generated in the present study is available at figshare repository (https://doi.org/10.6084/m9.figshare.23576178.v1; accessed on 25 June 2023), and chloroplast DNA haplotype sequences were deposited in GenBank database (accession numbers OP749964-OP749970).

Conflicts of Interest

The authors declare no conflicts of interest.

References

  1. Foll, M.; Gaggiotti, O. Identifying the environmental factors that determine the genetic structure of populations. Genetics 2006, 174, 875–891. [Google Scholar] [CrossRef] [PubMed]
  2. Ogwu, M.C.; Osawaru, M.E.; Ahana, C.M. Challenges in conserving and utilizing plant genetic resources (PGR). Int. J. Genet. Mol. Biol. 2014, 6, 16–23. [Google Scholar] [CrossRef]
  3. Govindaraj, M.; Vetriventhan, M.; Srinivasan, M. Importance of genetic diversity assessment in crop plants and its recent advances: An overview of its analytical perspectives. Genet. Res. Int. 2015, 2015, 431487. [Google Scholar] [CrossRef] [PubMed]
  4. Hewitt, G.M. The genetic legacy of the Quaternary ice ages. Nature 2000, 405, 907–913. [Google Scholar] [CrossRef] [PubMed]
  5. Hewitt, G.M. Genetic consequences of climatic oscillations in the Quaternary. Philos. Trans. R. Soc. B 2004, 359, 183–195. [Google Scholar] [CrossRef]
  6. Hamrick, J.L. Response of forest trees to global environmental changes. For. Ecol. Manag. 2004, 197, 323–335. [Google Scholar] [CrossRef]
  7. Jump, A.S.; Penuelas, J. Running to stand still: Adaptation and the response of plants to rapid climate change. Ecol. Lett. 2005, 8, 1010–1020. [Google Scholar] [CrossRef]
  8. Willi, Y.; Van Buskirk, J.; Schmid, B.; Fischer, M. Genetic isolation of fragmented populations is exacerbated by drift and selection. J. Evol. Biol. 2007, 20, 534–542. [Google Scholar] [CrossRef]
  9. Lee, C.R.; Mitchell-Olds, T. Quantifying effects of environmental and geographical factors on patterns of genetic differentiation. Mol. Ecol. 2011, 20, 4631–4642. [Google Scholar] [CrossRef]
  10. Wright, S. Isolation by distance. Genetics 1943, 28, 114–138. [Google Scholar] [CrossRef] [PubMed]
  11. Bradburd, G.S.; Ralph, P.L.; Coop, G.M. Disentangling the effects of geographic and ecological isolation on genetic differentiation. Evolution 2013, 67, 3258–3273. [Google Scholar] [CrossRef]
  12. Fu, Y.B. Understanding crop genetic diversity under modern plant breeding. Theor. Appl. Genet. 2015, 128, 2131–2142. [Google Scholar] [CrossRef] [PubMed]
  13. Van Nocker, S.; Gardiner, S.E. Breeding better cultivars, faster: Applications of new technologies for the rapid deployment of superior horticultural tree crops. Hortic. Res. 2014, 1, 14022. [Google Scholar] [CrossRef] [PubMed]
  14. Huang, H.; Liu, Y. Natural hybridization, introgression breeding, and cultivar improvement in the genus Actinidia. Tree Genet. Genomes 2014, 10, 1113–1122. [Google Scholar] [CrossRef]
  15. Jia, Y.; Milne, R.I.; Zhu, J.; Gao, L.M.; Zhu, G.F.; Zhao, G.F.; Liu, J.; Li, Z.H. Evolutionary legacy of a forest plantation tree species (Pinus armandii): Implications for widespread afforestation. Evol. Appl. 2020, 13, 2646–2662. [Google Scholar] [CrossRef]
  16. Simmonds, N.W. Selection for local adaptation in a plant breeding programme. Theor. Appl. Genet. 1991, 82, 363–367. [Google Scholar] [CrossRef] [PubMed]
  17. Takeda, S.; Matsuoka, M. Genetic approaches to crop improvement: Responding to environmental and population changes. Nat. Rev. Genet. 2008, 9, 444–457. [Google Scholar] [CrossRef] [PubMed]
  18. Cheng, X.J.; Li, Z.J.; Yu, W.W.; Dai, W.S.; Fu, Q.G. Distribution and ecological characteristics of Torreya grandis in China. J. Zhejiang For. Coll. 2007, 24, 383–388. [Google Scholar]
  19. Kang, N.; Tang, Z.X. Studies on the taxonomy of the genus Torreya. Bull. Bot. Res. 1995, 15, 349–362. [Google Scholar]
  20. Qiu, Y.X.; Fu, C.X.; Comes, H.P. Plant molecular phylogeography in China and adjacent regions: Tracing the genetic imprints of Quaternary climate and environmental change in the world’s most diverse temperate flora. Mol. Phylogenet. Evol. 2011, 59, 225–244. [Google Scholar] [CrossRef]
  21. Liu, J.Q.; Sun, Y.S.; Ge, X.J.; Gao, L.M.; Qiu, Y.X. Phylogeographic studies of plants in China: Advances in the past and directions in the future. J. Syst. Evol. 2012, 50, 267–275. [Google Scholar] [CrossRef]
  22. Li, Z.J.; Luo, C.F.; Cheng, X.J.; Feng, X.J.; Yu, W.W. Component analysis and nutrition evaluation of seeds of Torreya grandis ‘Merrillii’. J. Zhejiang For. Coll. 2005, 22, 540–544. [Google Scholar]
  23. Zhang, J.; Hu, L.; Guo, L.; Ren, W.; Zhao, L.; Wang, N.; Zhang, E.; Tang, J.; Chen, X. The maintenance of stable yield and high genetic diversity in the agricultural heritage torreya tree system. BMC Ecol. 2019, 19, 41. [Google Scholar] [CrossRef]
  24. Li, Z.J.; Cheng, X.J.; Dai, W.S.; Jing, B.H.; Wang, A.G. History and status and development of Torreya grandis in Zhejiang Province. J. Zhejiang For. Coll. 2004, 21, 471–474. [Google Scholar]
  25. Zeng, J.; Chen, J.; Kou, Y.; Wang, Y. Application of EST-SSR markers developed from the transcriptome of Torreya grandis (Taxaceae), a threatened nut-yielding conifer tree. PeerJ 2018, 6, e5606. [Google Scholar] [CrossRef] [PubMed]
  26. Dai, Z.; Chen, L.G.; Tong, P.Z. Genetic variation and fingerprinting of Torreya grandis cultivars detected by ISSR markers. Acta Hortic. Sin. 2008, 35, 1125–1130. [Google Scholar] [CrossRef]
  27. Min, H.; Cheng, S.M.; Kang, Z.X.; Huang, J.Q. Genetic diversity of different Torreya grandis populations by AFLP. For. Res. 2009, 22, 367–372. [Google Scholar]
  28. Yi, G.M.; Qiu, Y.J. Genetic diversity of Torreya grandis populations as revealed by chloroplast microsatellite markers. J. Fruit Sci. 2014, 31, 583–588. [Google Scholar]
  29. Chen, T.; Li, J.; Zhang, C.; Gao, Z.; Jin, H.; Dai, W.; Tang, H.; Zhang, M. Genetic structure and diversity of wild populations in Torreya grandis determined with EST-SSR. J. Anhui Agric. Univ. 2020, 47, 224–231. [Google Scholar] [CrossRef]
  30. Kou, Y.X.; Xiao, K.; Lai, X.R.; Wang, Y.J.; Zhang, Z.Y. Natural hybridization between Torreya jackii and T. grandis (Taxaceae) in southeast China. J. Syst. Evol. 2017, 55, 25–33. [Google Scholar] [CrossRef]
  31. Wang, Y.J.; Xiao, K.; Kou, Y.X. Torreya jackii (Taxaceae): A special species that is genetically admixed, morphologically distinct, and geographically sympatric with parent species. Forests 2019, 10, 174. [Google Scholar] [CrossRef]
  32. Varshney, R.K.; Graner, A.; Sorrells, M.E. Genic microsatellite markers in plants: Features and applications. Trends Biotechnol. 2005, 23, 48–55. [Google Scholar] [CrossRef]
  33. Kalia, R.K.; Rai, M.K.; Kalia, S.; Singh, R.; Dhawan, A.K. (2011) Microsatellite markers: An overview of the recent progress in plants. Euphytica 2011, 177, 309–334. [Google Scholar] [CrossRef]
  34. Charlesworth, B.; Sniegowski, P.; Stephan, W. The evolutionary dynamics of repetitive DNA in eukaryotes. Nature 1994, 371, 215–220. [Google Scholar] [CrossRef] [PubMed]
  35. Beaumont, M.A. Detecting population expansion and decline using microsatellites. Genetics 1999, 153, 2013–2029. [Google Scholar] [CrossRef]
  36. Ellegren, H. Microsatellites: Simple sequences with complex evolution. Nat. Rev. Genet. 2004, 5, 435–445. [Google Scholar] [CrossRef]
  37. Doyle, J.J.; Doyle, J.L. A rapid DNA isolation procedure for small quantities of fresh leaf tissue. Phytochem. Bull. 1987, 19, 11–15. [Google Scholar] [CrossRef]
  38. Kou, Y.; Zhang, L.; Fan, D.; Cheng, S.; Li, D.; Hodel, R.G.J.; Zhang, Z. Evolutionary history of a relict conifer, Pseudotaxus chienii (Taxaceae), in south-east China during the late Neogene: Old lineage, young populations. Ann. Bot. 2020, 125, 105–117. [Google Scholar] [CrossRef] [PubMed]
  39. Kou, Y.; Fan, D.; Cheng, S.; Yang, Y.; Wang, M.; Wang, Y.; Zhang, Z. Peripatric speciation within Torreya fargesii (Taxaceae) in the Hengduan Mountains inferred from multi-loci phylogeography. BMC Ecol. Evol. 2023, 23, 74. [Google Scholar] [CrossRef] [PubMed]
  40. Small, R.L.; Ryburn, J.A.; Cronn, R.C.; Seelanan, T.; Wendel, J.F. The tortoise and the hare: Choosing between noncoding plastome and nuclear Adh sequences for phylogeny reconstruction in a recently diverged plant group. Am. J. Bot. 1998, 85, 1301–1315. [Google Scholar] [CrossRef] [PubMed]
  41. Shaw, J.; Lickey, E.B.; Beck, J.T.; Farmer, S.B.; Liu, W.; Miller, J.; Siripun, K.C.; Winder, C.T.; Schilling, E.E.; Small, R.L. The tortoise and the hare II: Relative utility of 21 noncoding chloroplast DNA sequences for phylogenetic analysis. Am. J. Bot. 2005, 92, 142–166. [Google Scholar] [CrossRef] [PubMed]
  42. Kumar, S.; Stecher, G.; Li, M.; Knyaz, C.; Tamura, K. MEGA X: Molecular Evolutionary Genetics Analysis across computing platforms. Mol. Biol. Evol. 2018, 35, 1547–1549. [Google Scholar] [CrossRef] [PubMed]
  43. Mogensen, H.L. The hows and whys of cytoplasmic inheritance in seed plants. Am. J. Bot. 1996, 83, 383–404. [Google Scholar] [CrossRef]
  44. Librado, P.; Rozas, J. DnaSP v5: A software for comprehensive analysis of DNA polymorphism data. Bioinformatics 2009, 25, 1451–1452. [Google Scholar] [CrossRef]
  45. Bandelt, H.J.; Forster, P.; Röhl, A. Median-joining networks for inferring intraspecific phylogenies. Mol. Biol. Evol. 1999, 16, 37–48. [Google Scholar] [CrossRef]
  46. Yeh, F.C.; Yang, R.C. POPGENE VERSION 1.31, Microsoft Window-Based Freeware for Population Genetic Analysis. University of Alberta and Tim Boyle, Centre for International Forestry Research. 1999. Available online: https://sites.ualberta.ca/~fyeh/popgene (accessed on 11 July 2023).
  47. Kalinowski, S.T.; Taper, M.L.; Marshall, T.C. Revising how the computer program CERVUS accommodates genotyping error increases success in paternity assignment. Mol. Ecol. 2007, 16, 1099–1106. [Google Scholar] [CrossRef] [PubMed]
  48. Peakall, R.; Smouse, P.E. GenAlEx 6.5: Genetic analysis in Excel. Population genetic software for teaching and research—An update. Bioinformatics 2012, 28, 2537–2539. [Google Scholar] [CrossRef] [PubMed]
  49. Hubisz, M.J.; Falush, D.; Stephens, M.; Pritchard, J.K. Inferring weak population structure with the assistance of sample group information. Mol. Ecol. Resour. 2009, 9, 1322–1332. [Google Scholar] [CrossRef] [PubMed]
  50. Pritchard, J.K.; Stephens, M.; Donnelly, P. Inference of population structure using multilocus genotype data. Genetics 2000, 155, 945–959. [Google Scholar] [CrossRef] [PubMed]
  51. Evanno, G.; Regnaut, S.; Goudet, J. Detecting the number of clusters of individuals using the software STRUCTURE: A simulation study. Mol. Ecol. 2005, 14, 2611–2620. [Google Scholar] [CrossRef]
  52. Excoffier, L.; Lischer, H.E. Arlequin suite ver 3.5: A new series of programs to perform population genetics analyses under Linux and Windows. Mol. Ecol. Resour. 2010, 10, 564–567. [Google Scholar] [CrossRef] [PubMed]
  53. Cornuet, J.M.; Pudlo, P.; Veyssier, J.; Dehne-Garcia, A.; Gautier, M.; Leblois, R.; Marin, J.M.; Estoup, A. DIYABC v2.0: A software to make approximate Bayesian computation inferences about population history using single nucleotide polymorphism, DNA sequence and microsatellite data. Bioinformatics 2014, 30, 1187–1189. [Google Scholar] [CrossRef] [PubMed]
  54. Liu, J.; Möller, M.; Provan, J.; Gao, L.M.; Poudel, R.C.; Li, D.Z. Geological and ecological factors drive cryptic speciation of yews in a biodiversity hotspot. New Phytol. 2013, 199, 1093–1108. [Google Scholar] [CrossRef] [PubMed]
  55. Phillips, S.J.; Anderson, R.P.; Schapire, R.E. Maximum entropy modeling of species geographic distributions. Ecol. Model. 2006, 190, 231–259. [Google Scholar] [CrossRef]
  56. Fielding, A.H.; Bell, J.F. A review of methods for the assessment of prediction errors in conservation presence/absence models. Environ. Conserv. 1997, 24, 38–49. [Google Scholar] [CrossRef]
  57. Fick, S.E.; Hijmans, R.J. WorldClim 2: New 1-km spatial resolution climate surfaces for global land areas. Int. J. Climatol. 2017, 37, 4302–4315. [Google Scholar] [CrossRef]
  58. Dias, A.; Giovannelli, G.; Fady, B.; Spanu, I.; Vendramin, G.G.; Bagnoli, F.; Carvalho, A.; Silva, M.E.; Lima-Brito, J.; Lousada, J.L.; et al. Portuguese Pinus nigra J.F. Arnold populations: Genetic diversity, structure and relationships inferred by SSR markers. Ann. For. Sci. 2020, 77, 64. [Google Scholar] [CrossRef]
  59. Hamrick, J.L.; Godt, M.J.W.; Sherman-Broyles, S.L. Factors influencing levels of genetic diversity in woody plant species. New Forest. 1992, 6, 95–124. [Google Scholar] [CrossRef]
  60. Prunier, J.; Verta, J.P.; MacKay, J.J. Conifer genomics and adaptation: At the crossroads of genetic diversity and genome function. New Phytol. 2016, 209, 44–62. [Google Scholar] [CrossRef]
  61. Ge, X.J.; Zhou, X.L.; Li, Z.C.; Hsu, T.W.; Schaal, B.A.; Chiang, T.Y. Low genetic diversity and significant population structuring in the relict Amentotaxus argotaenia complex (Taxaceae) based on ISSR fingerprinting. J. Plant Res. 2005, 118, 415–422. [Google Scholar] [CrossRef] [PubMed]
  62. Tian, S.; López-Pujol, J.; Wang, H.W.; Ge, S.; Zhang, Z.Y. Molecular evidence for glacial expansion and interglacial retreat during Quaternary climatic changes in a montane temperate pine (Pinus kwangtungensis Chun ex Tsiang) in southern China. Plant Syst. Evol. 2010, 284, 219–229. [Google Scholar] [CrossRef]
  63. Cun, Y.Z.; Wang, X.Q. Phylogeography and evolution of three closely related species of Tsuga (hemlock) from subtropical eastern Asia: Further insights into speciation of conifers. J. Biogeogr. 2015, 42, 315–327. [Google Scholar] [CrossRef]
  64. Buchholz, J.T. The embryogeny of Torreya, with a note on Austrotaxus. Bull. Torrey Bot. Club 1940, 67, 731–754. [Google Scholar] [CrossRef]
  65. Zachos, J.; Pagani, M.; Sloan, L.; Thomas, E.; Billups, K. Trends, rhythms, and aberrations in global climate 65 Ma to present. Science 2001, 292, 686–693. [Google Scholar] [CrossRef] [PubMed]
Figure 1. Geographical distribution and network of chloroplast haplotypes (H1-H7) in T. grandis and its two closely related species, T. nucifera and T. jackii. The numbers 1-18 correspond to the population codes in Table 1. The sizes of circles in the network are proportional to the haplotype frequencies, and the mutation steps among haplotypes of more than one are marked on each branch. The photograph on the right illustrates an ancient tree in population 16 (Zhuji, Zhejiang, China) that is more than 400 years old.
Forests 15 01451 g001
Figure 2. Population structure of T. grandis, its genetic relationship with T. nucifera and T. jackii, and the correlation of its population divergence with geographic distances. (a) Population structure was inferred using Structure analysis with the number of clusters (K) varying from 2 to 12 with different colors and (b) principal coordinates analysis (PCoA). The numbers 1-18 correspond to the population codes in Table 1. (c) Correlation among genetic distances (FST) and geographic distances was estimated by the Mantel test. The blue circles and gray background refer to the genetic distances (FST) and confidence interval of the linear correlation, respectively.
Forests 15 01451 g002
Figure 3. Eight alternative demographic scenarios for T. grandis simulated by approximate Bayesian computation in DIYABC based on EST-SSR loci. N1 and N2 represent current population sizes, and NA represents the ancestral population size. N1a, N1b, N2a, and N2b represent population sizes between the ancestral population and the current population. t1 and t2 represent times of population changes. The optimal scenario is shown with gray background.
Forests 15 01451 g003
Figure 4. Climate niches of T. grandis predicted using ecological niche modeling in MAXENT. Predicted distributions are shown during present-day (PRESENT), Mid-Holocene (MH), Last Glacial Maximum (LGM), and Last Interglacial (LIG) climatic periods. Paleoclimate data for the MH, LGM, and LIG under MIROC model were employed.
Forests 15 01451 g004
Figure 5. The effects of heterogeneous environment on population genetic divergence evaluated using principal component analysis (PCA) of 19 bioclimatic variables. The numbers 1–16 correspond to the population codes in Table 1. Four genetically distinct groups revealed in Structure analysis are shown with different colors.
Forests 15 01451 g005
Table 1. Sampling information and genetic diversity for each population within T. grandis, T. nucifera, and T. jackii.
PopulationLocationLatitude (°N)Longitude (°E)NscpDNAnSSR
NhHdπθWHOHEIPIC
T. grandis
1Xinning, Hunan, China26.57111.161520.4760.000190.000120.50370.42790.70410.3629
2Ningxiang, Hunan, China28.24112.02810000.53410.38940.56820.3020
3Tonggu, Jiangxi, China28.70114.19820.5360.000210.000150.44810.44320.67110.3509
4Jianou, Fujian, China26.89118.651310000.43260.35110.58050.2954
5Lichuan, Jiangxi, China27.04116.921510000.48510.40720.68990.3504
6Yanshan, Jiangxi, China27.88117.751810000.47780.42670.70140.3610
7Guangfeng, Jiangxi, China28.32118.42810000.45940.35860.53640.2800
8Longquan, Zhejiang, China27.95119.25910000.50000.39220.63660.3251
9Songyang, Zhejiang, China28.36119.321410000.49120.37880.63230.3218
10Jiande, Zhejiang, China29.46119.671210000.49240.40320.69090.3477
11Jingdezhen, Jiangxi, China29.54117.661810000.60350.44070.71150.3658
12Huangshan, Anhui, China30.01118.091510000.49960.43370.72030.3687
13Lin’an, Zhejiang, China30.32119.441120.3270.000130.000140.51590.44300.70740.3667
14Pan’an, Zhejiang, China28.98120.501210000.52410.43660.70700.3619
15Dongyang, Zhejiang, China29.45120.471020.4670.002060.001560.81720.50480.72910.3830
16Zhuji, Zhejiang, China29.70120.521720.3090.001360.001300.80950.50090.73520.3885
T. nucifera
17Nagano, Japan35.68137.62620.3330.000130.000170.13640.10880.14690.0783
T. jackii
18Xianju, Zhejiang, China28.58120.59820.2500.000100.000150.23540.21400.33660.1727
Ns, numbers of individual; Nh, numbers of haplotype; Hd, haplotype diversity; π, nucleotide diversity; θw, Watterson’s parameter; HO, observed heterozygosity; HE, expected heterozygosity; I, Shannon’s information index; and PIC, polymorphism information content.
Table 2. The Hardy–Weinberg equilibrium testing (χ2) for each population within T. grandis.
PopulationLocus
gr12gr16gr28gr29gr34gr44gr48gr67gr80gr81gr98
10.040.190.190.60-0.6015.67 *5.086.2214.00 **5.83
20.432.88-3.17-0.048.00 *0.160.438.00 *2.88
30.990.042.783.32-0.195.331.180.168.00 *3.50
40.74--0.220.430.117.303.945.0813.00 **6.10
53.840.320.363.24-0.0814.36 *0.390.2213.00 **5.43
63.790.570.473.310.024.0411.08 *9.69 *0.0216.00 **2.44
70.430.580.890.430.04-8.00 *6.58-8.00 **3.26
81.480.140.740.360.03-9.541.840.039.00 **3.06
94.320.080.024.33-1.0414.00 ***1.550.0214.00 **2.82
102.450.100.259.65 *0.10-11.494.09-19.47 **6.44
115.003.494.311.78-4.5018.33 **0.333.8718.00 ***1.05
120.288.66 **2.692.160.020.0215.00 **1.621.3915.00 **3.55
130.800.110.030.810.270.557.98 *4.240.5511.00 *11.90
141.660.110.102.350.250.4811.00 *0.770.1512.00 **0.80
154.024.44 *4.44 *6.696.69 *4.44 *10.00 *10.00 **-10.00 *20.00 **
1612.46 ***8.33 **8.33 **19.13 ***8.33 **7.4917.00 **7.49 **0.0717.00 **24.60 ***
* p < 0.05, ** p < 0.01, and *** p < 0.001.
Table 3. Posterior estimates of demographic parameters for the optimal scenario (scenario 4) in Figure 3 revealed by approximate Bayesian computation.
ParameterMeanMedianMode95% CI
N11.38 × 1031.19 × 1030.71 × 1032.35 × 1023.72 × 103
N1b6.85 × 1056.81 × 1053.76 × 1051.56 × 1051.18 × 106
NA1.70 × 1051.57 × 1050.33 × 1059.92 × 1033.82 × 105
t1 (years)1.22 × 1050.96 × 1050.42 × 1050.19 × 1053.83 × 105
t2 (years)3.75 × 1063.60 × 1063.18 × 1060.28 × 1067.35 × 106
N1, current population size; NA, ancestral population size; N1b, population sizes between the ancestral population and the current population; t1 and t2, times of population changes.
Disclaimer/Publisher’s Note: The statements, opinions and data contained in all publications are solely those of the individual author(s) and contributor(s) and not of MDPI and/or the editor(s). MDPI and/or the editor(s) disclaim responsibility for any injury to people or property resulting from any ideas, methods, instructions or products referred to in the content.

