Article

The Growth and Non-Structural Carbohydrate Response Patterns of Siberian Elm (Ulmus pumila) under Salt Stress with Different Intensities and Durations

1
Key Lab of Plant Stress Research, College of Life Sciences, Shandong Normal University, Ji’nan 250014, China
2
Dongying Key Laboratory of Salt Tolerance Mechanism and Application of Halophytes, Dongying Institute, Shandong Normal University, No. 2 Kangyang Road, Dongying 257000, China
3
College of Art, Qingdao University of Science and Technology, Qingdao 266061, China
4
Shandong Provincial Center of Forest and Grass Germplasm Resources, Ji’nan 250102, China
5
Baiwa Forest Farm of Jinxiang County, Jining 272202, China
*
Author to whom correspondence should be addressed.
Forests 2024, 15(6), 1004; https://doi.org/10.3390/f15061004
Submission received: 7 May 2024 / Revised: 30 May 2024 / Accepted: 5 June 2024 / Published: 7 June 2024
(This article belongs to the Section Forest Ecophysiology and Biology)

Abstract

:
(1) Background: Soil salinity is one of the major abiotic stresses that limits plant growth and production. However, the response patterns of plant growth and carbon metabolism to salt stress are still unclear. (2) Methods: We measured the relative growth rate, non-structural carbohydrate (NSC) concentrations and pool size across organs, the leaf mass area (LMA), root-to-shoot ratio, midday leaf water potential (Ψmd), and photosynthetic characteristics of elm seedlings planted in the field under different salt stress intensities and durations. (3) Results: Salt stress can reduce the photosynthesis rate, stomatal conductance, and Ψmd and inhibit the growth of elm species. LMA increased with the degree and duration of salt stress, indicating an increase in leaf carbon investment to resist salt stress. The root-to-shoot ratio decreased under salt stress to reduce salt absorption by the roots. In the early stage of stress, the concentrations of starch and total NSCs in all organs increased to improve stress resistance and the survival of plants. In the late stage of stress, the concentration of NSCs in the root decreased, which could restrict root growth and water uptake. The relationships between NSC concentration and growth in different organs were contrasting. Meanwhile, the pool size of NSCs had a more significant impact on growth than their concentration. Moreover, the pool size of NSCs in below-ground organs is more closely related to growth than that of above-ground organs. (4) Conclusions: Our research elucidates the carbon allocation mechanism across organs under different salt stress intensities and durations, providing theoretical support for understanding the relationship between tree growth and carbon storage under salt stress.

1. Introduction

Soil salinity is one of the major abiotic stresses that limit the growth and production of most plants worldwide [1,2,3]. Generally, salt stress can decrease soil water potential and thus lead to osmotic stress in plants, as well as causing an imbalance of plant ion ratios and affecting the stability of the membrane system and enzyme activity [4,5,6]. Meanwhile, salinity can also affect the storage and allocation of photosynthetic products as well as secondary metabolites [7,8,9]. The storage of non-structural carbohydrates (NSCs), such as soluble sugars and starch, is the main substance involved in the energy metabolism of trees [10,11]. Starch can be used as an energy supply to enhance plant survival, while soluble sugars play critical roles in osmoregulation, signaling, and xylem repair [10,12,13]. NSCs can be used to assess the level of plant-available substances and the balance between carbon source and sink, and the variations in its components can reflect the response strategies of plants to environmental changes [14,15,16]. Therefore, studying the allocation mechanism of NSCs in trees under stress conditions is of great significance for comprehensively revealing the mechanism of poor growth and the mortality of forests caused by abiotic stress [10,17,18].
Different organs of trees have different functions and, thus, result in different NSC concentrations [19,20]. A recent global synthesis showed that NSC concentrations were highest in leaves and below-ground reserve organs, intermediate in the roots, and lowest in stems [11]. The high NSC concentrations in leaves may be due to their role as the major sources of carbohydrates and may reflect their high metabolic rate [19,21]. The lowest NSC concentrations in stems are possibly due to their higher proportion of tissues either ligninized or non-living [11]. Moreover, trees could redistribute and utilize the NSCs stored in different organs to resist environmental stress [10]. However, there are still many controversies about the allocation patterns of NSCs across different organs under stress conditions. Some studies have shown that drought significantly reduces the root storage or concentration of NSCs, while above-ground NSC concentrations or storage remains unchanged [22,23]. In contrast, other studies showed that the root NSC storage of some tree species increased under drought stress, allocating starch to coarse roots for storage to resist drought in later stages and distributing soluble sugar to fine roots to promote water absorption [24,25].
The carbon allocation pattern of plants is closely associated with the intensity and duration of environmental stress. Under mild or moderate drought, the xylem cavitation of trees occurs gradually and can be refilled to prevent the occurrence of “hydraulic failure”, and trees can consume NSCs with a decline in photosynthetic rate [17]. Under severe drought, trees undergo irreversible cavitation in a relatively short period of time and thus die from “hydraulic failure” before NSC depletion [26,27]. Generally, the decline in tree growth rates caused by droughts occurs before the decrease in photosynthetic rate, leading to an increase in plant NSCs during the early stages of droughts [28,29]. However, long-term severe droughts could lead to the net loss of NSCs, indicating that prolonged severe droughts could lead to the NSC depletion of the whole plant [29,30,31]. Salt stress could decrease soil water potential and thus lead to osmotic stress in plants [32,33]. Meanwhile, it could also cause an imbalance of plant ion ratios, and therefore, its effect was more severe than that of low osmotic stress alone [34]. Therefore, we infer that salt stress with different intensities and durations could also cause differences in plant NSC allocation patterns, but relevant research is still very lacking.
Changes in the carbon allocation priorities from growth to storage have been regarded as an adaptation to optimize plant survival in response to stress [35,36,37]. This indicates that “reserves” could compete with growth and suggests a trade-off between these two sinks [38,39,40]. Some studies support this statement. For example, the total NSC pool size was negatively associated with an inherent relative growth rate in shades across seven studied species in neotropical forests [41]. Similarly, Poorter & Kitajima [42] found that the growth rates of woody species saplings declined with the NSC concentration and pool sizes in moist forest species. However, recent studies obtained contrast these conclusions. For example, Piper [43] found that radial growth and seasonal minimum NSC concentrations or pool sizes are decoupled in 11 sympatric broadleaf temperate tree species. Overall, these results are species-specific or shift during ontogeny [15,41,44]. These studies have focused on drought, shade, or cold stress; however, the relationship between growth and carbon storage under salt stress is still unclear.
Siberian elm (Ulmus pumila), widely spread in arid and semi-arid regions of China, is an important soil-preserving and sand-fixing plant with strong resistance and adaptability to harsh environments [45,46]. As global soil salinization continues to worsen, the growth and development of trees are increasingly threatened by salt stress [6,47,48]. Most studies on the salt tolerance of elm mainly focus on morphology, physiology, and molecular biology [49,50,51]; however, their response patterns of growth and carbon metabolism to salt stress are still unclear. In this study, we measured the relative growth rate, leaf mass area, root-to-shoot ratio, midday leaf water potential, photosynthetic-related traits, concentrations of NSCs, and their compositions across different organs of elm seedlings planted in fields under different salt stress intensities and durations. The main aims of our study were as follows: (i) to clarify the variation patterns in growth and physiological indicators of elm under different salt stress intensities and durations; (ii) to elucidate the allocation patterns of NSCs across different organs (leaf, branch, stem, coarse root, fine root) of elm under different salt stress intensities and durations; and (iii) to determine the relationship between the relative growth rate and NSC concentrations and pool sizes under salt stress.

2. Materials and Methods

2.1. Site Description

This study was conducted at an experimental base on the south side of Shandong Normal University at the foot of Shuanglong Mountain (36°31′ N, 116°49′ E) in Shandong Province. This area belongs to a warm temperate continental monsoon climate zone with four distinct seasons. The mean annual temperature is 13.8 °C, and the annual precipitation is 623.1 mm. The annual frost-free period and light hours are 178 d and 1870.9 h on average, respectively. The main soil types are yellow-brown soil and brown soil.

2.2. Experimental Design

In April 2022, 8 quadrats (2 × 0.75 m2) at a 0.5 m distance were set in our experimental base. The soil of these quadrats was dug out (0.75 m deep), surrounded by a 12 mm thick plastic cloth (including the sides and the bottom), and the excavated soil well was mixed before filling it back in. Annual seedlings of elm with a relatively consistent basal diameter (c. 8 mm) and height (c. 1.3 m) were selected in the Baiwa Forest Farm of Shandong Province (35°2′ N, 116°8′ E), and then transplanted in these quadrats. Twelve saplings were planted in each quadrat. Then, they were watered normally for three months to ensure healthy growth and the development of the seedlings. The experimental plot and planted elm seedlings pictures can be seen in Figure 1. In July 2022, four salt concentration gradients were set (0 mM, 100 mM, 200 mM, 300 mM), and two quadrats were set for each salt concentration treatment. A rain cloth was prepared for each quadrat, and the rain cloth was rolled up on sunny days to keep plants in natural light and was covered on rainy days to prevent the potential effect of rainfall on the experiments. By observing changes in plant phenotype, we conducted two harvest samplings on days 30 and 60 after salt treatment. The leaf phenotype under different salt concentrations can be seen in Figure S1, and the schematic diagram of variations in each indicator under salt stress can be seen in Figure S2.

2.3. Measurement of Relative Growth Rate

We measured the base diameter with a vernier caliper and the height with a tapeline at the beginning of the salt treatment experiment and at two sampling times. The relative growth rate for the base diameter (RGRD) or height (RGRH) of the seedlings was calculated as follows:
RGR D / H = l n X 2 l n X 1 T 2 T 1
where X1 and X2 represent the base diameters or height measured at times T1 and T2, respectively [52].

2.4. Measurements of Leaf Mass Area, Photosynthetic-Related Traits and Midday Leaf Water Potential

For the leaf mass area measurement, 15 healthy leaves from five individuals were collected per salt treatment in August and September 2022. The leaf areas were determined by scanning and then calculated by ImageJ software (v.1.51j8, National Institutes of Health, Bethesda, MD, USA). Then, the leaves were dried at 65 °C in an oven to a constant and weighed. The leaf mass area (LMA, g cm−2) was calculated as the ratio of the leaf dry mass and leaf area.
The photosynthetic rate (A, μmol m−2 s−1) and stomatal conductance (gs, mol m−2 s−1) were determined in 12 healthy leaves from four individuals per salt treatment during the mid-morning (09:00–11:00 h) by a portable photosynthesis instrument (Ciras-3, PP systems, Haverhill, MA, USA) on sunny days in August and September 2022. During the photosynthesis measurement, the lighting and CO2 conditions were set to maintain a constant value of 800 μmol m−2 s−1 and 400 μmol mol−1, respectively. Intrinsic water-use efficiency (A/gs, μmol mol−1) was calculated as the ratio of photosynthetic rate and stomatal conductance [53]. On the same day, 12 healthy leaves from four individuals per treatment were collected during midday (12:00–13:00 h, Ψmd) to determine the midday leaf water potential using a dew point water potential meter (Psypro, Wescor, Logan, UT, USA).

2.5. Measurement of Root to Shoot Ratio

In August and September 2022, three to five individuals were harvested for each treatment, and each individual was divided into the following five parts: the leaf, branch, stem, coarse root, and fine root (<2 mm). Each plant sample was placed in an oven at 105 °C for 1 h to eliminate enzymatic activity and then dried at 65 °C for 72 h and weighed. Then, the root-to-shoot ratio was calculated as the weight of the below-ground organs (coarse root and fine root) divided by the weight of the above-ground organs (leaf, branch, and stem). Then, all plant samples were ground into fine powder for NSC analysis.

2.6. Measurement of Non-Structural Carbohydrates Concentration

Sugars in dried powdered plant samples were extracted by centrifugation using 80% ethanol, and the extraction process was repeated three times to ensure all soluble sugars from the samples were collected. The remaining residuals were digested and further hydrolyzed to glucose using enzymes, and then the supernatants were used to determine the starch concentration. The determination of sugar and starch was performed at 620 nm on a spectrophotometer using the same anthrone reagent. The total NSC concentration was calculated as the sum of the soluble sugar and starch concentrations. The concentrations of total NSCs, soluble sugar, and starch were expressed as the percentage of dry matter (mg g−1).

2.7. Data Analysis

The pool size of NSCs in each organ was calculated as the product of the NSC concentration of each organ and its dry weight. Considering the pool size of NSCs, the whole plant might be more representative of carbon remobilization, as the magnitude of remobilization might vary across organs [54]. The pool size of NSCs for the whole plant was calculated as the sum of the pool size in all organs.
One-way ANOVA was conducted to test the differences in RGR, LMA, the root-to-shoot ratio, Ψmd, photosynthetic-related traits, and the concentrations of total NSCs and their compositions amongst different salt concentration treatments in SPSS (2010, v.19.0, SPSS Inc., Chicago, IL, USA). An independent sample t-test was conducted to test the differences in the above indicators between different salt stress durations in SPSS. The Pearson correlation was conducted to test the relationships between RGR and the concentrations of total NSCs and their compositions and their pool size across different organs and the whole plant level in SPSS.

3. Results

3.1. Effects of Salt Stress on Relative Growth Rate, Leaf Mass Area, Midday Leaf Water Potential, Root/Shoot Ratio, and Photosynthetic-Related Traits of U. pumila

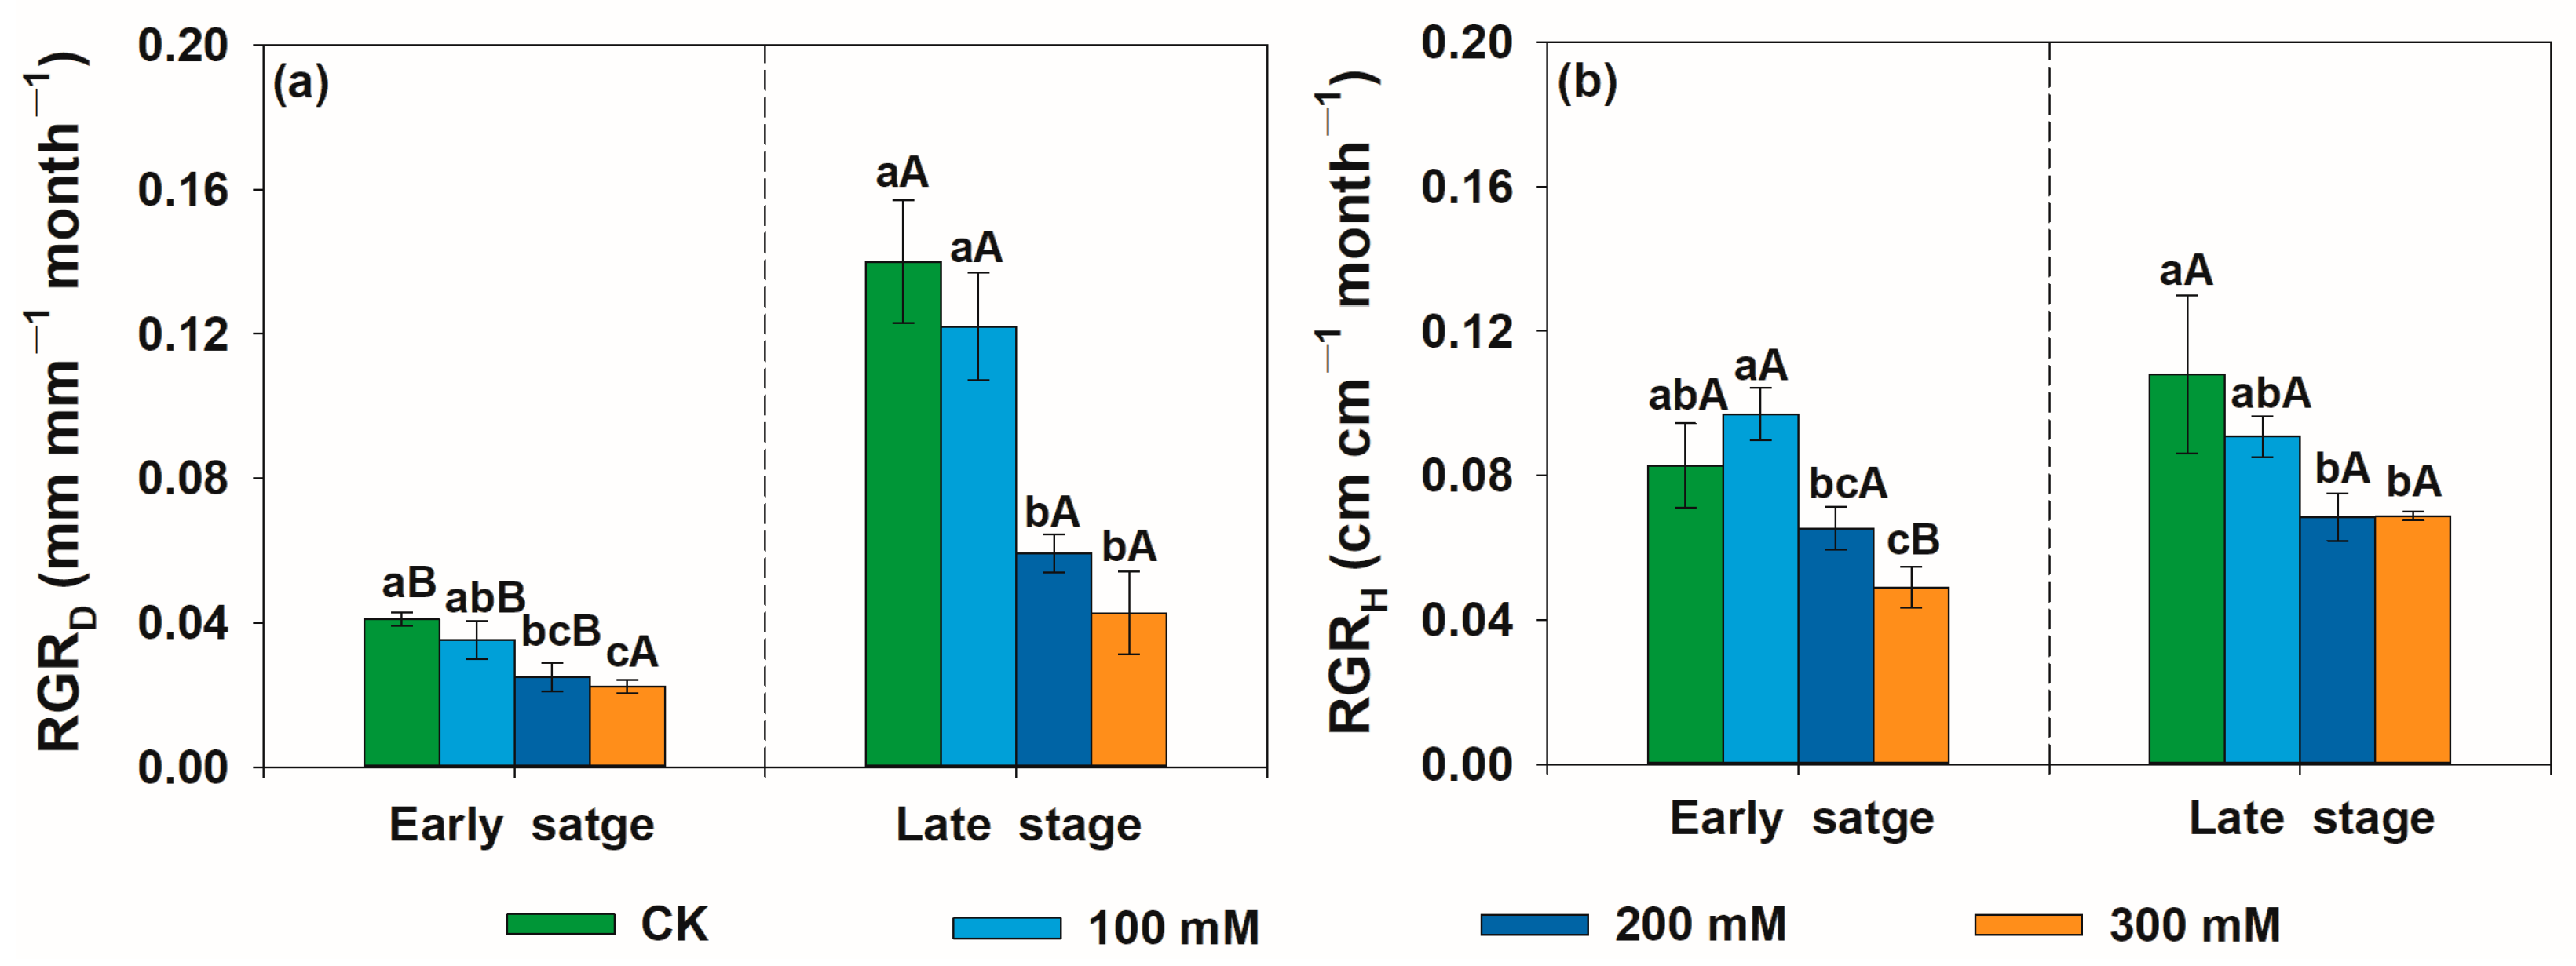
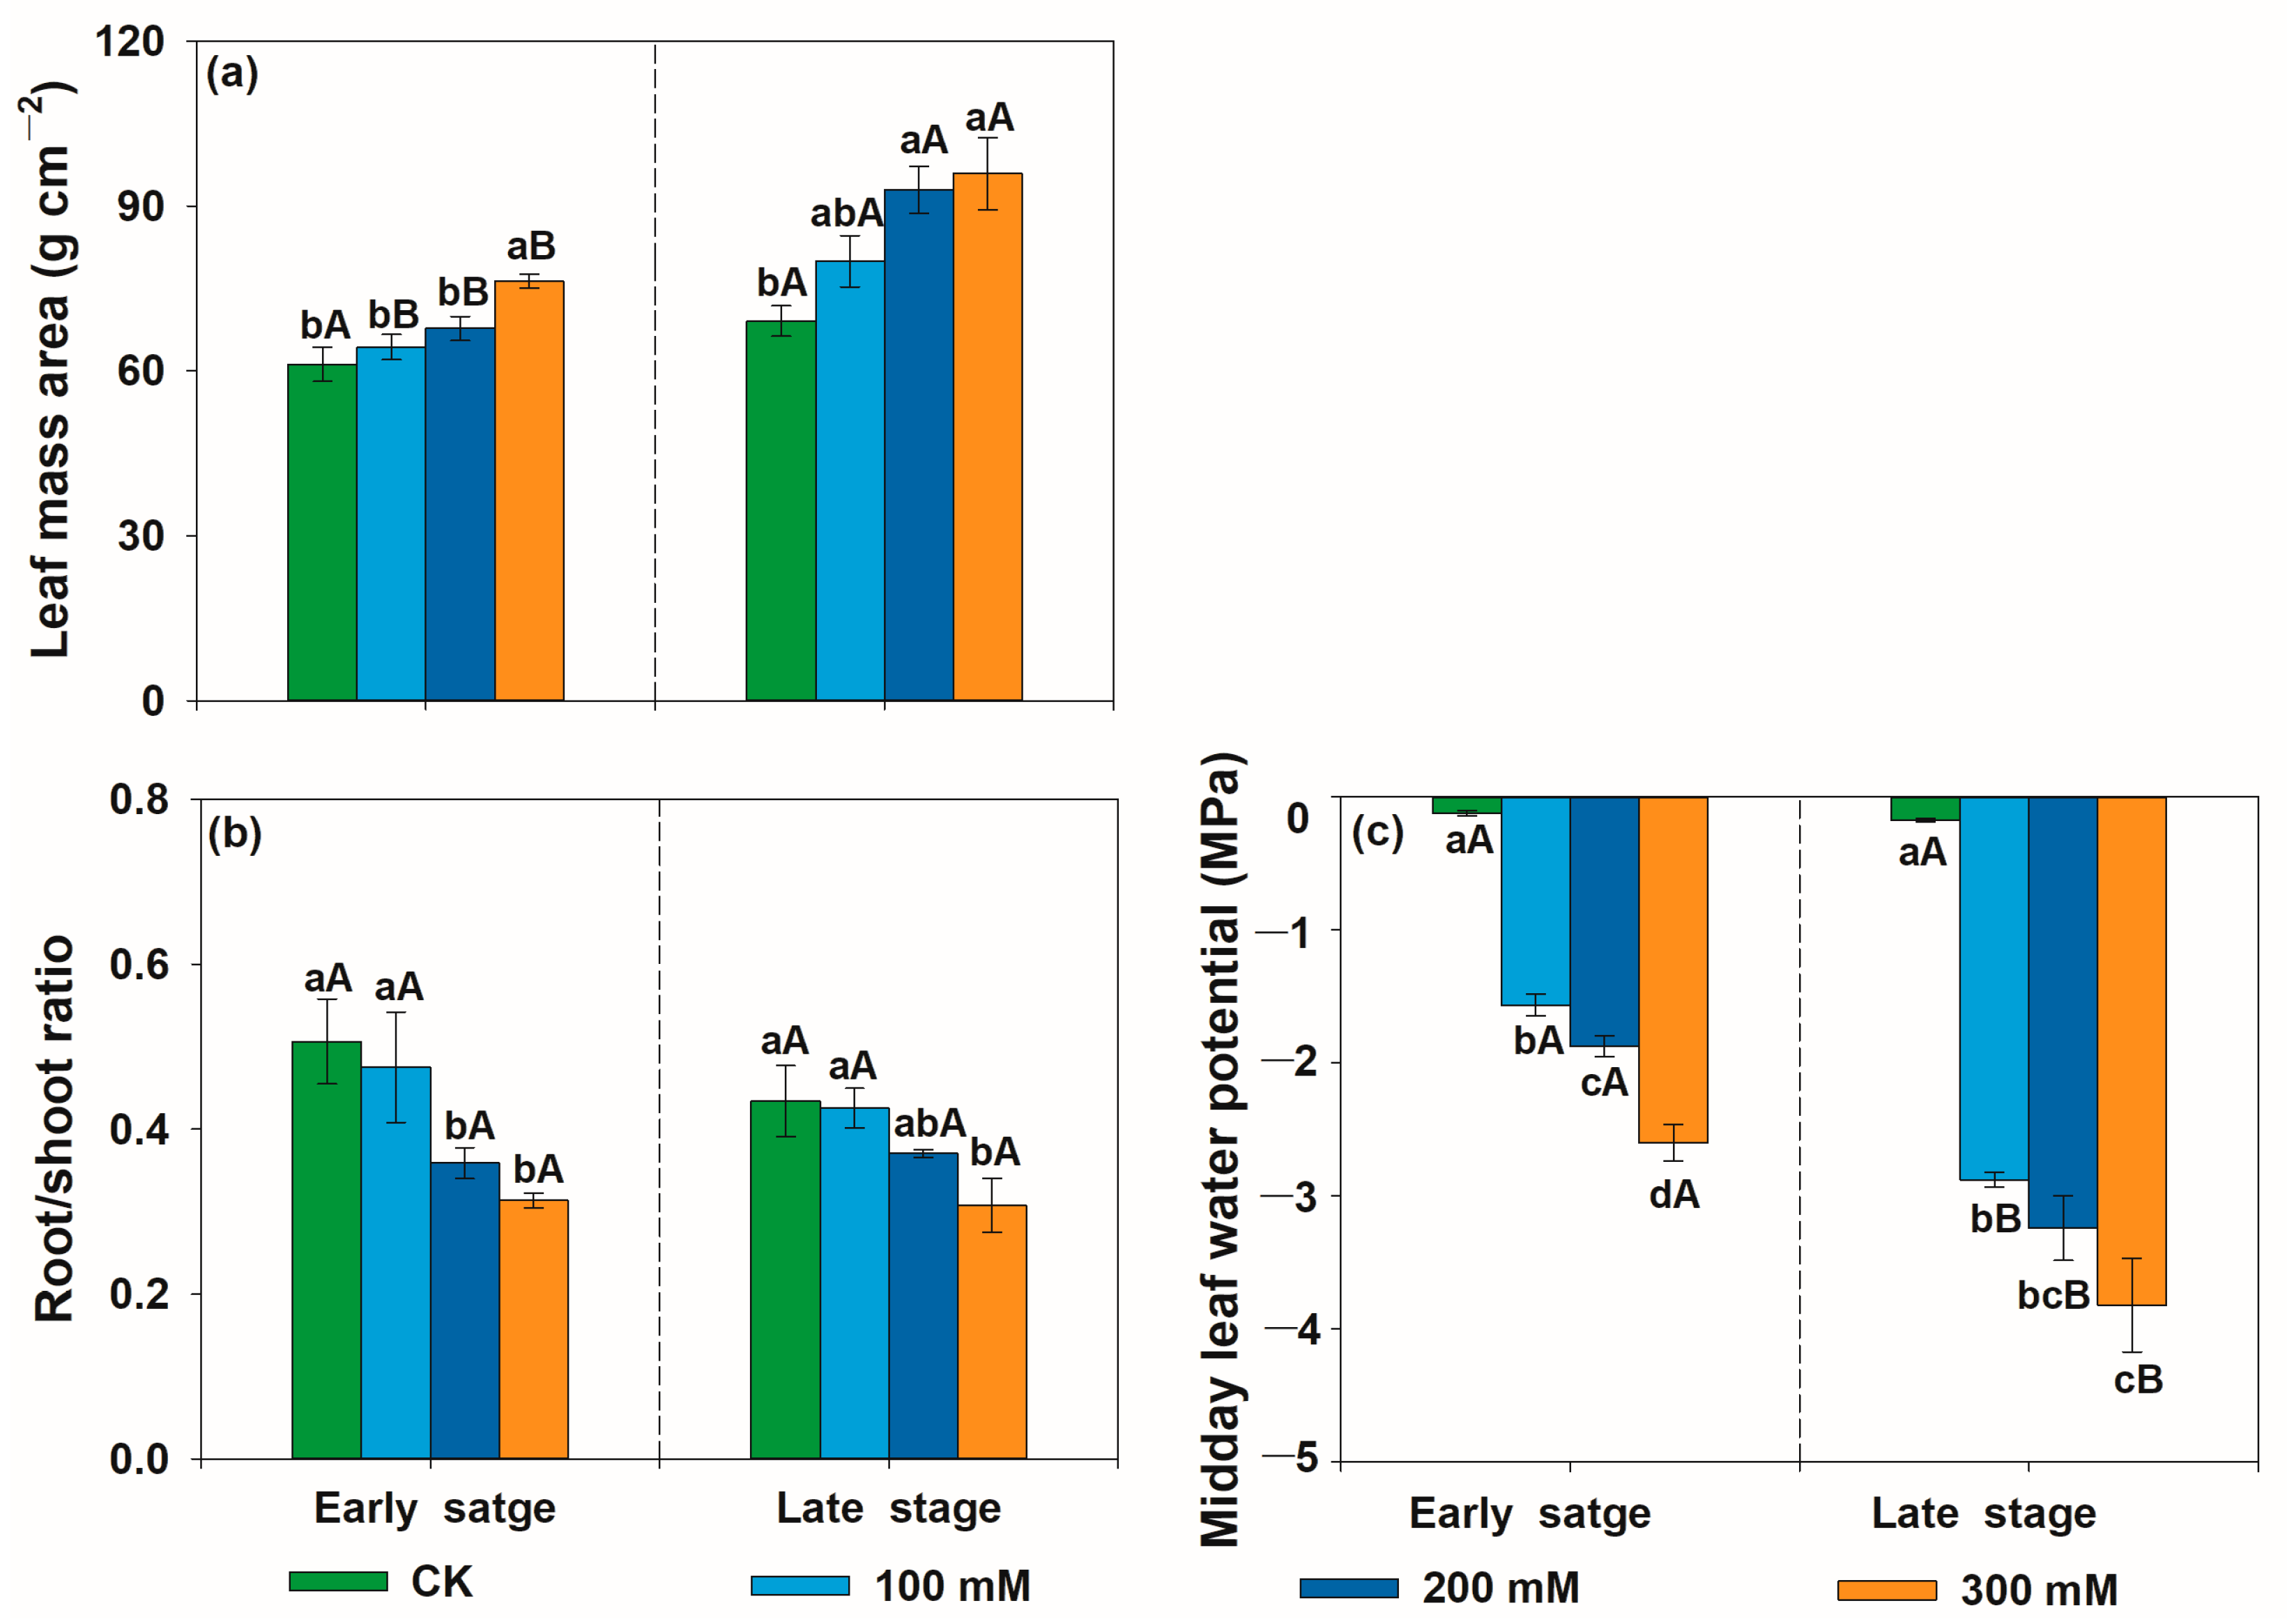
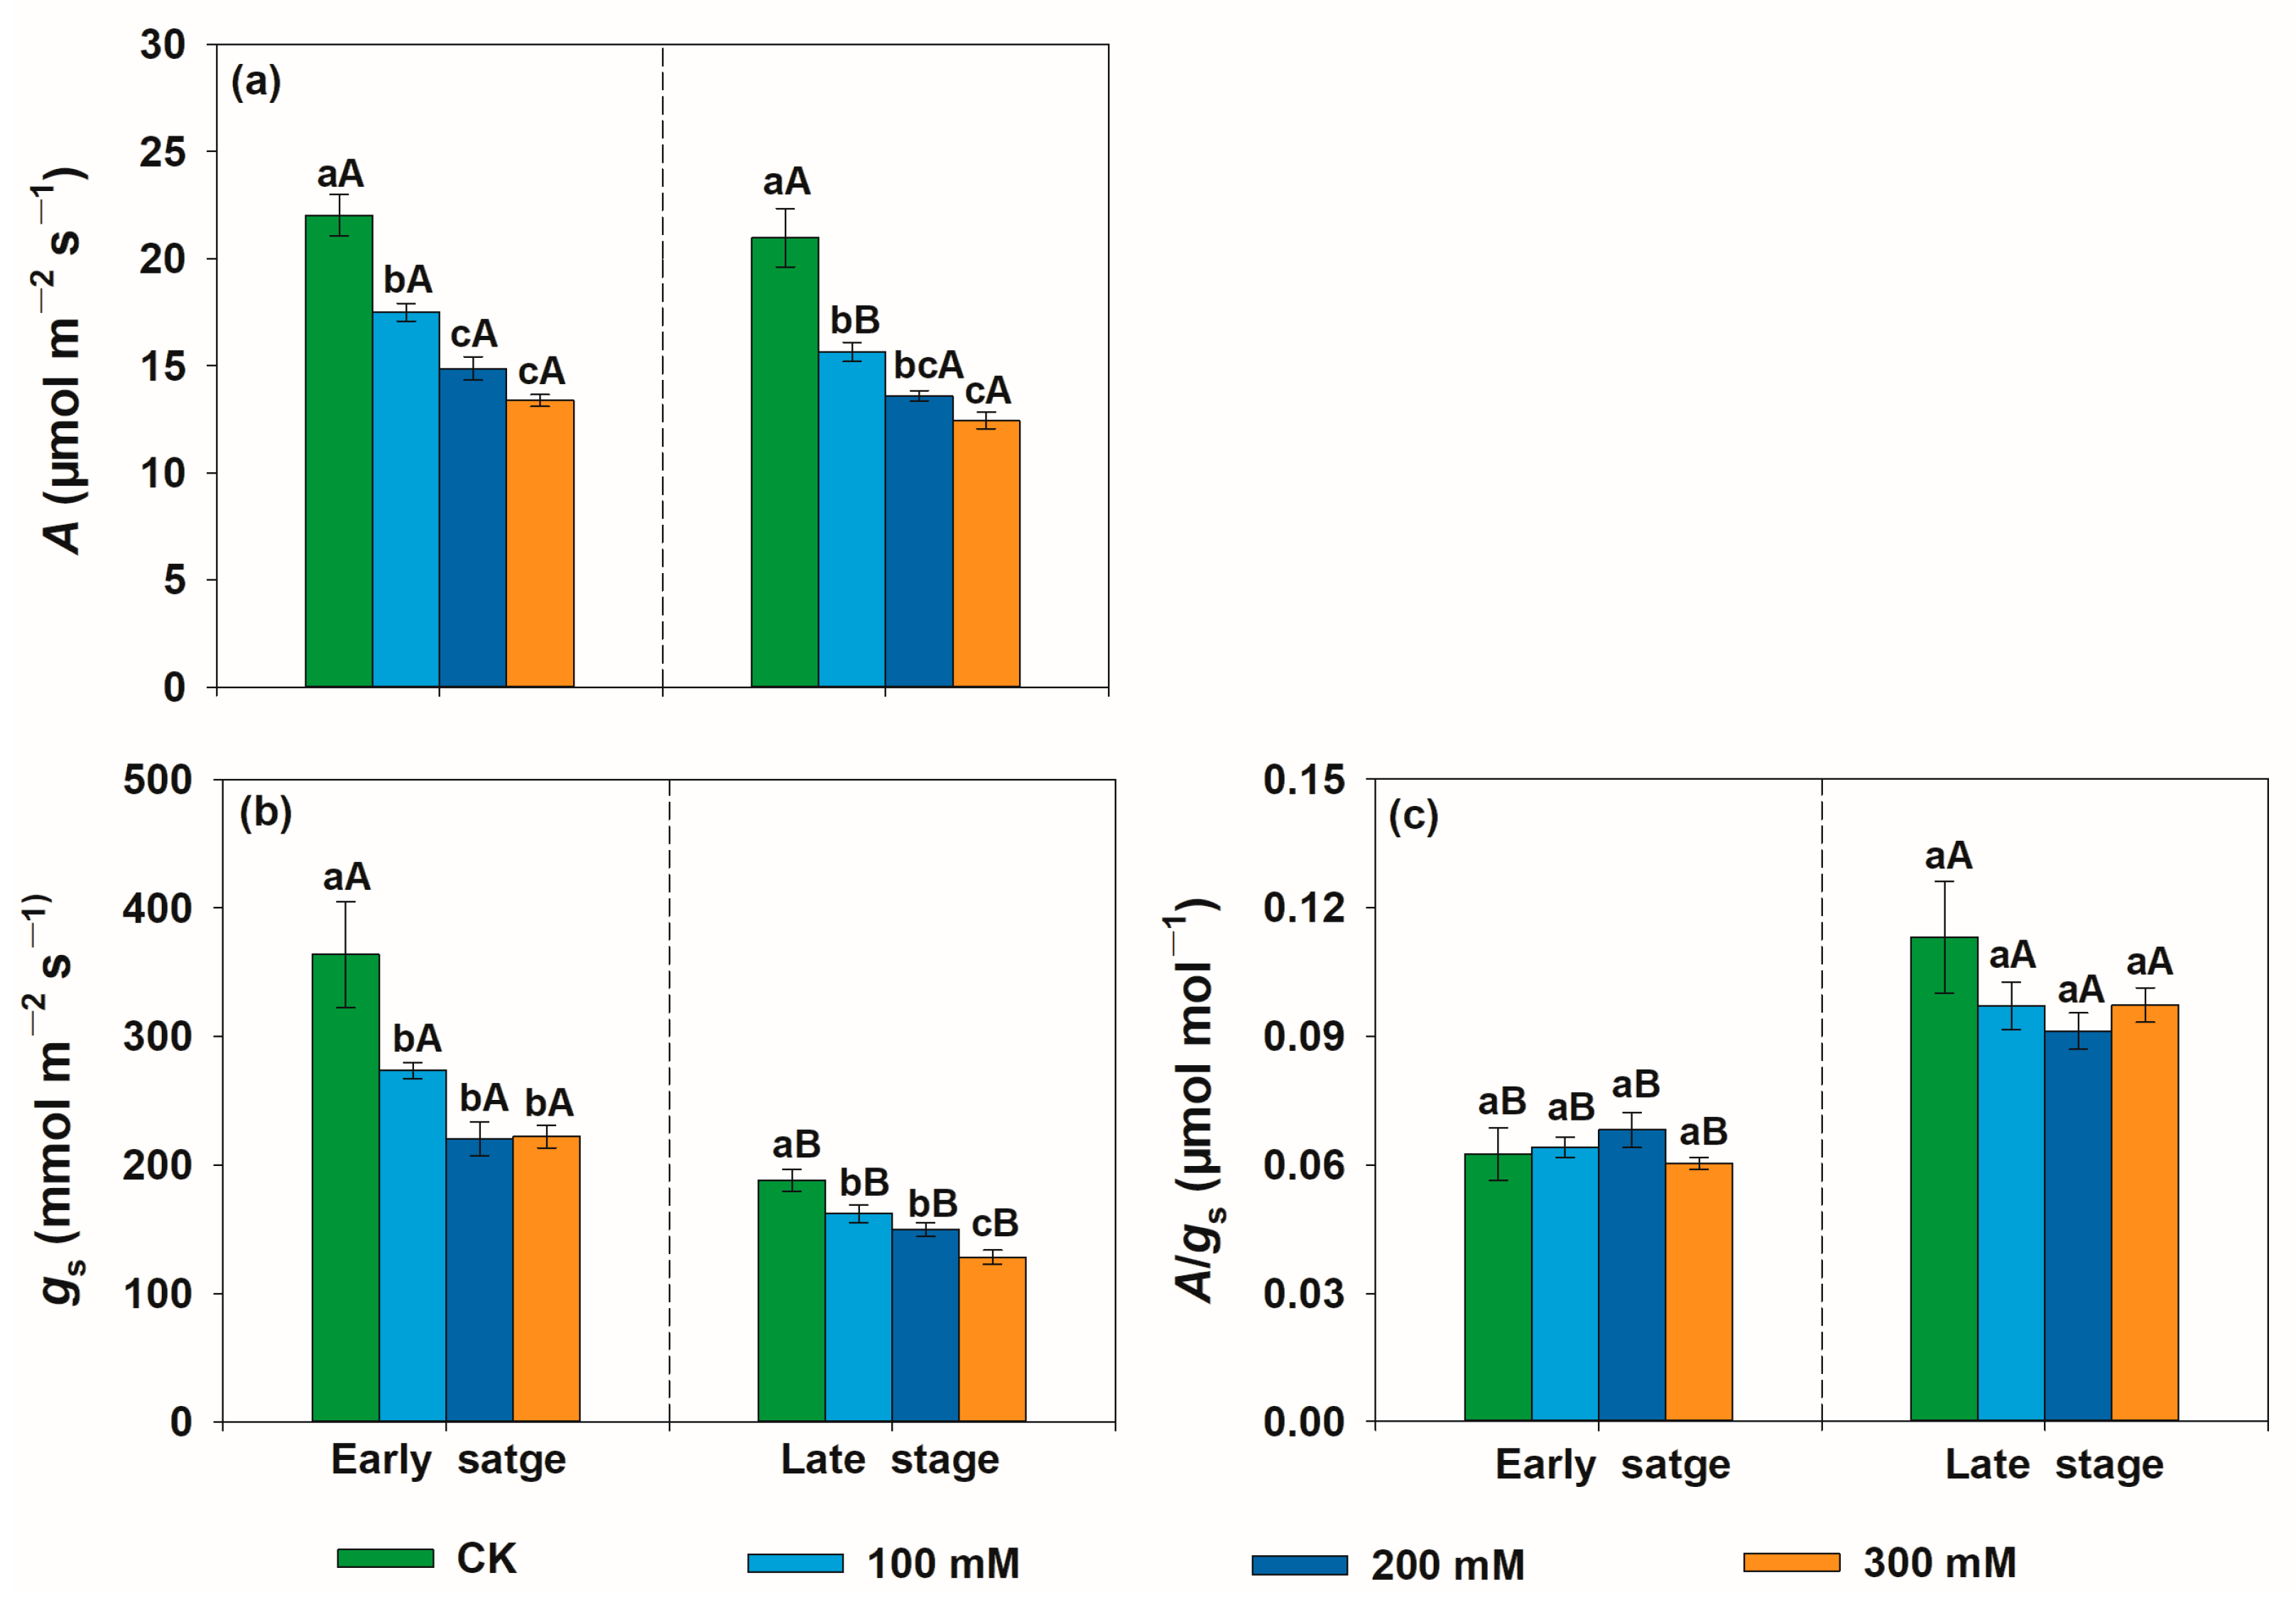
In our study, RGRD and RGRH decreased with soil salinity, and there was a positive correlation between RGRD and RGRH (Figure 2 and Figure S3). Leaf mass area increased (Figure 3a), while the midday leaf water potential decreased (Figure 3c) with the increase in salt stress intensity and duration. In addition, the root/shoot ratio also decreased with soil salinity, but no significant difference was found between the early and late stages of stress (Figure 3b). The photosynthesis rate and stomatal conductance of elm also decreased with salt stress intensity and duration (Figure 4a,b). Although no significant difference was found in intrinsic water use efficiency amongst different salt concentrations in both the early and late periods of salt stress, intrinsic water use efficiency in the late stage was significantly higher than that in the early stage (Figure 4c).

3.2. Variation Patterns of Non-Structural Carbohydrate Concentrations of U. pumila in Response to Salt Stress

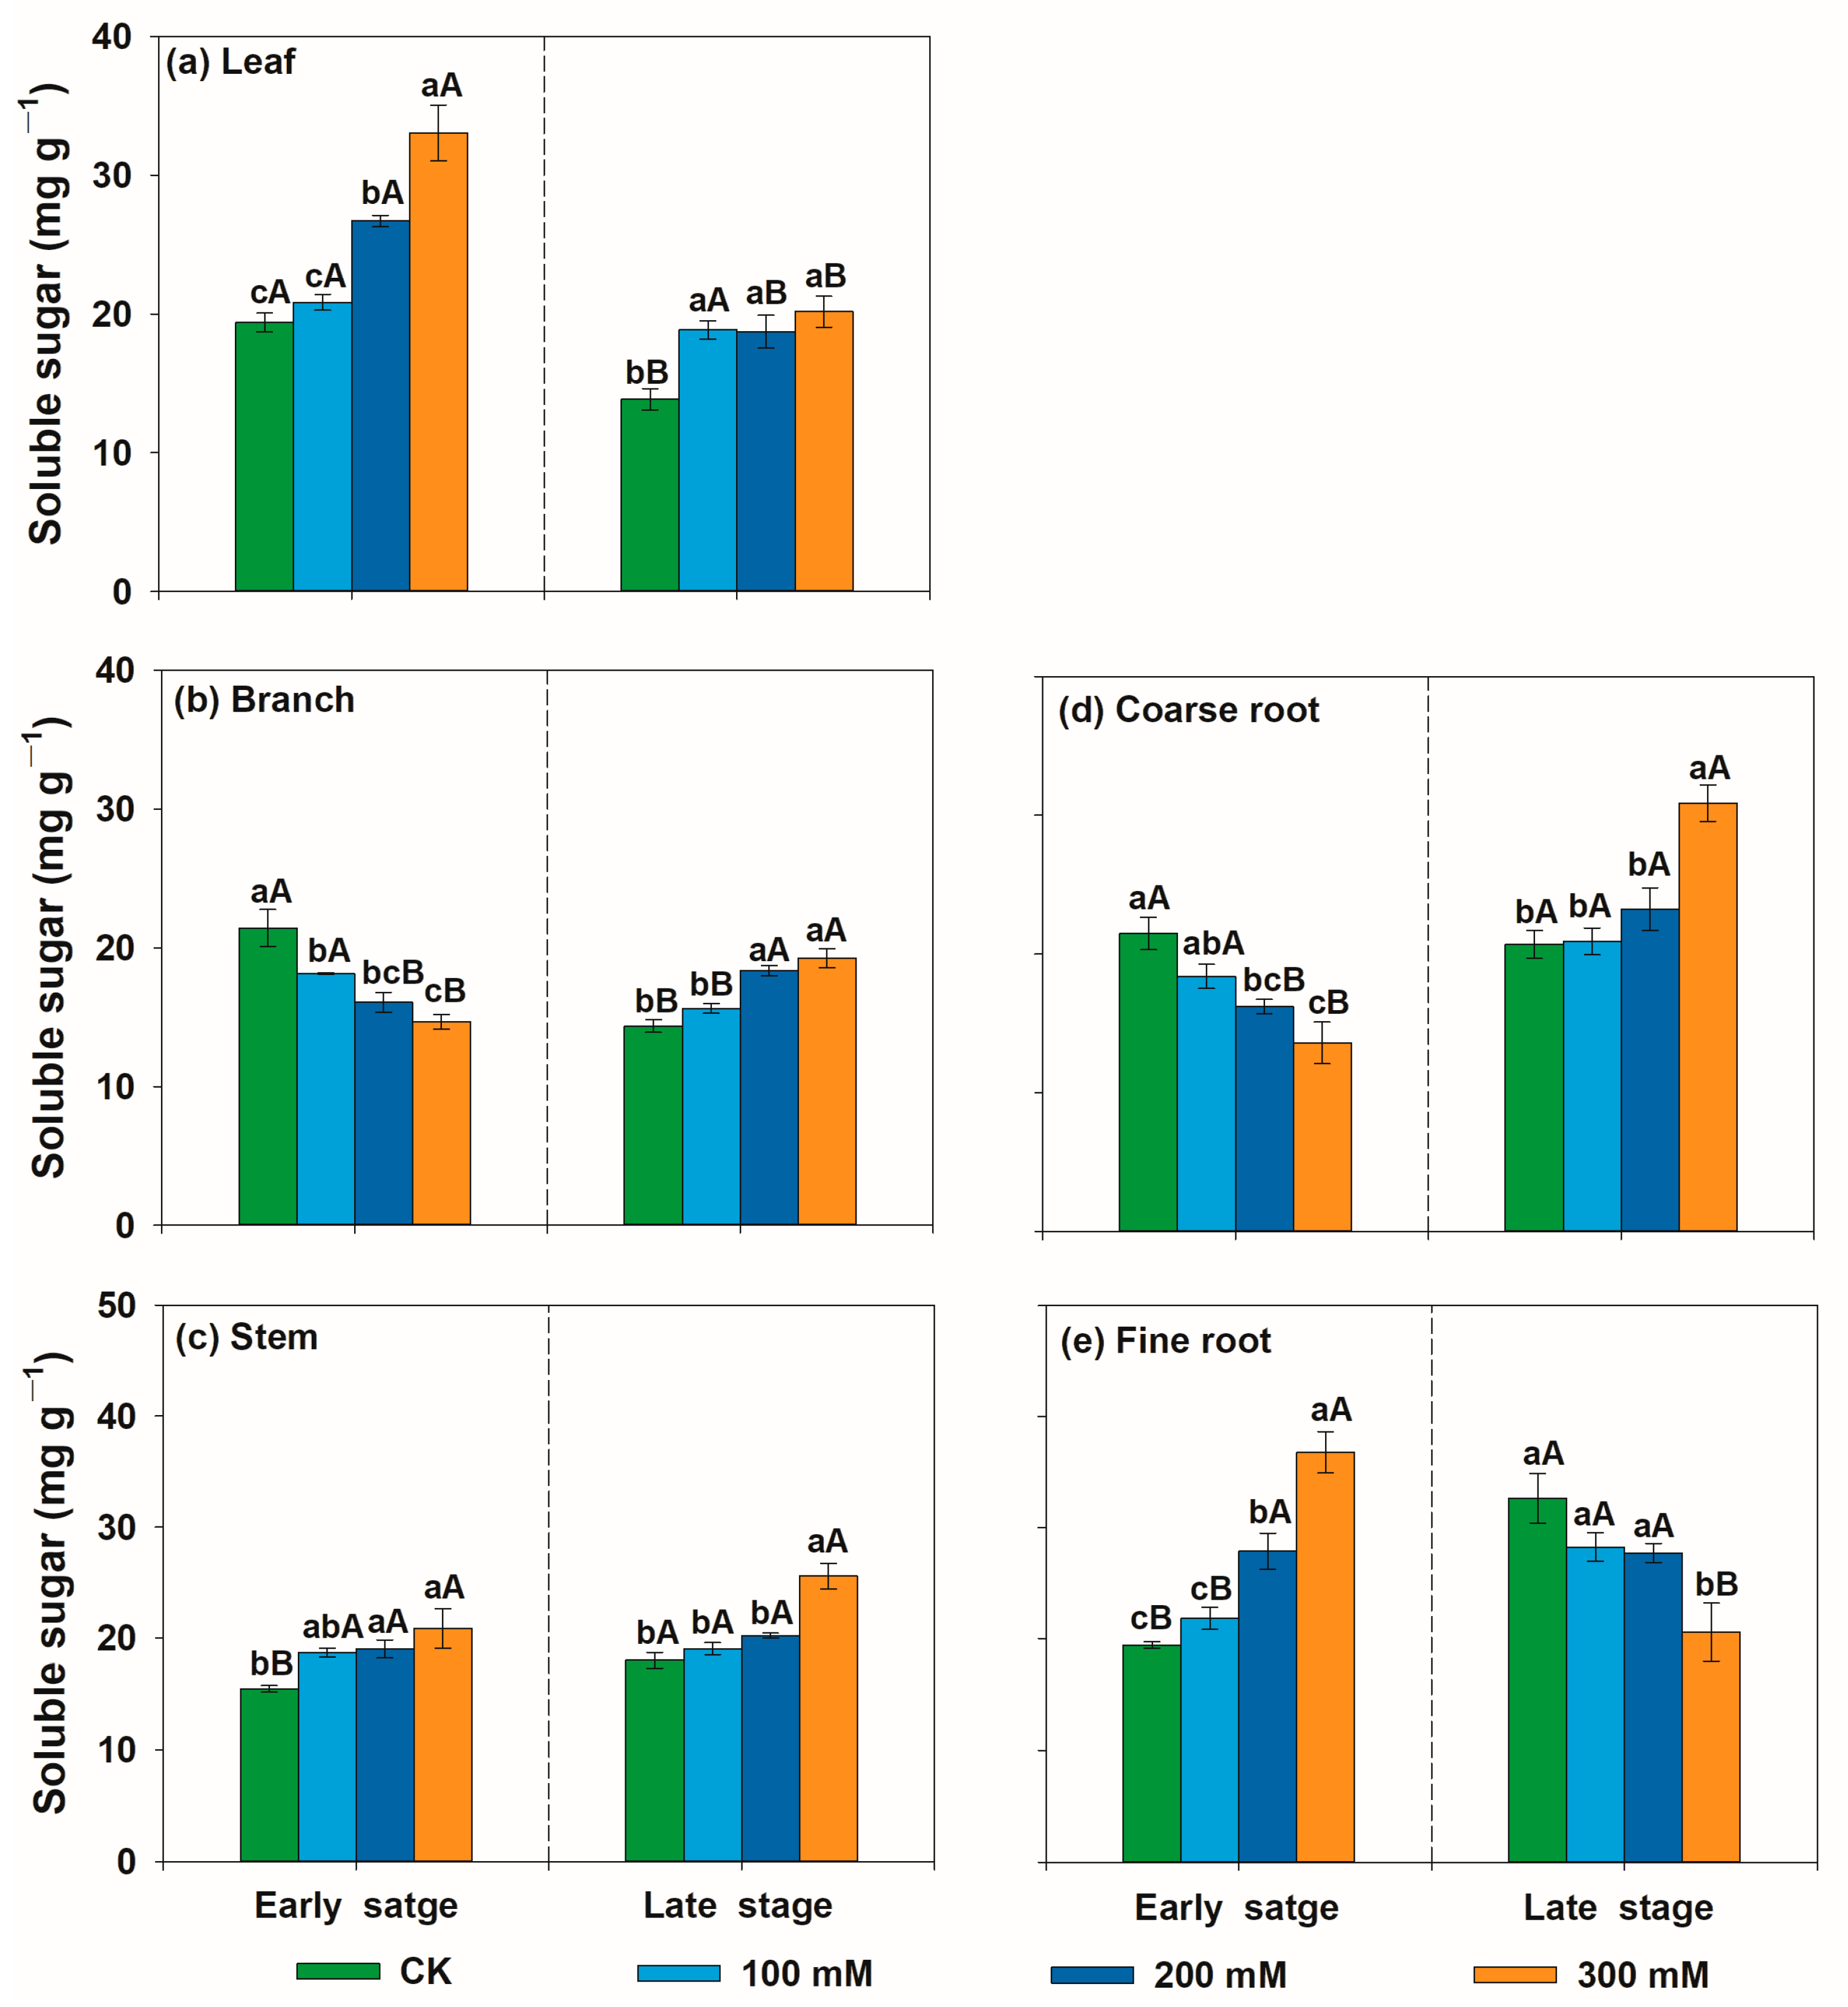
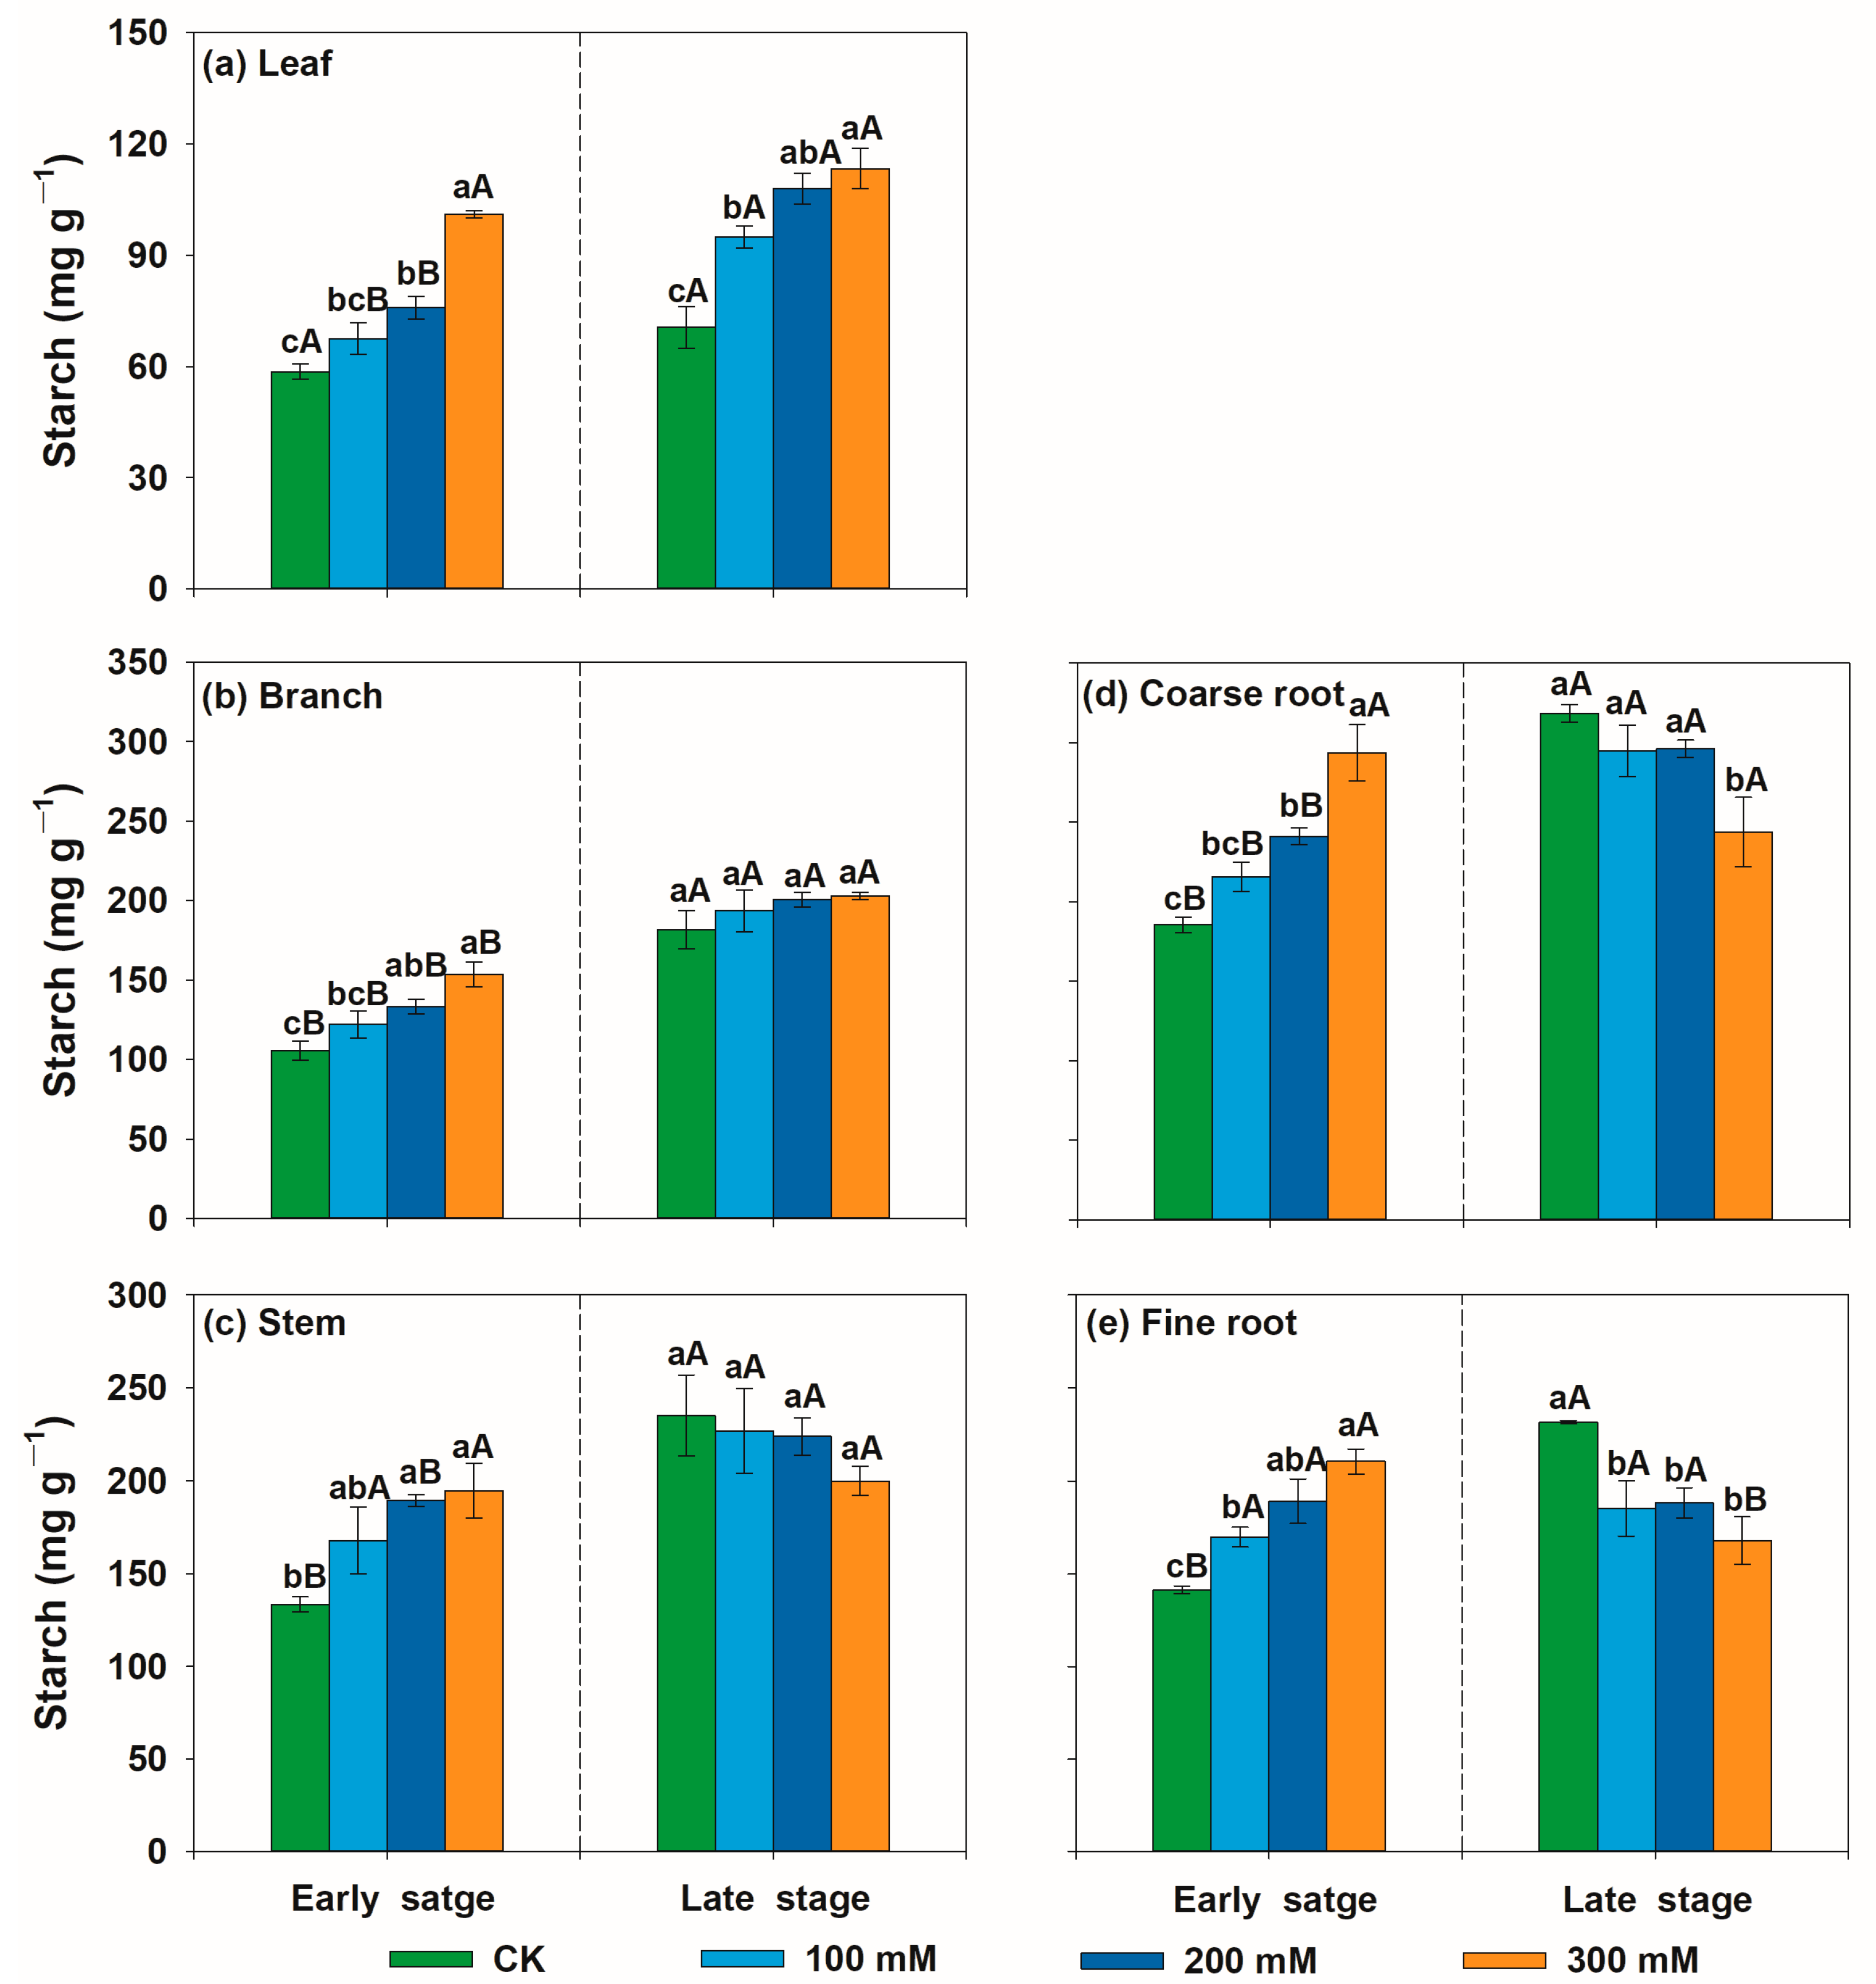
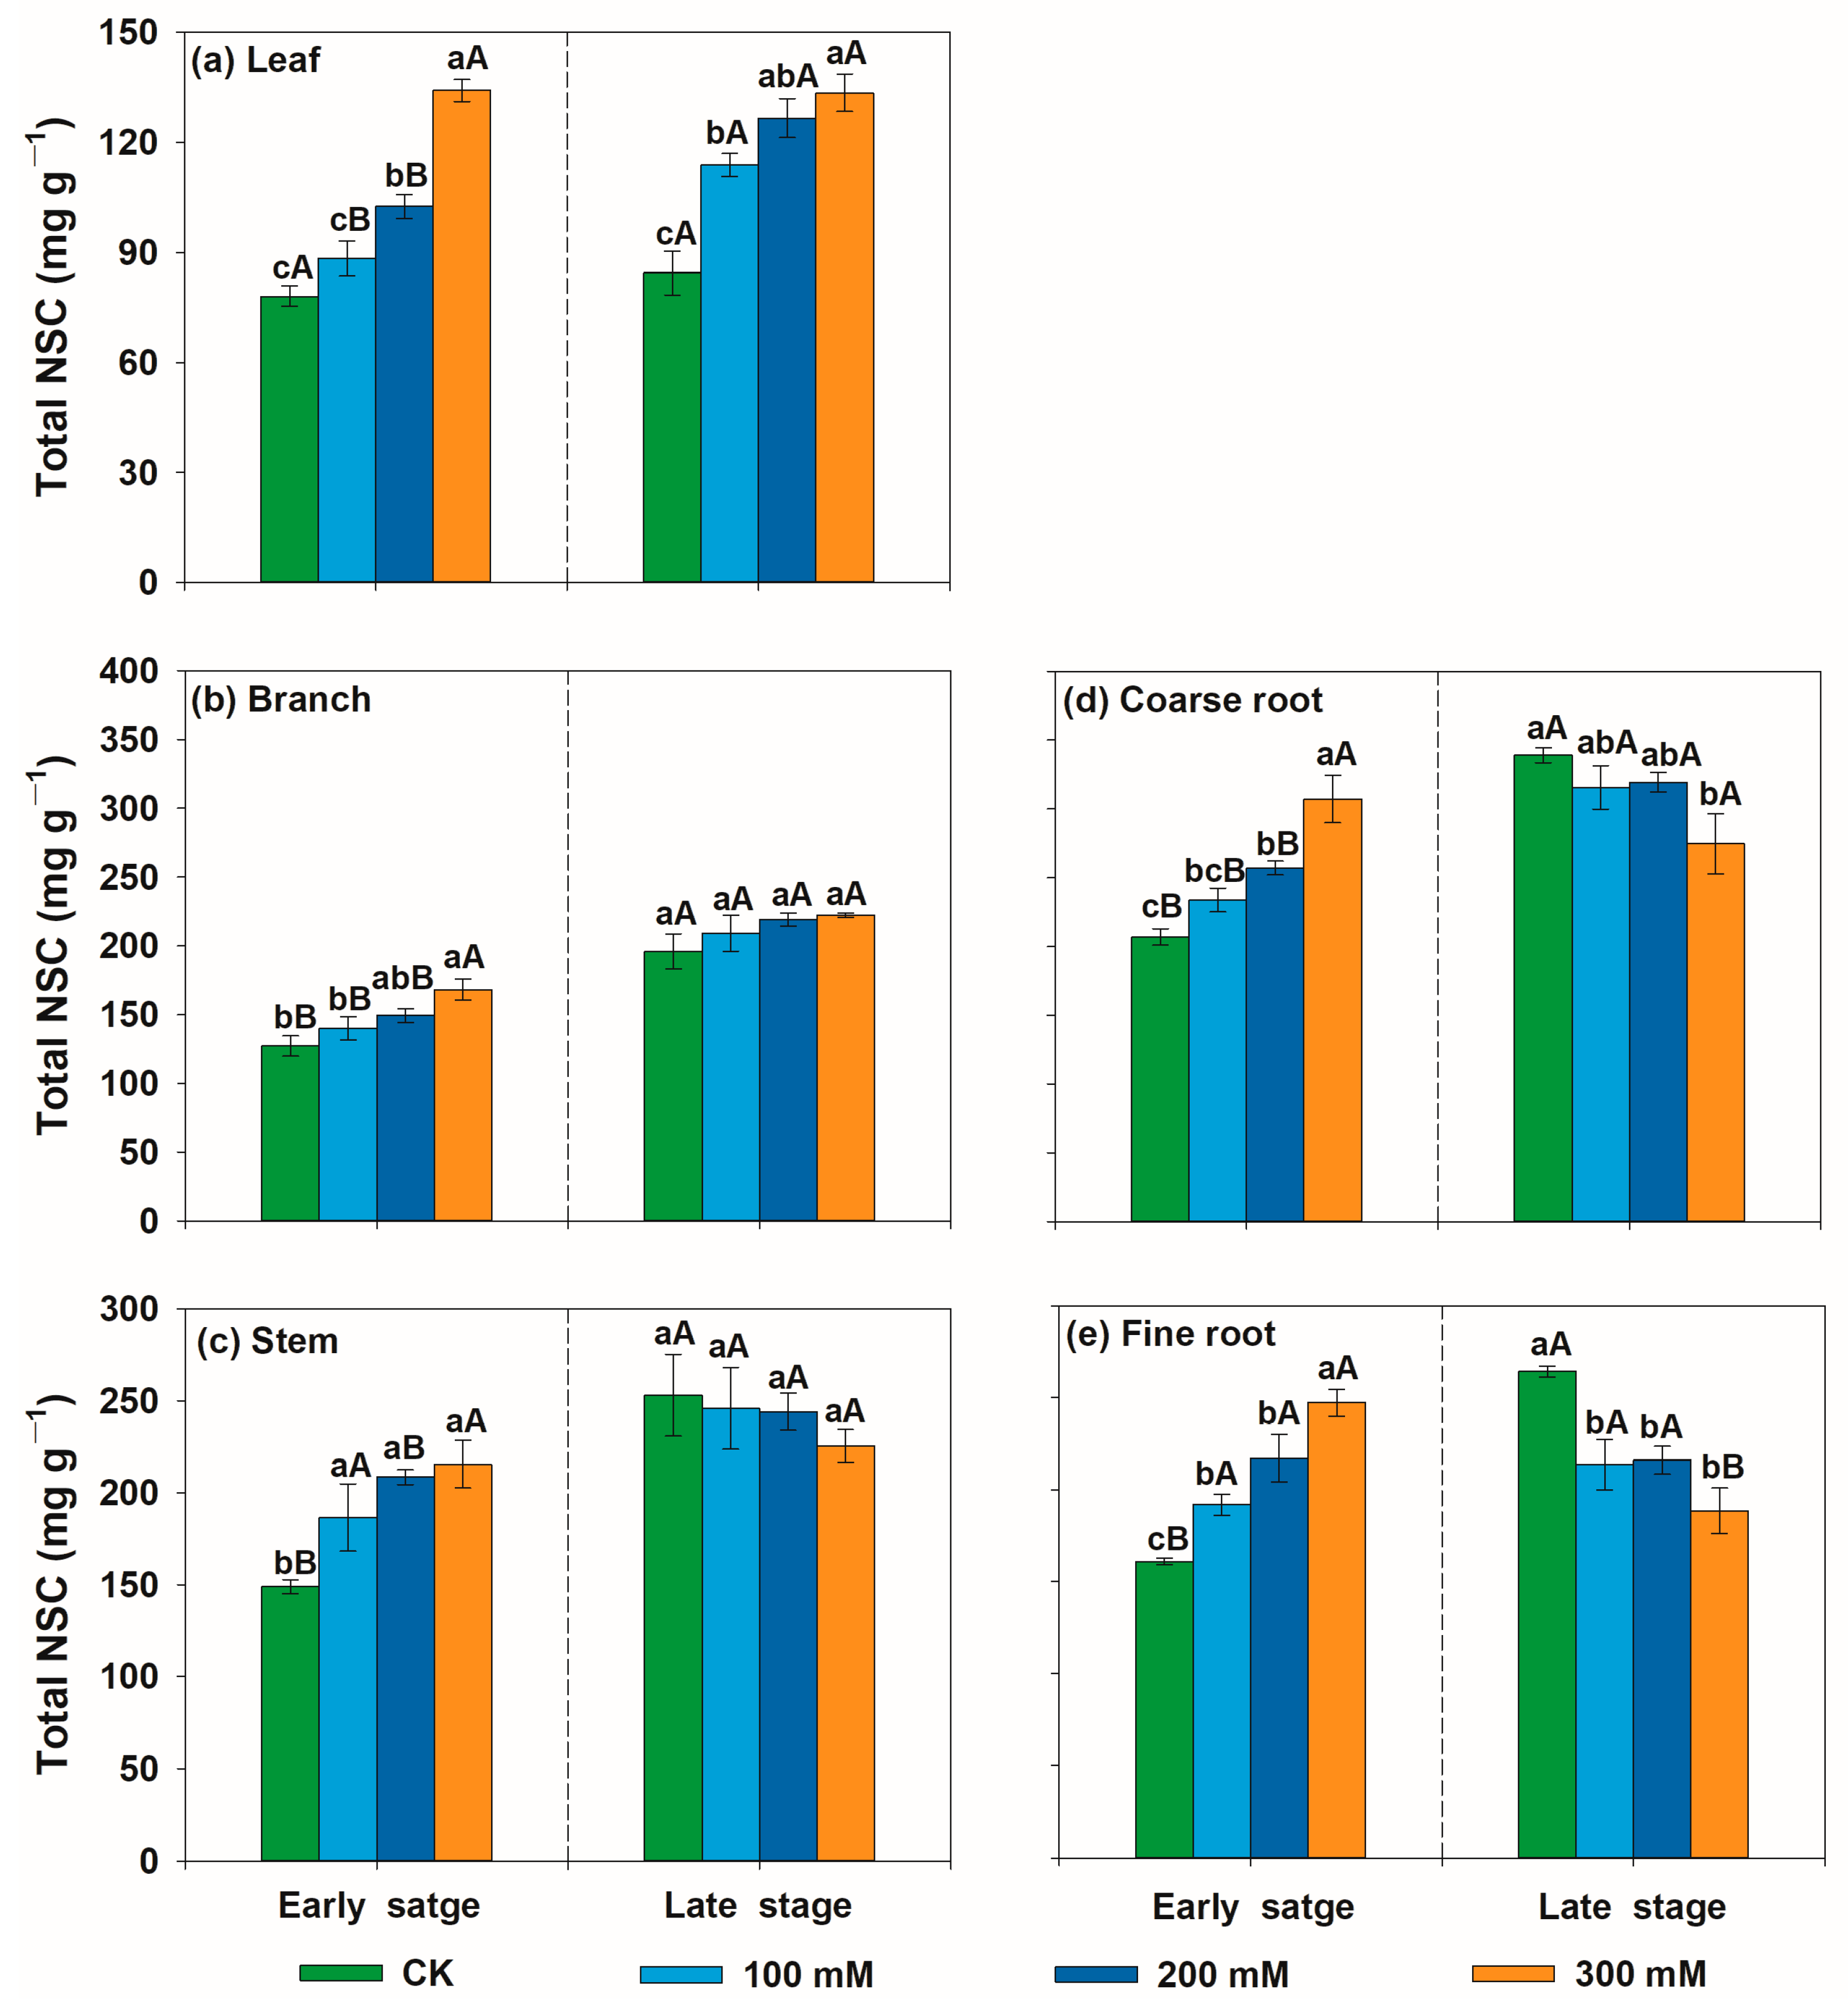
In the early stage of salt stress, the soluble sugar concentration in leaves, stems and fine roots increased, while the soluble sugar concentration in branches and coarse roots decreased with salt concentration (Figure 5). In the late stage of salt stress, the variations in the soluble sugar concentration in the leaves and stems with salt concentration were consistent with those in the early stage of salt stress, but the variations in soluble sugar concentration in branches, coarse roots, and fine roots were reversed (Figure 5). In the early stage of salt stress, the concentrations of starch and total NSCs across all organs were significantly increased with salt concentration (Figure 6 and Figure 7). In the late stage of salt stress, different organs showed the following different response patterns: the concentrations of starch and total NSCs in the leaves increased, those in branches and stems remained unchanged, and those in coarse roots and fine roots decreased with the salt concentration (Figure 6 and Figure 7).

3.3. Relationships between Relative Growth Rate and Non-Structural Carbohydrate Concentrations and Pool Size

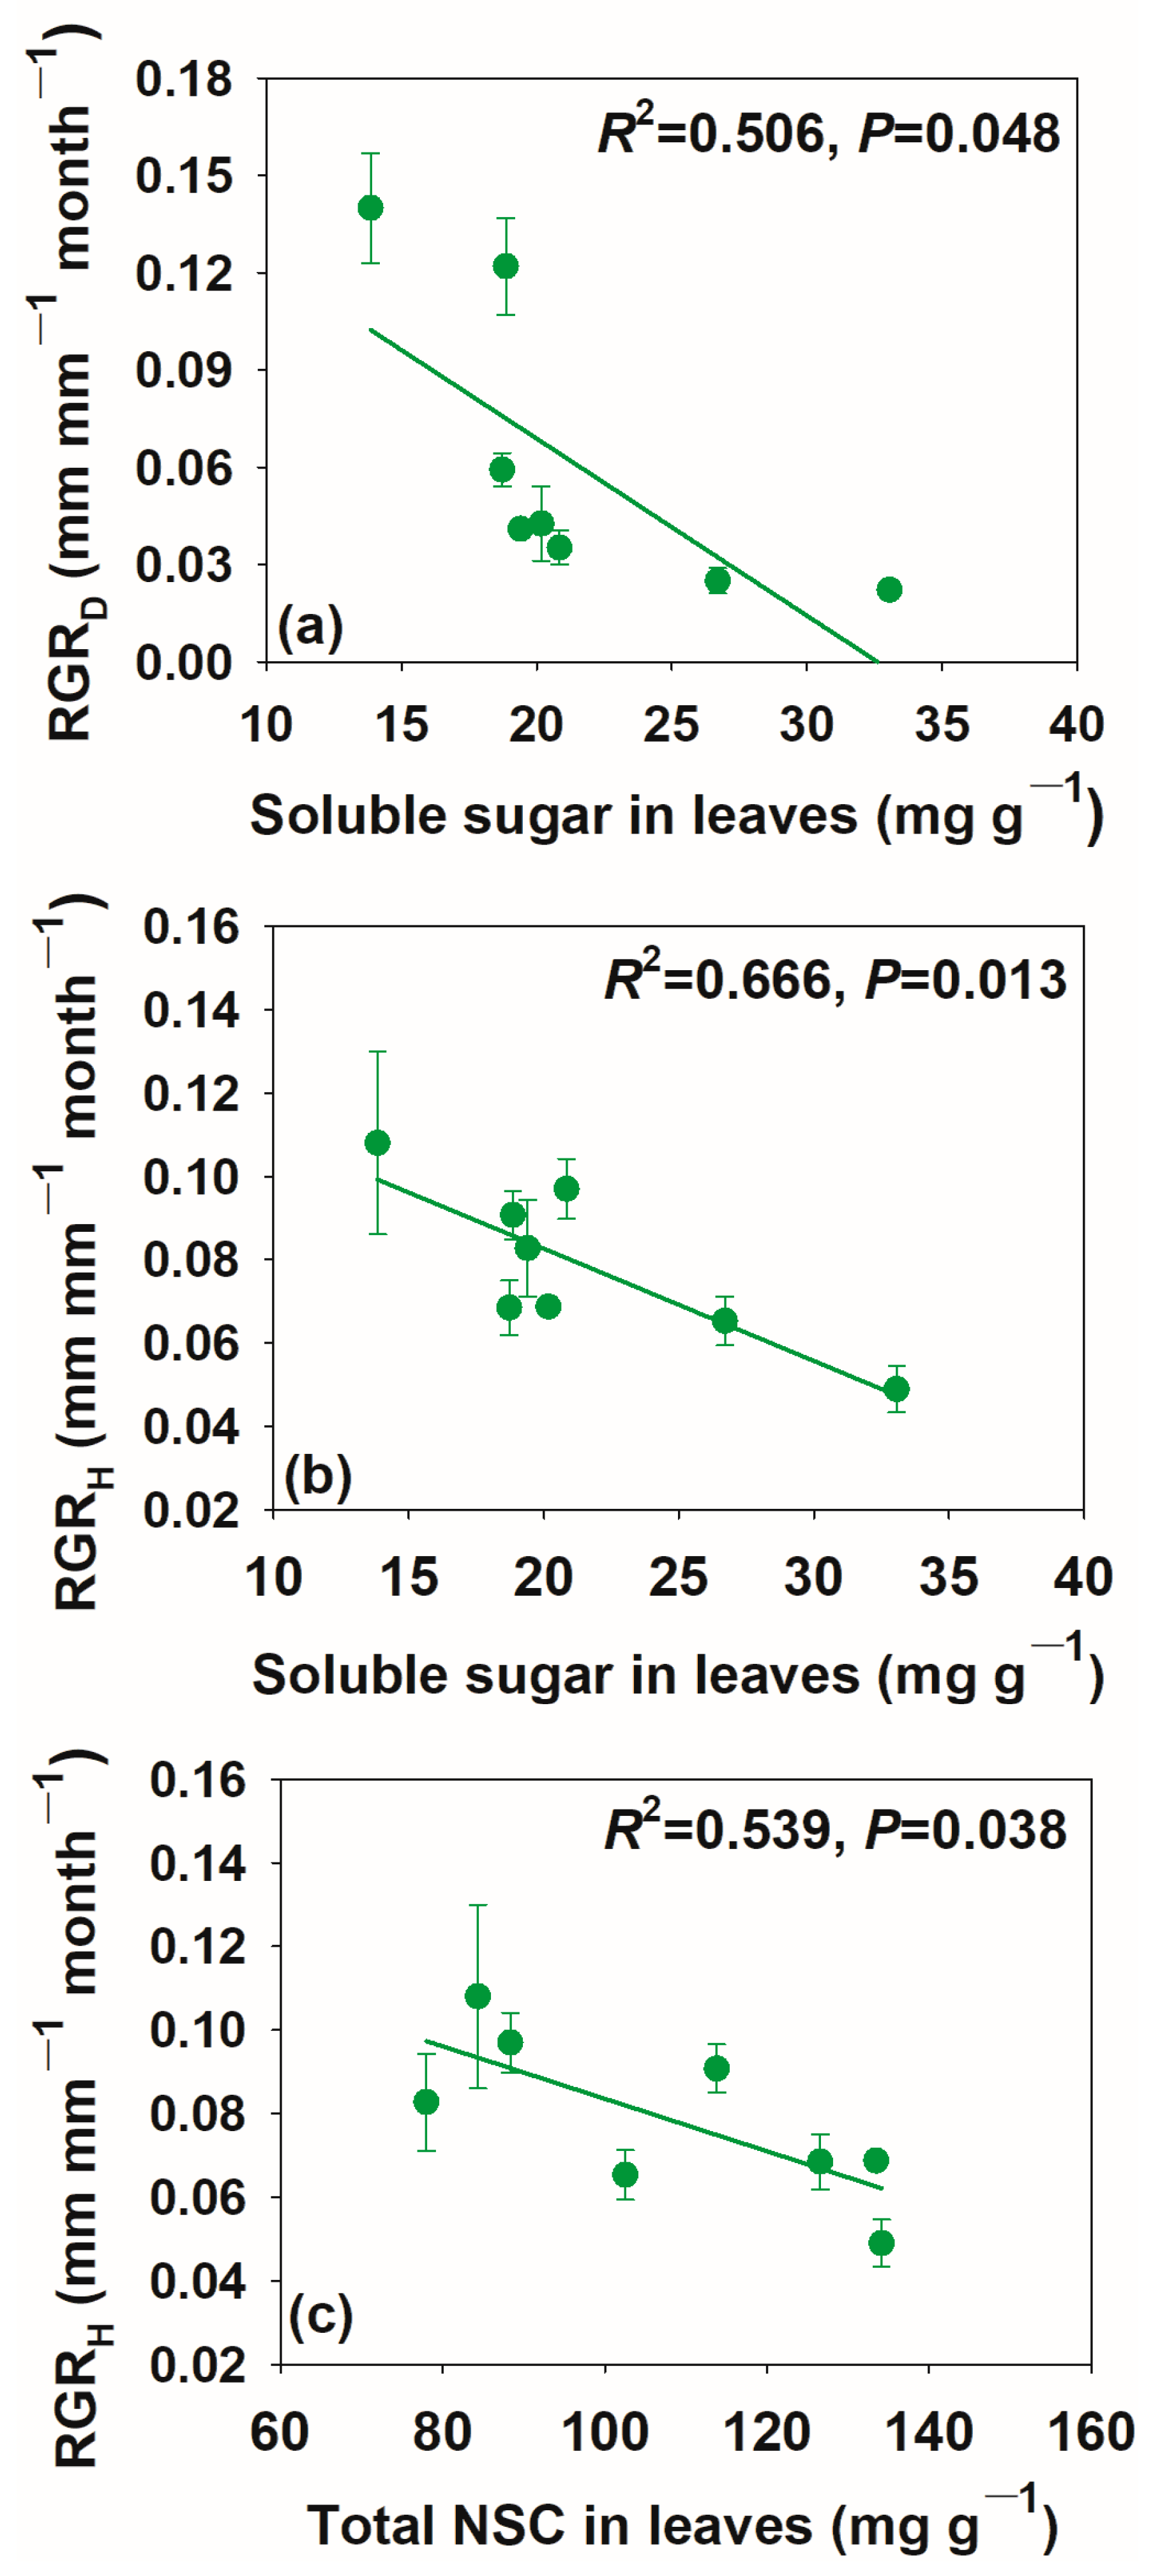
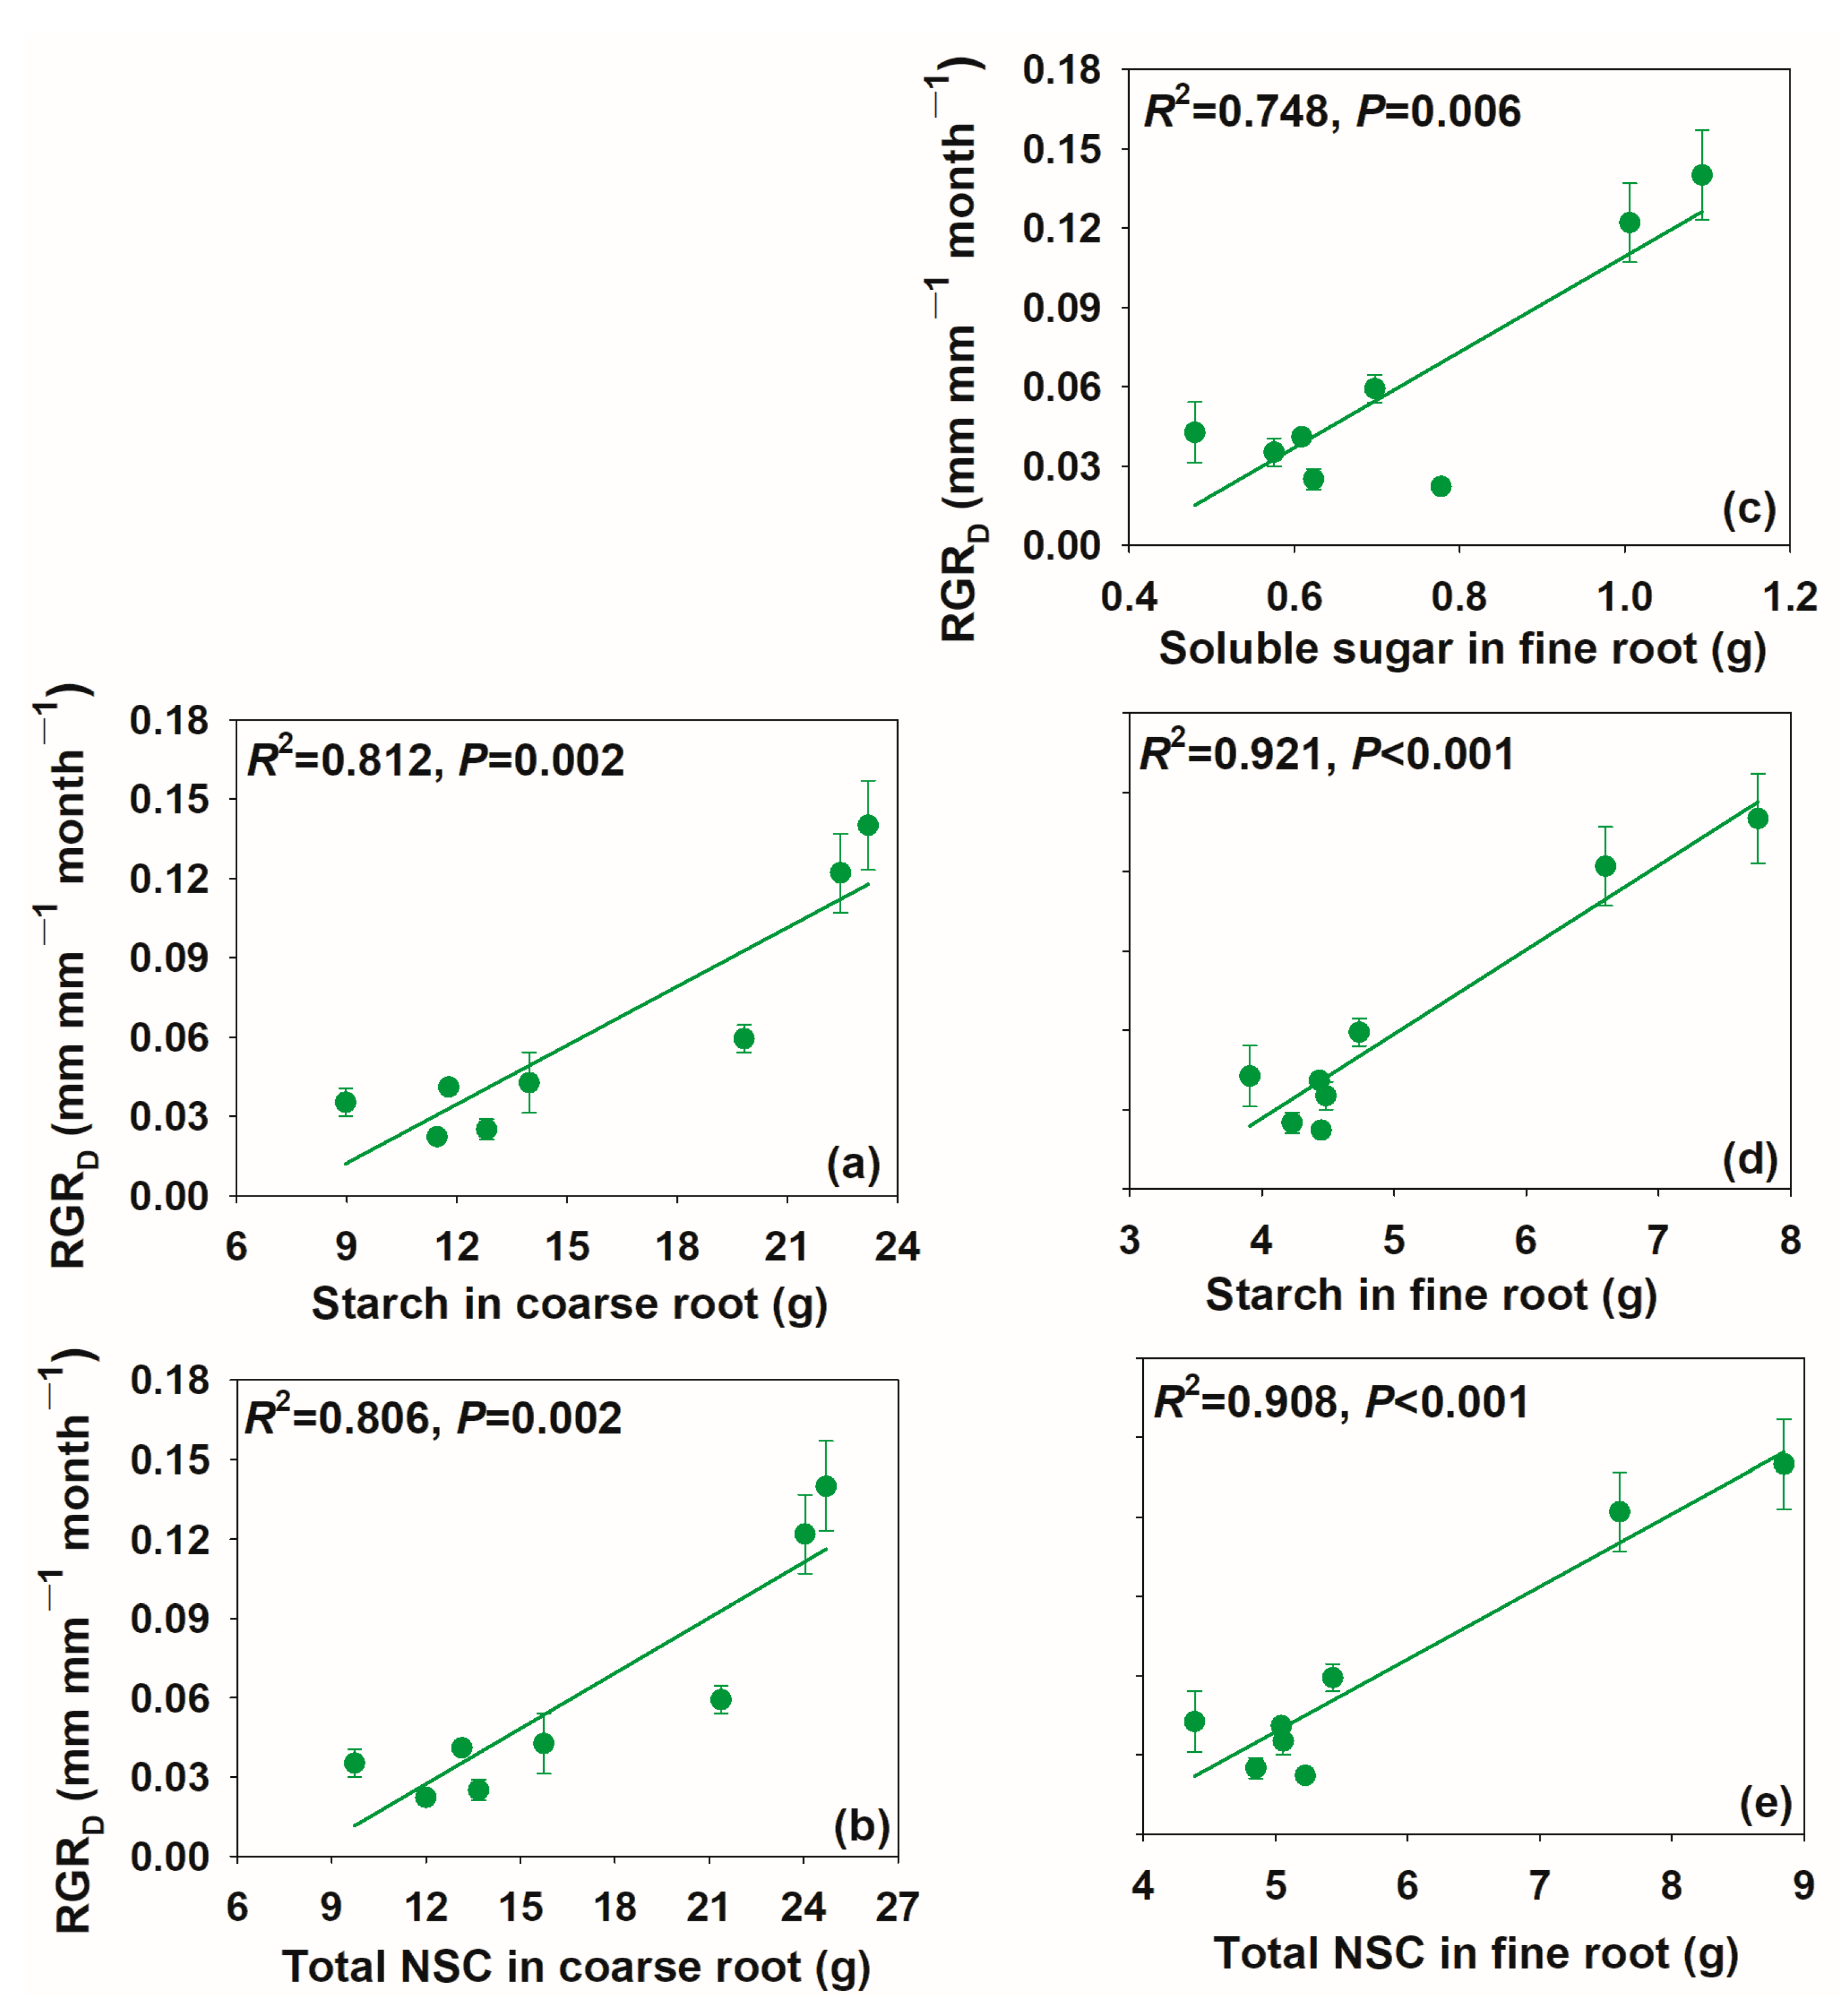
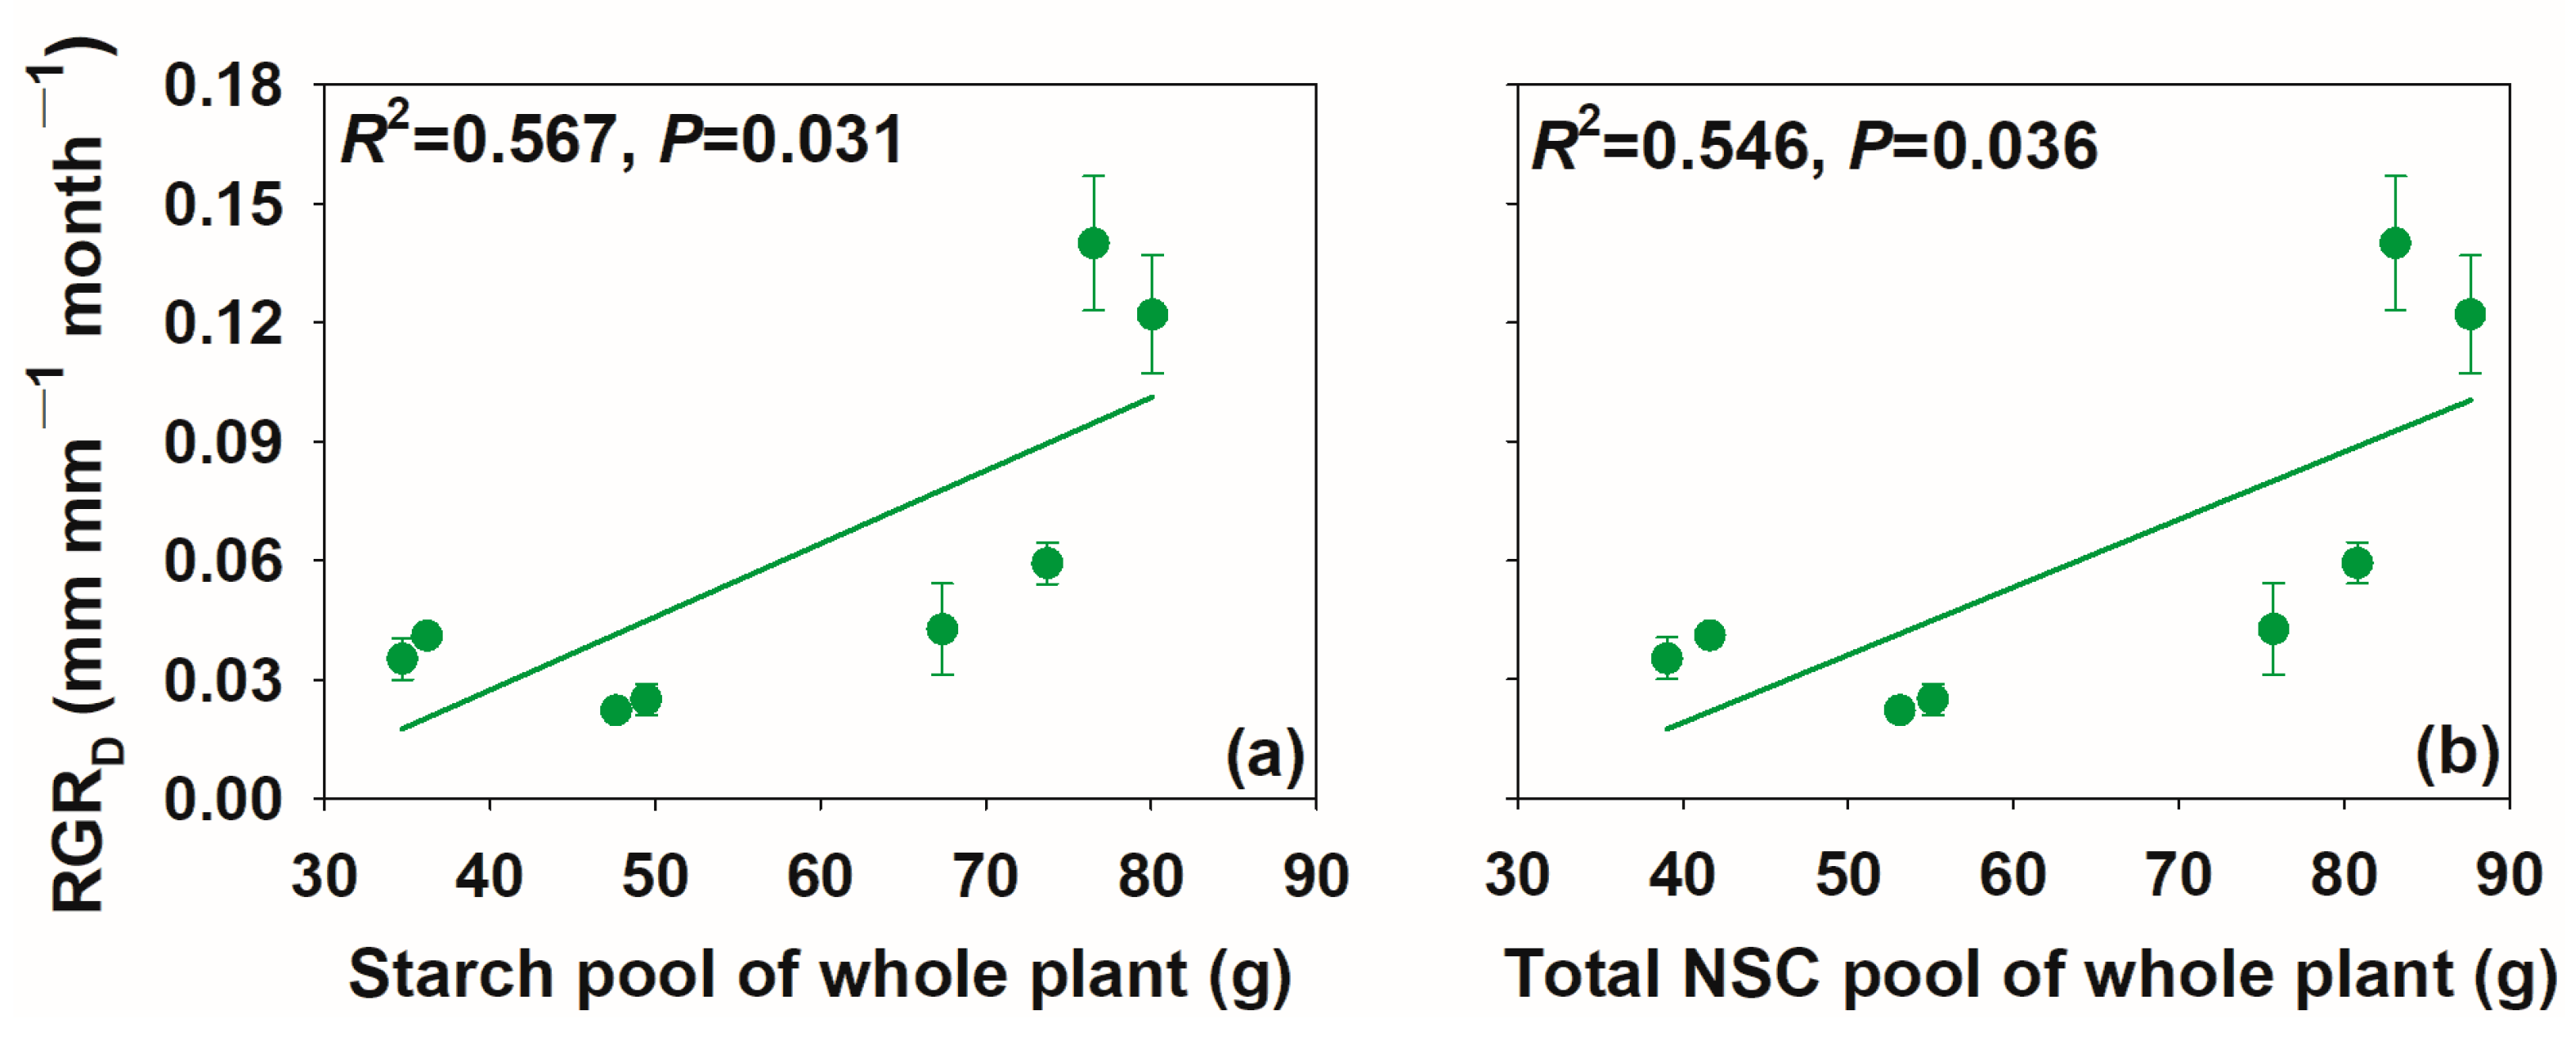
In our study, RGRD significantly declined with the soluble sugar concentration in leaves, and RGRH significantly declined with the soluble sugar and total NSC concentrations in leaves (Figure 8). However, RGRD showed moderately positive correlations with the concentrations of starch and total NSCs in the stem and total NSCs in the coarse root (Figure S4). No significant correlations were found between the growth and NSC pool of above-ground organs (Table S1). In contrast, a significant positive correlation was found between RGRD and the soluble sugar pool of fine root and starch and total NSC pools of coarse roots and fine roots (Figure 9). Similarly, RGRH showed moderately positive correlations with starch and total NSC pools of fine roots (Figure S5). Also, we found RGRD to significantly increase with the starch and total NSC pools of the whole plant (Figure 10).

4. Discussion

4.1. Effects of Salt Stress on Relative Growth Rate, Leaf Mass Area, Midday Leaf Water Potential, Root-to-Shoot Ratio, and Photosynthetic-Related Traits of U. pumila

Salt stress can reduce soil water potential and result in a decrease in stomatal conductance and the photosynthesis rate of plants, inhibiting the water uptake of plants and thus causing a decrease in plant water potential [4,38]. The decrease in plant water potential causes an increase in negative pressure in xylem vessels, and therefore, plants are prone to cavitation embolism. This can restrict the long-distance transport of water in plants, leading to hydraulic imbalance and, thus, affecting the growth and survival of plants [55,56]. Consistent with these studies, we found that salt stress decreased the photosynthesis rate, stomatal conductance, and midday leaf water potential and inhibited the growth of elm. Also, the leaf mass area of elm increased with the degree and duration of salt stress in our study, indicating an increase in leaf carbon investment to resist salt stress. Similarly, previous studies have shown that a high LMA, and its associated traits could be interpreted to allow the sustained adaptation of leaf function under severe dry conditions or at least delay leaf death [57,58,59]. Also, previous studies showed that the leaf mass area and stomatal density tended to increase, while the stomatal length tended to decrease under environmental stress [60,61,62]. Trees could also change their root-to-shoot ratio to adapt to environmental stress. Previous studies showed that the root-to-shoot ratio increased to improve water absorption capacity under drought stress conditions [63,64,65]. However, the root-to-shoot ratio under salt stress could increase [66,67,68] or remain unchanged [69,70]. In our study, the root-to-shoot ratio decreased under salt stress conditions. This may be because, compared to simple osmotic stress, salt stress also disrupts the ion balance of plants, and its impact is more severe than simple low osmotic stress [34]. Also, previous studies showed that salt-tolerant trees can increase their root biomass to store more Na+ and thus reduce the proportion of Na+ transported to the leaves while sensitive trees reduce the uptake of Na+ by restricting the distribution of roots, and most non-halophytic trees are Na+-sensitive trees [71]. Therefore, as a non-halophytic tree species, elm decreased the proportion of root biomass to reduce salt absorption by the roots [72]. Consistent with previous studies, the variations in the photosynthesis rate and stomatal conductance of elm were synchronized, and both decreased rapidly with the salt stress. However, the water use efficiency was insensitive to the salt concentration but sensitive to salt stress duration, which indicated that the variation in water use efficiency was mild and had a lag [73].

4.2. Variation Patterns of Non-Structural Carbohydrate Concentration Sof U. pumila in Response to Salt Stress

The concentrations of starch and total NSCs in all organs increased with salt stress in the early stages of salt stress. Similarly, Hartmann et al. [74] showed that the concentration of NSCs in all tissues in trees under well-water conditions was lower than that under drought-stress conditions. Also, plants in habitats with low temperatures (e.g., high altitude) tended to have higher concentrations of NSCs [75,76,77]. It is possible that the storage of carbohydrates can improve plant stress resistance and survival [37,78,79]. When the carbon supply of plants is insufficient during environmental stress, the stored NSCs can serve as a buffer to temporarily supply the growth and metabolism of plants [80]. Also, the reason why the concentration of NSCs in trees remains unchanged or even increases under stress conditions may be due to the limitation of carbon utilization activities, which occur earlier than carbon supply activities, resulting in less carbon consumption than carbon supply and, thus, leading to the accumulation of NSCs in trees [38,81]. In addition, salt stress inhibited the metabolism of seedlings, resulting in the slowing down of the utilization of soluble sugars and the accumulation of starch across organs, which indicated that the conversion of sugars to other substances was blocked [10]. Meanwhile, accumulated starch could be used as an energy reserve for plants to resist adversity, which is an active adaptation for plants to quickly restore tissue and organ morphogenesis when the environment is suitable in the future [41].
Maintaining higher concentrations of soluble sugar and sucrose under salt stress can make trees have higher osmotic regulation and maintain a relatively high growth capacity [82]. In the early stage of salt stress, the soluble sugar concentration of leaves increased to maintain leaf water potential. Meanwhile, the soluble sugar concentration of fine roots increased with salt concentration, which could reduce the plant water potential and increase the water uptake of roots [83,84]. Moreover, the soluble sugar concentration of the stem also increased with salt concentration. This may be because maintaining a high concentration of soluble sugar can ensure that stems maintain the nutrient transport function and facilitate information transmission between above- and below-ground organs [85]. The soluble sugar concentration in branches and coarse roots decreased with salt concentration in the early stages of stress, which may be due to the fact that their soluble sugars were transported to the leaves or fine roots since the supply of NSCs tended to prioritize the most needed organ [22]. On the other hand, the high salt concentration caused xylem embolism in branches, and the coarse roots and soluble sugars were used to repair the embolism [86,87,88].
In the late stage of salt stress, the concentrations of starch and total NSCs in the leaves still increased, those of branches and stems remained unchanged, while the NSCs of coarse roots and fine roots decreased, indicating that the transportation of NSCs to the root system was hindered. It is possible that plant organs first meet their own growth needs before transporting NSCs to other organs. In addition, the transport of NSCs follows the top-down and nearby principle [10]. Therefore, the stem is more likely to obtain a portion of NSCs for storage than the root far from the carbon source, and this also resulted in an inability to supply limited NSCs to the roots. As a result, the root system could only consume its previously stored NSCs to cope with stress. Except for the decrease in the soluble sugar concentration of fine roots, those in other organs still maintained an increasing trend. This may be because fine roots first suffer from osmotic stress and ion toxicity under salt stress, and therefore, plant damage starts from the root system. This also indicates that the water and nutrient transport function of fine roots is impaired in the late period of salt stress [22,23]; plants would suffer irreversible damage and even die if the salt stress continued to be prolonged. Similarly, Rodríguez-Calcerrada et al. [89] found that the shoot dieback of woody species seedlings started with the massive xylem embolism of the root and variable degree of NSCs depletion under environmental stress.

4.3. Relationships between Relative Growth Rate and Non-Structural Carbohydrate Concentrations and Pool Size

The total concentration of NSCs in the leaves was negatively correlated with the relative growth rate, but there was a marginally significant positive association between the concentrations of NSCs in the stems and roots and the relative growth rate. This indicated that the relationships between the concentration and growth of NSCs amongst organs are different. Meanwhile, we found that the pool size of NSCs had a more significant impact on growth than their concentration. Similarly, Myers & Kitajima [41] found that the total NSC pool size, instead of its concentration, was related to shade tolerance in a neotropical forest. The starch and total NSC pools are significantly positively associated with growth at the whole plant level and in below-ground organs; however, the NSC pools of leaves, branches, and stems are decoupled from growth. This indicated that the NSC pool size of below-ground organs was more closely related to growth than that of above-ground organs, and the growth and survival of plants would be greatly threatened by the decrease in NSC storage in below-ground organs. Similarly, previous studies have shown that NSCs stored in roots could help woody species survive intense drought periods or major disturbances, such as coppicing and fire [90,91]. Considering that the relationship between growth and NSCs varies among different species under other abiotic stress conditions [15,39,42,43], further research is needed to determine whether the relationship between growth and NSC storage under salt stress in this study is widely applicable.

5. Conclusions

This study shows that salt stress can reduce the photosynthesis rate, stomatal conductance, and leaf water potential and inhibit the growth of elm species. However, there were no significant changes in the variations in the water use efficiency due to its lag. In our study, the leaf mass area of elm increased with the degree and duration of salt stress, indicating an increase in leaf carbon investment to resist salt stress. The root-to-shoot ratio decreased under salt stress conditions to reduce salt absorption. The concentrations of starch and total NSCs in all organs increased with salt stress in the early stages of stress to improve the stress resistance and survival of plants. Meanwhile, the soluble sugar concentration of fine roots increased with the salt concentration to enhance the water uptake of the roots. The transport of NSCs to the roots was blocked in the late stages of stress and, thus, resulted in a decrease in NSC concentrations in the roots, which would restrict root growth and water uptake. The relationships between NSC concentrations and growth in different organs were contrasted. Meanwhile, the pool size of NSCs had a more significant impact on growth than their concentration in our study. Moreover, the pool size of NSCs in below-ground organs was more closely related to growth than those of above-ground organs. Plant secondary compounds (e.g., phenolics and tannins), which we did not measure, could also be allocated from net photosynthetic production and play important roles in enhancing plant tolerance to herbivory [92,93,94]. In future research, simultaneous measurements of defense (phenolics and tannins), carbon storage (NSCs), and growth should be conducted to investigate the relationship between these three components.

Supplementary Materials

The following supporting information can be downloaded at https://www.mdpi.com/article/10.3390/f15061004/s1, Figure S1: Leaf phenotype under different salt concentrations during the early (a–d) and late stages (e–h); Figure S2: Schematic diagram of variations in each indicator under the early and late stages of salt stress; Figure S3: Relationship between relative growth rate of basal diameter (RGRD) and relative growth rate of height (RGRH) (Pearson’s correlation); Figure S4: Relationship between relative growth rate of basal diameter (RGRD) and starch concentration in stem (a), total NSC concentration in stem (b), and total NSC concentration in coarse roots (c) (Pearson’s correlation); Figure S5: Relationship between relative growth rate of height (RGRH) and starch (a) and total NSC (b) pools in fine roots (Pearson’s correlation); Table S1: Relationships between relative growth rate and NSC pools of aboveground organs (Pearson’s correlation).

Author Contributions

P.J.: Methodology, Software, Funding acquisition, Writing—original draft, Writing—Reviewing and Editing. C.Y.: Investigation, Software. X.Z.: Methodology, Writing—Reviewing and Editing. B.T.: Writing—Reviewing and Editing. X.X.: Writing—Reviewing and Editing. X.L.: Investigation. S.F.: Methodology, Funding acquisition, Writing—Reviewing and Editing. All authors have read and agreed to the published version of the manuscript.

Funding

This research was funded by the Shandong Provincial Agricultural Elite Varieties Project (2019LZGC018), the Survey of Herbaceous Plant Germplasm Resources of Shandong Province [[2021]01], and the Shandong Provincial Natural Science Foundation, China (ZR2021QC051).

Data Availability Statement

The raw data supporting the conclusions of this article will be made available by the authors on request.

Conflicts of Interest

The authors declare no conflicts of interest.

References

  1. Evelin, H.; Kapoor, R.; Giri, B. Arbuscular mycorrhizal fungi in alleviation of salt stress: A review. Ann. Bot. 2009, 104, 1263–1280. [Google Scholar] [CrossRef] [PubMed]
  2. Akramkhanov, A.; Martius, C.; Park, S.J.; Hendrickx, J.M.H. Environmental factors of spatial distribution of soil salinity on flat irrigated terrain. Geoderma 2011, 163, 55–62. [Google Scholar] [CrossRef]
  3. Cabot, C.; Sibole, J.V.; Barceló, J.; Poschenrieder, C. Lessons from crop plants struggling with salinity. Plant Sci. 2014, 226, 2–13. [Google Scholar] [CrossRef] [PubMed]
  4. Munns, R. Comparative physiology of salt and water stress. Plant Cell Environ. 2002, 25, 239–250. [Google Scholar] [CrossRef] [PubMed]
  5. Parida, A.K.; Das, A.B. Salt tolerance and salinity effects on plants: A review. Ecotoxicol. Environ. Safe 2005, 60, 324–349. [Google Scholar] [CrossRef] [PubMed]
  6. Polle, A.; Chen, S. On the salty side of life: Molecular, physiological and anatomical adaptation and acclimation of trees to extreme habitats. Plant Cell Environ. 2015, 38, 1794–1816. [Google Scholar] [CrossRef] [PubMed]
  7. Wang, B.; Zhang, J.; Pei, D.; Yu, L. Combined effects of water stress and salinity on growth, physiological, and biochemical traits in two walnut genotypes. Physiol. Plant. 2021, 172, 176–187. [Google Scholar] [CrossRef] [PubMed]
  8. Sun, J.; Xia, J.; Shao, P.; Ma, J.; Gao, F.; Lang, Y.; Xing, X.; Dong, M.; Li, C. Response of the fine root morphological and chemical traits of Tamarix chinensis to water and salt changes in coastal wetlands of the Yellow River Delta. Front. Plant Sci. 2022, 13, 952830. [Google Scholar] [CrossRef]
  9. Yu, L.; Tang, S.; Guo, C.; Korpelainen, H.; Li, C. Differences in ecophysiological responses of Populus euphratica females and males exposed to salinity and alkali stress. Plant Physiol. Biochem. 2023, 198, 107707. [Google Scholar] [CrossRef]
  10. Dietze, M.C.; Sala, A.; Carbone, M.S.; Czimczik, C.I.; Mantooth, J.A.; Richardson, A.D.; Vargas, R. Nonstructural carbon in woody plants. Annu. Rev. Plant Biol. 2014, 65, 667–687. [Google Scholar] [CrossRef]
  11. Martínez-Vilalta, J.; Sala, A.; Asensio, M.D.; Galiano, L.; Hoch, G.; Palacio, S.; Piper, F.I.; Lloret, F. Dynamics of non-structural carbohydrates in terrestrial plants: A global synthesis. Ecol. Monogr. 2016, 86, 495–516. [Google Scholar] [CrossRef]
  12. Sala, A.; Piper, F.; Hoch, G. Physiological mechanisms of drought-induced tree mortality are far from being resolved. New Phytol. 2010, 186, 274–281. [Google Scholar] [CrossRef] [PubMed]
  13. Hesse, B.D.; Goisser, M.; Hartmann, H.; Grams, T.E.E. Repeated summer drought delays sugar export from the leaf and impairs phloem transport in mature beech. Tree Physiol. 2019, 39, 192–200. [Google Scholar] [CrossRef] [PubMed]
  14. Würth, M.K.R.; Peláez-Riedl, S.; Wright, S.J.; Körner, C.; 2005. Non-structural carbohydrate pools in a tropical forest. Oecologia 2005, 143, 11–24. [Google Scholar] [CrossRef] [PubMed]
  15. Palacio, S.; Hoch, G.; Sala, A.; Korner, C.; Millard, P. Does carbon storage limit tree growth? New Phytol. 2014, 201, 1096–1100. [Google Scholar] [CrossRef] [PubMed]
  16. Du, Y.; Lu, R.; Xia, J. Impacts of global environmental change drivers on non-structural carbohydrates in terrestrial plants. Funct. Ecol. 2020, 34, 1525–1536. [Google Scholar] [CrossRef]
  17. McDowell, N.G.; Pockman, W.T.; Allen, C.D.; Breshears, D.D.; Cobb, N.; Kolb, T.; Plaut, J.; Sperry, J.; West, A.; Williams, D.G.; et al. Mechanisms of plant survival and mortality during drought: Why do some plants survive while others succumb to drought? New Phytol. 2008, 178, 719–739. [Google Scholar] [CrossRef] [PubMed]
  18. Hartmann, H.; Moura, C.F.; Anderegg, W.R.L.; Ruehr, N.K.; Salmon, Y.; Allen, C.D.; Arndt, S.K.; Breshears, D.D.; Davi, H.; Galbraith, D.; et al. Research frontiers for improving our understanding of drought-induced tree and forest mortality. New Phytol. 2018, 218, 15–28. [Google Scholar] [CrossRef] [PubMed]
  19. Hoch, G.; Richter, A.; Korner, C. Non-structural carbon compounds in temperate forest trees. Plant Cell Environ. 2003, 26, 1067–1081. [Google Scholar] [CrossRef]
  20. Furze, M.E.; Wainwright, D.K.; Huggett, B.A.; Knipfer, T.; McElrone, A.J.; Brodersen, C.R. Ecologically driven selection of nonstructural carbohydrate storage in oak trees. New Phytol. 2021, 232, 567–578. [Google Scholar] [CrossRef]
  21. Sala, A.; Mencuccini, M. Ecosystem science: Plump trees win under drought. Nat. Clim. Chang. 2014, 4, 666–667. [Google Scholar] [CrossRef]
  22. Hartmann, H.; Ziegler, W.; Trumbore, S. Lethal drought leads to reduction in nonstructural carbohydrates in Norway spruce tree roots but not in the canopy. Funct. Ecol. 2013, 27, 413–427. [Google Scholar] [CrossRef]
  23. Li, W.; Hartmann, H.; Adams, H.D.; Zhang, H.; Jin, C.; Zhao, C.; Guan, D.; Wang, A.; Yuan, F.; Wu, J. The sweet side of global change-dynamic responses of non-structural carbohydrates to drought, elevated CO2 and nitrogen fertilization in tree species. Tree Physiol. 2018, 38, 1706–1723. [Google Scholar] [CrossRef] [PubMed]
  24. Galvez, D.A.; Landhausser, S.M.; Tyree, M.T. Root carbon reserve dynamics in aspen seedlings: Does simulated drought induce reserve limitation? Tree Physiol. 2011, 31, 250–257. [Google Scholar] [CrossRef] [PubMed]
  25. Hagedorn, F.; Joseph, J.; Peter, M.; Luster, J.; Pritsch, K.; Geppert, U.; Kerner, R.; Molinier, V.; Egli, S.; Schaub, M.; et al. Recovery of trees from drought depends on belowground sink control. Nat. Plants 2016, 2, 16111. [Google Scholar] [CrossRef] [PubMed]
  26. Zhang, T.; Cao, Y.; Chen, Y.; Liu, G. Non-structural carbohydrate dynamics in Robinia pseudoacacia saplings under three levels of continuous drought stress. Trees 2015, 29, 1837–1849. [Google Scholar] [CrossRef]
  27. Braga, N.D.; Vitória, A.P.; Souza, G.M.; Barros, C.F.; Freitas, L. Weak relationships between leaf phenology and isohydric and anisohydric behavior in lowland wet tropical forest trees. Biotropica 2016, 48, 453–464. [Google Scholar] [CrossRef]
  28. Körner, C. Carbon limitation in trees. J. Ecol. 2003, 91, 4–17. [Google Scholar] [CrossRef]
  29. McDowell, N.G.; Beerling, D.J.; Breshears, D.D.; Fisher, R.A.; Raffa, K.F.; Stitt, M. The interdependence of mechanisms underlying climate-driven vegetation mortality. Trends Ecol. Evol. 2011, 26, 523–532. [Google Scholar] [CrossRef]
  30. Hoch, G. Carbon reserves as indicators for carbon limitation in trees. In Progress in Botany Progress in Botany (Genetics—Physiology—Systematics—Ecology); Lüttge, U., Beyschlag, W., Eds.; Springer: Cham, Switzerland; Berlin, Germany, 2015; pp. 321–346. [Google Scholar]
  31. He, W.; Liu, H.; Qi, Y.; Liu, F.; Zhu, X. Patterns in nonstructural carbohydrate contents at the tree organ level in response to drought duration. Glob. Chang. Biol. 2020, 26, 3627–3638. [Google Scholar] [CrossRef]
  32. Munns, R.; Tester, M. Mechanisms of salinity tolerance. Ann. Rev. Plant Biol. 2008, 59, 651–681. [Google Scholar] [CrossRef] [PubMed]
  33. Chaves, M.M.; Flexas, J.; Pinheiro, C. Photosynthesis under drought and salt stress: Regulation mechanisms from whole plant to cell. Ann. Bot. 2009, 103, 551–560. [Google Scholar] [CrossRef] [PubMed]
  34. Amtmann, A.; Armengaud, P.; Volkov, V. Potassium Nutrition and Salt Stress; Blacdkwell Publishing: Oxford, UK, 2004. [Google Scholar]
  35. Sala, A.; Woodruff, D.R.; Meinzer, F.C. Carbon dynamics in trees: Feast or famine? Tree Physiol. 2012, 32, 764–775. [Google Scholar] [CrossRef] [PubMed]
  36. Piper, F.I.; Fajardo, A. Carbon dynamics of Acer pseudoplatanus seedlings under drought and complete darkness. Tree Physiol. 2016, 36, 1400–1408. [Google Scholar] [CrossRef] [PubMed]
  37. Piper, F.I.; Moreno-Meynard, P.; Fajardo, A. Nonstructural carbohydrates predict survival in saplings of temperate trees under carbon stress. Funct. Ecol. 2022, 36, 2806–2818. [Google Scholar] [CrossRef]
  38. McDowell, N.G. Mechanisms linking drought, hydraulics, carbon metabolism, and vegetation mortality. Plant Physiol. 2011, 155, 1051–1059. [Google Scholar] [CrossRef] [PubMed]
  39. Wiley, E.; Helliker, B. A re-evaluation of carbon storage in trees lends greater support for carbon limitation to growth. New Phytol. 2012, 195, 285–289. [Google Scholar] [CrossRef] [PubMed]
  40. Reyes-Bahamonde, C.; Piper, F.I.; Cavieres, L.A. Carbon allocation to growth and storage depends on elevation provenance in an herbaceous alpine plant of Mediterranean climate. Oecologia 2021, 195, 299–312. [Google Scholar] [CrossRef] [PubMed]
  41. Myers, J.A.; Kitajima, K. Carbohydrate storage enhances seedling shade and stress tolerance in a neotropical forest. J. Ecol. 2007, 95, 383–395. [Google Scholar] [CrossRef]
  42. Poorter, L.; Kitajima, K. Carbohydrate storage and light requirements of tropical moist and dry forest tree species. Ecology 2007, 88, 1000–1011. [Google Scholar] [CrossRef]
  43. Piper, F.I. Decoupling between growth rate and storage remobilization in broadleaf temperate tree species. Funct. Ecol. 2020, 34, 1180–1192. [Google Scholar] [CrossRef]
  44. Genet, H.; Breda, N.; Dufrene, E. Age-related variation in carbon allocation at tree and stand scales in beech (Fagus sylvatica L.) and sessile oak (Quercus petraea (Matt.) Liebl.) using a chronosequence approach. Tree Physiol. 2010, 30, 177–192. [Google Scholar] [CrossRef]
  45. Jiang, D.; Tang, Y.; Busso, C.A. Effects of vegetation cover on recruitment of Ulmus pumila L. in Horqin Sandy land, northeastern China. J. Arid Land 2014, 6, 343–351. [Google Scholar] [CrossRef]
  46. Amorós, M.D.; Mauri, P.V.; Curt, M.D. The influence of tree management practices on phenological growth stages of Ulmus pumila L. (Siberian elm). Ann. Appl. Biol. 2021, 179, 259–272. [Google Scholar] [CrossRef]
  47. Guo, J.; Xu, X.; Zhang, R.; Chen, X.; Xing, Y.; Li, B.; Liu, C.; Zhou, Y. Effect of short-term combined alkaline stress on antioxidant metabolism, photosynthesis, and leaf-air temperature difference in sorghum. Photosynthetica 2022, 60, 200–211. [Google Scholar] [CrossRef]
  48. Xu, Z.; Wang, J.; Zhen, W.; Sun, T.; Hu, X. Abscisic acid alleviates harmful effect of saline-alkaline stress on tomato seedlings. Plant Physiol. Biochem. 2022, 175, 58–67. [Google Scholar] [CrossRef] [PubMed]
  49. Zuo, L.; Zhang, S.; Zhang, J.; Liu, Y.; Yu, X.; Yang, M.; Wang, J. Primer development and functional classification of EST-SSR markers in Ulmus species. Tree Genet. Genomes 2020, 16, 74. [Google Scholar] [CrossRef]
  50. Qi, X.; Chen, L.; Hu, Z.; Shen, W.; Xu, H.; Ma, L.; Wang, G.; Jing, Y.; Wang, X.; Zhang, B.; et al. Cytology, transcriptomics, and mass spectrometry imaging reveal changes in late-maturation elm (Ulmus pumila) seeds. J. Plant Physiol. 2022, 271, 153639. [Google Scholar] [CrossRef]
  51. Zhang, L.; Xie, S.; Yang, C.; Cao, D.; Fan, S.; Zhang, X. Comparative transcriptome analysis reveals candidate genes and pathways for potential branch growth in elm (Ulmus pumila) cultivars. Biology 2022, 11, 711. [Google Scholar] [CrossRef]
  52. Carlson, C.A.; Burkhart, H.E.; Allen, H.L.; Fox, T.R. Absolute and relative changes in tree growth rates and changes to the stand diameter distribution of Pinus taeda as a result of midrotation fertilizer applications. Can. J. For. Res. 2008, 38, 2063–2071. [Google Scholar] [CrossRef]
  53. Seibt, U.; Rajabi, A.; Griffiths, H.; Berry, J.A. Carbon isotopes and water use efficiency: Sense and sensitivity. Oecologia 2008, 155, 441–454. [Google Scholar] [CrossRef]
  54. Furze, M.E.; Huggett, B.A.; Aubrecht, D.M.; Stolz, C.D.; Carbone, M.S.; Richardson, A.D. Whole-tree nonstructural carbohydrate storage and seasonal dynamics in five temperate species. New Phytol. 2019, 221, 1466–1477. [Google Scholar] [CrossRef] [PubMed]
  55. Ladjal, M.; Huc, R.; Ducrey, M. Drought effects on hydraulic conductivity and xylem vulnerability to embolism in diverse species and provenances of Mediterranean cedars. Tree Physiol. 2005, 25, 1109–1117. [Google Scholar] [CrossRef] [PubMed]
  56. Nardini, A.; Battistuzzo, M.; Savi, T. Shoot desiccation and hydraulic failure in temperate woody angiosperms during an extreme summer drought. New Phytol. 2013, 200, 322–329. [Google Scholar] [CrossRef] [PubMed]
  57. Wright, I.J.; Reich, P.B.; Cornelissen, J.H.C.; Falster, D.S.; Groom, P.K.; Hikosaka, K.; Lee, W.; Lusk, C.H.; Niinemets, U.; Oleksyn, J. Modulation of leaf economic traits and trait relationships by climate. Glob. Ecol. Biogeogr. 2005, 14, 411–421. [Google Scholar] [CrossRef]
  58. Markesteijn, L.; Poorter, L.; Paz, H.; Sack, L.; Paz, H.; Bongers, L. Ecological differentiation in xylem cavitation resistance is associated with stem and leaf structural traits. Plant Cell Environ. 2011, 34, 137–148. [Google Scholar] [CrossRef]
  59. Reich, P.B. The world-wide ‘fast-slow’ plant economics spectrum: A traits manifesto. J. Ecol. 2014, 102, 275–301. [Google Scholar] [CrossRef]
  60. Niinemets, Ü. Does the touch of cold make evergreen leaves tougher? Tree Physiol. 2016, 36, 267–272. [Google Scholar] [CrossRef] [PubMed]
  61. Sancho-Knapik, D.; Escudero, A.; Mediavilla, S.; Scoffoni, C.; Zailaa, J.; Cavender-Bares, J.; Alvarez-Arenas, T.G.; Molins, A.; Alonso-Forn, D.; Ferrio, J.P.; et al. Deciduous and evergreen oaks show contrasting adaptive responses in leaf mass per area across environments. New Phytol. 2021, 230, 521–534. [Google Scholar] [CrossRef]
  62. Yu, L.; Huang, Z.; Li, Z.; Korpelainen, H.; Li, C. Sex-specific strategies of nutrient resorption associated with leaf economics in Populus euphratica. J. Ecol. 2022, 110, 2062–2073. [Google Scholar] [CrossRef]
  63. Moser, B.; Kipfer, T.; Richter, S.; Egli, S.; Wohlgemuth, T. Drought resistance of Pinus sylvestris seedlings conferred by plastic root architecture rather than ectomycorrhizal colonization. Ann. For. Sci. 2015, 72, 303–309. [Google Scholar] [CrossRef]
  64. Zhou, G.; Zhou, X.; He, Y.; Shao, J.; Hu, Z.; Liu, R.; Zhou, H.; Hosseinibai, S. Grazing intensity significantly affects belowground carbon and nitrogen cycling in grassland ecosystems: A meta-analysis. Glob. Chang. Biol. 2017, 23, 1167–1179. [Google Scholar] [CrossRef] [PubMed]
  65. Zhou, G.; Zhou, X.; Nie, Y.; Bai, S.; Zhou, L.; Shao, J.; Cheng, W.; Wang, J.; Hu, F.; Fu, Y. Drought-induced changes in root biomass largely result from altered root morphological traits: Evidence from a synthesis of global field trials. Plant Cell Environ. 2018, 41, 2589–2599. [Google Scholar] [CrossRef] [PubMed]
  66. Cimato, A.; Castelli, S.; Tattini, M.; Traversi, M.L. An ecophysiological analysis of salinity tolerance in olive. Environ. Exp. Bot. 2010, 68, 214–221. [Google Scholar] [CrossRef]
  67. Singh, J.; Sastry, E.V.D.; Singh, V. Effect of salinity on tomato (Lycopersicon esculentum Mill.) during seed germination stage. Physiol. Mol. Biol. Pla. 2012, 18, 45–50. [Google Scholar] [CrossRef] [PubMed]
  68. Li, J.; Liu, H.; Yang, M.; Du, L. No evidence for local adaptation to salt stress in the existing populations of invasive Solidago canadensis in China. PLoS ONE 2012, 12, e0175252. [Google Scholar] [CrossRef] [PubMed]
  69. Dasgan, H.Y.; Aktas, H.; Abak, K.; Cakmak, I. Determination of screening techniques to salinity tolerance in tomatoes and investigation of genotype responses. Plant Sci. 2002, 163, 695–703. [Google Scholar] [CrossRef]
  70. Li, X.; Wan, S.; Kang, Y.; Chen, X.; Chu, L. Chinese rose (Rosa chinensis) growth and ion accumulation under irrigation with waters of different salt contents. Agric. Water Manag. 2016, 163, 180–189. [Google Scholar] [CrossRef]
  71. Koyro, H.W. Effect of salinity on growth, photosynthesis, water relations and solute composition of the potential cash crop halophyte Plantago coronopus L. Environ. Exp. Bot. 2006, 56, 136–146. [Google Scholar] [CrossRef]
  72. Jacqueline, S.; Kay, M.; Paul, C.E.; Boon, P.I. Interactive effects of salinity and water depth on the growth of Melaleuca ericifolia Sm. (Swamp paperbark) seedlings. Aquat. Bot. 2006, 86, 213–222. [Google Scholar] [CrossRef]
  73. Ma, Y.; Su, B.; Han, Y.; Wu, X.; Zhou, W.; Wang, Q.; Zhou, L.; Yu, D. Response of photosynthetic characteristics and non-structural carbohydrate accumulation of Betula ermanii seedlings to drought stress. Chin. J. Appl. Ecol. 2021, 32, 513–520, (In Chinese with English Abstract). [Google Scholar] [CrossRef]
  74. Hartmann, H.; Ziegler, W.; Kolle, O.; Trumbore, S. Thirst beats hunger-declining hydration during drought prevents carbon starvation in Norway spruce saplings. New Phytol. 2013, 200, 340–349. [Google Scholar] [CrossRef] [PubMed]
  75. Sala, A.; Hoch, G. Height-related growth declines in ponderosa pine are not due to carbon limitation. Plant Cell Environ. 2009, 32, 22–30. [Google Scholar] [CrossRef] [PubMed]
  76. Fajardo, A.; Piper, F.I. An experimental approach to explain the southern Andes elevational treeline. Am. J. Bot. 2014, 101, 788–795. [Google Scholar] [CrossRef] [PubMed]
  77. Zhou, Q.; Shi, H.; He, R.; Liu, H.; Zhu, W.; Yu, D.; Zhang, Q.; Dang, H. Prioritized carbon allocation to storage of different functional types of species at the upper range limits is driven by different environmental drivers. Sci. Total Environ. 2021, 773, 145581. [Google Scholar] [CrossRef] [PubMed]
  78. Hartmann, H.; Trumbore, S. Understanding the roles of nonstructural carbohydrates in forest trees-from what we can measure to what we want to know. New Phytol. 2016, 211, 386–403. [Google Scholar] [CrossRef]
  79. Guo, Q.; Wu, X.; Korpelainen, H.; Li, C. Stronger intraspecific competition aggravates negative effects of drought on the growth of Cunninghamia lanceolata. Environ. Exp. Bot. 2020, 175, 104042. [Google Scholar] [CrossRef]
  80. O’Brien, M.J.; Leuzinger, S.; Philipson, C.D.; Tay, J.; Hector, A. Drought survival of tropical tree seedlings enhanced by nonstructural carbohydrate levels. Nat. Clim. Chang. 2014, 4, 710–714. [Google Scholar] [CrossRef]
  81. Wang, Z.; Wang, C. Mechanisms of carbon source sink limitations to tree growth. Chin. J. Plant Ecol. 2019, 43, 1036–1047, (In Chinese with English Abstract). [Google Scholar] [CrossRef]
  82. Lin, X.; Liu, L.; Dong, T.; Fang, Q.; Guo, Q. Effects of non-structural carbohydrate and nitrogen allocation on the ability of Populus deltoides and P. cathayana to resist soil salinity stress. Chin. J. Plant Ecol. 2021, 45, 961–971, (In Chinese with English Abstract). [Google Scholar] [CrossRef]
  83. Silva, E.N.; Ferrira-Silva, S.L.; Viegas, R.A.; Viegas, R.A.; Silveira, J.A.G. The role of organic and inorganic solutes in the osmotic adjustment of drought-stressed Jatropha curcas plants. Environ. Exp. Bot. 2010, 69, 279–285. [Google Scholar] [CrossRef]
  84. Brunner, I.; Herzog, C.; Dawes, M.A.; Arend, M.; Sperisen, C. How tree roots respond to drought. Front. Plant Sci. 2015, 6, 547. [Google Scholar] [CrossRef]
  85. Smeekens, S. Sugar-induced signal transduction in plants. Annu. Rev. Plant Biol. 2000, 51, 49–81. [Google Scholar] [CrossRef] [PubMed]
  86. Nardini, A.; Casolo, V.; Dal Borgo, A.; Savi, T.; Stenni, B.; Bertoncin, P.; Zini, L.; McDowell, N.G. Rooting depth, water relations and non-structural carbohydrate dynamics in three woody angiosperms differentially affected by an extreme summer drought. Plant Cell Environ. 2015, 39, 618–627. [Google Scholar] [CrossRef] [PubMed]
  87. Trifilò, P.; Kiorapostolou, N.; Petruzzellis, F.; Vitti, S.; Petit, G.; Lo Gullo, M.A.; Nardini, A.; Casolo, V. Hydraulic recovery from xylem embolism in excised branches of twelve woody species: Relationships with parenchyma cells and non-structural carbohydrates. Plant Physiol. Bioch. 2019, 139, 513–520. [Google Scholar] [CrossRef]
  88. Tomasella, M.; Petrussa, E.; Petruzzellis, F.; Nardini, A.; Casolo, V. The possible role of non-structural carbohydrates in the regulation of tree hydraulics. Int. J. Mol. Sci. 2020, 21, 144. [Google Scholar] [CrossRef] [PubMed]
  89. Rodríguez-Calcerrada, J.; Li, M.; López, R.; Cano, F.J.; Oleksyn, J.; Atkin, O.K.; Pita, P.; Aranda, I.; Gil, L. Drought-induced shoot dieback starts with massive root xylem embolism and variable depletion of nonstructural carbohydrates in seedlings of two tree species. New Phytol. 2017, 213, 597–610. [Google Scholar] [CrossRef] [PubMed]
  90. Shibata, R.; Kurokawa, H.; Shibata, M.; Tanaka, H.; Iida, S.; Masaki, T.; Nakashizuka, T. Relationships between resprouting ability, species traits and resource allocation patterns in woody species in a temperate forest. Funct. Ecol. 2016, 30, 1205–1215. [Google Scholar] [CrossRef]
  91. Santos, M.; Barros, V.; Lima, L.; Frosi, G.; Santos, M.G. Whole plant water status and non-structural carbohydrates under progressive drought in a Caatinga deciduous woody species. Trees 2021, 35, 1257–1266. [Google Scholar] [CrossRef]
  92. Imaji, A.; Seiwa, K. Carbon allocation to defense, storage, and growth in seedlings of two temperate broad-leaved tree species. Oecologia 2010, 162, 273–281. [Google Scholar] [CrossRef]
  93. Wyka, T.P.; Karolewski, P.; Żytkowiak, R.; Chmielarz, P.; Oleksyn, J. Whole-plant allocation to storage and defense in juveniles of related evergreen and deciduous shrub species. Tree Physiol. 2016, 36, 536–547. [Google Scholar] [CrossRef] [PubMed]
  94. Chapin, F.S., III; Schulze, E.; Mooney, H.A. The ecology and economics of storage in plants. Annu. Rev. Ecol. Syst. 1990, 21, 423–447. [Google Scholar] [CrossRef]
Figure 1. Experimental plot (a) and planted elm seedlings (b).
Forests 15 01004 g001
Figure 2. Variation patterns of relative growth rate of basal diameter (RGRD, (a)) and relative growth rate of height (RGRH, (b)) in response to salt stress. Different lowercase letters indicate significant differences amongst salt treatments (one-way ANOVA). Different uppercase letters indicate significant differences between the early and late stages of salt stress (independent sample t-test).
Forests 15 01004 g002
Figure 3. Variation patterns of leaf mass area (a), root/shoot ratio (b), and midday leaf water potential (c) in response to salt stress. Different lowercase letters indicate significant differences amongst salt treatments (one-way ANOVA). Different uppercase letters indicate significant differences between the early and late stages of salt stress (independent sample t-test).
Forests 15 01004 g003
Figure 4. Variation patterns of photosynthetic rate (A, (a)), stomatal conductance (gs, (b)), and intrinsic water use efficiency (A/gs, (c)) in response to salt stress. Different lowercase letters indicate significant differences amongst salt treatments (one-way ANOVA). Different uppercase letters indicate significant differences between the early and late stages of salt stress (independent sample t-test).
Forests 15 01004 g004
Figure 5. Variation patterns of soluble sugar concentration across different organs ((a), leaf; (b), branch; (c), stem; (d), coarse root; (e), fine root) in response to salt stress. Different lowercase letters indicate significant differences amongst salt treatments (one-way ANOVA). Different uppercase letters indicate significant differences between the early and late stages of salt stress (independent sample t-test).
Forests 15 01004 g005
Figure 6. Variation patterns of starch concentration across different organs ((a), leaf; (b), branch; (c), stem; (d), coarse root; (e), fine root) in response to salt stress. Different lowercase letters indicate significant differences amongst salt treatments (one-way ANOVA). Different uppercase letters indicate significant differences between the early and late stages of salt stress (independent sample t-test).
Forests 15 01004 g006
Figure 7. Variation patterns of total NSC concentration across different organs ((a), leaf; (b), branch; (c), stem; (d), coarse root; (e), fine root) in response to salt stress. Different lowercase letters indicate significant differences amongst salt treatments (one-way ANOVA). Different uppercase letters indicate significant differences between the early and late stages of salt stress (independent sample t-test).
Forests 15 01004 g007
Figure 8. Relationships between relative growth rate and NSC concentrations (Pearson’s correlation). (a) Relationship between the relative growth rate of basal diameter (RGRD) and soluble sugar concentrations in leaves; (b) relationship between the relative growth rate of height (RGRH) and soluble sugar concentrations in leaves; and (c) relationship between RGRH and total NSC concentration in leaves.
Forests 15 01004 g008
Figure 9. Relationships between the relative growth rate of basal diameter (RGRD) and starch (a) and total NSC, (b) pools in the coarse root, and soluble sugar (c), starch (d), and total NSC (e) pools in the fine root (Pearson’s correlation).
Forests 15 01004 g009
Figure 10. Relationships between the relative growth rate of basal diameter (RGRD) and starch (a) and total NSC (b) pools of the whole plant (Pearson’s correlation).
Forests 15 01004 g010
Disclaimer/Publisher’s Note: The statements, opinions and data contained in all publications are solely those of the individual author(s) and contributor(s) and not of MDPI and/or the editor(s). MDPI and/or the editor(s) disclaim responsibility for any injury to people or property resulting from any ideas, methods, instructions or products referred to in the content.