Article

Differentiation in Leaf Functional Traits and Driving Factors of the Allopatric Distribution of Tetraploid and Octaploid Buddleja macrostachya in the Sino-Himalayan Region

1
School of Life Science, Qufu Normal University, Qufu 273165, China
2
College of Biological and Agricultural Sciences, Honghe University, Mengzi 661199, China
*
Authors to whom correspondence should be addressed.
Forests 2024, 15(6), 1007; https://doi.org/10.3390/f15061007
Submission received: 26 April 2024 / Revised: 31 May 2024 / Accepted: 7 June 2024 / Published: 8 June 2024
(This article belongs to the Section Forest Ecophysiology and Biology)

Abstract

:
Leaf functional traits reflect species’ adaptive strategies and habitat requirements. Examining intra-specific variations and their underlying drivers can aid in comprehending species differentiation and adaptation. Here, we investigated the leaf functional traits of Buddleja macrostachya tetraploids and octaploids across 18 sites in the Sino-Himalayan region. The habitat environmental variables were also recorded. In this study, leaf functional traits showed a considerable differentiation in both tetraploid and octaploid B. macrostachya. Redundancy analysis (RDA) revealed that the octaploid cytotypes displayed higher specific leaf area, leaf total nitrogen and phosphorus concentrations, water-use efficiency, and light-use efficiency in contrast to the tetraploid plants. These functional leaf traits exhibited different plasticity levels in both taxa. A positive link was found between habitat altitude and soil total P concentration and the geographic distribution of the B. macrostachya complex, using RDA and Pearson’s correlation. Our findings suggest that both tetraploid and octaploid B. macrostachya exhibited divergent ecological strategies, conservative and acquisitive strategies, respectively. The ecological adaptability of species within the B. macrostachya complex is enhanced by the combination of divergent ecological strategies and high phenotypic plasticity of distinct key ecological traits. Furthermore, abiotic environmental factors influenced the allopatric geographic distribution pattern of the B. macrostachya complex in the Sino-Himalayan region.

1. Introduction

Polyploidization typically results in enlarged cellular and organ sizes, impacting the phenotypic plasticity of morphological, anatomical, and physiological traits and even species adaptability [1,2,3,4,5,6,7,8]. A successful polyploid may replace its diploid ancestor in nearly all angiosperms [9]. Compared to diploid plants, polyploid individuals, possessing multiple chromosome sets, frequently demonstrate improved energy generation and superior morphology, structure, and physiology [1,7,8,10]. Within a polyploidy species, ploidy variations play an important role in driving the divergence and differentiation in functional leaf traits, thereby serving as a significant determinant of species evolution [8,9].
Leaf functional traits, defined by Violle et al. [11], encompass morpho-physio-phenological attributes that indirectly influence fitness by affecting growth, reproduction, and survival. This has been a longstanding and central focus of ecological research. The study of leaf functional traits provides a scientifically rigorous and responsible framework to comprehend species’ adaptive strategies and tackle pressing ecological challenges [12,13,14,15]. Moreover, there exist evident trade-offs between leaf physiological function and physical structure. For instance, species with larger leaves can intercept more light, resulting in larger leaf area and higher photosynthetic rates [16,17]. Likewise, larger leaves have stronger vessels, leading to higher theoretical hydraulic conductivity [18,19]. Leaf functional traits vary in response to different environmental conditions. Differentiation in leaf functional traits linked to carbon fixation and nutrient utilization, attributed to leaf economics spectrum (LES), effectively illustrates the trade-off between construction costs and resource acquisition [15,20]. A significant phenotypic plasticity in key ecological traits may be tightly linked to species function, thereby enhancing their environmental tolerance [3,16,21,22].
To the best of our knowledge, the LES provides a comprehensive framework for comprehending and analyzing species’ ecological strategies, as outlined by Wright et al. [20] and Reich [23]. Moreover, it reflects the trade-off between the cost of construction investment and resource acquisition [15,20]. Globally, this trade-off has been proven to exhibit extensive and convincing evidence that viable leaf investment strategies are predominantly arrayed along a single spectrum, as detailed by Wright et al. [20]. Typically, the LES classifies species into nutrient acquisitive (or fast) strategies, characterized by low leaf dry mass (LMA) per unit area and high photosynthetic capacity, versus conservative (or slow) strategies at the opposing end of the spectrum, as described by Wright et al. [20] and Onoda et al. [15].
Variations in key leaf functional traits, such as specific leaf area (SLA), LMA, leaf total nitrogen (N), leaf total phosphorus (P), and photosynthetic rate (PN) have been observed to signify a trade-off between resource acquisition strategy and resource conservation strategy [15,16,20,23]. As Wright et al. [20] demonstrated, the LES primarily accounts for the inter-specific variations in key traits related to carbon fixation and nutrient utilization. Within this broad spectrum, plant species exhibiting divergent ecological strategies tend to cluster into different groups with distinct functional traits, influenced by various abiotic environmental factors, as stated by López-Jurado et al. [8]. Consequently, a comprehensive analysis of the adaptability of leaf functional traits to abiotic environmental factors can help to understand species adaptation and habitat requirements.
Buddleja L. (Scrophulariaceae) species, commonly known as ‘Butterfly Bush’, are widely distributed across Asia, Africa, and America [24,25]. In Asia, these species experienced secondary evolution due to the uplift of the Himalayan Mountains, resulting in diverse ploidy levels, including 2×, 4×, 6×, 8×, 12×, and 24× [24]. The mountain building movement gave rise to many complexes with distinct ploidy, for instance, B. colvilei Hook. f. and Thoms. exhibits three different cytotypes (8×, 16×, 24×), B. nivea Duthie. displays two cytotypes (6×, 12×), and B. macrostachya Wall. ex Benth. shows four cytotypes (4×, 6×, 8×, 12×). Our team has been working on the ecological adaptability of Buddleja species since 2000, as detailed in multiple studies by Chen et al. [12,24,25]. The evidence of chromosome characteristics indicates that the Asiatic Buddleja species is thought to have originated from a single diploid taxon and still be in a juvenile developmental stage [24]. Specifically, B. macrostachya is believed to be the youngest taxon undergoing rapid species differentiation in the Sino-Himalayan region [24]. Notably, our recent field survey revealed that tetraploid and octaploid B. macrostachya plants are more prevalent than hexaploid and dodecaploid plants in the Sino-Himalayan region, possibly due to their reduced fertility [12,25]. Furthermore, tetraploid and octaploid B. macrostachya have allopatric geographical distributions with distinct scent profiles in the Sino-Himalayan region [25].
Investigating the geographic variations within a species can help uncover the relationships among plant growth requirements, phenotypic variations, geographical distribution patterns, and environmental heterogeneity [5,26,27,28,29,30,31]. In this study, we conducted a systematic investigation and assessment on the leaf functional traits and habitat environmental factors of the tetraploid and octaploid B. macrostachya in the Sino-Himalayan region.
The objectives of this study were to (a) investigate differences in leaf functional traits between tetraploid and octaploid cytotypes; (b) compare ecological strategies used in tetraploid and octaploid B. macrostachya; (c) understand the ecological adaptation mechanisms of B. the macrostachya complex to divergent habitat environments.

2. Materials and Methods

2.1. Plant Materials and Study Sites

In this study, a total of eighteen natural populations of the B. macrostachya complex were sampled, including nine tetraploid and nine octaploid natural populations, during May 2017 and September 2022 (Figure 1; Table 1). All the studied sites were located at Yunnan province, ranging from E 97°44′32.23″–E 103°48′29.86″ to N 22°54′03.05″–N 26°05′9.84″. The tetraploid and octaploid individuals of B. macrostachya, previously utilized for ploidy-level estimation in our prior study [25], were included in the present study. The octaploid plants had a higher elevation distribution than the tetraploid ones in the Sino-Himalayan region. The average annual air temperatures of the studied populations were 16–24.5 °C and 11–27 °C for the tetraploid and octaploid plants, respectively. The average annual precipitations of the studied populations were 946–2400 mm and 793–1837.7 mm for the tetraploid and octaploid plants, respectively. A comprehensive description of the habitat environmental conditions of all studied sites is listed in Table 1.

2.2. Leaf Morphological Traits

For each cytotype, a total of 45 mature leaves were collected to measure their morphological traits. Five fully developed, healthy, mature leaves were collected from each population. A branch on the sunny side of the crown was selected from different individuals, and the seventh or eighth mature leaf from the tip of the current-year twig was used.
The leaf morphological traits were measured and collected according to the method described by Smart et al. [32], with minor modification. Firstly, all the collected leaves were floated in water in the dark for approximately 12 h to determine their saturated fresh weight, which was immediately measured and recorded. Afterwards, all the used leaves were marked and subjected to oven drying at 105 °C for 5 min, followed by further drying at 70 °C until a constant weight was achieved over a period of three days. The dry weight of each leaf was recorded. Finally, the specific leaf area (SLA), leaf mass per unit area (LMA), and leaf dry matter content (LDMC) were calculated using the methods described by Smart et al. [32].

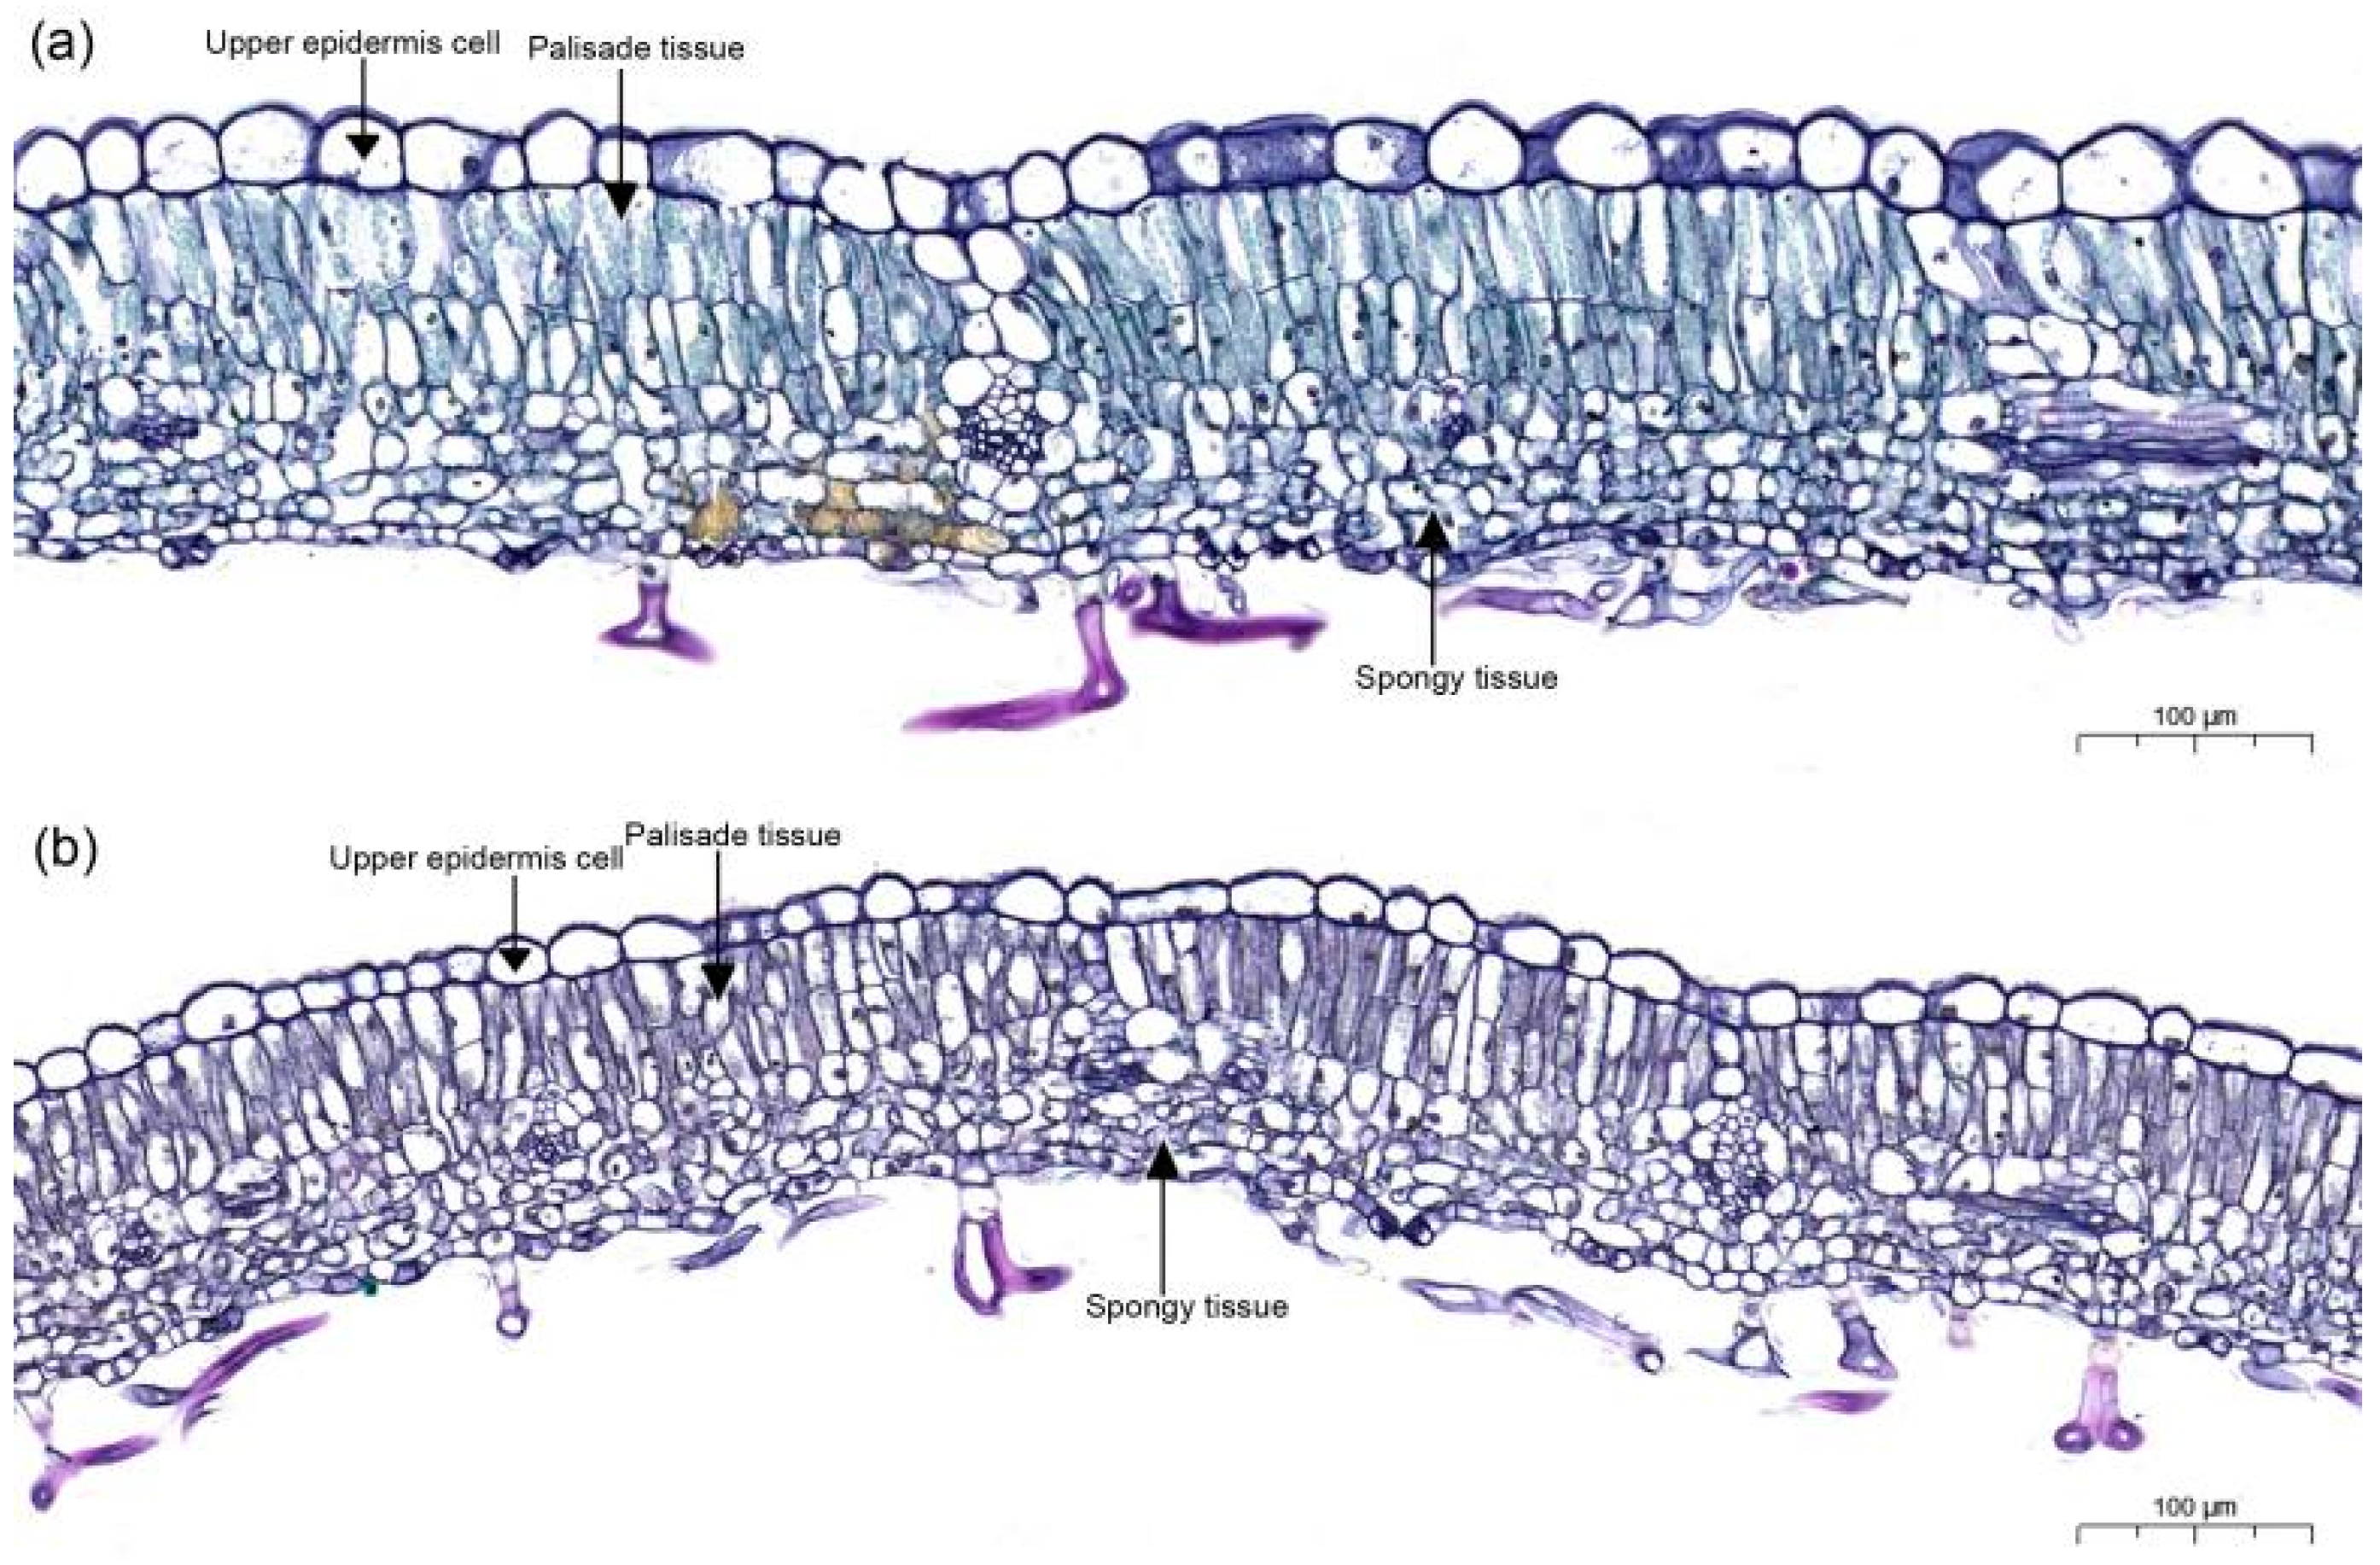
2.3. Leaf Anatomical Structure

A total of 27 fully expanded leaves from different individuals were collected for each cytotype, with three samples collected from each population. As part of the preparatory work, a 5 mm × 5 mm square section containing the main vein was cut and sampled from each leaf. All samples were fixed in formaldehyde alcohol acetic acid fixative (FAA; 70% ethanol/formaldehyde/glacial acetic acid, 18:1:1, [v/v]), for a minimum of two weeks.
A paraffin-embedding method was used to analyze the leaves’ anatomical structure. We followed the method of Liu et al. for obtaining leaf cross-sections [33], with minor modifications. Briefly, after fixing, all leaf samples were dehydrated in a series of graded ethanol solutions (70%, 85%, 95%, and anhydrous ethanol), immersed and embedded in paraffin wax (melting point 58 °C), and naturally dried in the shade for at least two weeks. Upon drying, all samples were sectioned (piece size 8 μm) using a microtome (Leica, Mannheim, Germany), and the leaf samples were dyed with safranin and fast green to stain the cell walls. The samples were subsequently rinsed sequentially for 5 s with 70%, 85%, and 95% gradient alcohols, anhydrous ethanol, and xylene before being sealed with neutral glue.
Two slices were made for each sample, and one image was taken for each sample with a Canon camera (70D). In total, 108 leaf cross-sections were collected and measured using Image J (1.8.0, NIH, Bethesda, MD, USA). The leaf anatomical structure, including the thicknesses of the upper epidermis cell (TUEC), palisade tissue, spongy tissue, mesophyll (Tmes), and lamina (T) of each leaf sample, were measured and recorded using Image J. The leaf cell tense ratio (CTR; palisade tissue/total leaf thickness) and the leaf spongy ratio (SR; sponge tissue/total leaf thickness) were calculated, following Zhang et al. [34].

2.4. Leaf Gas Exchange

Leaf gas-exchange characteristics were evaluated and recorded using a Li-6400XT portable photosynthesis system (Li-Cor Inc., Lincoln, NE, USA) under ambient conditions during March and October 2018. In each population, four healthy mature leaves from different individuals that had been exposed to direct full sunlight were specifically chosen for the measurement of photosynthetic parameters between 09:00 and 10:00 in the morning. Three repetitions were performed for each leaf.
A light response curve was performed at photosynthetic photon flux density (PPFD) intensities of 0, 25, 50, 75, 100, 150, 200, 300, 500, 800, 1000, 1500, 1800, and 2000 μmol CO2 m−2 s−1 prior to the field investigations. A saturating photosynthetic photon flux density (1000 μmol CO2 m−2 s−1 and 1200 μmol CO2 m−2 s−1 for tetraploid and octaploid B. macrostachya, respectively) was determined and used in the follow-up experiment. The photosynthetic parameters of each taxon, including net photosynthetic rate (PN), stomatal conductance (gs), intercellular CO2 concentration (Ci), transpiration rate (Tr), and vapor pressure deficit (VPDL), were determined under saturating photon flux density. Leaf water-use efficiency (WUE; PN/Tr ratio) and light-use efficiency (LUE; PN/PPFD ratio) were further calculated. The average value of each leaf photosynthetic parameter was used for statistical analysis.

2.5. Leaf Macroelements and Soil C:N:P Stoichiometry

All the dried leaf and soil samples were ground to fine powder to pass through a 0.15 mm sieve and were then used for C:N:P stoichiometric analysis. The dried leaves of each population were blended and pooled for the evaluation of the leaf macroelements carbon (C), nitrogen (N), and phosphorus (P), according to the method described by Zou et al. [35]. Soil stoichiometric characteristics (including soil organic carbon (SOC), soil total nitrogen (STN), and soil total phosphorus (STP)) were determined based on the soil samples (n = 3 per population) collected from the upper 20 cm of soil in different populations. Three repetitions were made for the leaf and soil samples at each population.
The Bao [36] and Zou et al. [35] methods were adopted with minor modifications for C, N, and P concentration determination. The C concentrations in the leaves and soil were determined using a KCr2O7 + H2SO4 volumetric method. Briefly, the samples were heated in an oil bath to 170 °C–190 °C for 5 min and subjected to digesting in a KCr2O7 + H2SO4 solution. The samples were then titrated with FeSO4. The leaf and soil samples were digested with a mixed acid solution of H2SO4 + H2O2 for N and P concentrations. The N concentration was determined with a Kjeltec analyzer (Kjeltec2300 Analyzer Unit, Hoeganaes, Sweden) and the P concentration was determined using a molybdenum-antimony anti-colorimetric method.

2.6. Statistical Analysis

2.6.1. Phenotypic Plasticity between Tetraploid and Octaploid B. macrostachya

In our analysis of leaf functional traits, we integrated a comprehensive range of morphological, anatomical, physiological, and stoichiometric traits to provide a systematic explanation of plant ecological strategy. A one-way ANOVA was used to analyze the impact of ploidy level on leaf functional traits between the two different cytotypes.
To characterize the differentiation in leaf functional traits between tetraploid and octaploid cytotypes, a non-metric multidimensional scaling (NMDS) ordination analysis based on Euclidean similarity distance was performed in PAST (Version 4.15) [37]. The dissimilarity between these two cytotypes was further quantified through a one-way SIMPER test based on Bray–Curtis similarity. All the data were standardized to reduce the heterogeneity of variance before multiple NMDS ordination analysis using log10-transformations.
The plasticity index (PI; 1—minimum/maximum) for each functional leaf trait was calculated according to Brooker et al. [38] to asses the response level of tetraploid and octaploid B. macrostachya to habitat environmental conditions. For each cytotype, the PI values of leaf functional traits were determined using the minimum and maximum mean values at the population level. Plants with higher the PI values often exhibited greater sensitivity to the natural environment.

2.6.2. Correlation between Leaf Functional Traits and Environmental Factors within the B. macrostachya Complex

A one-way ANOVA was conducted to compare the soil stoichiometric characteristics of distribution regions between the two different cytotypes at a significance level of p < 0.05. Data normality, including environmental factors and leaf functional traits between these two cytotypes, was tested by using the Shapiro–Wilk test. Associated with other habitat environmental factors (i.e., longitude, latitude, altitude), the Pearson’s correlation coefficient between leaf functional traits and environmental traits was evaluated using Origin pro-2021b (OriginLab Inc., Northampton, MA, USA).
Redundancy analysis (RDA) was performed to summarize all of the variance in the leaf functional traits (response variables) and further evaluate the relationships between leaf functional traits and environmental traits (explanatory variables) in tetraploid and octaploid B. macrostachya. Significance was statistically evaluated using 999 permutation tests. In an RDA diagram, the angle between the lines of each explanatory variable and the sorting axis or the dot representing leaf ecophysiological traits reflects their relationship. The variables with the highest correlation coefficients in an RDA ordination diagram are typically considered to be the predominant determinants of the ordination axis. For the RDA, all the data were log-transformed, centered, and standardized by population and cytotype. The RDA was conducted using PAST (Version 4.15) [37].

3. Results

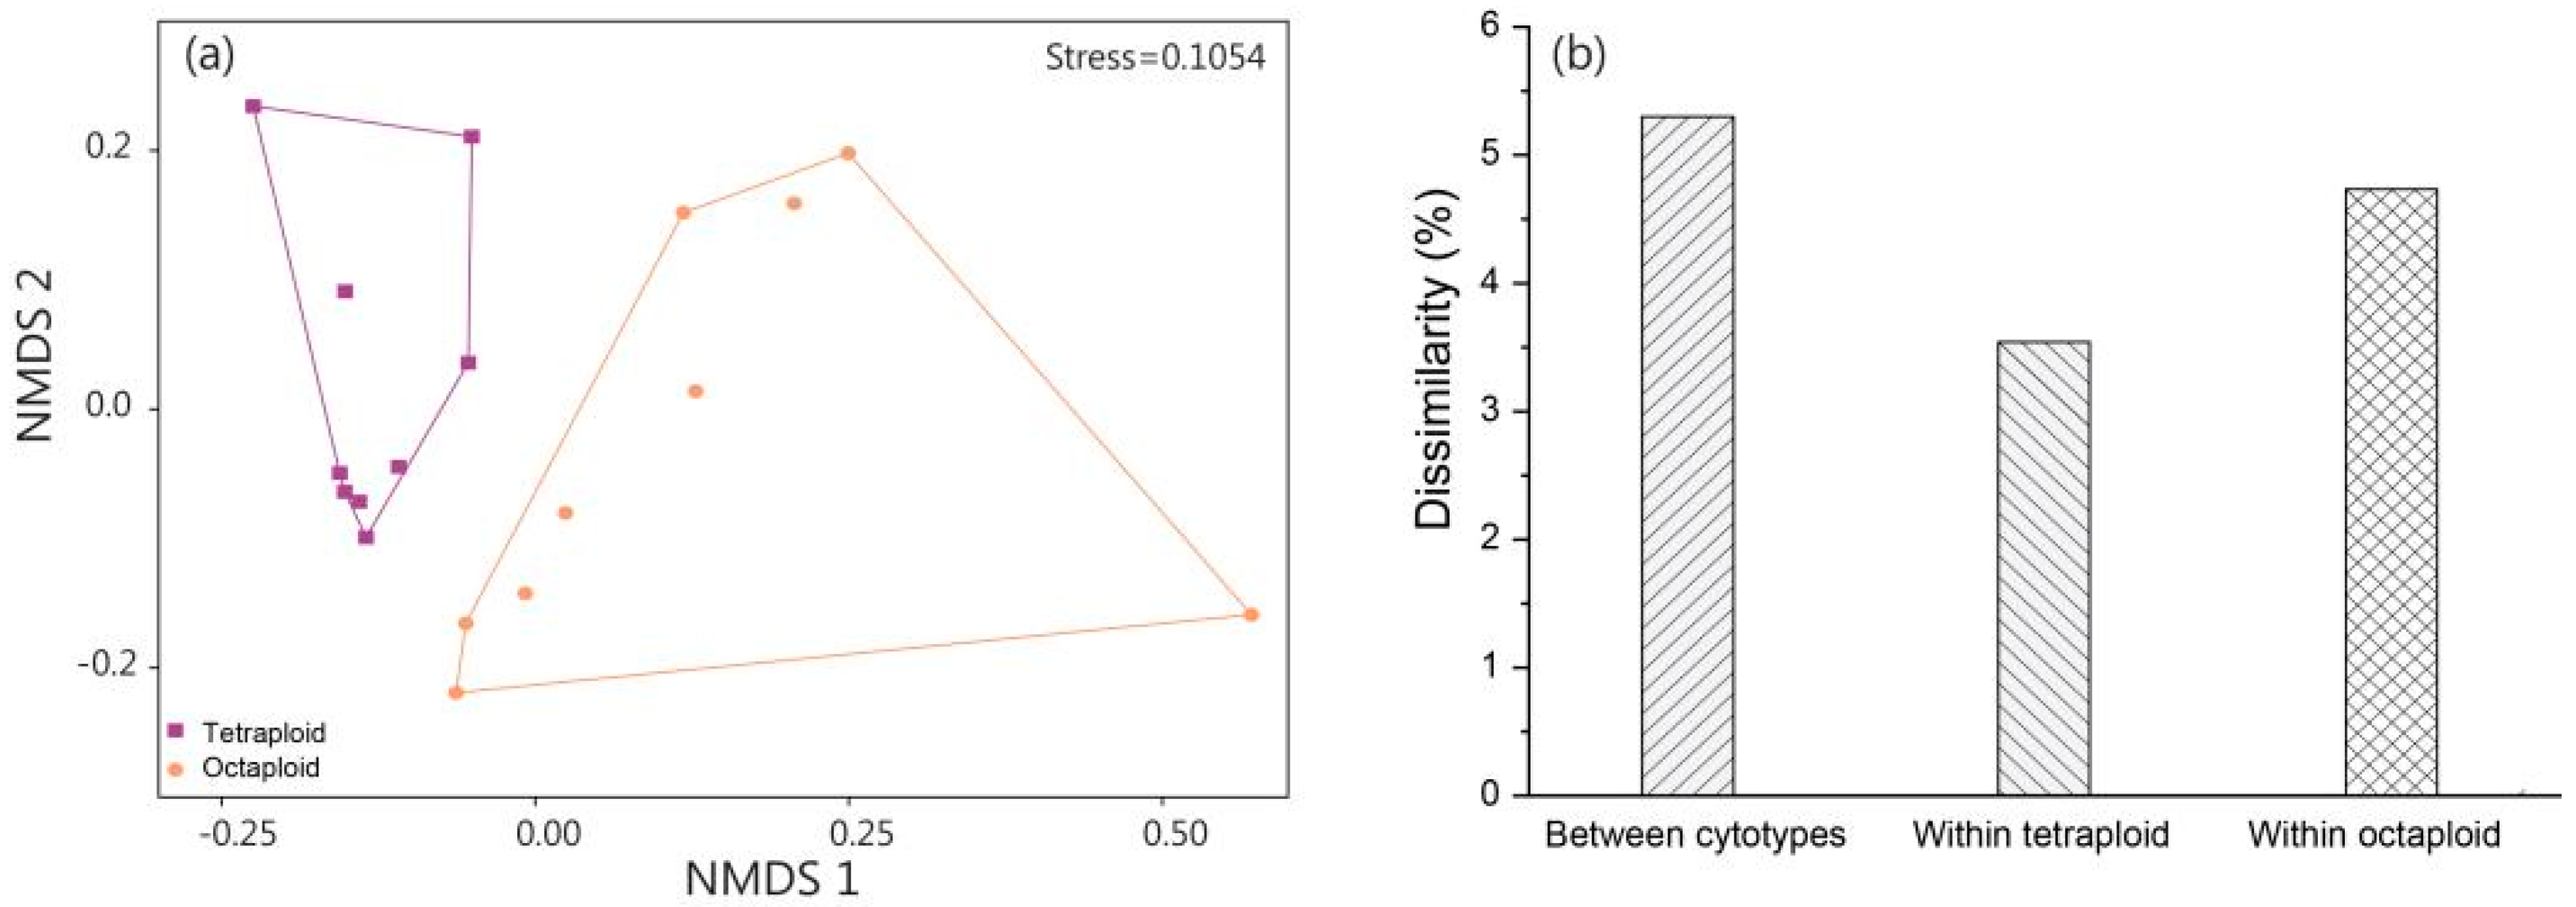
3.1. Comparison of Leaf Functional Traits between Tetraploid and Octaploid B. macrostachya

The morphological, anatomical, photosynthetic, and stoichiometric traits of the B. macrostachya complex were evaluated and are presented in Table 2. There were significant differences (p < 0.05) in leaf morphological traits between the tetraploid and octaploid B. macrostachya. Compared to the octaploid cytotypes, the tetraploid plants exhibited significantly larger (p < 0.05) LA (165.62 ± 26.69 cm2), LMA (101.65 ± 12.58 g m2), and LDMC (0.23 ± 0.02 g g−1). Moreover, the leaf areas (LAs) of the tetraploids were 20.45% larger than those of the octaploid plants. In contrast, the octaploid plants showed significantly (p < 0.05) higher SLA (134.45 ± 8.90 m2 kg−1) compared to the tetraploid ones (111.00 ± 9.57 m2 kg−1).
The anatomical structure of leaves in the tetraploid and octaploid cytotypes were assessed, revealing significant differences (p < 0.05; Figure 2; Table 2). Tetraploid leaves produced a significantly thicker (p < 0.05) T (126.64 ± 2.41 μm), TUEC (18.30 ± 0.80 μm), palisade parenchyma (51.53 ± 1.81 μm), spongy parenchyma (41.36 ± 1.73 μm), and Tmes (92.89 ± 1.65 μm) compared to those of the octaploid plants. Conversely, the octaploid plants characterized a significantly higher CTR (40.91 ± 1.44%; p < 0.05) than the tetraploid ones (45.87 ± 1.34%). Additionally, no significant differences (p > 0.05) in SR and P/S ratios were found between the tetraploid and octaploid B. macrostachya.
Both tetraploid (20.85 ± 0.48 μmol CO2 m−2 s−1) and octaploid (23.97 ± 1.67 μmol CO2 m−2 s−1) B. macrostachya performed high net rate of photosynthesis (PN), which was non-significant (p > 0.05; Table 2). However, significant differences in photosynthetic traits were found between the tetraploid and octaploid plants. For instance, the tetraploid plants showed significantly higher gs, Ci, Tr, and VpdL (p < 0.05) compared to the octaploid plants. More interestingly, the octaploid plants had significant higher (p < 0.05) WUE and LUE compared to the tetraploid ones. The WUE values of the tetraploid and octaploid plants were 3.08 ± 0.13 μmol mmol−1 and 6.90 ± 2.14 μmol mmol−1, respectively, and, similarly, 0.03 ± 0 mol mol−1 and 0.04 ± 0.01 mol mol−1 for LUE (Table 2).
The leaf stoichiometry of both cytotypes within B. macrostachya were also systemically evaluated and presented (Table 2). Compared to the octaploid plants, the tetraploid cytotype plants had significantly lower (p < 0.05) concentrations of leaf N and P, whereas they showed significantly higher C:N and C:P ratios. At the p < 0.05 level, no significant differences (p > 0.05) were observed in leaf C concentration (441.47 ± 2.14 g kg−1 and 444.02 ± 2.52 g kg−1 for the tetraploid and octaploid cytotypes, respectively) or N:P ratios.
Furthermore, the phenotypic plasticity of leaf functional traits between these two cytotypes was further calculated and is illustrated in Figure 3. The morphological and photosynthetic traits showed great phenotypic plasticity compared to the anatomical and stoichiometric traits in the B. macrostachya complex. Among all of these functional traits, both LA and LUE showed great phenotypic plasticity (PI > 0.5) in these two cytotypes. The plasticity indices of LA in the tetraploid and octaploid plants were 0.81 and 0.91, respectively (Figure 3), and 0.68 and 0.87 for LUE, respectively. In the tetraploid B. macrostachya, the SLA, LMA, P concentration, C:N ratio, and C:P showed a high plasticity index, whereas P/S ratio, gs, Tr, and WUE had great plasticity in the octaploid plants (Figure 3). The other functional traits showed relatively low phenotypic plasticity (PI < 0.5) in both cytotypes.
In addition, the leaf functional trait relationships between the tetraploid and octaploid cytotypes was also evaluated through an NMDS analysis (Figure A1a). The NMDS ordination analysis showed high linear and non-metric fits (R2 = 0.715 and 0.2641, respectively) and low stress values (0.1054) based on the Euclidean similarity index (Figure A1a). The results of the NMDS clearly reveal that there was no overlap of leaf functional traits between the two cytotypes in the B. macrostachya complex. The overall average dissimilarity between and within the tetraploid and octaploid cytotypes were further evaluated through the SIMPER test (Figure A1b). Our results indicate that the dissimilarity between these two cytotypes is 5.28%, while the dissimilarities within each tetraploid and octaploid cytotype of the plants were 3.54% and 4.71%, respectively (Figure A1b).

3.2. Comparison of Soil Stoichiometry in Tetraploid and Octaploid B. macrostachya

The habitat soil stoichiometry of both tetraploid and octaploid B. macrostachya was evaluated and is exhibited in Table 3. Compared to the tetraploid cytotype, the habitat soil of the octaploid plants showed higher SOC, STN and STP concentrations, with significant differences (p < 0.05). For instance, the habitat SOC concentrations in both tetraploid and octaploid B. macrostachya were 22.87 ± 2.27 mg g−1 and 33.20 ± 3.09 mg g−1, respectively (Table 3), the STN concentrations were 0.99 ± 0.10 mg g−1 and 1.53 ± 0.14 mg g−1, and the STP concentrations were 0.50 ± 0.05 mg g−1 and 0.93 ± 0.12 mg g−1. The ratios among C, N and P, including C:N, C:P, and N:P, were also calculated, with no significant difference observed (p > 0.05).

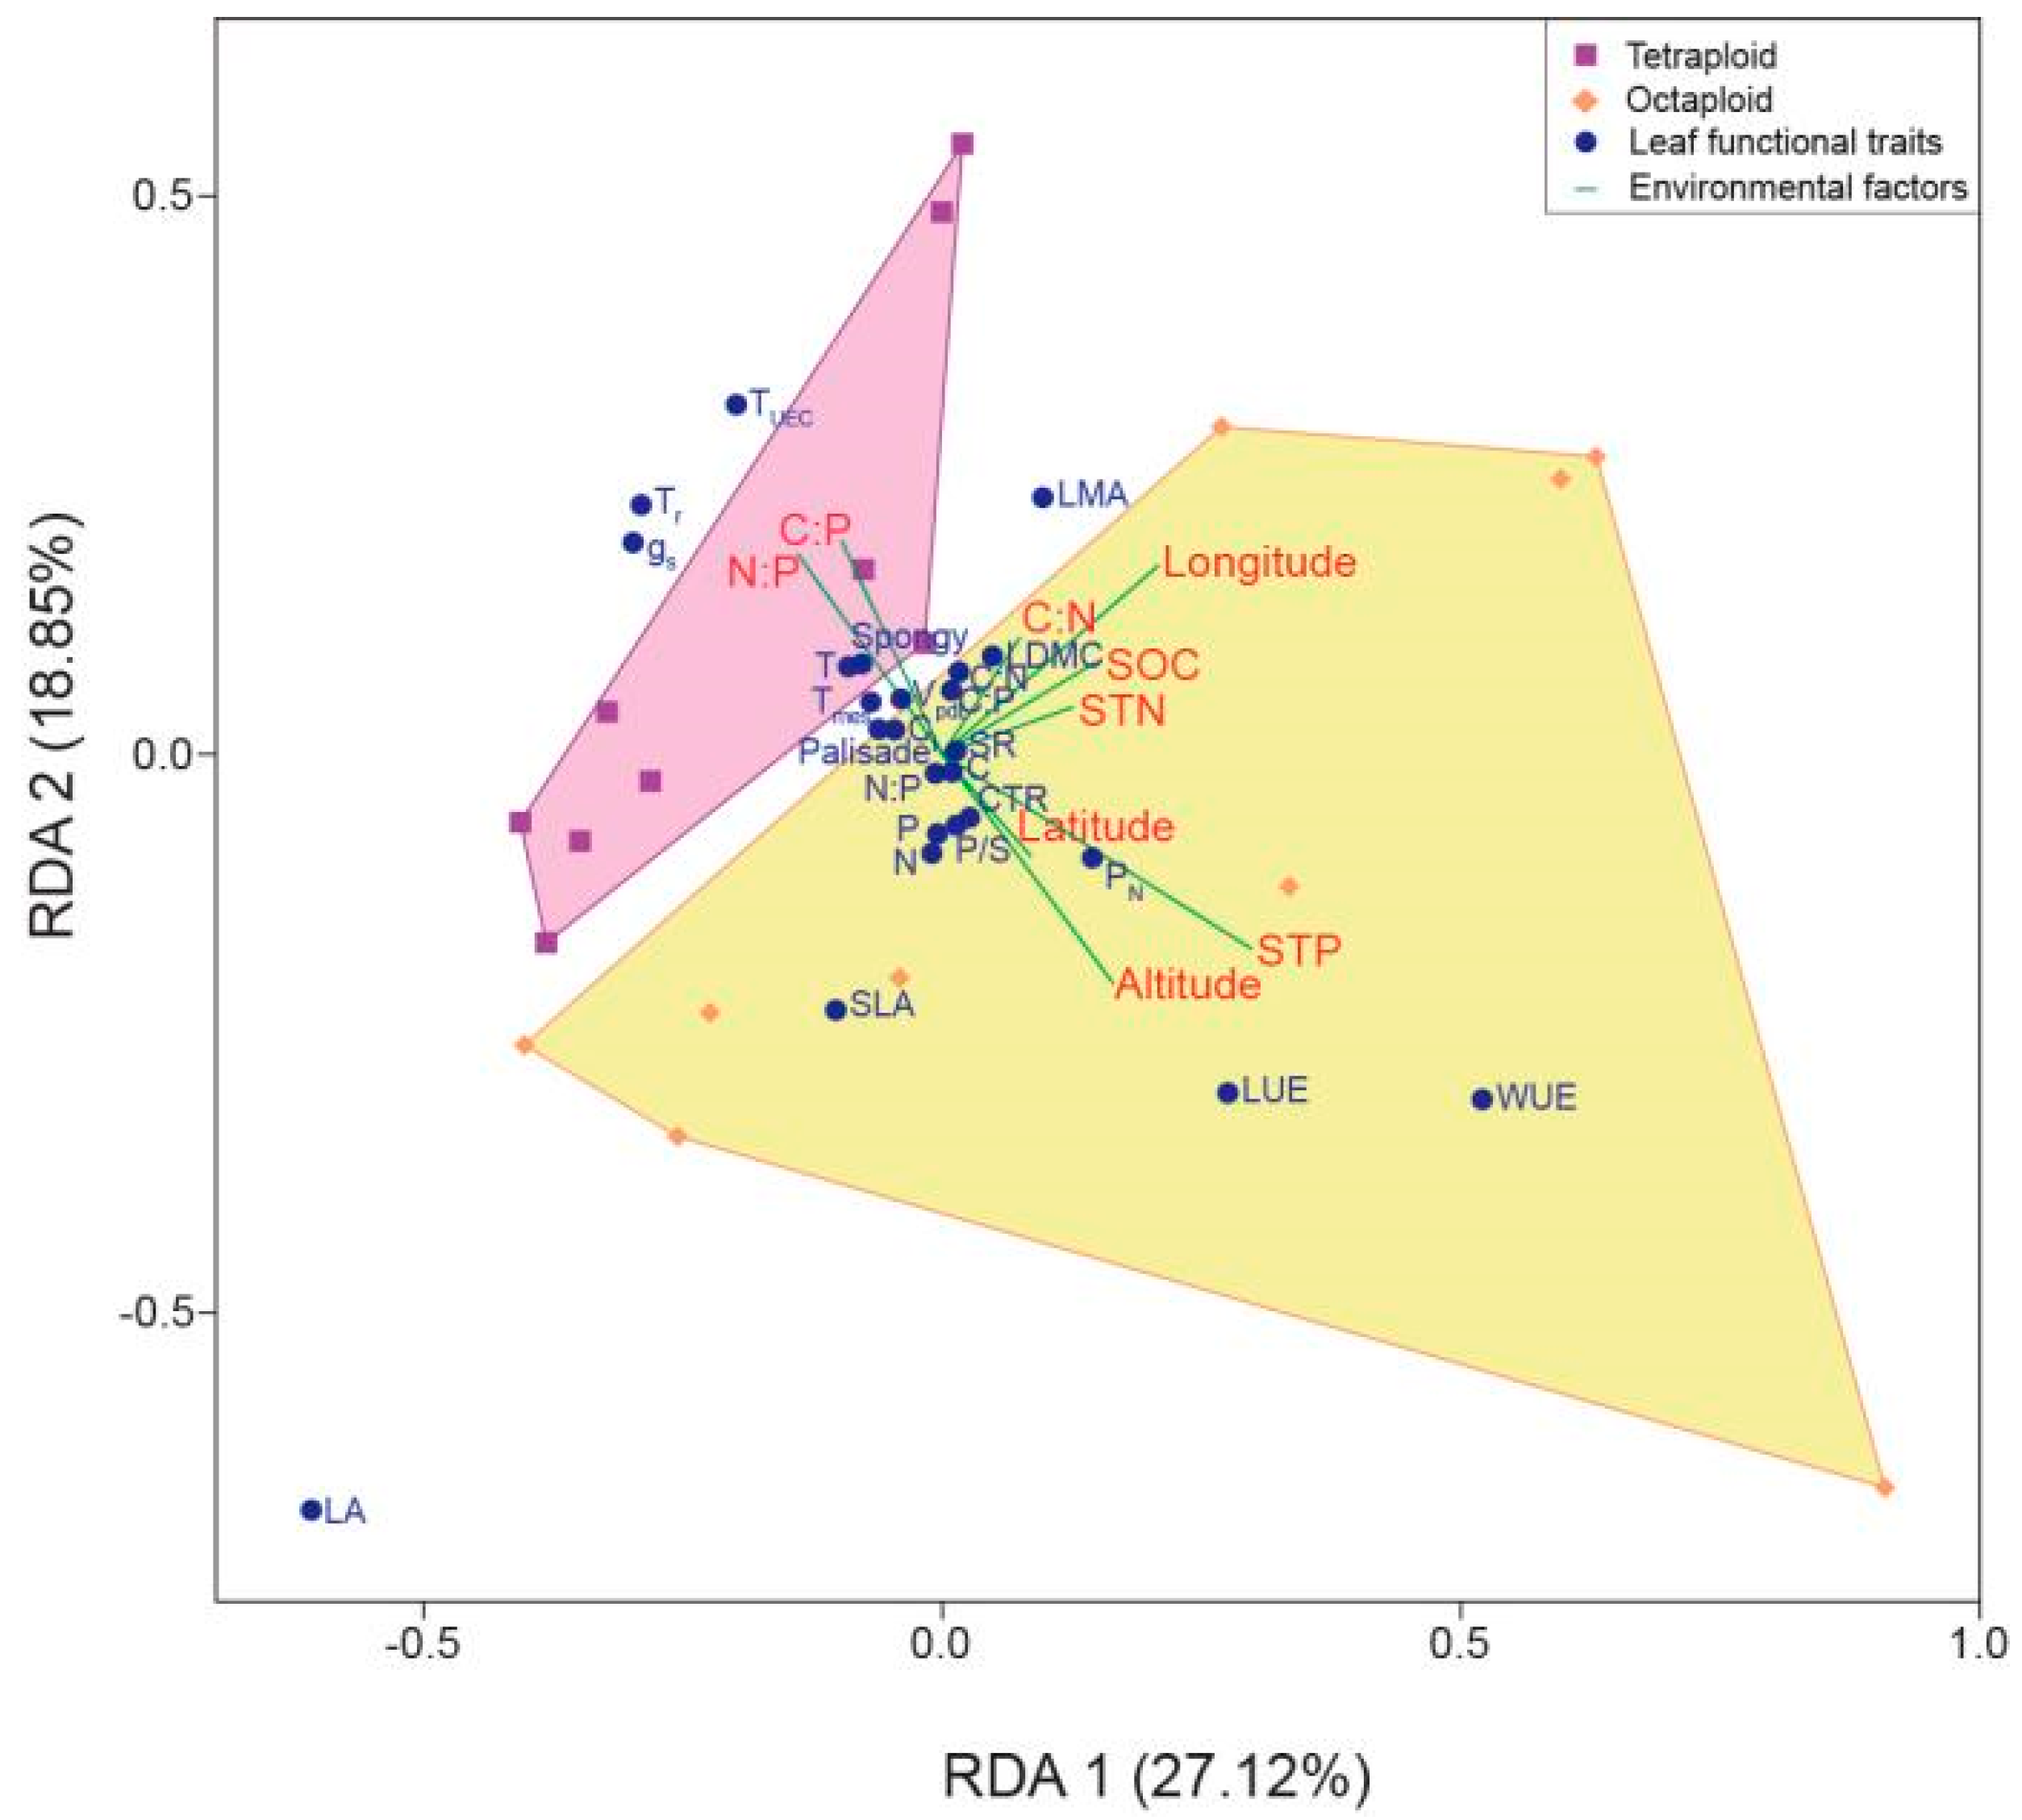
3.3. Relationship between Habitat Environmental Factors and Leaf Functional Traits within the B. macrostachya Complex

The relationships between leaf functional traits and environmental conditions were interpreted and displayed through the RDA. The RDA revealed that RDA 1 and RDA 2 totally explained 45.97% of the total variations. RDA 1 and RDA 2 separately accounted for 27.12% and 18.85% of the total variations (Figure 4). The results of the RDA biplot indicate that the populations of tetraploid and octaploid B. macrostachya were classified into two discrete clusters with no overlap. Moreover, the tetraploid cytotypes were characterized by larger TUEC, Tr, and gs, while the octaploid cytotypes were characterized by high WUE, LUE, SLA, and PN. In addition, the geographic distributions of octaploid B. macrostachya showed a high altitude, longitude, and STP concentration compared to the tetraploid ones, which had habitat soil stoichiometry with higher relative C:P and N:P ratios.
The relationships between environmental factors and leaf functional traits in the B. macrostachya complex were further analyzed using Pearson’s correlation analysis, with the results visualized in Figure 5. Leaf morphological traits exhibited a strong association with habitat altitude and longitude but were uncorrelated with other environmental factors. A significant positive correlation (p < 0.05) was observed between habitat altitude and SLA, while LMA and LDMC exhibited a significant negative correlation with altitude. In contrast, longitude was significantly negatively correlated (p < 0.05) with SLA and positively associated with LMA. Anatomical traits demonstrated a significant correlation with altitude, latitude, and soil P concentration. A significant positive correlation (p < 0.05) was found between CTR and altitude, whereas TUEC and spongy traits exhibited a negative correlation with altitude. Habitat latitude was significantly negatively correlated (p < 0.05) with T, TUEC, spongy, and Tmes. Similarity, soil P concentration in the habitat was significantly negatively correlated (p < 0.05) with T, TUEC, palisade, spongy, and Tmes. Physiological traits demonstrated a strong relationship with soil P concentration, as well as C:P and N:P ratios. Specifically, soil P concentration (TP) was significantly positively correlated (p < 0.05) with PN and WUE, but negatively associated (p < 0.05) with gs, Ci, and Tr. Both gs and Tr exhibited significantly positive correlations (p < 0.05) with C:P and N:P ratios. A significant positive correlation was observed between Ci and the N:P ratio. Despite a lack of significant correlation (p > 0.05) between habitat environmental factors and leaf stoichiometric characteristics, no significant association was found with other leaf functional traits.
In addition, the relationships among leaf functional traits were also analyzed. In morphological traits, LMA was significantly positively with LDMC, whereas SLA exhibited a negative correlation with both LMA and LDMC. Moreover, leaf morphological traits were closely associated with leaf stoichiometric traits. SLA was positively correlated with leaf N and P concentrations, while it was negatively correlated with C:N and C:P ratios. LDMC was negatively correlated with N and P concentrations, but positively correlated with C:N and C:P ratios. In anatomical traits, there were significant positive correlations (p < 0.001) among T, TUEC, palisade, spongy, and Tmes. CTR was significantly negatively associated with T, TUEC, spongy, and Tmes. SR negatively correlated with palisade and CTR, but positively correlated with spongy. In physiological traits, WUE was significantly negatively correlated with anatomical traits, including T, TUEC, palisade, and Tmes. Tr was positively correlated with palisade. Similarly, the relationships among environmental factors were also analyzed. The soil C:N and C:P ratios positively correlated with SOC and STP, but negatively correlated with STP.

4. Discussion

Our results show that the allopatric geographic distribution of the B. macrostachya complex is influenced by abiotic environmental factors in the Sino-Himalayan region. Both tetraploid and octaploid B. macrostachya have divergent ecological strategies, and they exhibited distinct functional leaf traits. In each cytotype, a high phenotypic plasticity in the key ecological traits can enhance their ecological adaptability.

4.1. Phenotypic Differentiation in Tetraploid and Octaploid B. macrostachya

Leaves are the predominant organ for plant photosynthesis and carbon assimilation. Functional leaf traits are closely related to resource utilization ability and can sensitively respond to environmental changes, reflecting plants’ survival strategy [15,20,23,39,40]. At present, the leaf economic spectrum, which ranges from emphasis on resource acquisition and growth to emphasis on resource conservation and plant survival, has been extensively used to evaluate species ecological adaptability and strategies. In this study, a significant difference (p < 0.05) in leaf traits, including morphological, anatomical, photosynthetic, and stoichiometric characteristics, was found between tetraploid and octaploid B. macrostachya (Table 2). Despite both tetraploid and octaploid B. macrostachya exhibiting great photosynthetic capacity with high PN values, the octaploid plants tended to exhibit a lower LMA and higher SLA, leaf N, and P concentration compared to the tetraploid ones (Table 2). Our results suggest that both tetraploid and octaploid B. macrostachya take distinct ecological strategies, conservative and acquisitive strategies, respectively.
Among all the functional leaf traits, LMA can efficiently indicate a species’ position along the leaf economic spectrum and predict its resource acquisition strategies [15,20]. Despite being a morphological trait, LMA is closely associated with plant growth potential, especially photosynthetic capacity [15,23,41]. The LMA of a species is mainly attributed to its leaf anatomical traits, such as larger cell size, greater numbers of mesophyll cells, higher cell densities, and greater major vein [15]. Compared to the octaploid plants, tetraploid B. macrostachya invested more cost into leaf physical structure construction, exhibiting larger blade thickness, TUEC, palisade, spongy, and Tmes with great LA, LMA, and LDMC. Our findings are consistent with the results of previous studies, showing that LES reflected a trade-off between the cost of leaf structure and the rate of resource return through variations in leaf functional traits concerning carbon fixation and nutrient use [15,20,23].
The results of the RDA reveal that there was clear phenotypic differentiation between the tetraploid and octaploid B. macrostachya (Figure 4). Both cytotypes showed typical leaf functional traits. For instance, the tetraploid plants exhibited high TUEC, Tr, and gs, whereas the octaploid cytotypes had great SLA, WUE, and LUE. Interestingly, in contrast to the tetraploid plants, the octaploid ones are found at high altitudes, where have less average annual precipitation and more light intensity. In order to respond to typical geographical environments, octaploid B. macrostachya reduced their LA, Tr, and gs. Simultaneously, they also improved their WUE, LUE, and CTR ratio, which are closely related to species photosynthetic capacity. These results fully embody the principle of mutual matching between physical structure and ecological function.
We also found that the octaploid B. macrostachya had higher N and P concentrations compared to the tetraploid plants (Table 2). Phosphorus is an essential nutrient of genetic material, as well as ATP, and rapidly growing tissues need more P allocation to ribosomal RNA for protein synthesis [42,43]. The element nitrogen mainly participates in cell wall construction and photosynthesis. Generally, more nitrogen allocation to cell walls can markedly improve a species’ physical strength, with higher LMA [15]. Furthermore, there was a negative correlation between leaf N and P concentrations as well as the plant growth rate [15,44]. Thus, species-specific functional traits in both cytotypes can help them to adapt to typical environmental conditions.

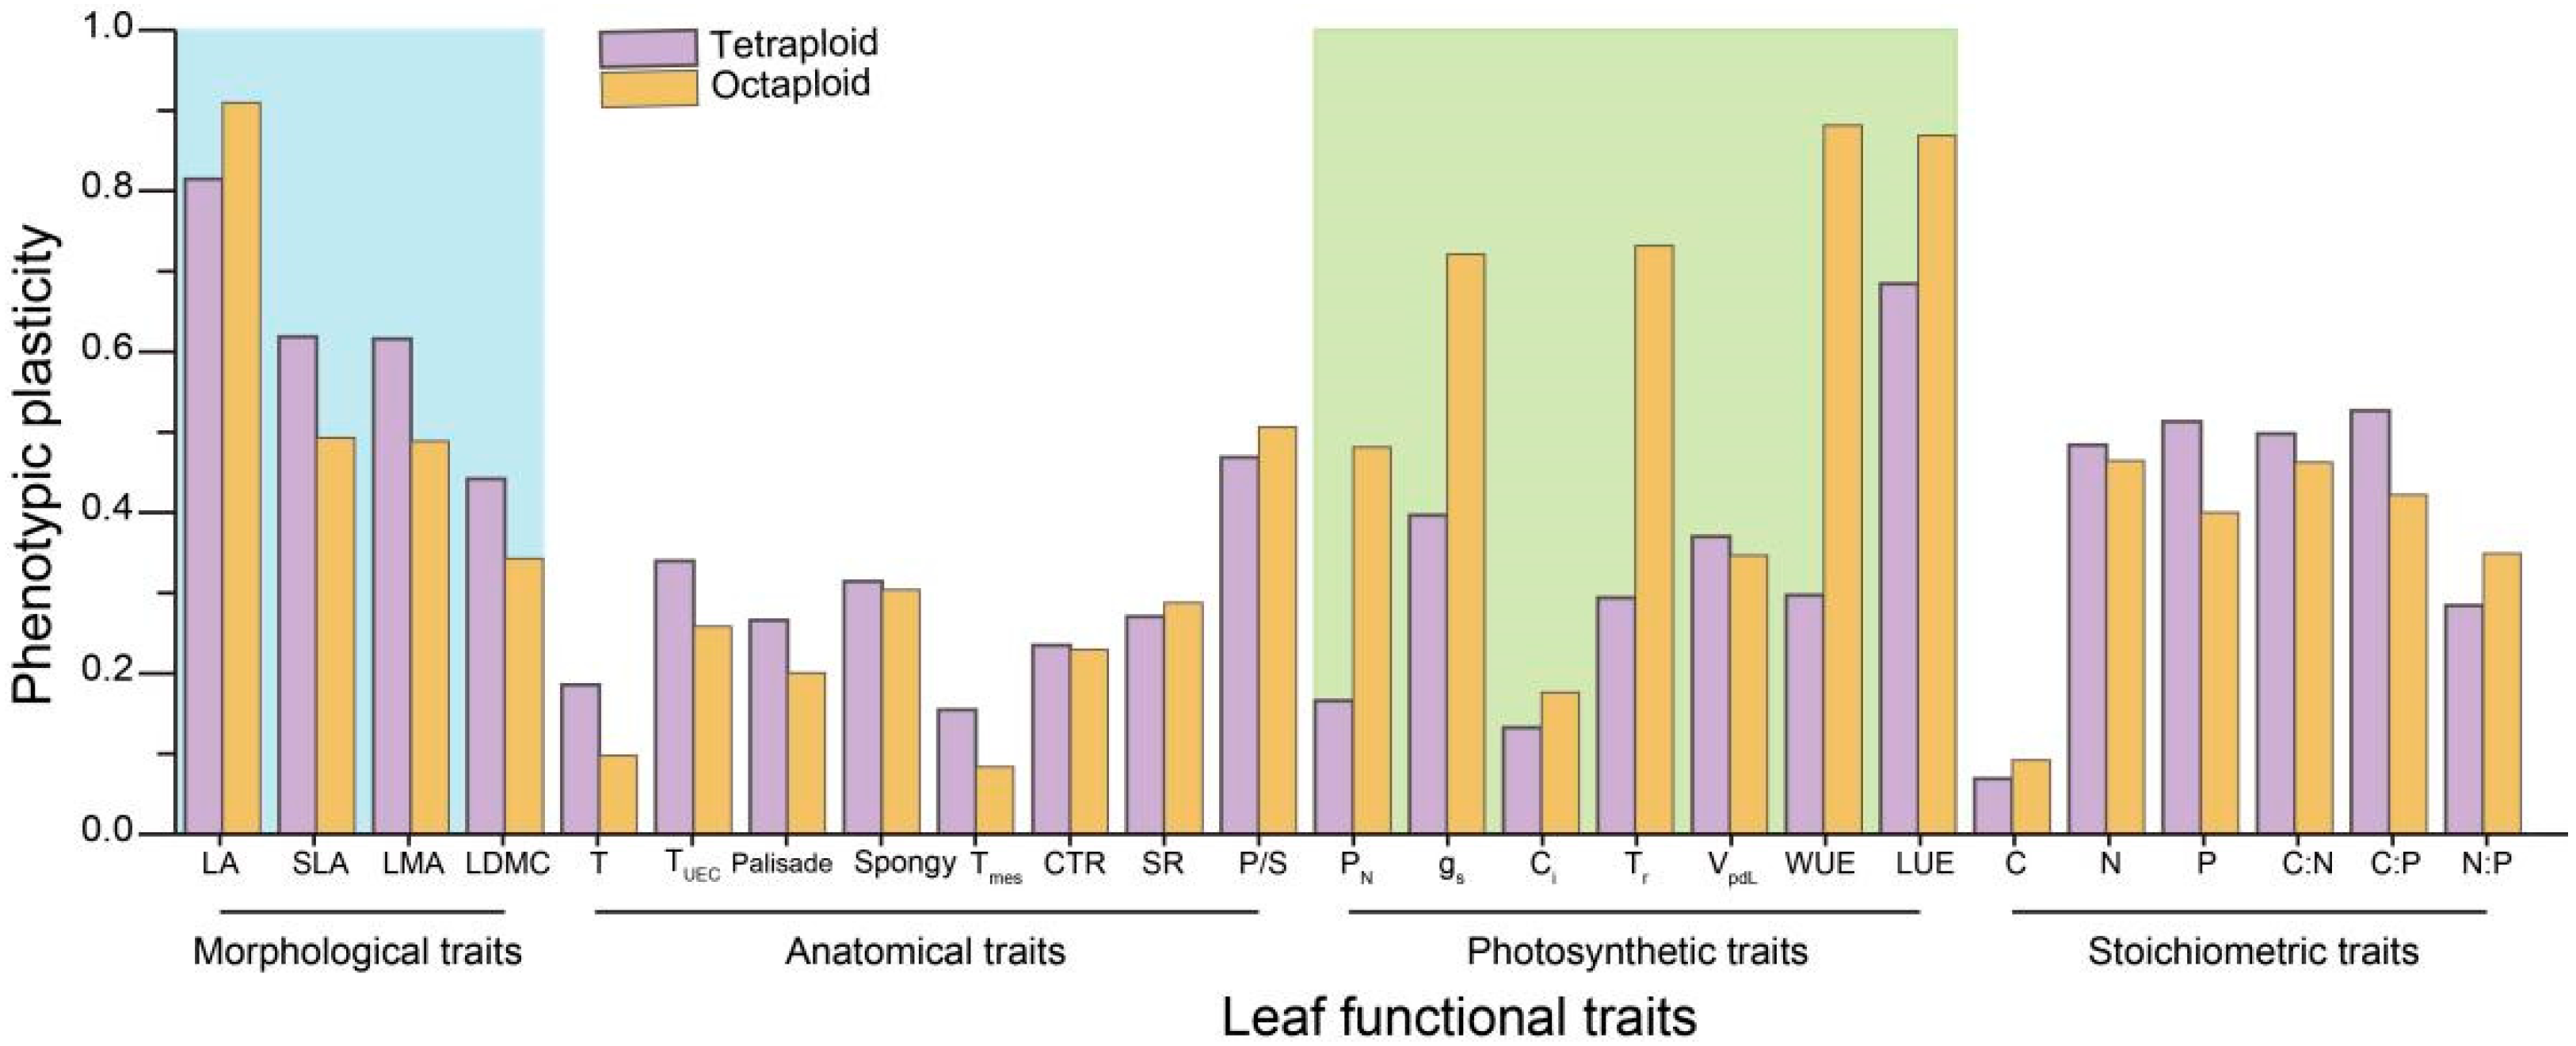
4.2. Phenotypic Plasticity Enhances Species Adaptability within the B. macrostachya Complex

Both genetic and phenotypic variability are fundamental in determining intrinsic factors that define species and species biogeography [22,26,30,45]. Phenotypic plasticity, especially of critical functional traits, is considered to be a vital mechanism for adapting to changing ecological environment. McKown et al. [26] believed that extensive geographical and environmental gradients have influenced species phenotypic variability. Having direct exposure to the environment, leaves sensitively respond to distinct habitat conditions with extensive phenotypic divergence. High plasticity in ecological adaptive traits can effectively enhance species fitness, making them more adaptive [16,46,47]. The ecological and adaptive strategies of a species have always been a central question in evaluating species evolution [8,15,23].
Generally, most leaf traits respond to environmental conditions to some extent; however, these adaptations do not necessarily translate into higher fitness across various environments, as noted by Grether [22]. In this study, functional traits with a plasticity index greater than 0.5 received great attention. Both the tetraploid and octaploid B. macrostachya plants exhibited great plasticity in LA and LUE, which are strongly linked to effective light interception. Interestingly, the phenotypic differentiation observed in the tetraploid plants was primarily attributed to the high morphological (i.e., SLA, LMA) and stoichiometric trait plasticity (i.e., P concentration, C:N and C:P ratios). Conversely, the octaploid plants exhibited distinct anatomical (i.e., P/S ratio) and photosynthetic traits (i.e., gs, WUE), as detailed in Table 2. Hence, our findings suggest that both the tetraploid and octaploid B. macrostachya plants adopt distinct ecological strategies and possess varying mechanisms, along with high phenotypic plasticity in key ecological adaptive traits, that collectively contribute to enhanced species adaptability.
There is abundant evidence that phenotypic variation can be rapid in the wild, and it occurs faster in response to the changing environments [48,49]. Our findings are consistent with Pritzkow et al. [21] and Henn et al. [50], indicating high phenotypic plasticity and its consequences for performance within a species is adaptive. Theoretically, adaptive phenotypic plasticity should be more extensive in species experiencing environmental heterogeneity over the course of a generation and those potentially having wider fundamental niches [38,51]. Consequently, the adaptive phenotypic plasticity of leaf functional traits, such as LA and LUE in tetraploid; LA, WUE, and LUE in octaploid, are critical for the species’ survival in the B. macrostachya complex.

4.3. Abiotic Environmental Factors Influence Geographic Differentiation within the B. macrostachya Complex

Investigations of phenotypic geographic variation offer valuable insights into evolutionary mechanisms, thereby contributing significantly to our comprehension of species diversification. Typically, a diverse array of genetic mechanisms underlie speciation, particularly the emergence of ploidy variations [9,52]. In addition, divergent natural selection, including abiotic and biotic factors, may serve as a crucial determinant of phenotypic and geographic differentiation [5,21,22,26,27,28,29,30,31,33,53]. The results of the RDA reveal a positive association between the distribution of the B. macrostachya complex and habitat altitude level, as well as soil total P concentration (Figure 4). The fast-growing octaploid plants were predominantly distributed at high altitude with an abundant soil P concentration, whereas the tetraploid plants were more dominant at lower altitudes.
Moreover, high soil P concentrations can effectively influence species photosynthetic capacity, particularly with high PN (Figure 5). Similarly, SLA and CTR traits exhibited significant improvement with increasing elevation, whereas LMA, LDMC, TUEC, and spongy thickness notably decreased (Figure 5). This was consistent with Seguí et al. [53] and Midolo et al. [29], who stated that the variation in leaf functional traits observed along altitude levels depends on a set of abiotic environmental factors that typically change with elevation. With increasing elevation, the key functional leaf traits of tetraploid and octaploid B. macrostachya positively respond to changing abiotic environmental conditions, exhibiting adaptive traits. Our findings suggested that the typical geographic distribution patterns of tetraploid and octaploid B. macrostachya are primarily influenced by abiotic environmental factors. Associated with their wide genetic similarity (Chen et al., unpublished data), the clear geographic and ecological separation in tetraploid and octaploid B. macrostachya support a typically recent and rapid speciation. This is consistent with the results of Chen et al. [24], who stated that B. macrostachya is the youngest taxon undergoing rapid species differentiation in the Sino-Himalayan region.

5. Conclusions

In this study, we investigated the leaf functional traits of tetraploid and octaploid B. macrostachya through a comprehensive analysis of 25 leaf traits from 18 populations in the Sino-Himalayan region. Our results revealed typical differentiation in the leaf functional traits between the two cytotypes within the B. macrostachya complex. However, the RDA indicated that the octaploid cytotypes showed higher SLA, leaf N and P, WUE, and LUE compared to the tetraploid plants. These findings suggested that both tetraploid and octaploid B. macrostachya adopt divergent ecological strategies, conservative and acquisitive strategies, respectively. The results of the multivariate analysis suggest that the allopatric distribution of the B. macrostachya complex is primarily influenced by the abiotic environmental factors in the Sino-Himalayan region. Furthermore, the divergent ecological strategies and high phenotypic plasticity of the key ecological traits collectively enhance species ecological adaptability in the B. macrostachya complex.

Author Contributions

W.G., H.F. and C.W. were responsible for the research design, data collection, analysis and manuscript writing. The data visualization was conducted by H.L. and H.F. All authors have read and agreed to the published version of the manuscript.

Funding

This research was supported by the National Natural Science Foundation of China (grant Nos. 32160246 and 31660111).

Data Availability Statement

All relevant data are within the manuscript.

Acknowledgments

We thank Zhangfen Liu, Yanfei Pu, Wangqian Liu, Yue Gao, and Tong Zhu et al. for the help in sample collection. We are sincerely grateful to the anonymous reviews for their valuable comments to improve the manuscript.

Conflicts of Interest

The authors declare no conflicts of interest.

Appendix A

Figure A1. Non-metric multidimensional scaling (NMDS) ordination analysis (a) and dissimilarity based on one-way SIMPER test (b) within Buddleja macrostachya complex.
Forests 15 01007 g0a1

References

  1. Cao, Q.; Zhang, X.; Gao, X.; Wang, L.; Jia, G. Effects of Ploidy Level on the Cellular, Photochemical and Photosynthetic Characteristics in Lilium FO Hybrids. Plant Physiol. Biochem. 2018, 133, 50–56. [Google Scholar] [CrossRef]
  2. Van de Peer, Y.; Mizrachi, E.; Marchal, K. The Evolutionary Significance of Polyploidy. Nat. Rev. Genet. 2017, 18, 411–424. [Google Scholar] [CrossRef]
  3. Palacio-López, K.; Beckage, B.; Scheiner, S.; Molofsky, J. The Ubiquity of Phenotypic Plasticity in Plants: A Synthesis. Ecol. Evol. 2015, 5, 3389–3400. [Google Scholar] [CrossRef]
  4. Guignard, M.S.; Nichols, R.A.; Knell, R.J.; Macdonald, A.; Romila, C.A.; Trimmer, M.; Leitch, I.J.; Leitch, A.R. Genome Size and Ploidy Influence Angiosperm Species’ Biomass Under Nitrogen and Phosphorus Limitation. New Phytol. 2016, 210, 1195–1206. [Google Scholar] [CrossRef]
  5. Wei, N.; Cronn, R.; Liston, A.; Ashman, T.L. Functional Trait Divergence and Trait Plasticity Confer Polyploid Advantage in Heterogeneous Environments. New Phytol. 2019, 221, 2286–2297. [Google Scholar] [CrossRef]
  6. Zhang, Y.; Wang, B.; Qi, S.; Dong, M.; Wang, Z.; Li, Y.; Chen, S.; Li, B.L.; Zhang, J. Ploidy and Hybridity Effects on Leaf Size, Cell Size and Related Genes Expression in Triploids, Diploids and Their Parents in Populus. Planta 2019, 249, 635–646. [Google Scholar] [CrossRef]
  7. Wang, L.J.; Cao, Q.Z.; Zhang, X.Q.; Jia, G. Effects of Polyploidization on Photosynthetic Characteristics in Three Lilium Species. Sci. Hortic. 2021, 2284, 110098. [Google Scholar] [CrossRef]
  8. López-Jurado, J.; Mateos-Naranjo, E.; Balao, F. Polyploidy Promotes Divergent Evolution Across the Leaf Economics Spectrum and Plant Edaphic Niche in the Dianthus broteri Complex. J. Ecol. 2022, 110, 605–618. [Google Scholar] [CrossRef]
  9. Alix, K.; Gérard, P.R.; Schwarzacher, T.; Heslop-Harrison, J.S. Polyploidy and Interspecific Hybridization: Partners for Adaptation, Speciation and Evolution in Plants. Ann. Bot. 2017, 120, 183–194. [Google Scholar] [CrossRef]
  10. Baker, R.L.; Yarkhunova, Y.; Vidal, K.; Ewers, B.E.; Weinig, C. Polyploidy and the Relationship between Leaf Structure and Function: Implications for Correlated Evolution of Anatomy, Morphology, and Physiology in Brassica. BMC Plant Biol. 2017, 17, 3. [Google Scholar] [CrossRef]
  11. Violle, C.; Navas, M.; Vile, D.; Kazakou, E.; Fortunel, C.; Hummel, I.; Garnier, E. Let the Concept of Trait be Functional! Oikos 2007, 116, 882–892. [Google Scholar] [CrossRef]
  12. Chen, G.; Sun, W.B.; Sun, H. Morphological Characteristics of Leaf Epidermis and Size Variation of Leaf, Flower and Fruit in Different Ploidy Levels in Buddleja macrostachya (Buddlejaceae). J. Syst. Evol. 2009, 47, 231–236. [Google Scholar] [CrossRef]
  13. Hulshof, C.M.; Swenson, N.G. Variation in Leaf Functional Trait Values within and Across Individuals and Species: An Example from a Costa Rican Dry Forest. Funct. Ecol. 2010, 24, 217–223. [Google Scholar] [CrossRef]
  14. Blonder, B.; Violle, C.; Enquist, B.J. Assessing the Causes and Scales of the Leaf Economics Spectrum Using Venation Networks in Populus tremuloides. J. Ecol. 2013, 101, 981–989. [Google Scholar] [CrossRef]
  15. Onoda, Y.; Wright, I.J.; Evans, J.R.; Hikosaka, K.; Kitajima, K.; Niinemets, Ü.; Poorter, H.; Tosens, T.; Westoby, M. Physiological and Structural Tradeoffs Underlying the Leaf Economics Spectrum. New Phytol. 2017, 214, 1447–1463. [Google Scholar] [CrossRef]
  16. Liu, Y.; Dawson, W.; Prati, D.; Haeuser, E.; Feng, Y.; van Kleunen, M. Does Greater Specific Leaf Area Plasticity Help Plants to Maintain a High Performance When Shaded? Ann. Bot. 2016, 118, 1329–1336. [Google Scholar] [CrossRef]
  17. Yao, X.; Li, C.; Li, S.; Zhu, Q.; Zhang, H.; Wang, H.; Yu, C.; Martin, S.K.S.; Xie, F. Effect of Shade on Leaf Photosynthetic Capacity, Light-intercepting, Electron Transfer and Energy Distribution of Soybeans. Plant Growth Regul. 2017, 83, 409–416. [Google Scholar] [CrossRef]
  18. Scoffoni, C.; Rawls, M.; McKown, A.; Cochard, H.; Sack, L. Decline of Leaf Hydraulic Conductance with Dehydration: Relationship to Leaf Size and Venation Architecture. Plant Physiol. 2011, 156, 832–843. [Google Scholar] [CrossRef]
  19. Fan, Z.X.; Sterck, F.; Zhang, S.B.; Fu, P.L.; Hao, G.Y. Tradeoff between Stem Hydraulic Efficiency and Mechanical Strength Affects Leaf–stem Allometry in 28 Ficus Tree Species. Front. Plant Sci. 2017, 8, 1619. [Google Scholar] [CrossRef]
  20. Wright, I.J.; Reich, P.B.; Westoby, M.; Ackerly, D.D.; Baruch, Z.; Bongers, F.; Cavender-Bares, J.; Chapin, T.; Cornelissen, J.H.; Diemer, M.; et al. The Worldwide Leaf Economics Spectrum. Nature 2004, 428, 821–827. [Google Scholar] [CrossRef]
  21. Pritzkow, C.; Szota, C.; Williamson, V.G.; Arndt, S.K. Phenotypic Plasticity of Drought Tolerance Traits in a Widespread Eucalypt (Eucalyptus obliqua). Forests 2020, 11, 1371. [Google Scholar] [CrossRef]
  22. Grether, G.F. Environmental Change, Phenotypic Plasticity, and Genetic Compensation. Am. Nat. 2005, 166, E115–E123. [Google Scholar] [CrossRef]
  23. Reich, P.B. The World-wide ‘Fast–Slow’ Plant Economics Spectrum: A Traits Manifesto. J. Ecol. 2014, 102, 275–301. [Google Scholar] [CrossRef]
  24. Chen, G.; Sun, W.B.; Sun, H. Ploidy Variation in Buddleja L. (Buddlejaceae) in the Sino-Himalayan Region and Its Biogeographical Implications. Bot. J. Linn. Soc. 2007, 154, 305–312. [Google Scholar] [CrossRef]
  25. Chen, Y.; Xu, S.; Meng, L.Z.; Wang, S.; Chen, Y.; Gong, W. Ploidy Differentiation and Floral Scent Divergence in Buddleja macrostachya (Scrophulariaceae) Complex. Biochem. Syst. Ecol. 2021, 96, 104271. [Google Scholar] [CrossRef]
  26. McKown, A.D.; Guy, R.D.; Klápště, J.; Geraldes, A.; Friedmann, M.; Cronk, Q.C.; El-Kassaby, Y.A.; Mansfield, S.D.; Douglas, C.J. Geographical and Environmental Gradients shape Phenotypic Trait Variation and Genetic Structure in Populus trichocarpa. New Phytol. 2014, 201, 1263–1276. [Google Scholar] [CrossRef]
  27. Hu, Y.K.; Zhang, Y.L.; Liu, G.F.; Pan, X.; Yang, X.; Li, W.B.; Dai, W.H.; Tang, S.L.; Tao, X.; Chen, L.Y.; et al. Intraspecific N and P Stoichiometry of Phragmites australis: Geographic Patterns and Variation Among Climatic Regions. Sci. Rep. 2017, 7, 43018. [Google Scholar] [CrossRef]
  28. Osnas, J.L.; Katabuchi, M.; Kitajima, K.; Wright, S.J.; Reich, P.B.; Van Bael, S.A.; Kraft, N.J.; Samaniego, M.J.; Pacala, S.W.; Lichstein, J.W. Divergent Drivers of Leaf Trait Variation within Species, Among Species, and Among Functional Groups. Proc. Natl. Acad. Sci. USA 2018, 115, 5480–5485. [Google Scholar] [CrossRef]
  29. Midolo, G.; De Frenne, P.; Hölzel, N.; Wellstein, C. Global Patterns of Intraspecific Leaf Trait Responses to Elevation. Global Chang. Biol. 2019, 25, 2485–2498. [Google Scholar] [CrossRef]
  30. Akram, M.A.; Wang, X.; Shrestha, N.; Zhang, Y.; Sun, Y.; Yao, S.; Li, J.; Hou, Q.; Hu, W.; Ran, J.; et al. Variations and Driving Factors of Leaf Functional Traits in the Dominant Desert Plant Species Along an Environmental Gradient in the Drylands of China. Sci. Total Environ. 2023, 897, 165394. [Google Scholar] [CrossRef]
  31. Liu, W.S.; Li, Z.; Danhui, Q. Variation in Leaf Traits at Different Altitudes Reflects the Adaptive Strategy of Plants to Environmental Changes. Ecol. Evol. 2020, 10, 8166–8175. [Google Scholar] [CrossRef]
  32. Smart, S.M.; Glanville, H.C.; Blanes, M.C.; Mercado, L.M.; Emmett, B.A.; Jones, D.L.; Cosby, B.; Marrs, R.H.; Butler, A.B.; Marshall, M.R.; et al. Leaf Dry Matter Content is Better at Predicting Above-ground Net Primary Production Than Specific Leaf Area. Funct. Ecol. 2017, 31, 1336–1344. [Google Scholar] [CrossRef]
  33. Liu, X.; Chen, H.; Sun, T.; Li, D.; Wang, X.; Mo, W.; Wang, R.; Zhang, S. Variation in Woody Leaf Anatomical Traits Along the Altitudinal Gradient in Taibai Mountain, China. Glob. Ecol. Conserv. 2021, 26, e01523. [Google Scholar] [CrossRef]
  34. Zhang, F.; Lu, K.; Gu, Y.; Zhang, L.; Li, W.; Li, Z. Effects of Low-temperature Stress and Brassinolide Application on the Photosynthesis and Leaf Structure of TungTree Seedlings. Front. Plant Sci. 2020, 10, 1767. [Google Scholar] [CrossRef]
  35. Zou, Z.; Zeng, F.; Zeng, Z.; Du, H.; Tang, H.; Zhang, H. The Variation in the Stoichiometric Characteristics of the Leaves and Roots of Karst Shrubs. Forests 2021, 12, 852. [Google Scholar] [CrossRef]
  36. Bao, S.D. Soil and Agricultural Chemistry Analysis, 3rd ed.; China Agriculture Press: Beijing, China, 2000. [Google Scholar]
  37. Hammer, Ø.; Harper, D.A.T.; Ryan, P.D. PAST: Paleontological Statistics Software Package for Education and Data Analysis. Palaeontol. Electron. 2001, 4, 83–93. [Google Scholar]
  38. Brooker, R.; Brown, L.K.; George, T.S.; Pakeman, R.J.; Palmer, S.; Ramsay, L.; Schöb, C.; Schurch, N.; Wilkinson, M.J. Active and Adaptive Plasticity in a Changing Climate. Trends Plant Sci. 2022, 27, 717–728. [Google Scholar] [CrossRef]
  39. Cai, J.; Pan, X.; Xiao, Y.; Wang, Y.; Li, G.; Wang, Y.; Zhang, M.; Wang, L. Below-ground Root Nutrient-acquisition Strategies are More Sensitive to Long-term Grazing Than Above-ground Leaf Traits Across a Soil Nutrient Gradient. Funct. Ecol. 2024, 1–11. [Google Scholar] [CrossRef]
  40. Everingham, S.E.; Offord, C.A.; Sabot, M.E.; Moles, A.T. Leaf Morphological Traits Show Greater Responses to Changes in Climate Than Leaf Physiological Traits and Gas Exchange Variables. Ecol. Evol. 2024, 14, e10941. [Google Scholar] [CrossRef]
  41. Deguchi, R.; Koyama, K. Photosynthetic and Morphological Acclimation to High and Low Light Environments in Petasites japonicus subsp. giganteus. Forests 2020, 11, 1365. [Google Scholar] [CrossRef]
  42. Amoako, F.K.; Sagervanshi, A.; Hussain, M.A.; Pitann, B.; Mühling, K.H. Transcriptional and Physiological Analyses Uncover the Mineralization and Uptake Mechanisms of Phytic acid in Symbiotically Grown Vicia faba plants. Plant Physiol. Bioch. 2024, 211, 108723. [Google Scholar] [CrossRef]
  43. Zhang, J.; He, N.; Liu, C.; Xu, L.; Yu, Q.; Yu, G. Allocation Strategies for Nitrogen and Phosphorus in Forest Plants. Oikos 2018, 127, 1506–1514. [Google Scholar] [CrossRef]
  44. Cao, J.; Hong, P.; Zhan, C.; He, S. Dynamics in Stoichiometric Traits and Carbon, Nitrogen, and Phosphorus Pools Across Three Different-aged Picea asperata Mast. Plantations on the Eastern Tibet Plateau. Forests 2020, 11, 1346. [Google Scholar] [CrossRef]
  45. Wang, Y.L.; Li, L.; Paudel, B.R.; Zhao, J.L. Genomic Insights into High-Altitude Adaptation: A Comparative Analysis of Roscoea alpina and R. purpurea in the Himalayas. Int. J. Mol. Sci. 2024, 25, 2265. [Google Scholar] [CrossRef]
  46. Van Laere, K.; Van Huylenbroeck, J.; Van Bockstaele, E. Introgression of Yellow Flower Colour in Buddleja davidii by Means of Polyploidisation and Interspecific Hybridisation. Hortic. Sci. 2011, 38, 96–103. [Google Scholar] [CrossRef]
  47. Pérez-Ramos, I.M.; Matías, L.; Gómez-Aparicio, L.; Godoy, Ó. Functional Traits and Phenotypic Plasticity Modulate Species Coexistence Across Contrasting Climatic Conditions. Nat. Commun. 2019, 10, 2555. [Google Scholar] [CrossRef]
  48. Aycan, M.; Nahar, L.; Baslam, M.; Mitsui, T. Transgenerational Salinity Tolerance Plasticity in Rice: Unraveling Nongenetic Phenotypic Modifications and Environmental Influences. J. Exp. Bot. 2024, erae211. [Google Scholar] [CrossRef]
  49. Uyeda, J.C.; Hansen, T.F.; Arnold, S.J.; Pienaar, J. The Millionyear Wait for Macroevolutionary Bursts. Proc. Natl. Acad. Sci. USA 2011, 108, 15908–15913. [Google Scholar] [CrossRef]
  50. Henn, J.J.; Buzzard, V.; Enquist, B.J.; Halbritter, A.H.; Klanderud, K.; Maitner, B.S.; Michaletz, S.T.; Pötsch, C.; Seltzer, L.; Telford, R.J.; et al. Intraspecific Trait Variation and Phenotypic Plasticity Mediate Alpine Plant Species Response to Climate Change. Front. Plant Sci. 2018, 9, 408249. [Google Scholar] [CrossRef]
  51. Love, J.M.; Ferris, K.G. Local Adaptation to an Altitudinal Gradient: The Interplay Between Mean Phenotypic Trait Variation and Phenotypic Plasticity in Mimulus laciniatus. Perspect. Plant Ecol. 2024, 63, 125795. [Google Scholar] [CrossRef]
  52. De Storme, N.; Mason, A. Plant Speciation Through Chromosome Instability and Ploidy Change: Cellular Mechanisms, Molecular Factors and Evolutionary Relevance. Curr. Plant Biol. 2014, 1, 10–33. [Google Scholar] [CrossRef]
  53. Seguí, J.; Lázaro, A.; Traveset, A.; Salgado-Luarte, C.; Gianoli, E. Phenotypic and Reproductive Responses of an Andean Violet to Environmental Variation Across an Elevational Gradient. Alp. Bot. 2018, 128, 59–69. [Google Scholar] [CrossRef]
Figure 1. Tetraploid (a) and octaploid (b) Buddleja macrostachya, as well as the study sites (c) located in the Sino-Himalayan region.
Forests 15 01007 g001
Figure 2. Leaf anatomical structure of tetraploid (a) and octaploid (b) Buddleja macrostachya. Scale bar = 100 μm.
Forests 15 01007 g002
Figure 3. Phenotypic plasticity of leaf functional traits in tetraploid and octaploid Buddleja macrostachya. LA, leaf area; SLA, specific leaf area; LMA, leaf mass per unit area; LDMC, leaf dry matter content; T, leaf thickness; TUEC, thickness of upper epidermis cell; Tmes, thickness of mesophyll tissue; CTR, leaf cell tense ratio; SR, leaf spongy ratio; P/S, palisade tissue/spongy ratio; PN, net photosynthetic rate; gs, stomatal conductance; Ci, intercellular CO2 concentration; Tr, transpiration rate; VpdL, vapor pressure deficit; WUE, leaf water-use efficiency; LUE, light-use efficiency; C, carbon; N, nitrogen; P, phosphorus.
Forests 15 01007 g003
Figure 4. Redundancy analysis (RDA) biplot of leaf functional traits and abiotic environmental factors within Buddleja macrostachya complex. LA, leaf area; SLA, specific leaf area; LMA, leaf mass per unit area; LDMC, leaf dry matter content; T, leaf thickness; TUEC, thickness of upper epidermis cell; Tmes, thickness of mesophyll tissue; CTR, leaf cell tense ratio; SR, leaf spongy ratio; P/S, palisade tissue/spongy ratio; PN, net photosynthetic rate; gs, stomatal conductance; Ci, intercellular CO2 concentration; Tr, transpiration rate; VpdL, vapor pressure deficit; WUE, leaf water-use efficiency; LUE, light-use efficiency; C, carbon; N, nitrogen; P, phosphorus; SOC, soil organic carbon; STN, soil total nitrogen; STP, soil total phosphorus.
Forests 15 01007 g004
Figure 5. Pearson’s correlation between leaf functional traits and abiotic environmental factors within the Buddleja macrostachya complex. LA, leaf area; SLA, specific leaf area; LMA, leaf mass per unit area; LDMC, leaf dry matter content; T, leaf thickness; TUEC, thickness of upper epidermis cell; Tmes, thickness of mesophyll tissue; CTR, leaf cell tense ratio; SR, leaf spongy ratio; P/S, palisade tissue/spongy ratio; PN, net photosynthetic rate; gs, stomatal conductance; Ci, intercellular CO2 concentration; Tr, transpiration rate; VpdL, vapor pressure deficit; WUE, leaf water-use efficiency; LUE, light-use efficiency; C, carbon; N, nitrogen; P, phosphorus; SOC, soil organic carbon; STN, soil total nitrogen; STP, soil total phosphorus. * p <= 0.05; ** p <= 0.01; *** p <= 0.001.
Forests 15 01007 g005
Table 1. Geographic and environmental conditions of different populations of tetraploids and octoploids B. macrostachya in the Sino-Himalayan region.
PopulationsAbbreviationPloidyAltitude (m)LatitudeLongitudeAverage
Annual Air Temperature (°C)
Average
Annual
Precipitation (mm)
Daxueshan, LincangDXSTetraploids2012N 24°06′50.18″E 99°56′15.32″23.31032
Fengchunling, YuangyangFCLTetraploids1562N 23°00′12.22″E 103°01′58.35″17.91562.3
Baohua, HongheBHTetraploids1205N 23°12′44.35″E 102°12′44.35″24.51150
Shuangjiang, LincangSJTetraploids1983N 23°38′32.83″E 100°01′58.32″19.5995.3
Hepingzi, YuanjiangHPZTetraploids2117N 23°40′00.70″E 101°45′51.46″17946
Daweishan, PingbianDWSTetraploids2100N 22°54′28.09″E 103°41′56.12″162012
Adebo, JinpingADBTetraploids2115N 22°54′03.05″E 103°12′07.68″211500
Xiaoheishan, LonglingXHSTetraploids2487N 24°29′49.30″E 98°51′24.88″16.41699
Meidong, LvcunMDTetraploids1600N 23°0′12.99″ E 102°31′2.45″ 16.62400
Laozhai, MengziLZOctoploids2566N 23°23′36.53″ E 103°48′29.86″141273.4
Jinxingshan, LonglingJXSOctoploids2164N 24°35′03.59″E 98°54′23.44″14.91837.7
Yongcui, NanjianYCOctoploids2413N 24°56′08.28″E 100°23′30.10″27867.6
Gaoligongshan, LushuiGLGSOctoploids3105N 25°58′21.21″E 98°41′1.87″111667
Cangshan, DaliCSOctoploids1561N 23°00′14.93″E 100°06′06.83″15.71078
Xima, DehongXMOctoploids1951N 24°42′53.85″E 97°44′32.23″161552
Bozhushan, WenshanBZSOctoploids2201N 23°21′40.96″ E 103°54′22.13″22.61054
Baicaoling, DayaoBCLOctoploids3000N 26°05′9.84″ E 101°09′7.06″17.2793
Wujiexiang, ChuxiongWJXOctoploids2487N 25°04′10.68″ E 101°0′53.32″15.5893.8
Table 2. Comparison of leaf morphological, anatomical, photosynthetic, and stoichiometric characteristics (mean ± SE) in tetraploid and octaploid Buddleja macrostachya.
Leaf Functional TraitsTetraploid
(Mean ± SE)
Octaploid
(Mean ± SE)
Significance
Morphological traits (n = 45)
LA (cm2)165.62 ± 26.69137.5 ± 34.45*
SLA (m2 kg−1)111.00 ± 9.57134.45 ± 8.90*
LMA (g m2)101.65 ± 12.4881.01 ± 5.38*
LDMC (g g−1)0.23 ± 0.020.21 ± 0.01*
Anatomical traits (n = 45)
T (μm)126.64 ± 2.4197.75 ± 1.42*
TUEC (μm)18.30 ± 0.809.08 ± 0.28*
Palisade (μm)51.53 ± 1.8144.72 ± 1.35*
Spongy (μm)41.36 ± 1.7330.92 ± 1.27*
Tmes (μm)92.89 ± 1.6575.64 ± 0.89*
CTR (%)40.91 ± 1.4445.87 ± 1.34*
SR (%)32.69 ± 1.2631.6 ± 1.20NS
P/S1.33 ± 0.111.56 ± 0.14NS
Photosynthetic traits (n = 45)
PN (μmol CO2 m−2 s−1)20.85 ± 0.4823.97 ± 1.67NS
gs (mol H2O m−2 s−1)0.37 ± 0.020.30 ± 0.03*
Ci (μmol μmol−1)314.79 ± 4.83305.21 ± 5.15*
Tr (mmol H2O m−2 s−1)6.97 ± 0.275.37 ± 0.48*
VpdL (KPa)1.91 ± 0.101.74 ± 0.08*
WUE (μmol mmol)3.08 ± 0.136.90 ± 2.14*
LUE (mol mol0.03 ± 00.04 ± 0.01*
Stoichiometric characteristics (n = 27)
C (mg g−1)441.47 ± 2.14444.02 ± 2.52NS
N (mg g−1)19.04 ± 0.6125.06 ± 0.66*
P (mg g−1)1.71 ± 0.072.25 ± 0.06*
C:N Ratio23.77 ± 0.8218.10 ± 0.56*
C:P Ratio269.53 ± 12.30202.28 ± 7.01*
N:P Ratio11.29 ± 0.2411.25 ± 0.28NS
Note: LA, leaf area; SLA, specific leaf area; LMA, leaf mass per unit area; LDMC, leaf dry matter content; T, leaf thickness; TUEC, thickness of upper epidermis cell; Tmes, thickness of mesophyll tissue; CTR, leaf cell tense ratio; SR, leaf spongy ratio; P/S, palisade tissue/spongy ratio; PN, net photosynthetic rate; gs, stomatal conductance; Ci, intercellular CO2 concentration; Tr, transpiration rate; VpdL, vapor pressure deficit; WUE, leaf water-use efficiency; LUE, light-use efficiency; C, carbon; N, nitrogen; P, phosphorus. *, significant differences at p < 0.05 (t-test); NS, non-significant difference at p > 0.05 (t-test).
Table 3. Comparison of soil C:N:P stoichiometry in tetraploid and octaploid Buddleja macrostachya.
CytotypeSOCSTNSTPC:NC:PN:P
(mg g−1)(mg g−1)(mg g−1)
Tetraploid22.87 ± 2.270.99 ± 0.100.50 ± 0.0523.53 ± 1.1753.47 ± 7.332.19 ± 0.22
Octaploid33.20 ± 3.091.53 ± 0.140.93 ± 0.1221.67 ± 0.9948.35 ± 6.432.12 ± 0.22
Significance***NSNSNS
Note: SOC, soil organic carbon; STN, soil total nitrogen; STP, soil total phosphorus. Data in the table are mean ± SE (n = 27), *, significant differences at p < 0.05 (t-test); NS, non-significant difference at p > 0.05 (t-test).
Disclaimer/Publisher’s Note: The statements, opinions and data contained in all publications are solely those of the individual author(s) and contributor(s) and not of MDPI and/or the editor(s). MDPI and/or the editor(s) disclaim responsibility for any injury to people or property resulting from any ideas, methods, instructions or products referred to in the content.

