Article

Alien vs. Native—Influence of Fallow Deer (Dama dama) Introduction on the Native Roe Deer (Capreolus capreolus) Population

by
Jakub Gryz
1,
Dagny Krauze-Gryz
2,* and
Karolina D. Jasińska
2
1
Department of Forest Ecology, Forest Research Institute, Braci Leśnej 3, Sękocin Stary, 05-090 Raszyn, Poland
2
Department of Forest Zoology and Wildlife Management, Institute of Forest Sciences, Warsaw University of Life Sciences WULS-SGGW, Nowoursynowska 159, 02-776 Warsaw, Poland
*
Author to whom correspondence should be addressed.
Forests 2024, 15(6), 1014; https://doi.org/10.3390/f15061014
Submission received: 24 April 2024 / Revised: 6 June 2024 / Accepted: 7 June 2024 / Published: 11 June 2024
(This article belongs to the Special Issue Wildlife Ecology and Conservation in Forest Habitats)

Abstract

:
Fallow deer is one of the most widespread alien mammals in Europe. We documented the response of the roe deer population shortly after the fallow deer was introduced to a hunting ground in central Poland. Mean roe density dropped from 17.6 ind./100 ha to 10.5 ind./100 ha after the alien species was introduced. In the reference area, where fallow deer was absent, the roe deer density did not change in the analogue study period. At both study sites, mean roe deer productivity before fallow deer introduction was similar (1.6 juv./female). However, in the first study area, the productivity dropped to 1.4, while in the reference study area, it slightly increased to 1.75. The presence of fallow deer influenced roe deer space use negatively, i.e., the number of pellet groups of roe deer decreased with an increase in the number of fallow deer feces. Overall, the introduction of the fallow deer was successful and the population grew quickly. Yet, the economic impact of its introduction was far from satisfactory. At the same time, its negative influence on the roe deer was apparent. This shows that the fallow deer is an alien species threatening local biodiversity.

1. Introduction

Alien species are recognized among the biggest threats to global biodiversity [1,2,3,4], with alien ungulates being no exception [5]. Nevertheless, predicting the impact of an alien species is not straightforward, as the same species can cause different types and magnitudes of impacts when introduced to different contexts [6]. The common fallow deer (Dama dama) is one of the most widespread alien mammals in Europe [7]. Its undoubtedly native geographic range is in Asia Minor [8,9,10], where fallow deer currently live in just one natural site in south-western Turkey [11,12]. Recent evidence suggests that Anatolia and the Balkans were the sole glacial refugia of the species [13]. In medieval times, the fallow deer became a popular species, being kept in fenced hunting grounds and in parks. In the following centuries, the deer’s geographic range expanded steadily because of numerous intentional introductions [9]. Currently, fallow deer live on all continents except Antarctica [14,15,16]. It is a widespread game, ornamental, and farmed species [8,15,16,17,18]. The number of individuals in captivity has already exceeded five million worldwide [19], and the number of free-living fallow deer keeps growing [18].
The exact time of the fallow deer’s introduction to Poland is unknown. Most likely, it was in the 17th century, but it may have been as early as the 13th century (review in ref. [20]). In recent decades, the number of fallow deer has grown rapidly for the following reasons: introductions by hunters (in 1987, the national program for the development of fallow deer population in Poland was accepted and supported by the government); escapes from captivity (in 1997, the fallow deer was listed as livestock) [21]; and transborder immigration [20]. In practice, there are no impediments to the introduction of fallow deer. Thus, each year, new populations are established by hunters. Officially, in March 2022, there were 35,540 fallow deer on hunting grounds in all of Poland [22]. Unfortunately, there is no scientifically based system for game monitoring in Poland. Yet, such mostly hunter-reported game statistics may be underestimated by as much as five-fold [23]. Nevertheless, fallow deer populations have clearly increased. In 2001, the fallow deer occurred in 6% of 4965 hunting grounds; in 2020, this figure rose to 19%. Similarly, in 2006, the fallow deer occurred in just one national park [24]; in the next 17 years it was reported in seven more national parks [25,26,27]. In the 1970s, the fallow deer was present mostly in the western Poland, with some single localities in central Poland. Currently, this species inhabits the whole country [22,27,28]. The number of hunted animals has also increased, i.e., from 1412 ind. in 1990 to 10,117 in the 2021/2022 hunting season [9,22]. The number of captively bred animals (i.e., animals for venison production, further introductions, and scientific, educational, or ornamental purposes) has also grown rapidly. It is estimated that this number increased from less than 200 in 1990 to 16,000 in 2012 [20,29,30]. Importantly, the fallow deer is not included in the List of Invasive Alien Species of European Union concern [31], so its number is expected to grow further.
The fallow deer is a highly adaptable species that thrives in a range of ecosystems and shows a very wide spectrum of food preferences [15]. It also presents great behavioral and social flexibility, including several mating tactics [32]. Fallow deer have proven able to compete for feeding resources with native cervids, with food niche overlap exceeding 50% [33]. Its negative impact on roe deer Capreolus capreolus have been clearly documented, e.g., [34,35]. In Italy, this smaller cervid avoided sites heavily penetrated by the fallow deer, and in areas of high density of the fallow deer, roe deer were rare [36]. This alien species was also shown to be able to compete successfully at feeding sites with red deer Cervus elaphus [37]. The fallow deer is a host for many species of parasite that might infect native cervids [38], livestock and humans (review in: ref. [16]). It has also been shown to impact native flora and natural habitats negatively [39,40,41,42,43,44,45].
Previous studies have documented relations between the fallow and the roe deer in areas where both species have coexisted for a long time, e.g., [35,36]. In our case, we documented the response of the roe deer population shortly after the fallow deer was introduced. The aim of the study was to assess the effect of the fallow deer introduction on the local roe deer population. First, we used two population indices, i.e., population density and productivity. We assumed that if the roe is negatively affected by competition with the fallow deer, the two indices will decrease after the fallow deer is introduced. We compared those with analogue indices but calculated for a nearby population (assumed to be affected by similar environmental conditions but unaffected by the fallow deer). Finally, we also assumed that the roe deer, as a competitively weaker species, will avoid areas that are highly penetrated by the fallow deer, i.e., its spatial distribution will be negatively affected by the presence of the fallow deer. We also supposed that this effect would be weaker in areas where the fallow deer is present for a long time. We also tried to assess income and spending connected to the fallow deer’s presence to robustly assess the economic results of its introduction.

2. Materials and Methods

2.1. Study Area

This study was conducted in central Poland, a region that is affected by the mild oceanic climate of Western Europe and the harsh and dry continental climate of Eastern Europe and Asia. The growing season lasts for ca 210 days; the total precipitation equals ca 600 mm per year; and the mean ambient temperature ranges from −4 °C in January to +18 °C in July. A mosaic of fields and forests dominates the landscape of this part of Poland. The percentage share of forest cover is the lowest in Poland and does not exceed 20%.
The first study area was over 1000 ha in Głuchów forest (51°45′11.8″ N, 20°06′24.1″ E). In January 2008, fallow deer started to be introduced there in order to increase the profitability of game management. The forest is surrounded by open fields, woodlots, and the Rawka River valley (a nature reserve); fish ponds border the forest to the south. The main tree species is Scots pine (Pinus sylvestris) with an admixture of oaks (Quercus spp.). Black alder (Alnus glutinosa) dominates part of the forest.
The second (and the reference to Głuchów) study area (Strzelna) was located near Rogów village (51°49’17.98″ N, 19°53’54.15″ E) in a smaller (710 ha in total) and fragmented forest, covered by Scots pine and oaks with an admixture of larch (Larix decidua) ca 15 km from the first study area. A busy, national road and a railway cut through the forested area. Surrounding arable fields and meadows mostly belong to private owners. The fallow deer was absent from this area.
Both study areas belong to Warsaw University of Life Sciences and are managed by the Experimental Forest Station in Rogów. The two aforementioned study sites were located in central parts of two hunting grounds (their areas being 5917 ha and 4575 ha, respectively) also managed by the university. The two study sites were separated by arable lands, sparse built-up areas, and a national road. In the first study area (Głuchów), fencing of young forest plantations was very rare prior to fallow deer introduction. In the second study site (Strzelna), most of deciduous plantations were fenced due to the high density of roe deer. In both study sites, chemical methods of forest protection against browsing were applied.
The third area was Spała Forest, located approximately 15 km south of the Głuchów forest. It is a big, compact forest complex to which the fallow deer was introduced before World War II, so the roe deer and the fallow deer have coexisted for decades. It is a part of Pilicka Forest, which is a forest complex of around 50,000 ha managed by the State Forests. It is pine-dominated and crosscut by the Pilica River. Our research was conducted in the northern part of the complex (Spała Forest Distrct) north of the Spała village (51°32′28″ N 20°08′17″ E).

2.2. Data Collection

2.2.1. Estimation of Fallow Deer Population Development after Its Introduction to the Głuchów Forest

At first, all released to the Głuchów forest (the first study area) animals had highly visible earrings, and their flight initiation distance was relatively short. Thus, during the first three years after the introduction (until 2011), their total abundance was assessed directly at feeding stations or in places where they tended to aggregate (such as meadows and food plots). When the population grew and most of the individuals were not marked, such a census was no longer possible. Density estimation by drive counts (see Section 2.2.2) was also not reliable as fallow deer tended to aggregate (thus either no individuals or the whole herd could be recorded). Therefore, we applied winter counts, aiming to assess an index showing a relative number of fallow deer for year-to-year comparisons. The counts were conducted in winter (December–February 2011/2012–2021/2022), on snowy and frosty days when fallow deer no longer stayed in open fields and congregated in mid-forest meadows, food plots, feeding stations, etc. All such known places were monitored by camera traps and additionally by direct observations. Data were captured by 12 camera traps (Reconyx HyperFire: PC90, PC800, PC850, PC900, RECONYX, Inc., Holmen, WI, USA), which were permanently located in the forest (see Section 2.2.3), and additional eight camera traps set in places where fallow deer were observed by local foresters or where their tracks/feeding signs were found. Simultaneously, direct observations were conducted by two or three people. Different spots in the forest where fallow deer aggregated were visited one by one during on the same day. Data from the camera traps and from direct observations (collected on the same day) were combined. The number of animals in a herd and their individual characteristics were taken into account. Finally, we pooled these observations to estimate a minimal number of fallow deer in the study site.

2.2.2. Estimation of Roe Deer Density Prior to and after Fallow Deer Introduction

The drive counts [46] were used to estimate roe deer density in the first study site (Głuchów forest) and in the second study area (Strzelna, no fallow deer, a reference area). The obtained results can be biased by a range of factors and the error produced can be high, e.g., [47]. Thus, we did not study year-to-year variation but compared data from longer periods of at least 10 years (see below). The drive counts were performed prior to fallow deer introduction (1997–2007, n = 10) and after introduction (2008–2018, n = 15). For the second study area, we used comparable data (1997–2007, n = 10 and 2008–2018, n = 11). The drive counts were performed by students of biology and forestry (WULS). In the first study area, they were performed every year in late October or at the beginning of November; in the second study area, they were carried out in early March (data from the Department of Forest Zoology and Wildlife Management, WULS). This difference was due to students’ schedule. Nevertheless, we did not compare data from the two study sites but compared data for each study site between the two periods. Animals were counted in selected plots (i.e., one plot consisted of one or two forest compartments). We censused ca 30% of the whole forest complex. The plots were selected in terms of stand age, species composition, and the distance from the forest edge. Observers stood 50–100 m apart (to maintain visual contact) around each rectangle plot. Around one hundred students were simultaneously involved. Next, the observers along three sides of the plot stayed in place, while those along the fourth side walked inward and through the entire area, rousing the animals from the plot. All observers recorded animals passing through the line of observers. Each person counted only animals passing by on their left side to avoid duplications [48]. On the basis of the number of observed roe deer within the plots and the total area of the plots, the density of animals per 100 ha was calculated.

2.2.3. Estimation of Roe Deer Productivity Prior to and after Fallow Deer Introduction

The number of offspring of roe deer was estimated in the first study site (Głuchów forest) and in the second study area (Strzelna, no fallow deer, a reference area). The counts were made prior to fallow deer introduction (2001–2007) and after introduction (2008–2018). Data from the same periods were compared in the second area, Strzelna. In both study areas, we estimated the number of roe deer offspring mostly on the basis of direct observations collected during extensive field work or by local foresters. In the second study period, apart from direct observations, data from camera traps were added. In the first study site, 12 camera traps were set in permanent spots to monitor ungulates [49]. In the second study site, data from camera traps that were used to monitor dens of carnivores were used [50]. We collected data between May (beginning of giving birth time) and the first days of October (when hunting season for females and fawns starts). Finally, we calculated the mean number of juveniles per female. We took under consideration only females with at least one (visible) young.

2.2.4. Spatial Relationship between Roe Deer and Fallow Deer

We used the faecal standing crop method [51] to show the relationship between fallow deer and roe deer distribution, i.e., that areas highly penetrated by fallow deer are potentially avoided by roe deer [52]. In Poland, leaves that fall down in October/November cover the feces [52], and disappearance of faces is lowest in winter [53]. Thus, we performed the counts in late March and the beginning of April (i.e., the period after the snow melt but before the vegetation started)., i.e., pellets that accumulated through late autumn–winter were counted. Because feces of both species may be misidentified [54], we applied a metric procedure to tell them apart [55]. The counts were performed in the two study areas in which the fallow deer was present. In 2021 and 2022, this was the first study area (Głuchów forest, where the fallow deer was recently introduced), and in 2021, this was the third study area (Spała forest, where the fallow deer had been present for decades). The counts were made along 2 m wide transects placed randomly within the forests. The number of pellet groups was recorded per each 80 m long section of a transect. The total length of transects equaled 54.1 km (676 80-m long stretches) in Głuchów, and 35.1 km (439 stretches) in Spała.
Additionally, behavioral observations of interactions between roe and fallow deer were conducted in the Głuchów forest. The whole description of the method and obtained results are shown in Appendix B.

2.2.5. Hunting Bag and Financial Data

Data on the hunting bag of fallow deer (Głuchów forest—the first study area) and roe deer (Głuchów and Strzelna forests), trophy mass and carcasses mass of fallow deer, costs of forest protection against cervids (fencing and repellents), and compensations paid to farmers for damage in which fallow deer were involved were provided by the Forest Experimental Station in Rogów. Data on the hunting bag of roe deer and fallow deer in the first and second study area refer to the total area of the hunting grounds. Data on 15-year spending (2008–2022) on supplementary feed (beets, carrot, corn, hay, apples, salt and others food types) for fallow deer was impossible to evaluate precisely. Thus, we roughly estimated a minimum value. We also added the costs of wooden feeding stations that were built before fallow deer were introduced. It was impossible to even roughly assess the costs of damage done by fallow deer in the forest. Finally, we only took into consideration the costs of fencing young forest plantations from the last 5 years (2016–2020), when population of fallow deer was relatively big. Moreover, before fallow deer introduction, this method was applied only accidentally. Robust final revenue and spending statistics were calculated according to current (2023) EUR price.
Additionally, data on death cases of fallow deer in the Głuchów forest were collected (2008–2022), i.e., any remnants found were recorded, and foresters and game managers were interviewed (Appendix A).

2.3. Statistical Analysis

The Mann–Kendall trend test was used to assess whether the time series presenting the abundance of fallow deer had a monotonic upward trend. We separately compared the density of roe deer in the two periods (before and after fallow deer introduction or analogue periods) and in the two areas, Głuchów (where fallow deer was introduced) and Strzelna (where fallow deer was absent. Although hunting bag might affect roe deer density, we skipped hunting bag in the analysis, because there was no correlation between these two variables (Appendix C). Nevertheless, we compared mean hunting bag values between the two periods. The Kruskal–Wallis test was used, as data did not follow normal distribution (Shapiro–Wilk test, p < 0.05). To compare roe deer productivity before and after fallow deer introduction in the two research areas (Głuchów and Strzelna), we used the Scheirer–Ray–Hare test, as data did not follow normal distribution (Shapiro–Wilk test, p < 0.05).
We used generalized linear models to explore the influence of the fallow deer on roe deer. We used the number of roe deer pellet groups as a response variable, and as exploratory variables, we used the number of fallow deer pellet groups in the area (Głuchów, Spała) and the interaction between number of fallow deer pellet groups and area. The half-normal plot with a simulated envelope (‘hnp’ package; [56]) was used to check models with Poisson, quasi-Poisson, and negative binomial distribution. A model with negative binomial distribution was chosen as the best one. Analyses were performed using R [57].

3. Results

3.1. Fallow Deer Population Development in Głuchów Forest

A total of 22 fallow deer were released in Głuchów forest (first study area), the first 10 individuals in 2008 and the next 10 in 2009. Additionally, one female and a calf were introduced in 2011. In the following years, the population grew steadily, and after 14 years, the minimum population abundance (in winter) was estimated at 69 individuals (Tau–Kendall trend test, S = 72, p < 0.001, Figure 1), which amounted to a population density of 6–7 individuals/100 ha of forest area. Between 2013 and the end of February 2022, 39 individuals were legally harvested. Over 16 years (up to summer 2023), we also documented 31 other cases of fallow deer deaths (Appendix A).

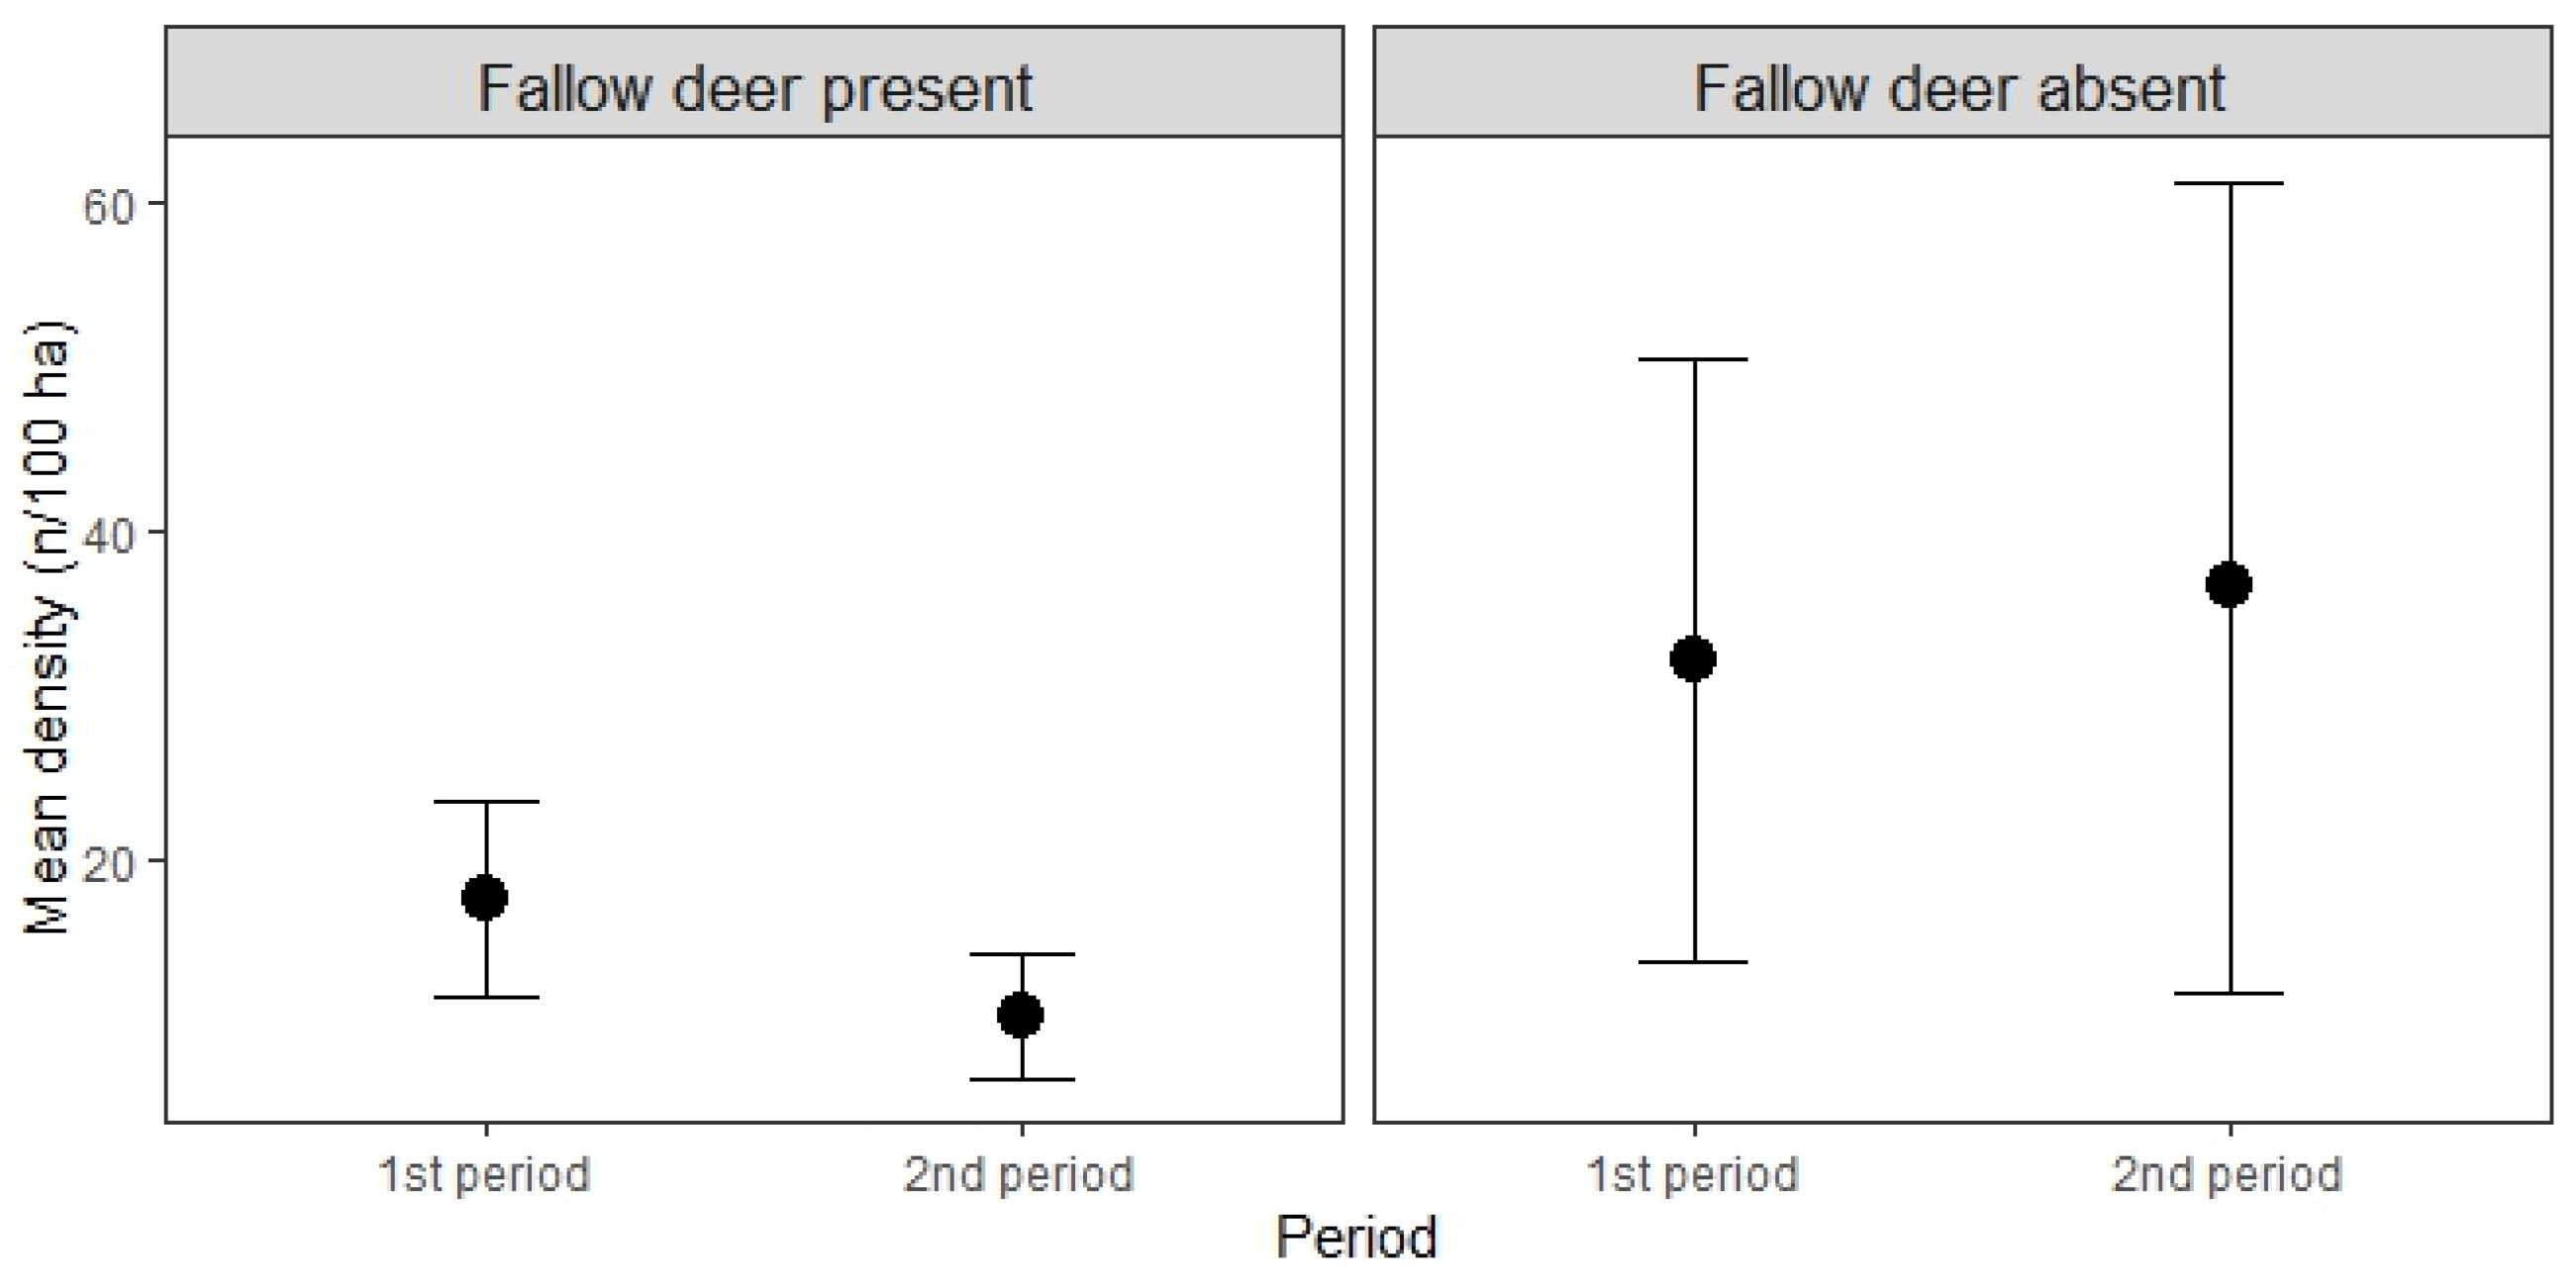
3.2. Changes in Roe Deer Density after Fallow Deer Introduction

Mean roe density before fallow deer introduction into the Głuchów forest (first study area) was 17.6 ind./100 ha and dropped after the introduction of fallow deer to 10.5 ind./100 ha (Kruskal–Wallis test = 9.0069, df = 1, p < 0.005). In the Strzelna forest (fallow deer absent, reference area), roe deer density was initially much higher, at 32.2 ind./100 ha, and did not change when compared to the second study period (Kruskal–Wallis test = 0.079494, df = 1, p > 0.05) (Figure 2). At the same time, a significant increase in the hunting bag of roe deer was recorded at both study sites. In the first study area, the hunting bag rose by 91%, i.e., from an average of 14.5 (2000–2007) to 27.7 (2008–2019) (Mann–Whitney test, Z = −2106, p < 0.05). However, in the second area, the reference area, the hunting bag rose by 127%, i.e., from 23.6 (2000–2007) to 53.6 (2008–2019) (Mann–Whitney test, Z = −2.518, p < 0.05).

3.3. Roe Deer Population Productivity before and after Fallow Deer Introduction

In both study sites, roe deer productivity in the first period (before 2008, i.e., pre-fallow deer introduction) was similar and accounted 1.6 juv./females. However, in the first study area, the productivity dropped to 1.4, while in the reference study area, it slightly increased to 1.75 (Figure 3). The results of Scheirer–Ray–Hare test showed that area and interaction between area and period influenced the productivity of the roe deer (Table 1).

3.4. Spatial Relationship between Roe Deer and Fallow Deer

Amongst three built models, the one with negative binomial distribution was selected as the optimal model. The model supported the hypothesis that the presence of fallow deer and area of the research influenced roe deer presence negatively, i.e., the number of pellet groups of roe deer decreased with the number of fallow deer feces and was lower in Spała forest (where fallow deer had been present for many years). The probability of roe deer presence was the lowest when both variables (presence of fallow deer in Spała forest) were combined (Table 2).

3.5. Economical Effect of Fallow Deer Introduction

The cost of purchase of fallow deer that were introduced to Głuchów forest (the first study area) was 5350 EUR. To the best of our knowledge and according to the official prices we assessed, the minimum cost of fallow deer feeding is at least EUR 1000. Compensation paid to farmers in the years 2008–2022 was at least EUR 1000. Spending on forest protection (fencing) related to fallow deer presence was around EUR 1500/year (adding up to EUR 7500 over five years). To summarize, all spending (assessed via the minimum level, cost of fallow deer introduction, and the cost of maintaining of their population) reached EUR 14,850. Between 2013 and February 2022, hunters shot 39 individuals, which gave 1040 kg of venison (and generated an income of EUR 2080). Trophies of 10 males produced revenue of EUR 1201. The heaviest trophy was 2.3 kg (the min 1.1 kg) (including the skull and excepting the jaw). Altogether, the total revenue (EUR 3281) did not reimburse the costs attributed to fallow deer.

4. Discussion

In our study, we showed that introduction of the fallow deer affected the roe deer population, which led to a decrease in the population density and productivity of this smaller and competitively weaker cervid. Interactions between the two species were antagonistic, and the fallow deer was always dominant (Appendix B). We also showed that in both areas, if the fallow deer had been introduced recently or had been present for decades, it similarly negatively affected space use by the roe deer. Finally, we pointed to the fact that the introduction of fallow deer did not increase the profitability of the hunting ground, which is often the reason for the introduction of this species.
The population of fallow deer developed very quickly after its introduction to Głuchów forest. The real number of fallow deer is expected to be even higher than that recorded by direct observations. Yet, our main goal was not to estimate its abundance precisely but to show how it grew over time. Moreover, some animals have migrated to the surrounding private forests, the nearby area of fish ponds, and the surrounding hunting grounds and could therefore not be registered [58]. Indeed, in 2022, the first fallow deer was spotted in the vicinity of Rogów (Strzelna, our reference area, from which fallow were absent). This was also the reason why the study finished at that time. This quick development of the fallow deer population in our case is in line with its sharp increase in Europe, which was higher than that recorded for native cervids [18].
We showed a sharp decrease in roe deer density in the area where the fallow deer had recently been introduced. This was in contrast to the nearby population, where the fallow deer was absent and roe deer grew in number. The roe deer is considered a selective feeder [59,60], being susceptible to competition from other cervids [52,61]. It was shown that the competition may affect its population trends more than weather conditions [34]. It is smaller than the fallow deer and relies on highly nutritional vegetation for survival and reproduction (review in: ref. [62]). In turn, the fallow deer is thought to be a strong competitor with the roe deer and other cervids (review in: [63]). Its great dietary flexibility in food sources [15,62,63] and habitat [15,64] use makes it a competitive species with native cervids. This alien species also shows high behavioral plasticity, shown through, e.g., modified aggregation or mating patterns [65,66].
Competition for food may be the main reason for the observed decrease in the productivity of the roe deer in the area where the fallow deer was introduced. For the roe deer, food availability (rather than fat reserves) is crucial for reproduction and reproductive success (review in [67]). In spring, the last months of pregnancy, highly nutritional forb-dominated feed is typical for the roe deer, while in the case of the fallow deer, a higher proportion of hemicellulose in the ingested food was noted [68]. Interference was particularly frequent at the latest stages of pregnancy, births, and early maternal care and was greater in solitary roe deer, i.e., females [62].
The abundance of the roe deer pellet groups was significantly lower in places (i.e., on the stretches) where the fallow deer was present, and this was true of both study sites (the one where fallow deer had recently been introduced and the one where it had been present for decades). It was shown that inter-specific competition from the fallow deer may influence the spatial behavior of roe deer [36]. Roe deer avoided areas where the local density of fallow deer was highest, and the roe deer occupancy was negatively affected by local abundance of fallow deer [34,62]. Densities of roe deer were great where fallow deer were rare and low where fallow deer were abundant [35]. It needs to be kept in mind that the abundance of pellet groups may not be a function of the number of individuals or of time spent in that place because defecation rates may depend on activity. Yet, pellet group counts can help to estimate relative habitat use and have been used for several decades in various contexts (review in [35]).
Our field experiment was disturbed by a significant increase in the hunting bag of roe deer in both study sites. This may be treated as an unsuspected result of the cost of fallow deer introduction and the rising costs of protecting forests against damage done by the fallow deer and game in general. There has been strong pressure to reduce populations of native ungulates in Poland, i.e., roe deer, red deer or moose Alces alces, due to the increasing problem of damage [69,70,71,72]. Ironically, new alien ungulate populations (fallow deer and mouflon Ovis aries musimon) were established all over the country [20,73] at the same time. Productivity of roe deer population is density-dependent [74,75]. Even though no correlation between hunting bag and population density was found, increased productivity might be an effect of stronger hunting pressure [76]. Nevertheless, increased hunting pressure was observed in the two study sites, while productivity increased only where the fallow deer was absent.
The fallow deer was introduced to our study site in order to increase game management profitability. However, 14 years after introduction, not even the costs of the introduced animals could not be reimbursed, and the financial results were roughly minus EUR 11,569. This deficit is unlikely to be reduced as the costs of forest protection and crop damage compensation have risen while venison prices have been quite stable. Additionally, trophy hunting is not of essential economic value as antlers are of rather low quality. It needs to be kept in mind that our financial estimates are rough due to data scarcity. Nevertheless, we counted costs cautiously, and they are under- rather than overestimated.
To conclude, the introduction of the fallow deer was definitely successful and its population grew quickly. Yet, the economic effect, assessed for the hunting ground, was far from satisfactory, which waives the argument that the introduction of this new species may bring some profits. At the same time, the fallow deer impacted the population of the native cervid, the roe deer. Consequently, the number of roe deer decreased, which we assumed was due to competition affecting productivity parameters. Pellet group analysis showed that the roe deer avoided spots heavily exploited by the fallow deer. This effect was shown regardless of the time that had passed from the introduction. This shows that the fallow deer should be considered an invasive species threatening local biodiversity. We believe that these days, with the range of field data supporting the competitive role of the fallow deer alongside native cervids (review in: [63]), this alien species should not be further introduced. At the same time, the harvest rate of the roe deer, as a competitively weaker species being affected by the alien species, should be kept low in areas where it must compete with fallow deer. The key point is to use reliable, science-based data to monitor the population of cervids. As has been shown for many alien and unquestionably invasive species, after they establish a new population and grow in number, their eradication is mostly impossible [7,77]. Thus, we claim that new populations of alien cervids must not be established.

Author Contributions

Conceptualization: J.G.; Data curation: J.G., D.K.-G.; Formal analysis: D.K.-G. and K.D.J.; Funding acquisition: J.G.; Investigation: J.G., D.K.-G. and K.D.J.; Methodology: J.G.; Project administration: J.G.; Visualization: D.K.-G. and K.D.J.; Writing—original draft: J.G., D.K.-G. and K.D.J.; and Writing—review and editing: J.G., D.K.-G. and K.D.J. All authors have read and agreed to the published version of the manuscript.

Funding

The research was partially financed by the Forests Research Institute, within the framework of the research topic entitled “Spatial, numerical and behavioural interactions between the fallow deer Dama dama and the roe deer Capreolus capreolus” (260123).

Data Availability Statement

The raw data supporting the conclusions of this article will be made available by the authors on request.

Acknowledgments

We are grateful to all who delivered data used in this paper, especially Dariusz Dałkowski and other employees of Experimental Forest Station in Rogów. We would like to thank two anonymous reviewers, whose suggestions helped us to review and improve the manuscript.

Conflicts of Interest

The authors declare no conflicts of interest.

Appendix A

Table A1. Causes of deaths of fallow deer in Głuchów forest (the first study area) in the years 2008–2022.
Cause of Deathn of Cases
Harvested by hunters39
Killed by stray dogs6
Died due to starvation *3
Trapped by a baller twine **2
Killed by car2
Drowned1
Poached1
Unidentified reasons16
* during the 2012/2013 winter season, which was characterized by very deep snow cover and low temperature [78]; ** antlers were entangled in baler twine (such ‘wig’ may be deadly as an animal can get trapped on branches and break their neck or die due to starvation).

Appendix B. Behavioral Interactions between Fallow and Roe Deer

Starting from the introduction of fallow deer into the Głuchów forest (the first study area), we recorded all interactions between fallow and roe deer (2008–2022) throughout the whole year. This was mostly carried out on the basis of direct observations conducted in the whole forest complex and in spots where fallow deer aggregated. Later, data from camera traps set to monitor fallow deer abundance and to monitor ungulates (see methods) were also included. We assumed that contact occurred between the two species when the animals stayed within 50 m of each other (Ferretti et al. 2011b). We defined three types of antagonistic interactions:
  • Direct attack of a fallow deer male on roe deer; roe deer is chased away.
  • Roe deer interrupts its previous activity and moves away when fallow deer approaches.
  • Roe deer waiting in the vicinity of a feeding place, young forest plantation, or margins of forest meadow until the fallow deer is gone.
Between 2008 and 2022, we observed 56 interactions between fallow and roe deer, and all of them were antagonistic: there were 6 direct attacks of fallow deer males on roe deer, 32 cases of roe deer escape when the fallow deer approached, and 18 cases when roe deer waited at a margin of a meadow or feeding station until the fallow deer left. Most of those observations were made at feeding stations and forest meadows, where fallow deer aggregated. We never observed reverse situations, e.g., fallow deer being attacked by or escaping from a roe deer. We never registered fallow and roe deer feeding simultaneously in the same place.

Appendix C. Correlation between Roe Deer Density and Hunting Bag in Two Research Areas

Figure A1. Correlation between roe deer density and hunting bag in two research areas (Głuchów—where the fallow deer had been introduced and Strzelna—where the fallow deer was absent).
Forests 15 01014 g0a1

References

  1. Craik, C. Long-term effects of North American Mink Mustela vison on seabirds in western Scotland. Bird Study 1997, 44, 303–309. [Google Scholar] [CrossRef]
  2. Simberloff, D. Eradication of island invasives: Practical actions and results achieved. Trends Ecol. Evol. 2001, 16, 273–274. [Google Scholar] [CrossRef]
  3. Bellard, C.; Cassey, P.; Blackburn, T.M. Alien species as a driver of recent extinctions. Biol. Lett. 2016, 12, 20150623. [Google Scholar] [CrossRef] [PubMed]
  4. Wauters, L.A.; Lurz, P.W.W.; Santicchia, F.; Romeo, C.; Ferrari, N.; Martinoli, A.; Gurnell, J. Interactions between native and invasive species: A systematic review of the red squirrel-gray squirrel paradigm. Front. Ecol. Evol. 2023, 11, 1083008. [Google Scholar] [CrossRef]
  5. Spear, D.; Chown, S. Non-indigenous ungulates as a threat to biodiversity. J. Zool. 2009, 279, 1–17. [Google Scholar] [CrossRef]
  6. Volery, L.; Jatavallabhula, D.; Scillitani, L.; Bertolino, S.; Bacher, S. Ranking alien species based on their risks of causing environmental impacts: A global assessment of alien ungulates. Glob. Chang. Biol. 2021, 27, 1003–1016. [Google Scholar] [CrossRef] [PubMed]
  7. Genovesi, P.; Bacher, S.; Kobelt, M.; Pascal, M.; Scalera, R. Alien Mammals of Europe. In Handbook of Alien Species in Europe, Invading Nature; Springer Series in Invasion Ecology; Springer: Dordrecht, The Netherlands, 2009; Volume 3, pp. 119–128. [Google Scholar]
  8. Chapman, D.; Chapman, N. Fallow Deer. Their History, Distribution and Biology; Terence Dalton Ltd.: Lavenham, Suffolk, UK, 1975. [Google Scholar]
  9. Dzięciołowski, R. Daniel; Warsaw University of Life Science: Warsaw, Poland, 1994. [Google Scholar]
  10. Masseti, M.; Cavallaro, A.; Pecchioli, E.; Vernesi, C. Artificial occurrence of the fallow deer, Dama dama dama (L, 1758), on the island of Rhodes (Greece): Insight from mtDNA Analysis. Hum. Evol. 2005, 21, 167–175. [Google Scholar] [CrossRef]
  11. Heidemann, G. Damwild, Cervus dama Linné, 1758, in Kleinasien. Bestand un Schutz. Säugetierkundliche Mitteilungen 1976, 24, 124–132. [Google Scholar]
  12. Marinis, A.D.; Masseti, M. Mammalian fauna of the Temessos National Park, Turkey. ZooKeys 2009, 31, 221–228. [Google Scholar] [CrossRef]
  13. Baker, K.H.; Miller, H.; Doherty, S.; Gray, H.W.I.; Daujat, J.; Çakırlar, C.; Spassov, N.; Trantalidou, K.; Madgwick, R.; Lamb, A.L.; et al. The 10,000-year biocultural history of fallow deer and its implications for conservation policy. Proc. Natl. Acad. Sci. USA 2024, 121, e2310051121. [Google Scholar] [CrossRef]
  14. Chapman, N.G.; Chapman, D.I. The distribution of fallow deer: A worldwide review. Mamm. Rev. 1980, 10, 61–138. [Google Scholar] [CrossRef]
  15. Esattore, B.; Saggiomo, L.; Sensi, M.; Vanessa, F.; Cherin, M. Tell me what you eat and I’ll tell you…where you live: An updated review of the worldwide distribution and foraging ecology of the fallow deer (Dama dama). Mamm. Biol. 2022, 102, 321–338. [Google Scholar] [CrossRef]
  16. Chankaya, C.; Dokora, A.; Muchenje, V.; Hoffman, L. The fallow deer (Dama spp); endangered of not? Zool. Gart 2016, 85, 160–172. [Google Scholar] [CrossRef]
  17. Apollonio, M. Dama dama (Linnaeus, 1758). In The Atlas of European Mammals; Mitchell-Jones, A.J., Amori, G., Bogdanowicz, W., Krystufek, B., Reijnders, P.J.H., Spitzenberger, F., Stubbe, M., Thissen, J.B.M., Vohralík, V., Zima, J., Eds.; T & AD Poyser Natural History: London, UK, 1999; pp. 1–484. [Google Scholar]
  18. Bijl, H.; Csányi, S. Fallow Deer (Dama dama). Population and Harvest Changes in Europe since the Early 1980s. Sustainability 2022, 14, 12198. [Google Scholar] [CrossRef]
  19. Daszkiewicz, T.; Hnatyk, N.; Dąbrowski, D.; Janiszewski, P.; Gugolek, A.; Kubiak, D.; Śmiecińska, K.; Winarski, R.; Koba-Kowalczyk, M. A comparison of the quality of the Longisissimus lumborum muscle from wild and farm raised fallow deer (Dama dama L). Small Rumin. Res. 2015, 129, 77–83. [Google Scholar] [CrossRef]
  20. Solarz, W. Dama dama (Linnaeus, 1758). In Gatunki Obce w Faunie Polski; Głowaciński, Z., Okarma, H., Pawłowski, J., Solarz, W., Eds.; Instytut Ochrony Przyrody PAN: Kraków, Poland, 2012. [Google Scholar]
  21. Kamieniarz, R.; Rzońca, Z. Metody oraz skala introdukcji, reintrodukcji i wsiedlania zwierzyny w Polsce. In Łowiectwo w Zrównoważonej Gospodarce Łowieckiej, Zimowa Szkoła Leśna; Gil, W., Ed.; Instytut Badawczy Leśnictwa: Sękocin Stary, Poland, 2015; pp. 91–103. [Google Scholar]
  22. Statistical Yearbook of Forestry; Central Statistical Office: Warsaw, Poland, 2022.
  23. Kamieniarz, R.; Jakubowski, M.; Dyderski, M.K.; Górecki, G.; Nasiadka, P.; Okarma, H.; Pudełko, M.; Skubis, J.; Tomek, A.; Wajdzik, M.; et al. Application of the tyraliera counting method to the large-scale inventory of red deer Cervus elaphus in the northern part of Western Pomerania, Poland. Ann. For. Res. 2023, 66, 33–34. [Google Scholar] [CrossRef]
  24. Jamrozy, G. Carnivores, even-toed ungulates, lagomorphs and large rodents in Polish national parks. Ann. Zool. Fenn. 2008, 45, 299–307. [Google Scholar] [CrossRef]
  25. Jamrozy, G. (Ed.) Ssaki Polskich Parków Narodowych: Drapieżne, Kopytne, Zajęczaki i duże Gryzonie; University of Agriculture: Kraków, Poland, 2014. [Google Scholar]
  26. Olszewski, A. Using camera-trapping as a non-invasive technique the study of wildlife in Kampinos National Park—The first results. Stud. Mater. CEPL 2016, 49, 42–49. [Google Scholar]
  27. Solarz, W. Fallow Deer. In Atlas of Polish Mammals. Available online: https://wwwiopkrakowpl/Ssaki/gatunek/124 (accessed on 13 May 2024).
  28. Pucek, Z.; Raczyński, J. (Eds.) Atlas Rozmieszczenia Ssaków w Polsce; PWN: Warsaw, Poland, 1983. [Google Scholar]
  29. Bombik, E.; Kondracki, S. Znaczenie hodowli zwierząt wolno żyjących (cz II). Przegl. Hod. 2007, 75, 18–21. [Google Scholar]
  30. Borys, B.; Bogdaszewska, Z.; Bogdaszewski, M. Dynamiczny wzrost fermowej hodowli jeleni i danieli w Polsce. Wiad. Zootech. 2012, 1, 33–44. [Google Scholar]
  31. European Union. Regulation (EU) no 1143/2014 of the European parliament and of the Council of 22 October 2014 on the prevention and management of the introduction and spread of invasive alien species. Off. J. Eur. Union 2014, L317, 35–55. [Google Scholar]
  32. Langbein, J.; Thirgood, S.J. Variation in Mating Systems of Fallow Deer (Dama dama) in Relation to Ecology. Ethology 1989, 83, 195–214. [Google Scholar] [CrossRef]
  33. Obidziński, A.; Kiełtyk, P.; Borkowski, J.; Bolibok, L.; Remuszko, K. Autumn-winter diet overlap of fallow, red, and roe deer in forest ecosystems, Southern Poland. Cent. Eur. J. Biol. 2013, 8, 8–17. [Google Scholar] [CrossRef]
  34. Ferretti, F.; Fattorini, N. Competitor densities, habitat, and weather: Effects on interspecific interactions between wild deer species. Integr. Zool. 2020, 16, 670–684. [Google Scholar] [CrossRef] [PubMed]
  35. Ferretti, F.; Bertoldi, G.; Sforzi, A.; Fattori, L. Roe and fallow deer: Are they compatible neighbours? Eur. J. Wildl. Res. 2011, 57, 775–783. [Google Scholar] [CrossRef]
  36. Focardi, S.; Aragno, P.; Montanaro, P.; Riga, F. Inter-specific competition from fallow deer Dama dama reduces habitat quality for the Italian roe deer Capreolus capreolus italicus. Ecography 2006, 29, 407–417. [Google Scholar] [CrossRef]
  37. Bartoš, L.; Vaňková, D.; Šiler, J.; Losos, S. Fallow deer tactic to compete over food with red deer. Aggress. Behav. 1996, 22, 375–385. [Google Scholar] [CrossRef]
  38. Dróżdż, J. Studies on helminths and helminthiases in Cervidae. III. Historical formation of helminthofauna in Cervidae. Acta Parasitol. Pol. 1967, 14, 287–300. [Google Scholar]
  39. Moriarty, A. The liberation, distribution, abundance and management of wild deer in Australia. Wildl. Res. 2004, 31, 291–299. [Google Scholar] [CrossRef]
  40. Dolman, P.M.; Wäber, K. Ecosystem and competition impacts of introduced deer. Wildl. Res. 2008, 35, 202–214. [Google Scholar] [CrossRef]
  41. Novillo, A.; Ojeda, R.A. The exotic mammals of Argentina. Biol. Invasions 2008, 10, 1333–1344. [Google Scholar] [CrossRef]
  42. Relva, M.A.; Nuñez, M.A.; Simberloff, D. Introduced deer reduce native plant cover and facilitate invasion of non-native tree species: Evidence for invasional meltdown. Biol. Invasions 2010, 12, 303–311. [Google Scholar] [CrossRef]
  43. Martin, T.G.; Arcese, P.; Scheeder, N. Browsing down our natural heritage: Deer impacts on vegetation structure and songbird populations across an island archipelago. Biol. Conserv. 2011, 144, 459–469. [Google Scholar] [CrossRef]
  44. Tanentzap, A.J.; Kirby, K.J.; Goldberg, E. Slow responses of ecosystems to reductions of deer (Cervidae) populations and strategies for achieving recovery. For. Ecol. Manag. 2012, 264, 159–166. [Google Scholar] [CrossRef]
  45. Wright, D.M.; Andrew, J.; Tanentzap, A.J.; Flores, O.; Husheer, S.W.; Duncan, R.P.; Wiser, S.K.; Coomes, D.A. Impacts of culling and exclusion of browsers on vegetation recovery across New Zealand forests. Biol. Conserv. 2012, 153, 64–71. [Google Scholar] [CrossRef]
  46. Borkowski, J.; Palmer, S.; Borowski, Z. Drive counts as a method of estimating ungulate density in forests: Mission impossible? Acta Theriol. 2011, 56, 239–253. [Google Scholar] [CrossRef] [PubMed]
  47. Marcon, A.; Battocchio, D.; Apollonio, M.; Grignolio, S. Assessing precision and requirements of three methods to estimate roe deer density. PLoS ONE 2019, 14, e0222349. [Google Scholar] [CrossRef] [PubMed]
  48. Gryz, J.; Krauze-Gryz, D. Why Did Brown Hare Lepus europaeus Disappear from Some Areas in Central Poland? Diversity 2022, 14, 465. [Google Scholar] [CrossRef]
  49. Gryz, J.; Krauze-Gryz, D. Occurrence of moose Alces alces L in the Rogów Forest (central Poland). For. Res. Pap. 2022, 82, 179–186. [Google Scholar] [CrossRef]
  50. Krauze-Gryz, D.; Gryz, J. Den dwelling carnivores in central Poland: Long term trends in abundance and productivity. Diversity 2022, 15, 32. [Google Scholar] [CrossRef]
  51. Mayle, B.A.; Peace, A.J.; Gill, M.A. How Many Deer? A Field Guide to Estimating Deer Population Size; Forestry Commission: Dry Branch, GA, USA, 1999; Volume 18. [Google Scholar]
  52. Borkowski, J.; Banul, R.; Jurkiewicz-Azab, J.; Hołdyński, C.; Święczkowska, J.; Nasiadko, M.; Dariusz Załuski, D. There is only one winner: The negative impact of red deer density on roe deer numbers and distribution in the Słowiński National Park and its vicinity. Ecol. Evol. 2021, 11, 6889–6899. [Google Scholar] [CrossRef] [PubMed]
  53. Aulak, W.; Babińska-Werka, J. Estimation of roe deer density based on the abundance and rate of disappearance of their faeces from forest. Acta Theriol. 1990, 35, 111–120. [Google Scholar] [CrossRef]
  54. Spitzer, R.; Churski, M.; Felton, A.; Heurich, M.; Kuijper, D.P.J.; Landman, M.; Rodriguez, E.; Singh, N.J.; Taberlet, P.; van Beeck Calkoen, S.; et al. Doubting dung: eDNA reveals high rates of misidentification in diverse European ungulate communities. Eur. J. Wildl. Res. 2019, 65, 28. [Google Scholar] [CrossRef]
  55. Gryz, J.; Krauze-Gryz, D.; Klich, D. Alien or Native? How to Distinguish Feces of Fallow and Roe Deer Using Central Poland as a Case Study. Animals 2022, 12, 290. [Google Scholar] [CrossRef] [PubMed]
  56. Moral, R.A.; Hinde, J.; Demétrio, C.G.B. Half-Normal Plots and Overdispersed Models in R: The hnp Package. J. Stat. Softw. 2017, 81, 1–23. [Google Scholar] [CrossRef]
  57. R Core Team. R: A Language and Environment for Statistical Computing; R Foundation for Statistical Computing: Vienna, Austria, 2023; Available online: https://wwwR-projectorg (accessed on 10 September 2023).
  58. Forest Data Bank. Hunting Reports. Available online: https://wwwbdllasygovpl/portal/ (accessed on 8 September 2023).
  59. Hofmann, R.R. Digestive physiology of the deer—Their morphophysiological specialisation and adaptation. R. Soc. N. Z. Bull. 1985, 22, 393–407. [Google Scholar]
  60. Latham, J. Interspecific interactions of ungulates in European forests: An overview. For. Ecol. Manag. 1999, 120, 13–21. [Google Scholar] [CrossRef]
  61. Latham, J.; Staines, B.W.; Gorman, M.L. Correlations of red (Cervus elaphus) and roe (Capreolus capreolus) deer densities in Scottish forests with environmental variables. J. Zool. 2009, 242, 681–704. [Google Scholar] [CrossRef]
  62. Ferretti, F.; Sforzi, A.; Lovari, S. Behavioural interference between ungulate species: Roe are not on velvet with fallow deer. Behav. Ecol. Soc. 2011, 65, 875–887. [Google Scholar] [CrossRef]
  63. Ferretti, F.; Lovari, S. Introducing Aliens: Problems Associated with Invasive Exotics. In Behaviour and Management of European Ungulates, 1st ed.; Putman, R., Apollonio, M., Eds.; Whittles Publishing: Dunbeath, UK, 2014. [Google Scholar]
  64. Thirgood, S.J. The effects of sex, season and habitat availability on patterns of habitat use by fallow deer (Dama dama). J. Zool. 1995, 235, 645–659. [Google Scholar] [CrossRef]
  65. Apollonio, M.; Focardi, S.; Toso, S.; Nacci, L. Habitat selection and group formation pattern of fallow deer Dama dama in a submediterranean environment. Ecography 1998, 21, 225–234. [Google Scholar] [CrossRef]
  66. Thirgood, S.J. Alternative Mating Strategies and Reproductive Success in Fallow Deer. Behaviour 1991, 116, 1–10. [Google Scholar] [CrossRef]
  67. Ferretti, F.; Sforzi, A.; Lovari, S. Intolerance amongst deer species at feeding: Roe deer are uneasy banqueters. Behav. Proc. 2008, 78, 487–491. [Google Scholar] [CrossRef] [PubMed]
  68. Rautiainen, H.; Bergvall, U.A.; Felton, A.M.; Tigabu, M.; Kjellander, P. Nutritional niche separation between native roe deer and the nonnative fallow deer—A test of interspecific competition. Mamm. Res. 2021, 66, 443–455. [Google Scholar] [CrossRef]
  69. Balik, B.; Moskalik, T.; Sadowski, J.; Zastocki, D. Selected aspects of forest protection from game. Stud. Mater. CEPL 2016, 46, 181–191. [Google Scholar]
  70. Wawrzyniak, P. Dynamika liczebności, jej wpływ na środowisko bytowania, a konieczność zarządzania populacja łosia Alces alces w Polsce. In Zarządzanie Populacjami Zwierząt; Polski Związek Łowiecki, Łowiec Polski: Warsaw, Poland, 2016; pp. 17–27. [Google Scholar]
  71. Wawrzyniak, P. Funkcjonowanie Populacji łosia (Alces alces), a Skala Konfliktów z Działalnością Człowieka w Warunkach Polski Północno-Wschodniej. 2017. Available online: https://wwwuwmedupl/wbz/sites/default/files/uploads/WBZ/Dokumenty/Katedry/KHZFiL/Konferencja24-11-2017/2_wawrzyniak_p_uwm_2017_lospdf (accessed on 8 September 2023).
  72. Bobek, B.; Błaszczyk, J.; Frąckowiak, W.; Furtek, J.; Morow, K.; Wojciuch-Poskonka, M.; Wyrobek, K. Łoś Alces Alces-Biologia, Ochrona i Gospodarka Łowiecka; Międzynarodowy Instytut Ekologii: Kraków, Poland, 2021. [Google Scholar]
  73. Nasiadka, P.; Wajdzik, M.; Skubis, J. A comprehensive over 100 years history of mouflon (Ovis musimon) in Poland: From the promising beginning in 1902 to questionable future in 2014. A case study of wildlife management history. Appl. Ecol. Environ. Res. 2021, 19, 993–1017. [Google Scholar] [CrossRef]
  74. Vincent, J.; EBideau, E.; Hewison, A.; Angibault, J. The influence of increasing density on body weight, kid production, home range and winter grouping in roe deer (Capreolus capreolus). J. Zool. 1995, 236, 371–382. [Google Scholar] [CrossRef]
  75. Andersen, R.; Linnell, J.D.C. Irruptive potential in roe deer: Density-dependent effects on body mass and fertility. J. Wildl. Manag. 2000, 64, 698–706. [Google Scholar] [CrossRef]
  76. Clutton Brock, T.H.A.; Illius, W.; Wilson, K.; Grenfell, B.T.; Maccoll, A.D.C.; Albon, S.D. Stability and Instability in Ungulate Populations: An Empirical Analysis. Am. Nat. 1997, 149, 195–219. [Google Scholar] [CrossRef]
  77. Genovesi, P. Eradications of invasive alien species in Europe: A review. Biol. Invasions 2005, 7, 127–133. [Google Scholar] [CrossRef]
  78. Gryz, J.; Chojnacka-Ożga, L.; Krauze-Gryz, D. Long-term stability of tawny owl (Strix aluco) population despite varying environmental conditions—A case study from central Poland. Pol. J. Ecol. 2019, 67, 75–83. [Google Scholar] [CrossRef]
Figure 1. An increase in the estimated number (the minimum population abundance) of fallow deer (in winter) in the study area after the introduction of 22 individuals in the years 2008–2011.
Forests 15 01014 g001
Figure 2. Changes in the mean (±SD) density of the roe deer before (1997–2007) and after (2008–2018) fallow deer introduction into Głuchów forest (first study area, fallow deer present) and comparison of roe deer density between the same study periods in Strzelna forest (reference, fallow deer absent) study area. In the area where the fallow deer was present, 10 and 15 estimations were made in the first and second period, respectively. In the area where the fallow deer was absent, 10 and 11 estimations were made.
Forests 15 01014 g002
Figure 3. Changes in the mean (±SD) productivity of roe deer before (2001–2007) and after (2008–2018) fallow deer introduction into Głuchów forest (first study area, fallow deer present, n = 91) and comparison of roe deer density between the same study periods in Strzelna forest (reference, fallow deer absent, n = 106). Only females that had at least one calf were counted (i.e., the min number was 1).
Forests 15 01014 g003
Table 1. Results of Scheirer–Ray–Hare test for the variables, which influenced the productivity of the roe deer in two areas (Głuchów forest = fallow deer present and Strzelna forest = fallow deer absent) in the two periods (2001–2007 and 2008–2018, i.e., before and after introduction of fallow deer in the first area, and in analogue study periods in the second area).
VariablesHDfp Value
Area14.13731<0.001
Period0.05781>0.05
Area ∗ Period10.63601<0.01
Table 2. Model output for the probability of roe deer presence in relation to fallow deer presence (expressed as the number of feces/pellet groups of each deer species recorded within a certain 80 m stretch of a transect).
VariablesEstimate Std. Error z Valuep Value
Intercept (roe deer, Głuchów)0.304380.056165.420 <0.0001
Fallow deer−0.101780.04362−2.333<0.05
Location_Spała−0.841470.10231−8.2255<0.0001
Fallow deer ∗ Location_Spała−1.092190.41819−2.612<0.01
Disclaimer/Publisher’s Note: The statements, opinions and data contained in all publications are solely those of the individual author(s) and contributor(s) and not of MDPI and/or the editor(s). MDPI and/or the editor(s) disclaim responsibility for any injury to people or property resulting from any ideas, methods, instructions or products referred to in the content.

