Article

Soil Carbon and Nitrogen Stocks and Their Influencing Factors in Different-Aged Stands of Sand-Fixing Caragana korshinskii in the Mu Us Desert of Northwest China

1
College of Forestry and Pratacuture, Ningxia University, Yinchuan 750021, China
2
Ningxia Grassland and Animal Husbandry Engineering Technology Research Center, Ningxia University, Yinchuan 750021, China
3
Key Laboratory for Model Innovation in Forage Production Efficiency, Ministry of Agriculture and Rural Affairs, Ningxia University, Yinchuan 750021, China
4
State Key Laboratory Breeding Base of Land Degradation and Ecological Restoration of Northwest China, Ningxia University, Yinchuan 750021, China
5
Statistical Scientific Editing, Montreal, QC J7T 2J3, Canada
*
Author to whom correspondence should be addressed.
Forests 2024, 15(6), 1018; https://doi.org/10.3390/f15061018
Submission received: 24 April 2024 / Revised: 26 May 2024 / Accepted: 7 June 2024 / Published: 12 June 2024
(This article belongs to the Special Issue Construction and Maintenance of Desert Forest Plantation)

Abstract

:
Establishing artificial sand-fixing shrubs is a key measure to curb dune flow and drive changes in the soil stocks and cycling of carbon and nitrogen. But our understanding of these dynamics across years of sand-fixing afforestation and the factors influencing them remains inadequate, making it hard to accurately assess its capacity to sequester carbon. To fill that knowledge gap, this study investigated soil organic carbon (SOC) and soil total nitrogen (STN) stocks in Mu Us Desert under artificial sand-fixing shrub stands of different ages (10, 30, 50, and 70 years old) vis-à-vis a mobile sand dune, to determine whether Caragana korshinskii afforestation improved stock characteristics and whether SOC and STN stocks were correlated during the restoration processes. The results showed that the pattern observed is consistent with an increase over time in the stocks of both SOC and STN. At 10, 30, 50, and 70 years, these stocks were found to be 1.8, 2.3, 3.2, and 5.5 times higher for SOC, and 1.3, 1.6, 2.1, and 2.7 times higher for STN, respectively, than those of the control (mobile sand) dune. Stocks of SOC and STN mainly increased significantly in the 0–10 cm soil layer. The SOC stock was correlated positively with the STN stock as well as the C:N ratio. The slope of the regression for the C:N ratio against stand age was positive, increasing slightly faster with afforestation age. Additionally, our findings suggest that during the establishment of artificial stands of shrubs, the size of the STN stock did not expand as fast as the SOC stock, resulting in an asynchronous N supply and demand that likely limits the accumulation of soil organic matter. This research provides important evidence for the sustainable development of desertified ecosystems.

1. Introduction

Desertified land is among the most serious forms of land degradation in arid and semi-arid regions worldwide [1,2]. Due to anthropogenic exploitation and wind-driven sand erosion, desertified ecosystems have poor soil fertility, low soil organic matter content, and low vegetation productivity. Not only does desertification lower their diversity and stability, but it also alters the structure and function of ecosystems, resulting in severe losses of soil carbon (C) and nitrogen (N) that disrupts their normal cycling [3,4]. Such ecosystems are thus generally considered to have a weak capacity and potential for both C and N fixation. Yet deserts or arid and semi-arid ecosystems occupy 41% of the Earth’s land surface area [4,5], hence their cumulative C sequestration is still considerable, and this plays an important role in the global C cycle [6]. Desert ecosystems, as C sources, can emit more C than they absorb [7]; however, studies have also shown that arid regions absorb more C than they release, thus functioning as a C sink [8,9]. Therefore, current knowledge about soil C cycling processes in arid and semi-arid regions remains contentious, precluding their sound understanding, thus calling for their study and verification more widely.
Soil organic C content and its stock are important indicators of soil quality [10]. On the other hand, the soil N stock is typically used to evaluate soil fertility, and its content and density can directly affect the net primary productivity of plants [11]. Further, the soil N stock can impact soil C cycling processes [12]. Since ecosystem emissions of C and N can directly or indirectly contribute to global warming, both elements are key links in global biogeochemical cycling [13]. Interactions between C and N are pivotal for determining whether C sinks in terrestrial ecosystems can be sustained over the long term, and N dynamics are a key factor for how long-term terrestrial C sequestration is regulated [14]. Where the total N content is more or less constant, it may become increasingly limited under rising CO2 conditions as more C accumulates in the ecosystem [14]. If the additional C input stimulates biological N fixation and atmospheric N deposition, the greater ensuing nitrogen supply may bolster productivity and soil organic matter input, thereby enhancing the accumulation of soil carbon [5,13]. Accordingly, over time, the capacity for sequestering C is soil is inevitably limited if the stock of soil N fails to increase enough in size [14]. It is thus imperative to know the changing status of C and N stocks and their relation during afforestation since understanding that is crucial for sustainably managing plantations.
In arid and semi-arid regions, the artificial planting of sand-fixing stands is one of the most effective ways to curb desertification. This form of afforestation reduces soil erosion considerably and alters the soil stock of C, as well as N, along with their cycling [15,16]. For example, as sand-fixing stands grow and develop, the amount of litter input to the ground increases, as does the rate of decomposition there, which directly affects the accumulation of C and N in soil [17]. Moreover, the cumulative amount of plant dry matter produced eventually peaks and decreases as stands age. With declining productivity, the plant demand for soil nutrient content diminishes, resulting in a greater soil nutrient stock [18]. However, research has shown that soil C and N stocks could both decline over the course of ecological succession, mainly due to the degradation of established community structure resulting from the excessive consumption of soil water by developed root systems and rapid plant growth [19] and more severe drought linked to climate change [20]. For instance, on the Loess Plateau of China, after 10–30 years of afforestation, the stock of SOC in a 100 cm soil profile had fallen by 23.9% while that of STN fell by 19.9% [19]. Clearly then, to accurately gauge and predict the soil C and N sequestration dynamics in response to the afforestation of the desert, a long observational period is essential for a meaningful assessment and robust inference.
Since the mid 20th century, the planting of dryland shrubs has emerged as an effective and vital mode of wind prevention and sand fixation in the arid/semi-arid regions of northwestern China [21,22]. Mu Us Desert—one of China’s four major sandy lands—is located in the agricultural-pastoral interleaving area and is a typical ecologically fragile zone. Due to its unique geographic and climatic conditions and extreme sensitivity to human activities, Mu Us Desert is prone to land degradation, desertification, and other ecological problems. To address these issues, the drought-tolerant legume shrub Caragana korshinskii has been widely planted in this region to promote its valuable functions; namely, wind prevention, sand fixation, and soil and water conservation [23]. Previous studies have shown that in these afforested areas the vegetation communities are highly dynamic and still changing, soil fertility is rising, and soil C as well as N continue to accumulate since the planting of C. korshinskii [24,25]. However, the responses of soil C and N stocks and their relationship as the C:N ratio, have yet to be investigated.
To fill that knowledge gap, this field study employed a space-for-time substitution approach. Specifically, we investigated stands that were 10-, 30-, 50-, and 70-years old. These stands were selected vis-à-vis a non-forested site in the form of a mobile sand dune. Goals were (1) to compare stocks of soil organic C and total N across a range of stand ages; and (2) to reveal how soil C and N stocks appear to have changed over time, and the factors influencing them during the growth of artificial C. korshinskii shrub stands in an arid sandy area. The obtained results can provide a scientific basis for evaluating the impact of restoration measures on the C balance in desertification areas.

2. Materials and Methods
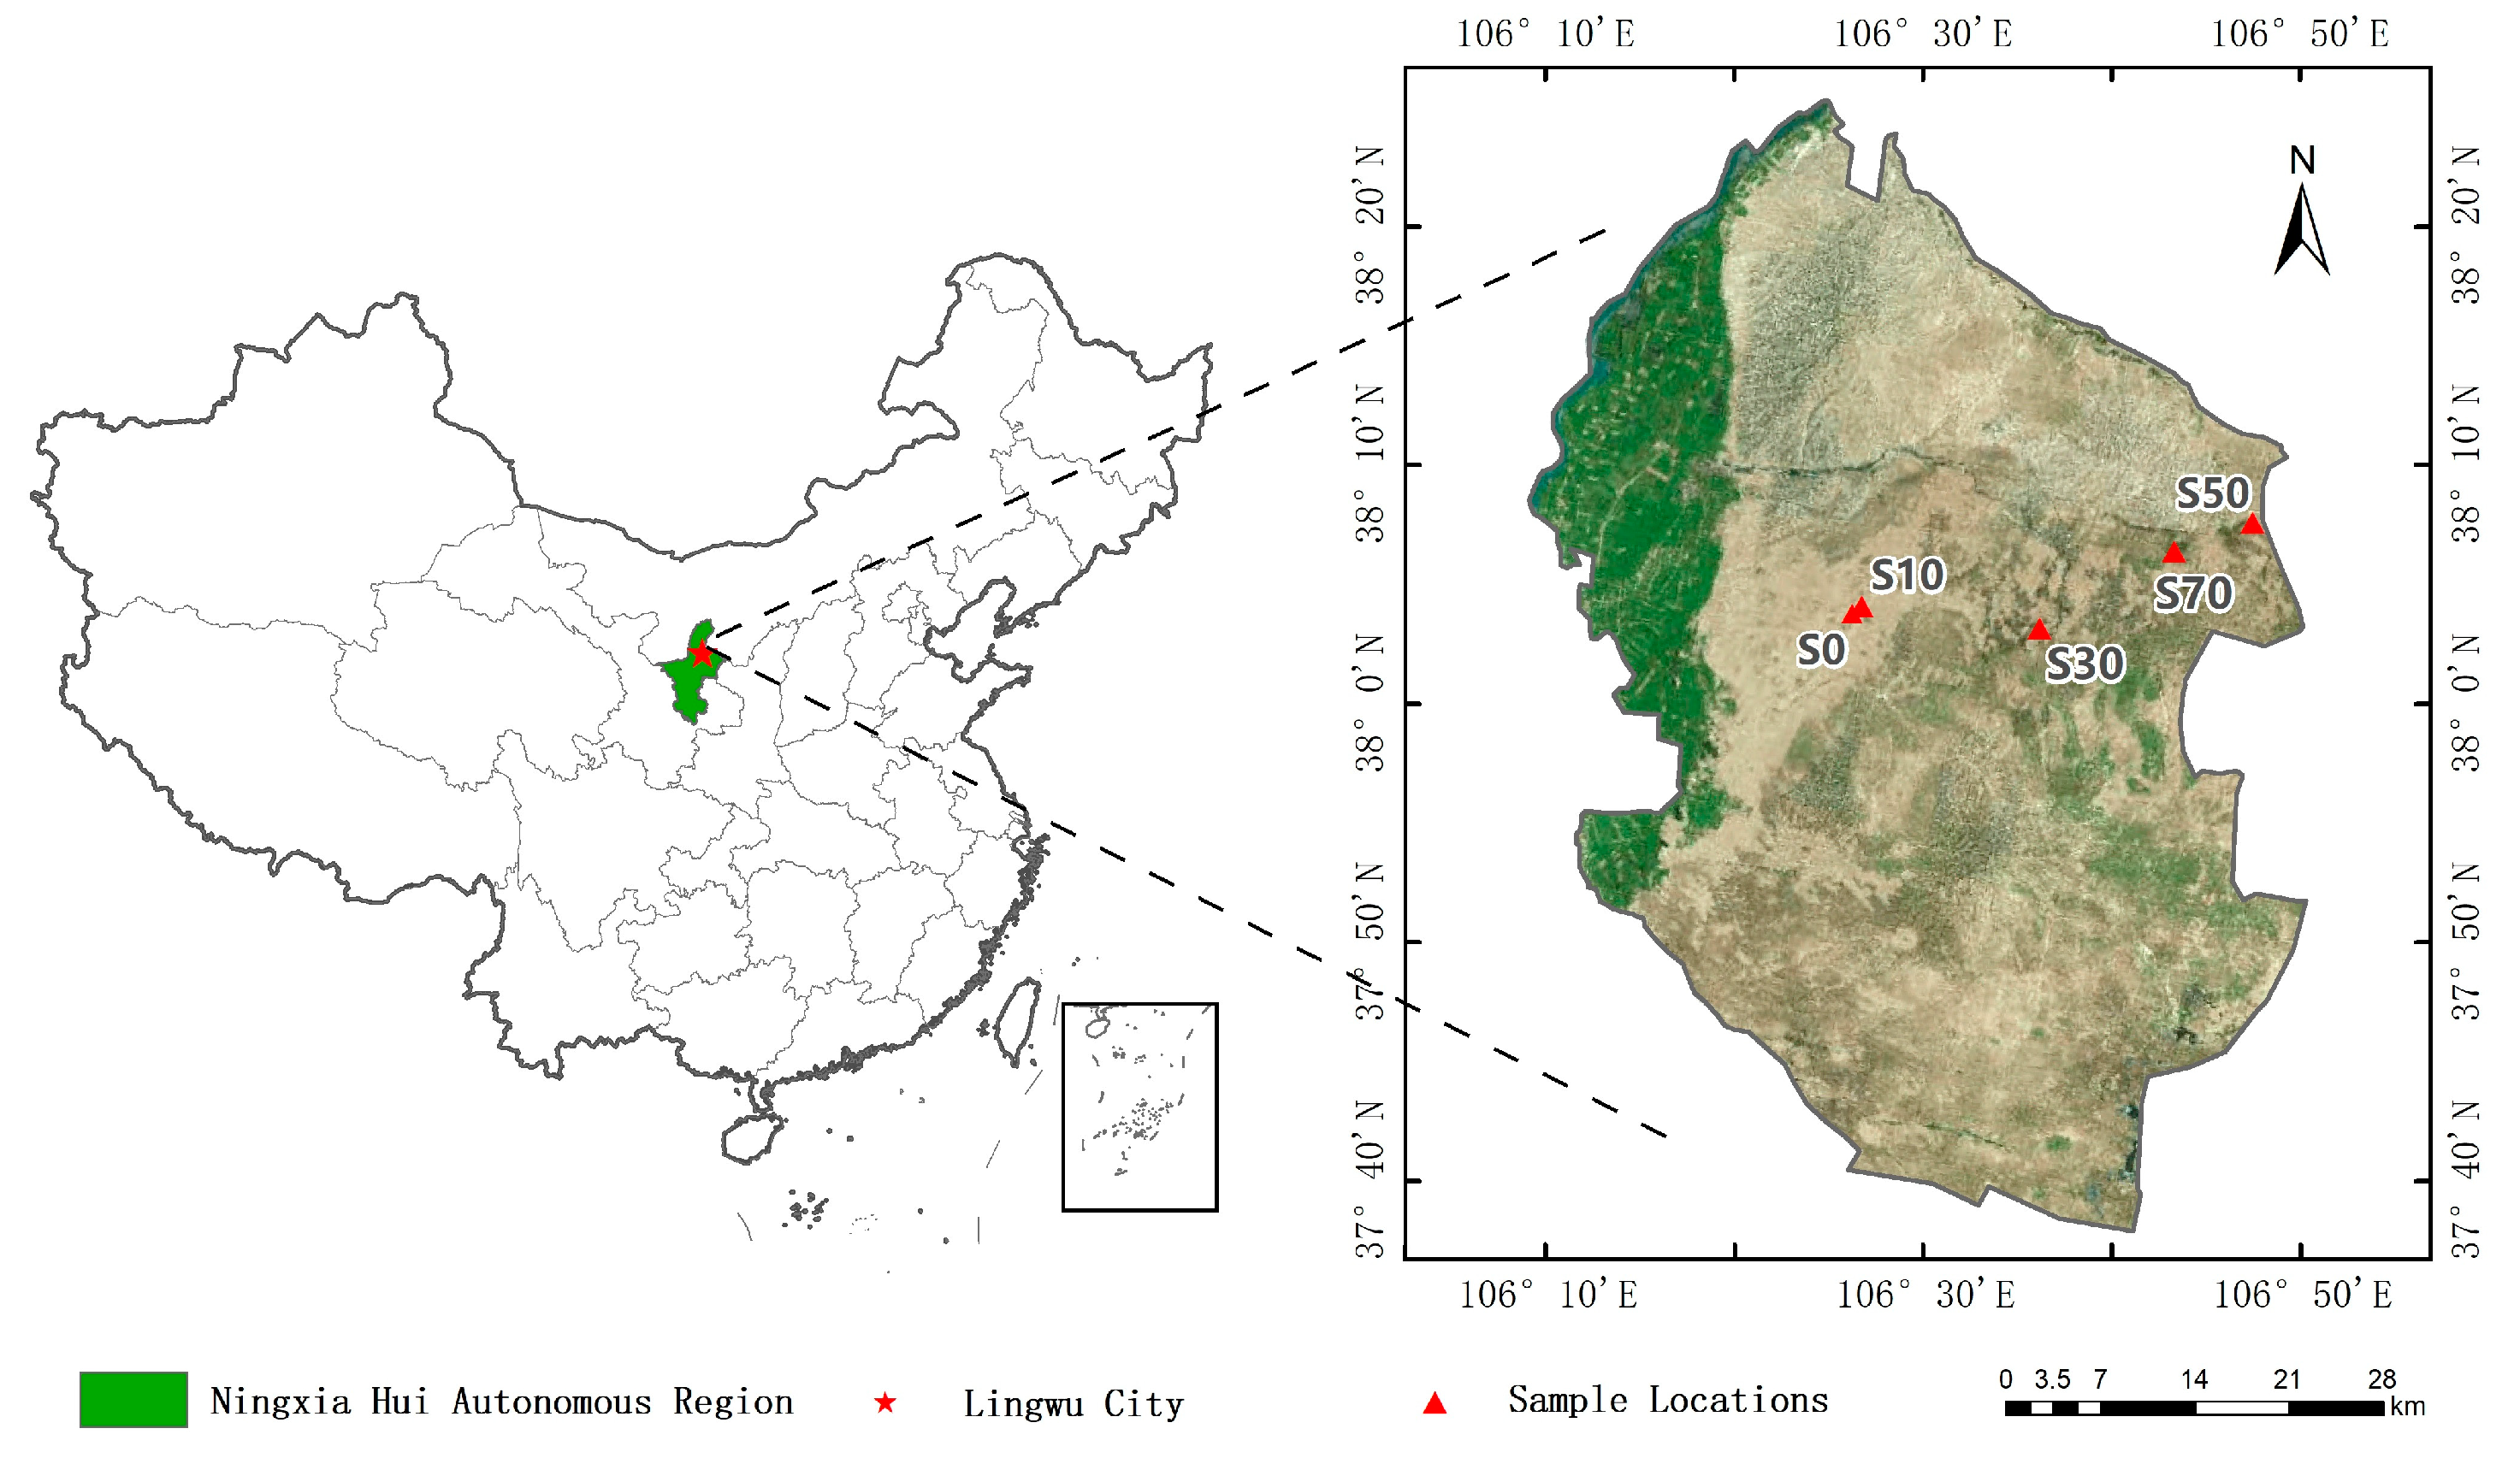
2.1. Study Area

This research was carried out in the Baijantan Nature Reserve of Lingwu City, Ningxia, on the southwestern edge of Mu Us Desert at 37°54′–38°22′ N, 106°23′–106°48′ E (Figure 1). Mean elevation is 1288 m, where a temperate continental semi-arid monsoon climate prevails. This region has an average annual temperature of 8.8 °C and an average annual precipitation of 206.2–255.2 mm, falling mostly between June and September, with an average annual potential evaporation of 1933.3 mm. The soil here is mainly calcareous sand soil, and the landscape is predominantly sandy. Vegetation coverage is sparse, spanning 2% to 20%, and dominated by Artemisia desertorum, Agriophyllum squarrosum, Sophora alopecuroides, C. korshinskii, and Salix psammophila. The major sand-fixing plants are native shrubs or small trees, namely C. korshinskii and Hedysarum scoparium. Figure 2 provides a visual overview of these sites in greater detail.

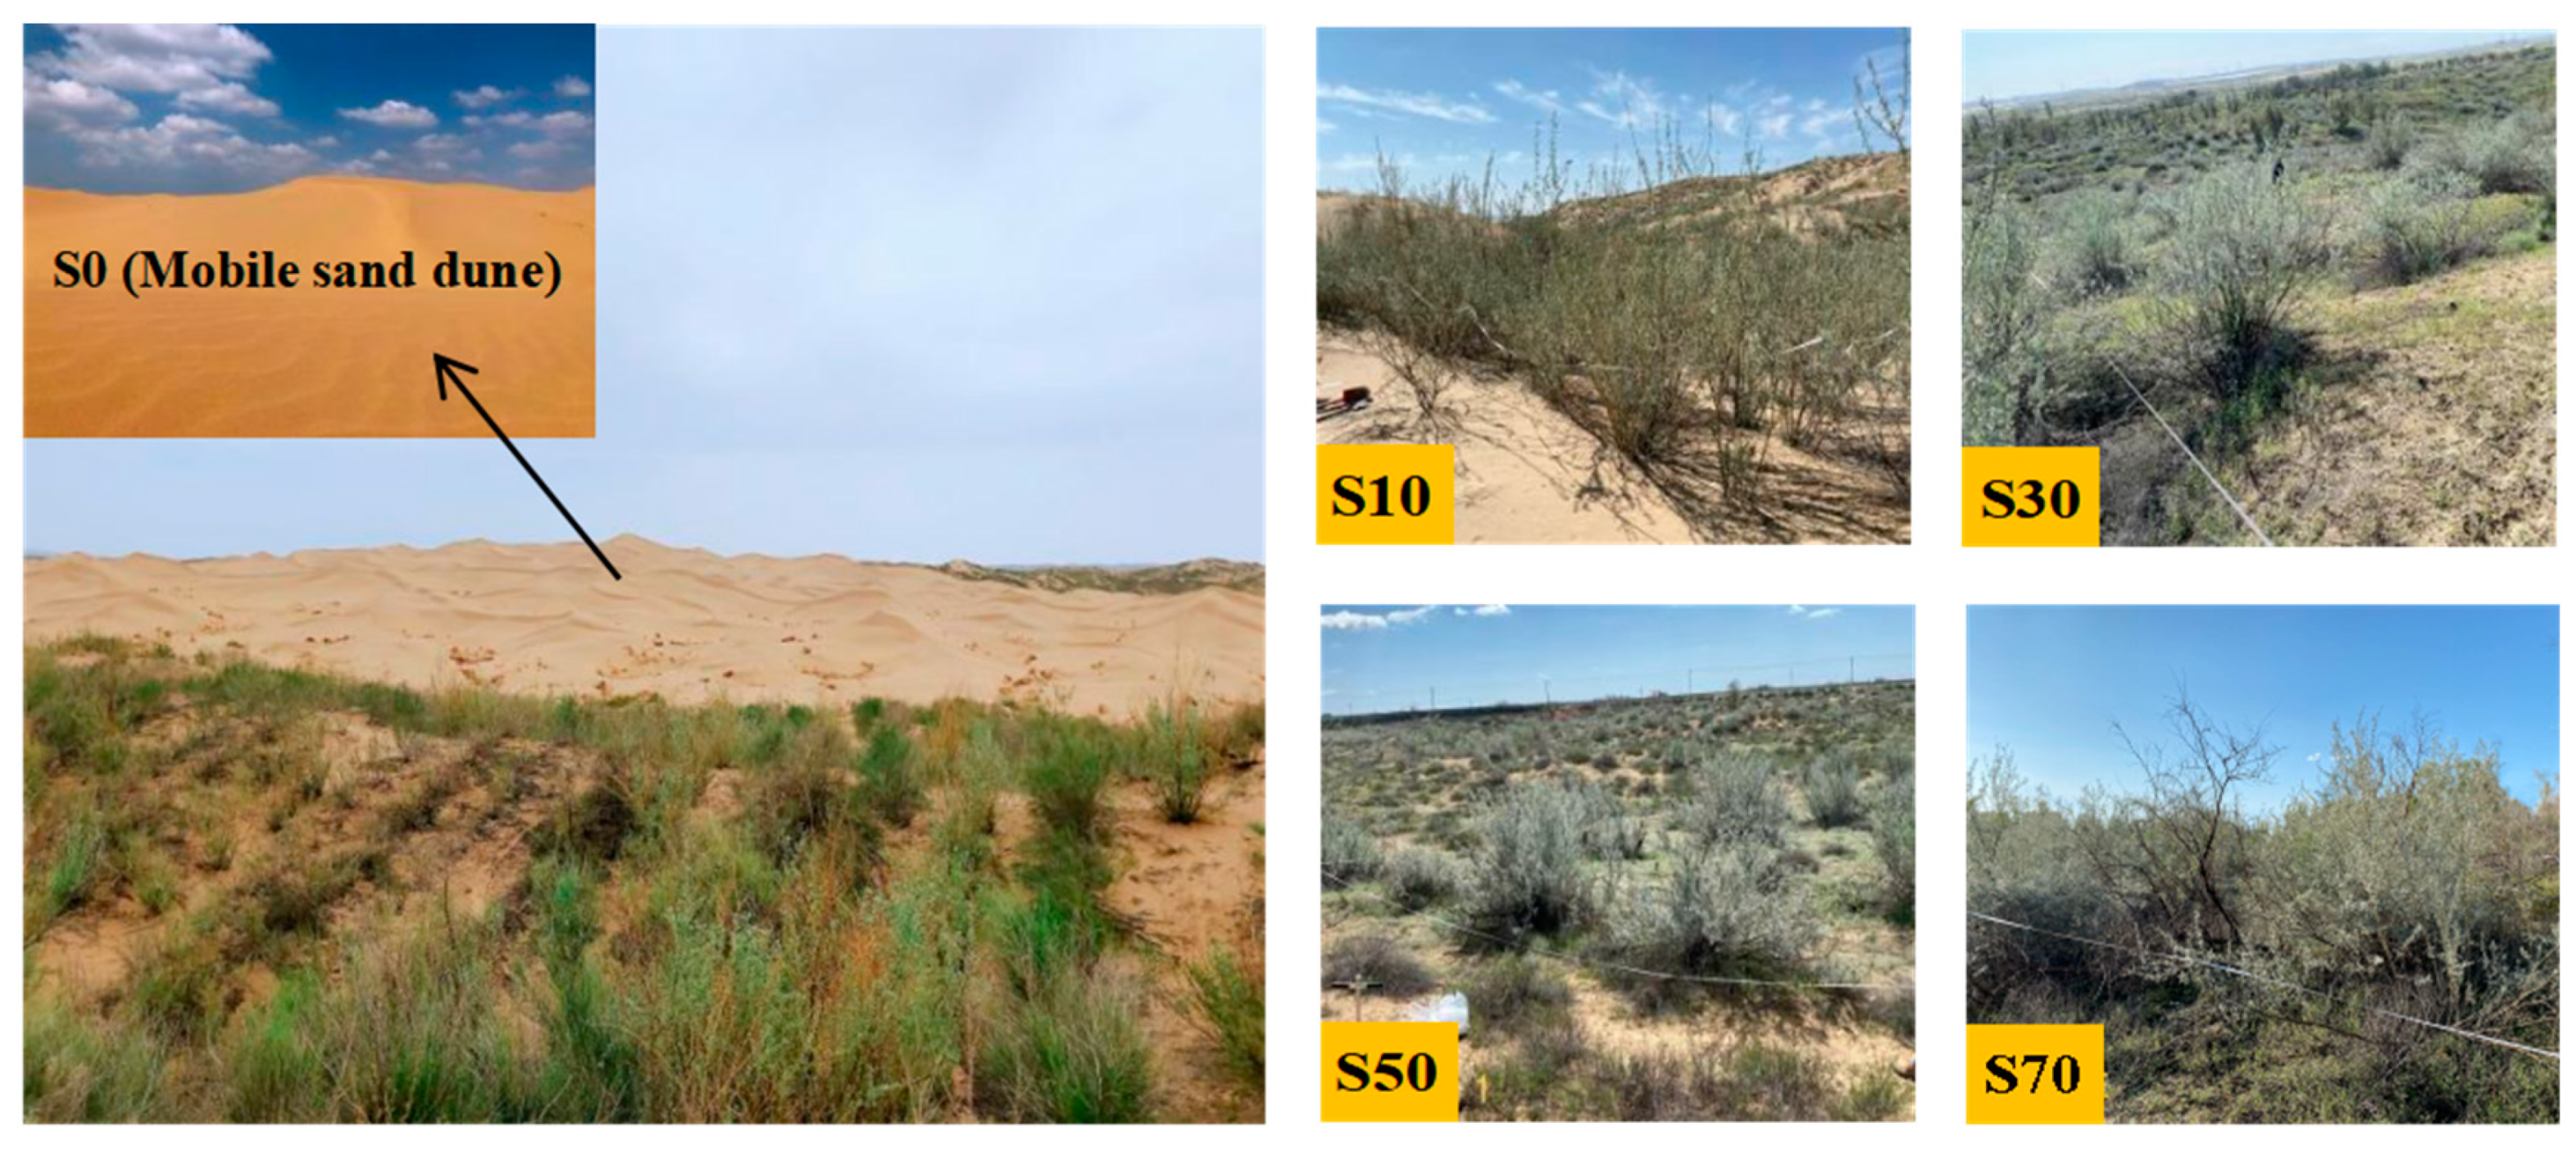
2.2. Experimental Design

Early in August 2021, using a space-for-time substitution approach, we selected four different-aged (10, 30, 50, and 70 years old) plantations of C. korshinskii to form a chronosequence of stands corresponding to a restoration gradient. Their respective coordinates (longitude, latitude) and elevation were recorded with a GPS unit. At each plantation site, three plots (each 10 m × 10 m) were randomly set up and sampled, having a similar topography and local climate, but separated by least 100 m to promote their statistical independence and to also help control for spatial heterogeneity. Three herbaceous quadrats (1 m × 1 m) were evenly arranged along the diagonal of each plot, as replicates for sampling the understory vegetation. In this way, a total of 12 shrub and 36 herbaceous sampling points were set up across the study area for the plant community investigation and vegetation/soil sampling. Since the mobile dune lacked any vegetation, three plots (each 10 m × 10 m) were set up there for soil sampling only. However, because vegetation samples within plots are likely not independent of each other, we first pooled them on a per plot basis before the formal statistical analysis.

2.3. Plant Sampling and Collection

In August 2021, the plant height, ground diameter, and crown width of all live shrubs were measured in each 100 m2 plot, and its aboveground biomass estimated per plot [26]. At the same time, in each 1 m2 quadrat, we recorded the number of understory plants and grass coverage. For the coverage of shrub and grass plants, each was assessed visually, using the method described by [16] Li et al. Meanwhile, all the grasses were cut along the ground surface (1 m2); this aboveground material was brought to the laboratory for oven-drying (at 65 °C) and weighing to determine its biomass. Later, in November 2021, in each 1 m2 quadrat, all litter material belonging to shrubs and herbs was collected from the soil surface and stored in paper bags. Litter samples were taken to the laboratory and oven-dried at 65 °C for 48 h.

2.4. Soil Sampling and Measurements

In each plot (100 m2), along an S-shaped curve, we took five samples from different soil layers of 0–10, 10–20, and 20–40 cm depths, and these were mixed per layer into a single composite sample per plot. Thus, a total of 45 uniformly mixed soil samples were obtained and taken to the laboratory. There, all soil samples were air-dried and sieved through 0.25-mm mesh to remove any gravel and plant remnants. Next, the soil samples were ground into fine powder and sieved through 0.1-mm mesh for use in the soil organic carbon (SOC), and soil total nitrogen (TN) analyses. In each plot, a soil profile was also dug, in which soil samples were collected from the same three depth layers with a ring cutter, to determine their soil bulk density (SBD).
The SOC concentrations were determined using the K2Cr2O7 oxidation method [27]. The STN was measured by the Dumas high-temperature combustion method as follows: weigh 0.5 g of a soil sample, wrap the sample with special tin foil, and test the sample after the instrument reaches 900 °C (Elementar vario MACRO cube, Hanau, Germany) [28]. The ratio of soil C:N was simply the soil total C divided by soil total N.

2.5. Calculation of Soil C and N Stocks

The SOC stock and soil total nitrogen (STN) stock (t·hm−2) were calculated as follows:
Stock  SOC = i = 1 n C S O C i × B D i × D i / 100
Stock  STN = i = 1 n C S T N i × B D i × D i / 100
where n refers to how many soil layers were sampled; CSOCi is the concentration of SOC, and likewise CSTNi is that for STN, in layer i (g·kg−1); BDi is the bulk density of soil in layer i (g·cm−3); and Di is the depth of soil layer i (cm).

2.6. Statistical Analysis

We applied Shapiro–Wilk tests to check whether the response variables’ data followed normality. One-way ANOVA (analysis of variance) was used to test for differences among the five stand ages (i.e., years since planting) in the following: total species number of shrubs and grasses; the coverage and aboveground biomass of shrubs and grasses; and the litter amount; SOC and STN contents and their corresponding stocks; the C:N ratio; and SBD. Planned multiple pairwise comparisons of means were tested, using the LSD method, at a 0.05 alpha level of significance. Polynomial regressions were fitted to analyze the relationship between the C:N ratio and stand age, and that between the SOC stock and STN stock or C:N ratio. To determine the different vegetation characteristics’ influence on the stocks of SOC and STN, we used redundancy analysis (RDA) with a Monte Carlo permutation test (bootstrap with replacement) conducted to screen the main factors affecting the SOC or STN stocks. The univariate ANOVAs were performed in SPSS 22.0 (SPSS Inc., Chicago, IL, USA) software, while Canoco 5.0 (Microsoft Inc., Redmond, WA, USA) was used for the RDA.

3. Results

3.1. Changes in Aboveground Plants after C. korshinskii Afforestation

There were significant differences in species composition, dominance, and litter quantity between the mobile sand dune and afforestation plots of different-aged stands (p < 0.001) (Table 1). After artificial planting with C. korshinskii, various grasses such as Setaria viridis and Eragrostis pilosa began to appear in the shrub plantations, with 3, 15, 12 and 14 species respectively recorded in the 10-, 30-, 50-, and 70-year-old stands. Over time, the shrub cover and biomass decreased significantly while the herb cover, herb biomass, and litter amount increased significantly.

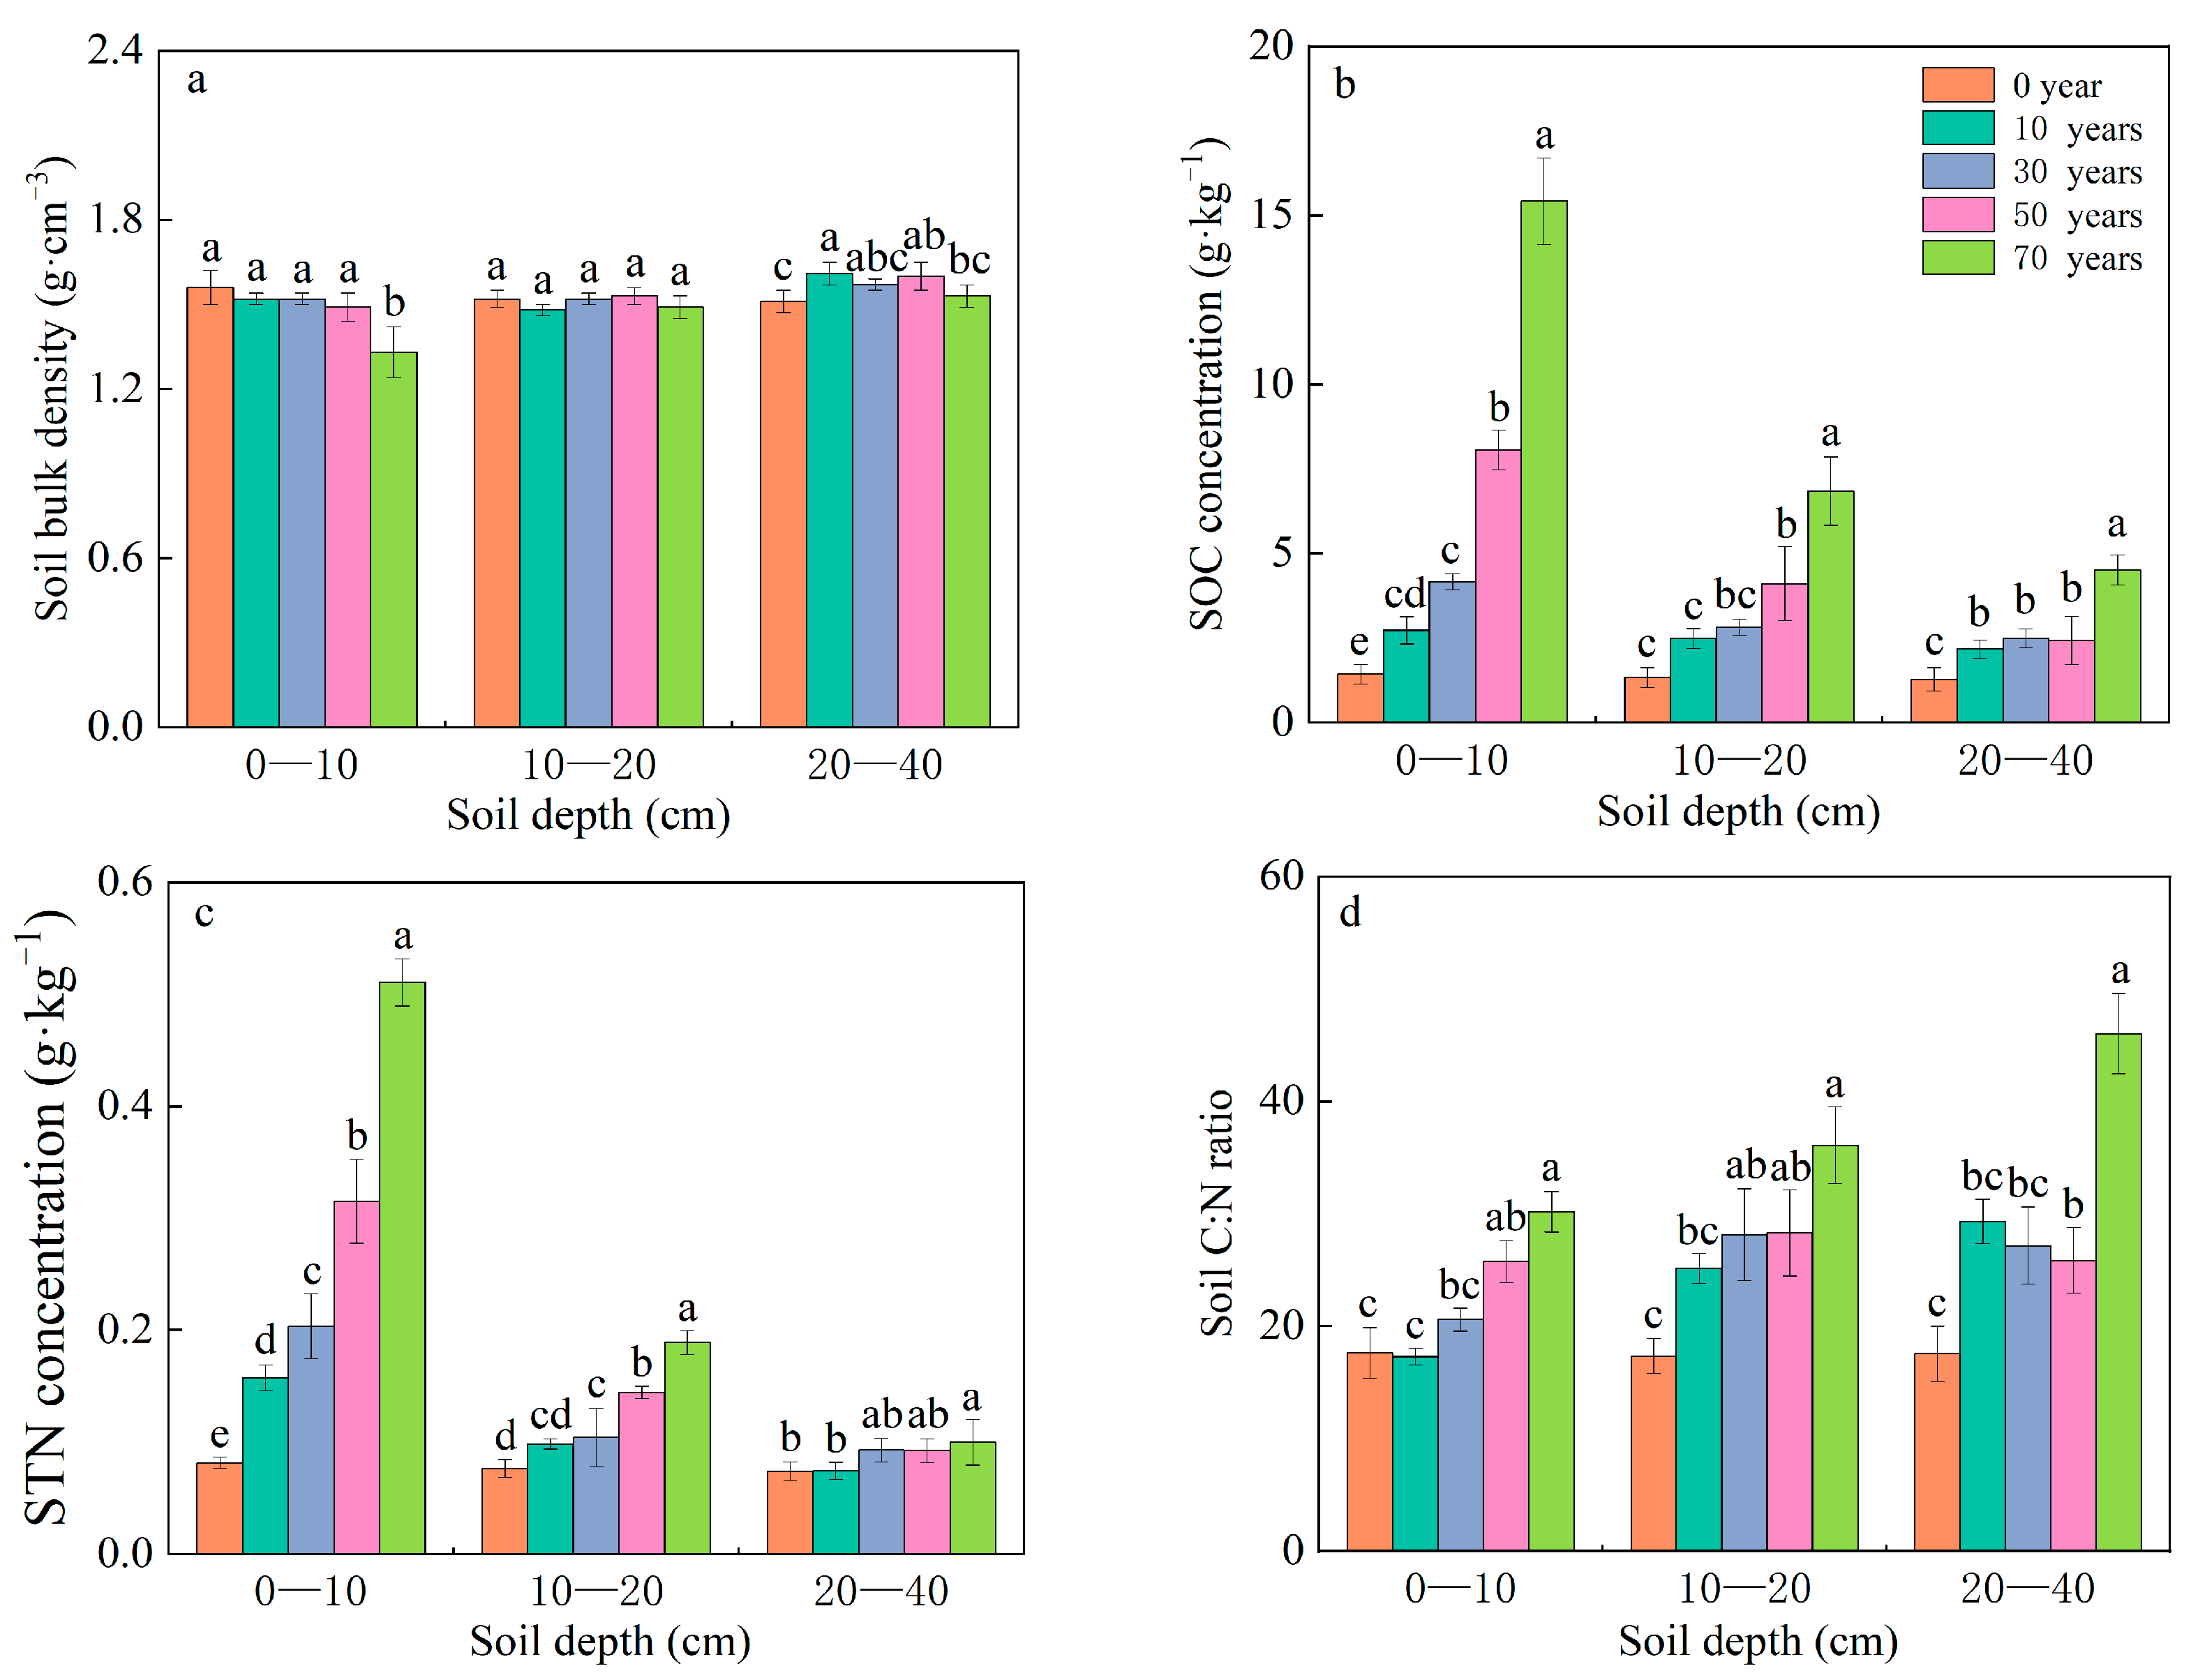
3.2. Effects of Years of C. korshinskii Afforestation on SBD and the SOC and STN Contents

Across all plots in the shrub afforestation chronosequence, the SBD differed significantly among stand ages as well as the three soil layers (Table 2, p < 0.05; Figure 3a), and the SBD ranged from 1.3 to 1.6 g·cm−3 (Figure 3a). The SBD of the 0–10 cm soil layer decreased over time, being significantly lowest in the 70-year-old stand (p < 0.05). In the 10–20 cm soil layer, the SBD was similar between the moving dune and each stand age (p > 0.05).
The SOC and STN concentrations were also significantly different among stand ages or soil layers (Table 2, p < 0.001; Figure 3b,c; p < 0.05). The content of SOC in the 0–10, 10–20, and 20–40 cm layers was always highest in the 70-year-old stand (p < 0.05), attaining values of 15.4, 6.8, and 4.5 g·kg−1, respectively. According to its profile distribution, the SOC content declined with greater soil depth: being highest in the 0–10 cm layer, followed by the 10–20 cm layer, and lowest in the 20–40 cm. The corresponding STN content of those soil layers was greatest in the 70-year-old stand, at 0.5, 0.2, and 0.1 g·kg−1, respectively, which significantly exceeded that of all younger stands and the mobile dune (p < 0.05). The soil C:N ratio in all soil layers showed a trend of increasing over time (Figure 3d), being highest in the 70-year-old stand, this significantly surpassed all other stand ages and the mobile dune (p < 0.05). Across the entire chronosequence, the C:N ratio in the 40 cm deep soil profile ranged almost three-fold, from 13.8 to 35.2. In terms of their vertical distribution, consistent changes in the STN and SOC content were evident, in that both decreased significantly going deeper into the soil profile.

3.3. Distribution Characteristics of SOC and STN Stocks in Response to C. korshinskii Afforestation

There were significant differences in the SOC and STN stocks across the afforestation chronosequence of sites (Table 2; Figure 4a,b, p < 0.001). Considering the entire 0–40 cm soil depth profile, over time, the stock of SOC along with that of STN increased continually; thus, ranked as follows: mobile dune < 10 < 30 < 50 < 70 years. In the 70-year-old stand, its SOC and STN stocks amounted to 44.6 and 1.3 t·hm−2, respectively, both significantly higher than those of younger stands and the mobile dune (p < 0.05). When examined vertically (Figure 4c,d), the respective contribution of soil layers to SOC and STN stocks across the afforestation chronosequence were as follows: 0–10 cm: 4.9% to 45.5% and 7.0% to 36.3%; 10–20 cm: 7.7% to 38.6% and 12.6% to 30.6%; and 20–40 cm: 9.6% to 34.4% and 16.4% to 22.6%. Overall, as the stands aged, the proportion of SOC and STN stocks found near the surface (0–10 cm) exceeded that stored in deeper soil (10–20 or 20–40 cm).

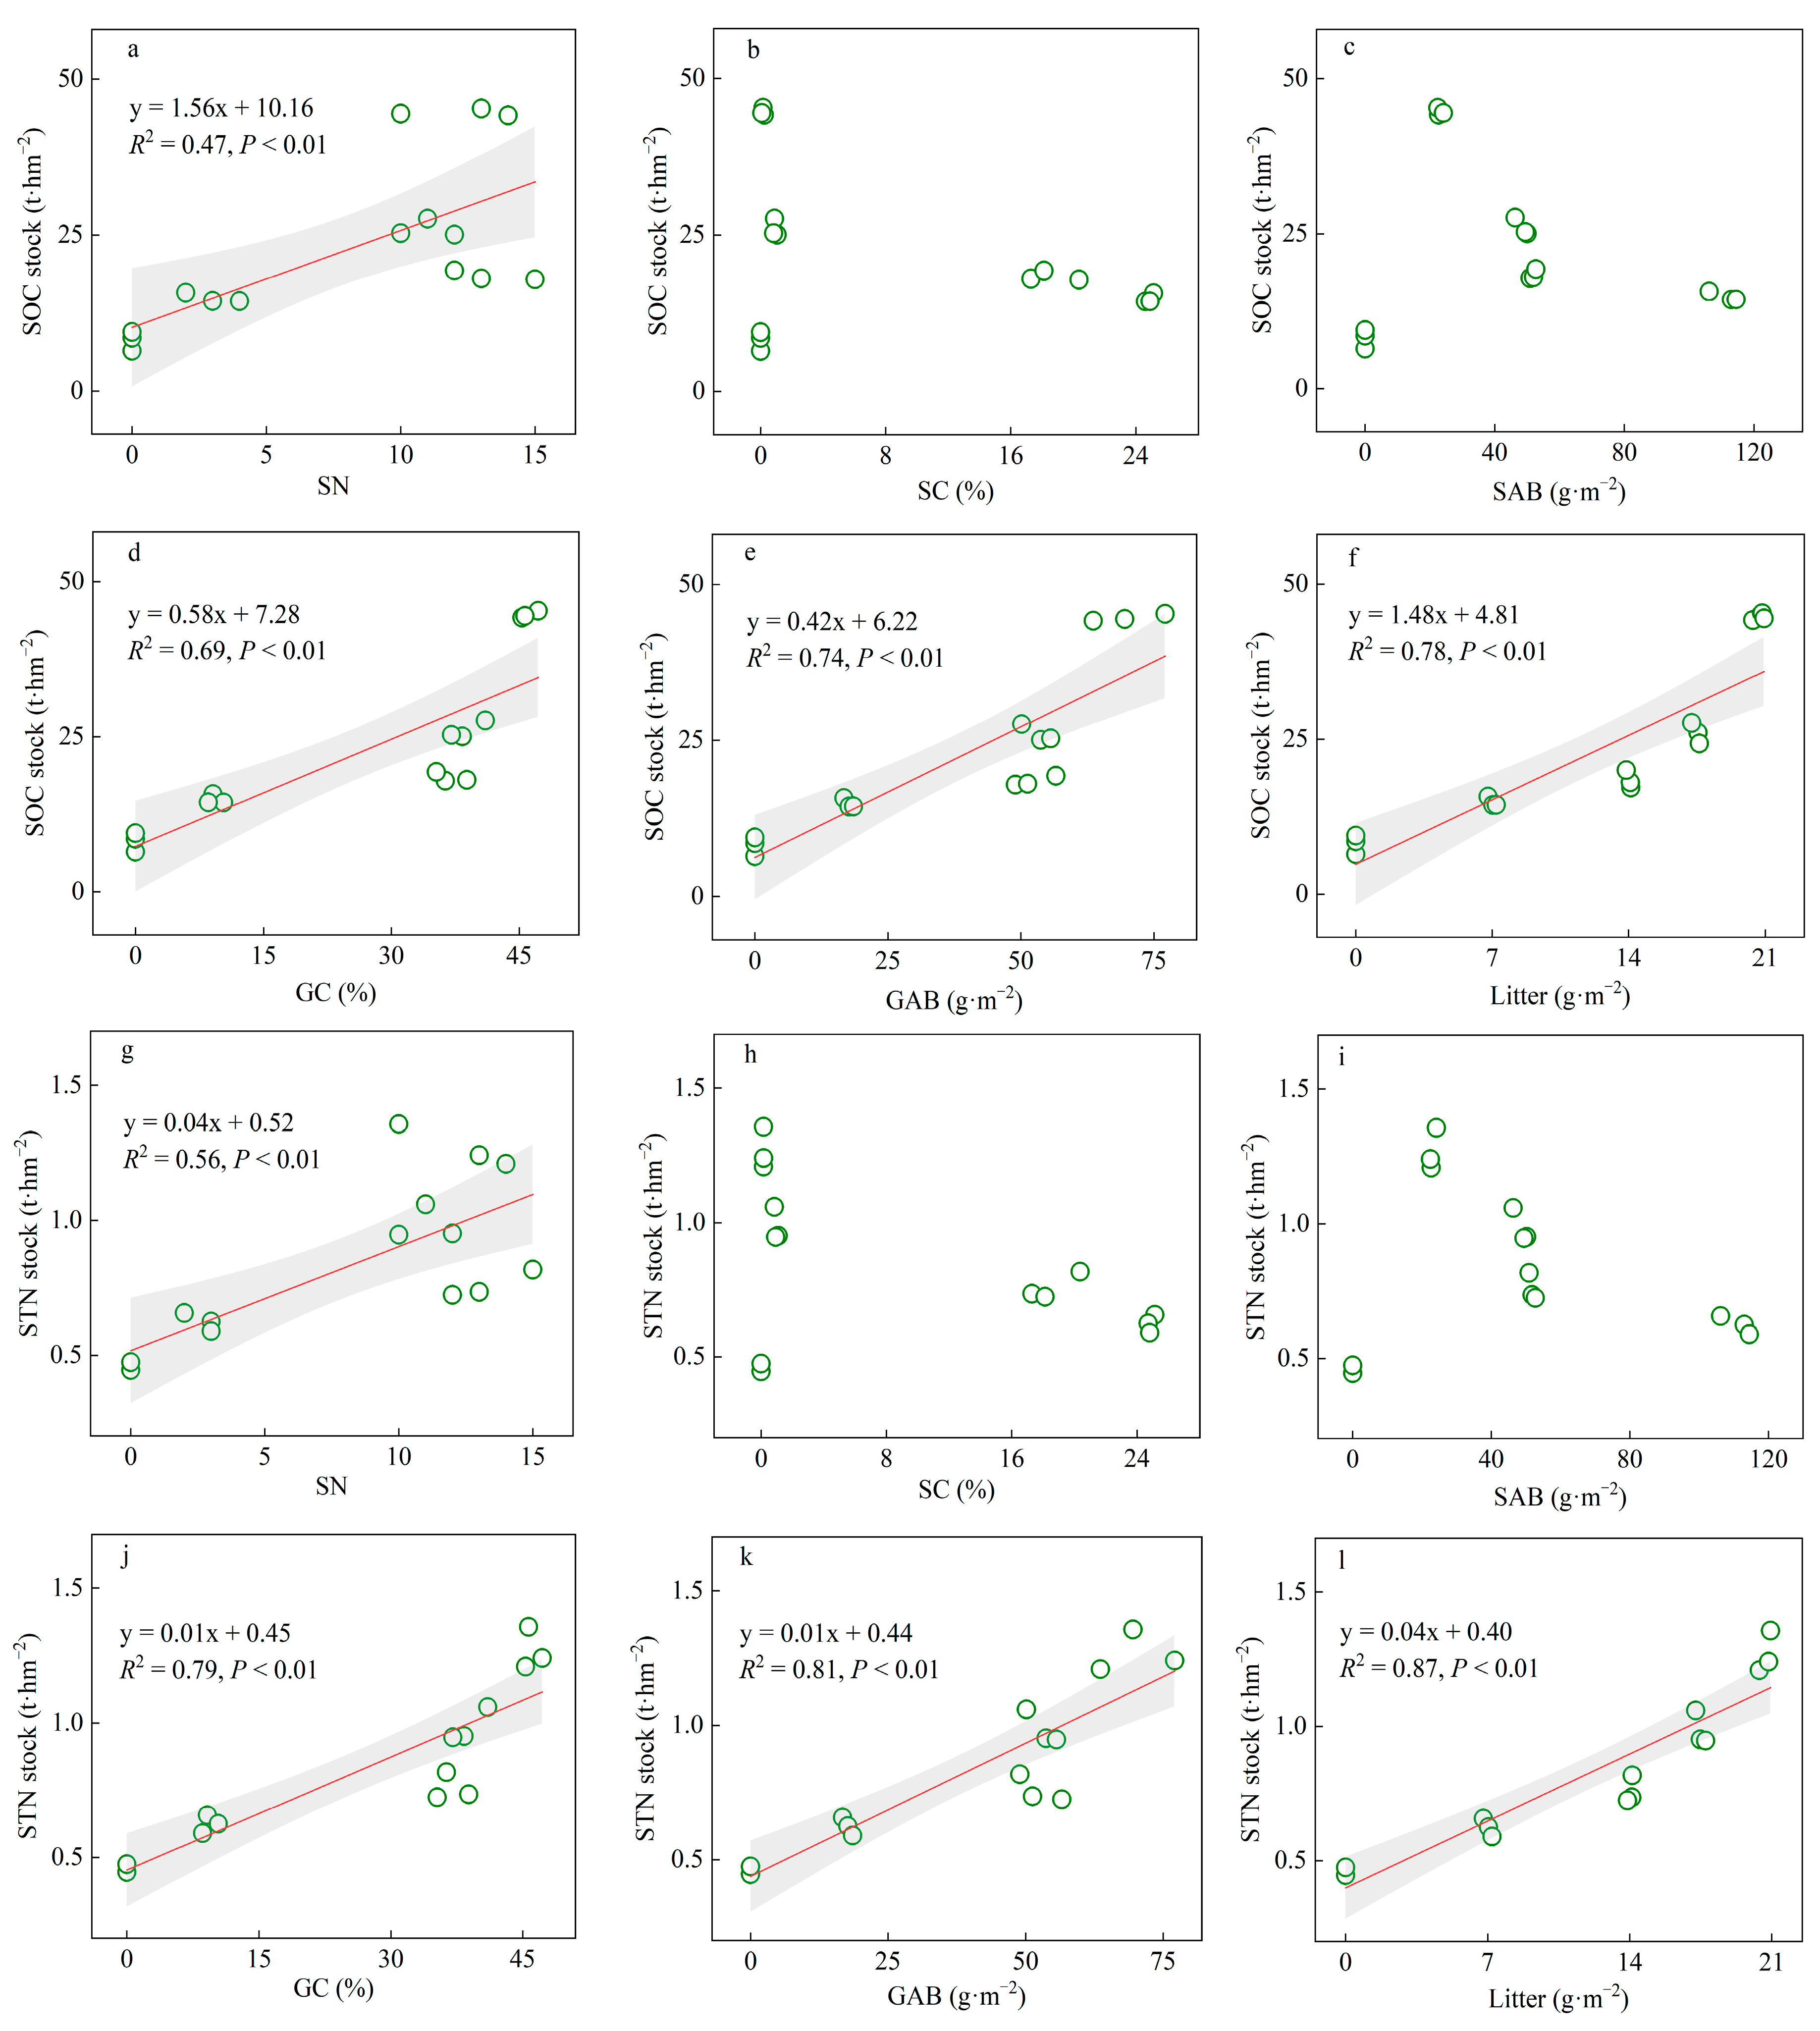
3.4. Correlations of SOC and STN Storage with Aboveground Plant Characteristics

For the entire (i.e., 0–40 cm) profile, stocks of SOC and STN were positively correlated with the number of species, understory herb coverage, aboveground biomass of grass, and total amount of litter (p < 0.001; SOC, Figure 5a,d–f; for STN, Figure 5g,j–l). However, there was no correlation found with either shrub cover or aboveground biomass (p > 0.05; SOC, Figure 5b,c; for STN, Figure 5h,i). For the entire afforestation chronosequence, the soil C:N ratio in the 0–40 cm soil profile was positively correlated with stand age (Figure 6a, p < 0.001), and the SOC stock in the 0–40 cm soil profile was positively correlated with its STN stock (Figure 6b) along with the soil C:N ratio (Figure 6c, p < 0.001).

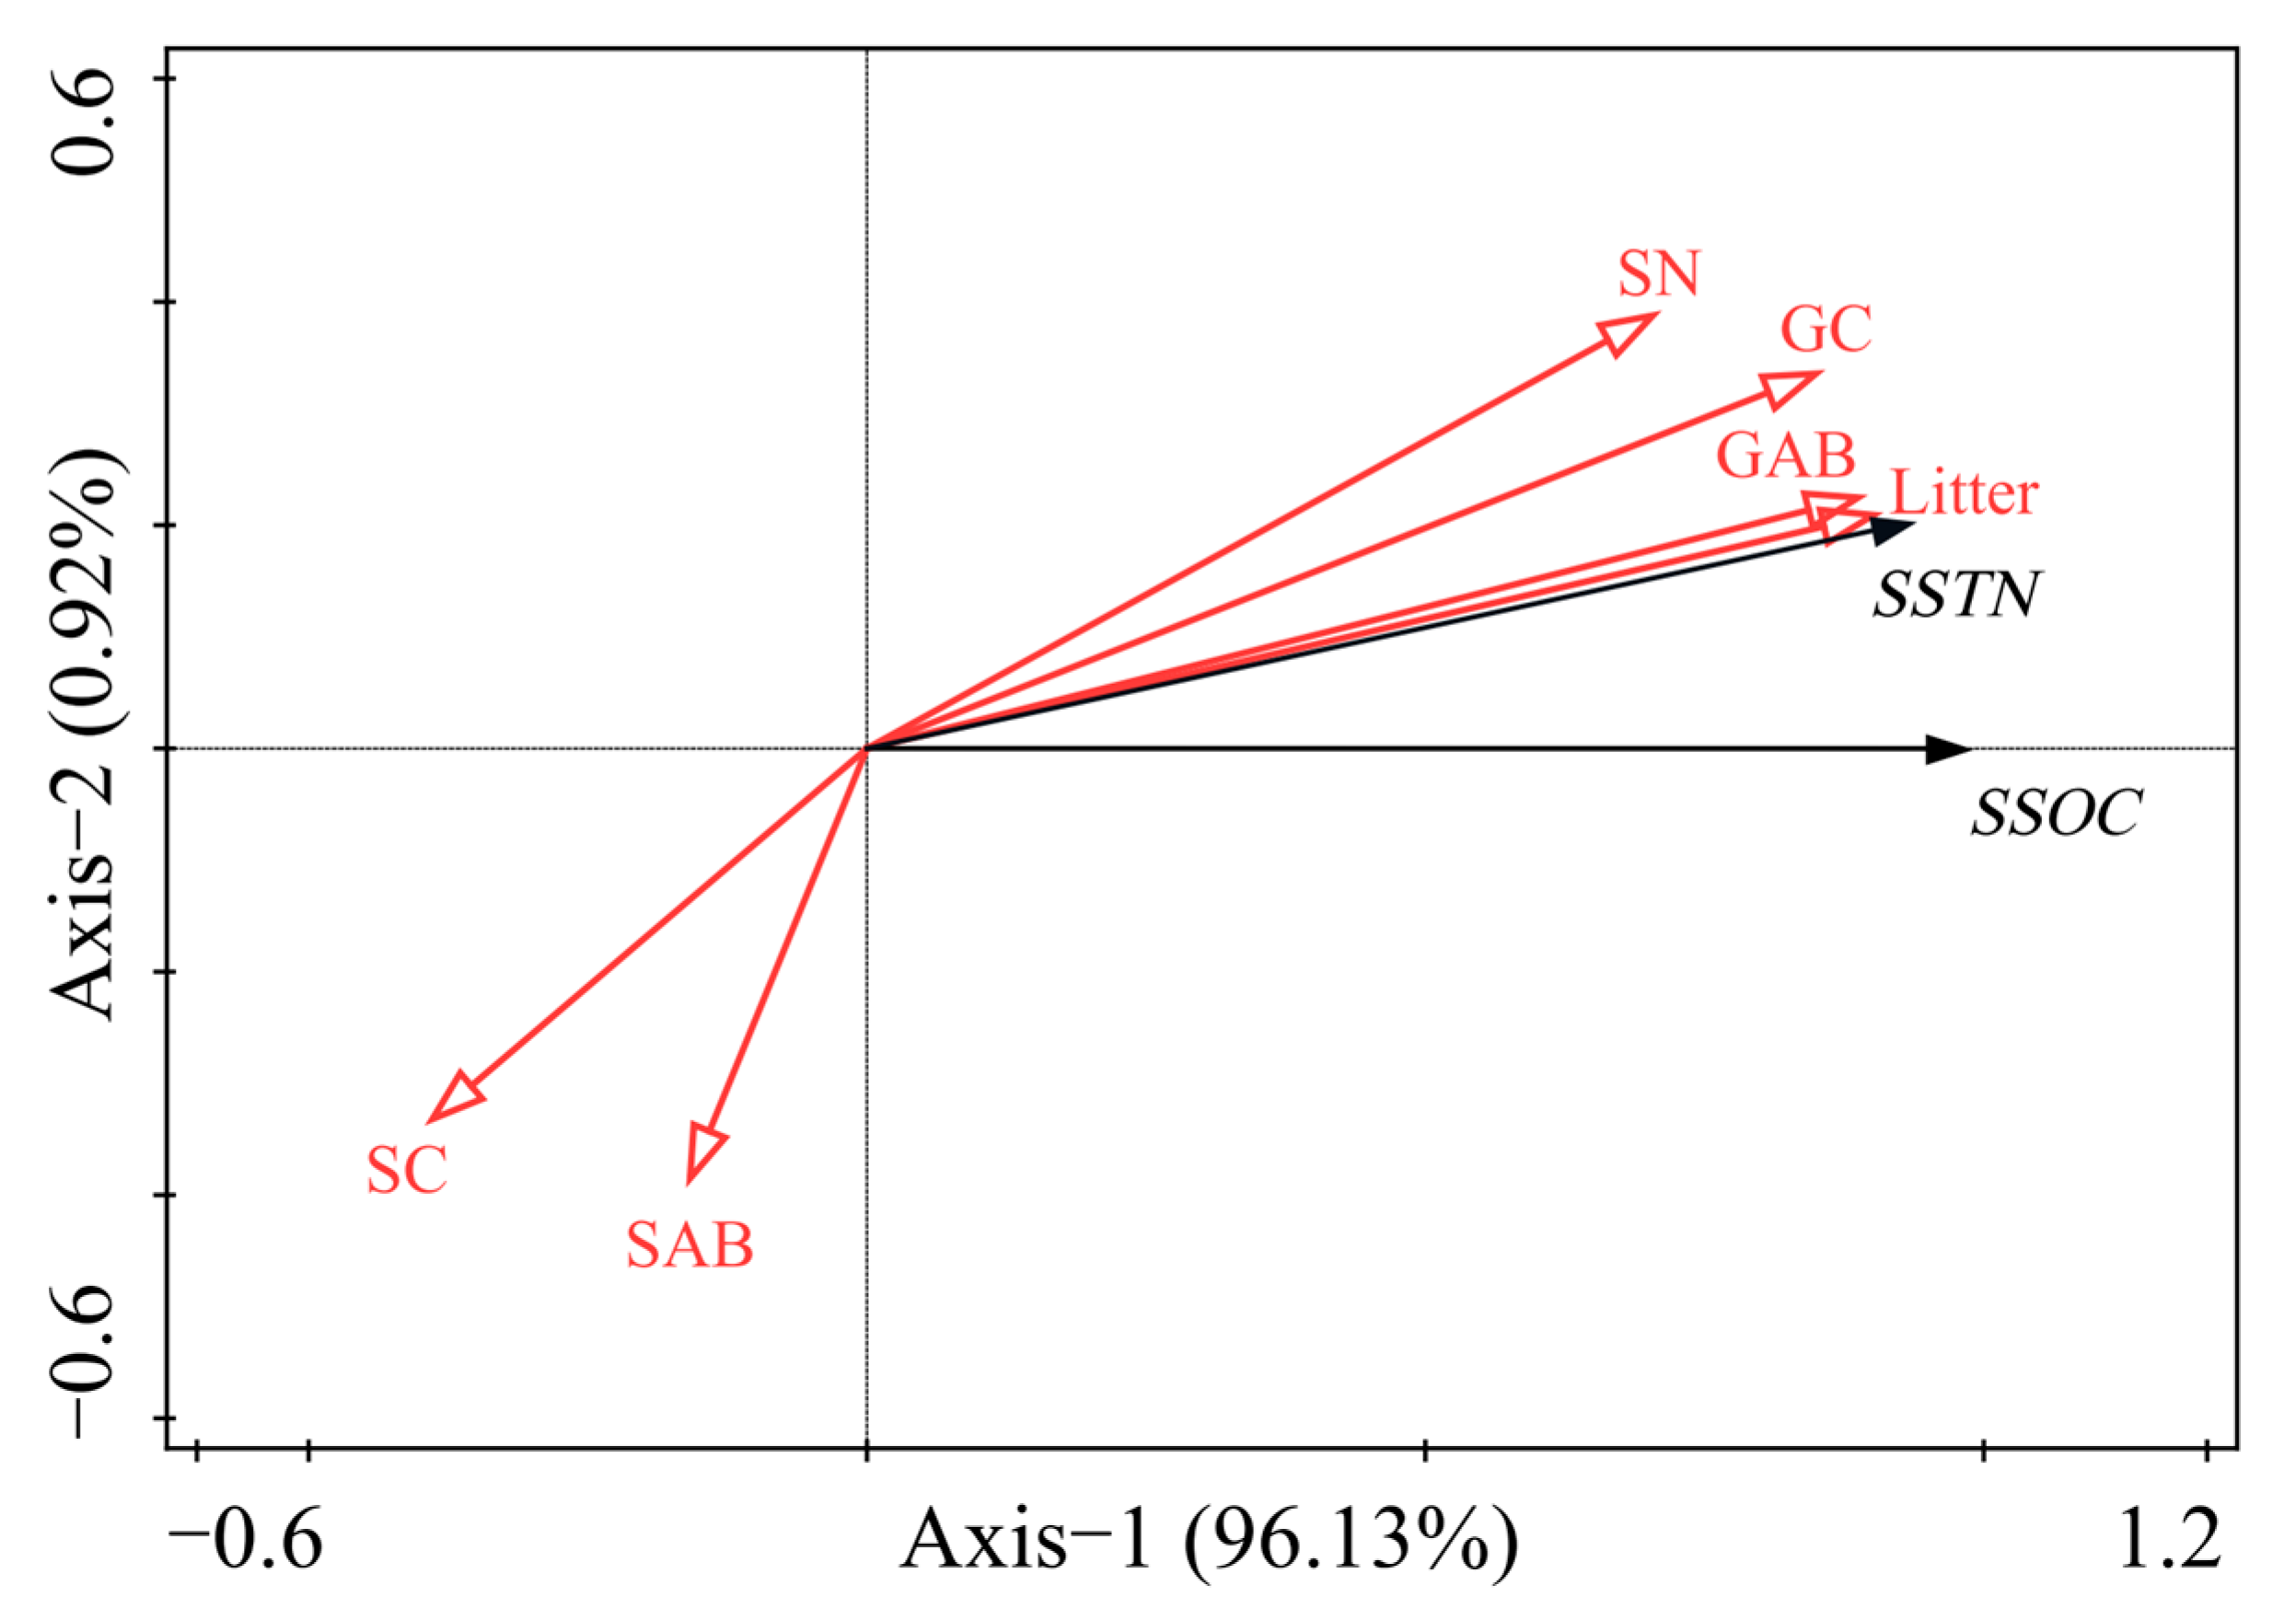
3.5. Relation of SOC and STN Stocks to Vegetation Characteristics

All model axes were significant according to the Monte Carlo permutation test (p = 0.016) (Table 3). However, the first two axes in the RDA cumulatively explained 97.1% of the variance, indicating they captured well the relationships of vegetation characteristics (explanatory variables) vis-à-vis SOC and STN stocks in the afforestation chronosequence in Mu Us Desert. That is, together they explained most of the information relating C and N accumulation to vegetation elements in the C. korshinskii sand-fixing stands (Figure 7). Monte Carlo testing revealed that the total amount of litter and number of species were the two vegetation characteristics that significantly influenced both SOC and STN stocks, respectively, accounting for 79.7% and 9.4% of their variance and contributing 83.9% and 9.9% (p < 0.05) (Table 3).

4. Discussion

4.1. Effects of C. korshinskii Afforestation on SOC and STN

As fundamental soil nutrient components, both SOC and STN are indispensable participants in the cycling of material in ecosystems [29]. Recent research has demonstrated that afforestation can enhance the nutrient status of desert soil [30]. In our study, with an increasing stand age of the forest plantations, the SOC and STN contents increased markedly, as did the amount of litter, which would have increased organic matter input to the soil over time.
In the early stages of sand-fixing afforestation, the desert habitat was relatively harsh with few if any understory herbaceous plants, leaving the ecosystem dominated by the drought-tolerant C. korshinskii. However, this legume shrub can form a robust crown structure that provides crucial shade, which would limit water evaporation to a certain extent to augment the moisture content of the surface soil, thereby reducing wind erosion to help stabilize the surface of dunes. In this way, the fixation of soil will accordingly change its physicochemical properties and lead to greater contents of soil C as well as N [13]. In the course of this sand-fixing process via C. korshinskii afforestation, as its duration lengthened, the species diversity of the understory herbaceous layer increased, and perennial herbaceous plants appeared. Although the individual biomass and coverage of C. korshinskii eventually decreased, the biomass yield of herbaceous plants increased substantially. This could compensate for the loss of SOC and STN caused by the inevitable stand degradation of C. korshinskii, whose litter decomposes more easily than that of lignified shrubs [31]. Furthermore, over time, as the sand-fixing shrub stands get older, their species composition tends to become more complex and relatively stable, and the habitat is gradually improved overall. The improvement of habitat would provide a favorable environment for the colonization, growth, and propagation of soil microorganisms, whose greater presence in both abundance and kind could have hastened the decomposition of plant residues to return more C and N elements to the soil [32]. Microbial biomass carbon follows SOC [10], which is increasing continuously across the range of stand ages. In contrast, vascular plant richness increases sharply at first across this range, but then stabilizes abruptly. This is conducive to the stability of the community, and the stable community would promote the accumulation of soil C and N.
In this study, in going from a mobile sand dune to a 70-year-old fixed dune, the amount of litter amount increased drastically, from 0 to 20.7 g·m−2. In tandem, the SOC and STN contents also increased significantly due to litter accumulation, rising from 4.1 to 20.8 g·kg−1 and 0.2 to 0.8 g·kg−1, respectively. These results provide compelling evidence that vegetation restoration can effectively increase the C and N contents of desert soil, a finding consistent with that of both Qi et al. [33] and Li et al. [34] in the Taklimakan Desert. When soil water and fertilizer conditions are sufficiently improved, more nutrients are available in soil to sustain plant growth, and vegetation can grow better. This kind of synergistic and interactive feedback relationship between plants and soil has become the driving force behind the benign development of desert ecosystems [35].
Our results show that the SOC as well as STN contents consistently reached their maximum in the topmost soil layer (0–10 cm depth), which likely had a surface aggregation effect, in line with other reported research findings [20,36]. The nutrients contained in fresh litter are first returned to the soil surface, after which they migrate into deeper soil with water or via other media [37]. That is, SOC stratification reveals a dominance of shoot litter inputs over those from belowground. Moreover, as its stands grew older, the deep-rooted shrub C. korshinskii was gradually replaced by shallow-rooted herbs, a shift in dominance which would have concentrated rainwater, nutrients, and root exudates in the surface soil layer, thus enhancing the accumulation of surface soil organic matter and soil C and N there. Conversely, this would lessen the rate at which C and N could accumulate over time in deeper soil.

4.2. Effects of C. korshinskii Afforestation on Stocks of SOC and STN

Afforestation in desert ecosystems can effectively expand their surface vegetation coverage, and over the course of community succession, the litter from plants accumulates under the shrub canopy, essentially forming a “resource island” [38]. These ecological changes inevitably alter desert landform characteristics, to hinder or even reverse the soil desertification process, while bolstering the C and N stocks of the ecosystem. We find that for SOC and STN, their content and stock in afforested dunes are considerably higher than in the mobile dune, increasing over time as the stands aged. After 70 years of afforestation with C. korshinskii, the SOC and STN stocks went from 8.1 and 0.5 t·hm−2 to 44.6 and 1.3 t·hm−2, respectively, strongly suggesting that shrub afforestation in arid regions is a promising way to improve their soil C and N sequestration while also restoring soil quality [39].
In general, C and N in soil should accumulate in ecosystems whenever their corresponding inputs are greater or their losses are lower [40]. By studying the soil–vegetation relationship across desertification stages in the southeast margin of Mu Us Desert, Yang et al. [41] found that the main source of soil C and N inputs was litter decomposition. Accordingly, the presence of more litter should result in a greater accumulation of C and N in soil [42]. Consistent with that, we find that the amount of litter strongly influenced both stocks of soil C and N. With the growth and development of C. korshinskii stands, the ecological environment was generally improved, the plant community biomass increased, and so more dead leaves were produced; these entered the soil via decomposition and mineralization, thus fostering the retention of soil C and N stocks [40]. Furthermore, the number of plant species also affected soil C and N stocks. Species richness increased over time in the understory of the planted C. korshinskii stands, often accompanied by an increasing herbaceous biomass, which would have enabled more organic matter such as humus and roots to accumulate in soil, thus bolstering the accumulation of SOC via soil microbial decomposition [43]. In this study, the number of species first increased sharply within this range, and then stabilized at 30 years. From 30 to 70 years, perennial herbs such as Heteropappus altaicus, Enneapogon desvauxii and Asparagus cochinchinensis were gradually added. Perennial herbs have a stronger ability to resist the environment and maintain community stability than annual herbs [44]. Stable communities will promote the development of biological crusts [45]. Biological soil crusts (BSCs) implanted on the ground surface can effectively reduce wind and sand activity, and because they can fix atmospheric C and N, they can also augment the C and N pools belowground [46].

4.3. Correlations of Soil C and N during Afforestation

Soil N is arguably a limiting element in arid regions, and its availability is not only a pivotal factor governing plant growth dynamics, but it also has an impact on the soil’s long-term accumulation of C [47,48]. We found that, over time, the SOC and STN stocks enlarged in tandem, which points to their coupled relationship. Plausibly, the soil N pool promoted SOC accumulation. Since C. korshinskii is an N-fixing plant, it can function as an additional source of N for input into the ecosystem, which could enhance the organic C accumulation in soil [49]. Therefore, the size of soil N pool can serve as a reliable barometer of C sequestration potential [50]. We also found that SOC stock increased with the soil C:N ratio, a result that agrees with other findings [16,51]. The most plausible scenario to explain this is the ability of the soil C:N ratio to simultaneously govern both nutrient availability and soil enzyme activity, such that a higher C:N ratio is conducive to sequestering SOC [52]. The mean soil C:N ratio is 12.4 in the temperate desert region of China [53]. In the present study, the soil C:N was much higher (ca. 20–40) than the average level of desert areas in China, which was likely conducive to the accumulation of SOC. That is because the increasing C:N of the ecosystem components is an important way to increase the C stock of the ecosystem [54].
In this study, with more years of sand-fixing (along the afforestation chronosequence), especially in later stages (older stands), the changes in the STN and SOC stocks diverged in magnitude, effectively becoming less synchronized. This decoupling was likely driven by higher N absorption by plants [48] and reduced biological nitrogen fixation caused by the degradation of nitrogen-fixing shrubs [49]. Without any intervention, an imbalance in soil N supply and demand is expected, one that will worsen and lead to N-limited conditions, eventually resulting in lower plant productivity that would ultimately slow SOC accumulation [55,56]. Therefore, to ensure the sustainability of afforestation in terms of soil C and N accumulation, it is necessary to optimize management strategies and implement measures related to soil N availability. For example, introducing other N-fixing plant species or even direct fertilization provides an external input of N sources, thereby alleviating the accumulation of C due to N shortages [5,57]. However, enhancing and restoring the soil quality in desert and desertified ecosystems, respectively, is arguably a long-term ecological process. To fully understand how xerophytic shrub afforestation affects related the dynamics of soil C and N sandy land areas and deserts, long-term monitoring and investigation are unavoidable, and sorely needed.

5. Conclusions

By comparing the soil C and N contents and their storage between mobile dune and sand-fixing plantations in the Mu Us Desert, we show that C. korshinskii shrub cultivation is significantly capable of increasing not only the soil C stock (SOC) but also the N stock (STN). These two stocks increased significantly across stand ages, suggesting they likely increase over time, especially in the 0–10 cm soil layer. Accordingly, both SOC and STN seem to mainly accumulate in near ground surface in response to afforestation. The size of the SOC and STN stocks are positively correlated, but over time, as the shrub vegetation grows and ages, the STN stock appears unable to keep pace with the SOC stock’s enlargement, suggesting soil N deficits may eventually limit the accumulation of SOC. Taken together, these results have timely and important implications for devising sustainable management strategies for and after the restoration of desertified ecosystems.

Author Contributions

S.Y.: methodology, data curation, investigation, writing—original draft, writing—review and editing. J.Y. (Junlong Yang): supervision, writing—review and editing. J.M.N.: writing—review and editing. J.Y. (Jun Yang): data curation. B.Y.: investigation. H.Z.: investigation. X.L.: funding acquisition, resources, supervision, validation, writing—review and editing. All authors have read and agreed to the published version of the manuscript.

Funding

This research was funded by Ningxia Natural Sciences Foundation of China, grant number [2022AAC03080].

Data Availability Statement

The authors do not have permission to share data.

Conflicts of Interest

The authors declare that they have no known competing financial interests or personal relationships that could have appeared to influence the work reported in this paper.

References

  1. Becerril-Piña, R.; Mastachi-Loza, C.A.; González-Sosa, E. Assessing desertification risk in the semi-arid highlands of central Mexico. J. Arid Environ. 2015, 120, 4–13. [Google Scholar] [CrossRef]
  2. Torres, L.; Abraham, E.M.; Rubio, C. Desertification research in Argentina. Land Degrad. Dev. 2015, 26, 433–440. [Google Scholar] [CrossRef]
  3. Lal, R. Potential of desertification control to sequester carbon and mitigate the greenhouse effect. Clim. Chang. 2001, 51, 35–72. [Google Scholar] [CrossRef]
  4. Reynolds, J.F.; Smith, D.M.S.; Lambin, E.F.; Turner, B.L.; Mortimore, M.; Batterbury, S.P.J.; Downing, T.E.; Dowlatabadi, H.; Fernandez, R.J.; Herrick, J.E. Global desertification: Building a science for dryland development. Science 2007, 316, 847–851. [Google Scholar] [CrossRef] [PubMed]
  5. Delgado-Baquerizo, M.; Maestre, F.T.; Gallardo, A.; Bowker, M.A. Decoupling of soil nutrient cycles as a function of aridity in global drylands. Nature 2013, 502, 672–676. [Google Scholar] [CrossRef]
  6. Liu, H.; Wu, X.; Yu, P.; Xu, C.; Allen, C.D.; Hartmann, H.; Wei, X.; Dan, Y. Nature-based framework for sustainable afforestation in global drylands under changing climate. Glob. Chang. Biol. 2022, 28, 2202–2220. [Google Scholar] [CrossRef] [PubMed]
  7. Conant, R.T.; Klopatek, J.M.; Klopatek, C.C. Environmental factors controlling soil respiration in three semiarid ecosystems. Soil Sci. Soc. Am. J. 2000, 64, 383–390. [Google Scholar] [CrossRef]
  8. Wohlfahrt, G.; Fenstermaker, L.F.; Arnone, J.A. Large annual net ecosystem CO2 uptake of a Mojave Desert ecosystem. Glob. Chang. Biol. 2008, 14, 1475–1487. [Google Scholar] [CrossRef]
  9. Xu, A.T.; Wu, B.; Fang, B.; Gao, Y.; Li, E.L.; Cao, Y.L.; Qi, L.; Gao, J.L.; Zhi, M.; Liu, M.H. Different responses of growing season ecosystem CO2 fluxes to rain addition in a desert ecosystem. Plants 2023, 12, 1158. [Google Scholar] [CrossRef]
  10. Mcgonigle, T.P.; Turner, W.G. Grasslands and Croplands Have Different Microbial Biomass Carbon Levels per Unit of Soil Organic Carbon. Agriculture 2017, 7, 57. [Google Scholar] [CrossRef]
  11. Batjes, N.H. Total carbon and nitrogen in the soils of the world. Eur. J. Soil Sci. 2014, 65, 10–21. [Google Scholar] [CrossRef]
  12. Esser, G.; Kattge, J.; Sakalli, A. Feedback of carbon and nitrogen cycles enhances carbon sequestration in the terrestrial biosphere. Glob. Chang. Biol. 2011, 17, 819–842. [Google Scholar] [CrossRef]
  13. Liu, X.; Yang, T.; Wang, Q.; Huang, F.; Li, L.H. Dynamics of soil carbon and nitrogen stocks after afforestation in arid and semi-arid regions: A meta-analysis. Sci. Total Environ. 2018, 618, 1658–1664. [Google Scholar] [CrossRef] [PubMed]
  14. Luo, Y.Q.; Field, C.B.; Jackson, R.B. Does nitrogen constrain carbon cycling, or does carbon input stimulate nitrogen cycling? Ecology 2006, 87, 3–4. [Google Scholar] [CrossRef]
  15. Li, X.J.; Li, X.R.; Wang, X.P.; Yang, H.T. Changes in soil organic carbon fractions after afforestation with xerophytic shrubs in the Tengger Desert, northern China. Eur. J. Soil Sci. 2016, 67, 184–195. [Google Scholar] [CrossRef]
  16. Li, X.J.; Li, Y.F.; Xie, T.; Zhang, Z.Q.; Li, X.R. Recovery of soil carbon and nitrogen stocks following afforestation with xerophytic shrubs in the Tengger Desert, North China. Catena 2022, 214, 106277. [Google Scholar] [CrossRef]
  17. Grünzweig, J.M.; Gelfand, I.; Fried, Y.; Yakir, D. Biogeochemical factors contributing to enhanced carbon storage following afforestation of a semi-arid shrubland. Biogeosciences 2007, 4, 891–904. [Google Scholar] [CrossRef]
  18. Xiang, Y.X.; Chen, S.K.; Pan, P.; Ouyang, X.; Ning, J.; Qi, L.; University, J.A. Stoichiometric traits of C, N and P of leaf-litter-soil system of Pinus massoniana forest. J. For. Environ. 2019, 39, 120. [Google Scholar]
  19. Chai, Q.L.; Ma, Z.Y.; An, Q.Q.; Wu, G.L.; Chang, X.F.; Zheng, J.Y.; Wang, G.J. Does Caragana korshinskii plantation increase soil carbon continuously in a water limited landscape on the Loess Plateau, China? Land Degrad. Dev. 2019, 30, 1691–1698. [Google Scholar] [CrossRef]
  20. Li, Y.Q.; Chen, Y.P.; Wang, X.Y.; Niu, Y.Y.; Jie, L. Improvements in soil carbon and nitrogen capacities after shrub planting to stabilize sand dunes in China’ s Horqin Sandy Land. Sustainability 2017, 9, 662. [Google Scholar] [CrossRef]
  21. Tong, X.F.; Yang, H.L.; Ning, Z.Y.; Zhang, Z.Q.; Li, Y.L. Biomass estimation models for dominant sand-fixing shrubs in Horqin sand land. J. Desert Res. 2018, 38, 553–559. [Google Scholar]
  22. Liu, Y.; Ren, Y.; Gao, G.L.; Ding, G.D.; Zhang, Y.; Wang, J.Y.; Guo, Y. Distribution characteristics of soil carbon, nitrogen and phosphorus storage in Pinus sylvestris var. mongolica plantations. Sci. Soil Water Conserv. 2021, 19, 27–34. [Google Scholar]
  23. Zhao, P.B.; He, Y.; Huang, Y.Y.; Li, Y.Y.; Qiu, K.Y.; Xie, Y.Z.; Zhao, X.J.; Chen, l.; Liu, W.S.; Li, H.Q. Spatial heterogeneity of soil nutrients under different stand-fixing shrubs in southern Mu Us sandy land, China. Acta Agrestia Sin. 2021, 29, 2040–2048. [Google Scholar]
  24. He, L.W. Stoichiometric Characteristics of Caragana korshinskii Leaves of Different Planting Years in Ningxia baijitan; Ningxia University: Yinchuan, China, 2021. [Google Scholar]
  25. Yu, S.; Li, X.W.; Wang, R.X.; Yang, J.L.; Ma, L. Succession mechanism and dynamics in artificial Caragana korshinskii sand-fixing forests of different ages in Baijitan of Lingwu. Acta Prataculturae Sin. 2024, 33, 13–23. [Google Scholar]
  26. Jü, L.; Xu, H.; Jin, X.J.; Wang, B.; Wang, X.H.; Ma, J.G. Establishment of the biomass models of Caragana korshinskii based on site factors and their interaction. J. Northwest For. Univ. 2023, 38, 1–7. [Google Scholar]
  27. Gul, S.; Whalen, J.K.; Thomas, B.W.; Sachdeva, V.; Deng, H. Physico-chemical properties and microbial responses in biochar-amended soils: Mechanisms and future directions. Agric. Ecosyst. Environ. 2015, 206, 46–59. [Google Scholar] [CrossRef]
  28. Wang, D.D.; Chakraborty, S.; Weindorf, D.C.; Li, B.; Sharma, A.; Paul, S.; Ali, M.N. Synthesized use of VisNIR DRS and PXRF for soil characterization: Total carbon and total nitrogen. Geoderma 2015, 243–244, 157–167. [Google Scholar] [CrossRef]
  29. Dong, Z.L. The Study of Artificial Haloxylon Forest Distribution of Soil Carbon and Nitrogen Storage and Its Influence Factors in Arid Desert Area; Chinese Academy of Forestry: Beijing, China, 2014. [Google Scholar]
  30. An, F.J.; Su, Y.Z.; Niu, Z.R.; Liu, T.N. Effects of fine particulate matter input on soil carbon and nitrogen accumulation after establishment of Haloxylon ammodendron plantations on shifting sand dunes in arid area. J. Desert Res. 2021, 41, 147–156. [Google Scholar]
  31. Post, W.M.; Kwon, K.C. Soil carbon sequestration and land-use change: Processes and potential. Glob. Chang. Biol. 2000, 6, 317–328. [Google Scholar] [CrossRef]
  32. Feng, Q.; Endo, K.N.; Cheng, G.D. Soil carbon in desertified land in relation to site characteristics. Geoderma 2002, 106, 21–43. [Google Scholar] [CrossRef]
  33. Qi, Y.B.; Chang, Q.R.; Liu, M.Y.; Liu, J.; Chen, T. Characteristics of desertified soil in desertification reversing process by artificial vegetation. Agric. Res. Arid Areas 2011, 29, 180–185. [Google Scholar]
  34. Li, C.J.; Zeng, F.J.; Guo, J.H.; Refkat; Liu, B. Soil properties of different sandy lands under different vegetation recovering levels: A case in Southern Taklimakan Desert. Arid Zone Res. 2015, 32, 1061–1067. [Google Scholar]
  35. Cao, C.Y.; Jiang, D.M.; Teng, X.H.; Jiang, Y.; Liang, W.J.; Cui, Z.B. Soil chemical and microbiological properties along a chronosequence of Caragana microphylla Lam. plantations in the Horqin sandy land of northeast China. Appl. Soil Ecol. 2008, 40, 78–85. [Google Scholar] [CrossRef]
  36. Poeplau, C.; Don, A.; Vesterdal, L.; Leifeld, J.; Wesemael, B.V.; Schumacher, J.; Gensior, A. Temporal dynamics of soil organic carbon after land-use change in the temperate zone- carbon response functions as a model approach. Glob. Chang. Biol. 2011, 17, 2415–2427. [Google Scholar] [CrossRef]
  37. Guo, J.; Wang, B.; Wang, G.B.; Wu, Y.Q.; Cao, F.L. Afforestation and agroforestry enhance soil nutrient status and carbon sequestration capacity in eastern China. Land Degrad. Dev. 2019, 31, 392–403. [Google Scholar] [CrossRef]
  38. Cao, Y.F.; Li, Y.; Li, C.H.; Huang, G.; Lü, G.H. Relationship between presence of the desert shrub Haloxylon ammodendron and microbial communities in two soils with contrasting textures. Appl. Soil Ecol. 2016, 103, 93–100. [Google Scholar] [CrossRef]
  39. Chen, Y.L.; Zhang, Z.S.; Zhao, Y.; Hu, Y.G.; Zhang, D.H. Soil carbon storage along a 46-year revegetation chronosequence in a desert area of northern China. Geoderma Int. J. Soil Sci. 2018, 325, 28–36. [Google Scholar] [CrossRef]
  40. Niu, X.W.; Zhang, Q.; Yang, Z.P.; Chen, B.; Shi, Q.L.; Liu, P.; Lei, L. Research on change of soil properities of Caragana plantation in North-west of Shanxi Province. Acta Bot. Boreali-Occident. Sin. 2003, 4, 628–632. [Google Scholar]
  41. Yang, M.H.; Zhu, Z.M.; Cao, M.M.; Wang, C.J.; Xie, Y. Study on the correlation of soil vegetation in different desertification stages on the southeastern edge of Mu Us Sandy Land. J. Northwest A&F Univ. (Nat. Sci. Ed.) 2010, 38, 181–187. [Google Scholar]
  42. Berg, B. Decomposing litter; limit values; humus accumulation, locally and regionally. Appl. Soil Ecol. 2018, 123, 494–508. [Google Scholar] [CrossRef]
  43. Lange, M.; Eisenhauer, N.; Sierra, C.A.; Bessler, H.; Engels, C.; Griffiths, R.I.; Mellado-Vázquez, P.G.; Malik, A.A.; Roy, J.; Scheu, S. Plant diversity increases soil microbial activity and soil carbon storage. Nat. Commun. 2015, 6, 6707. [Google Scholar] [CrossRef]
  44. Xu, X.H.; Zhang, W.H.; Zhang, H.; Zhen, H.W.; Wang, Z.H.; Zheng, J.W. Study on the species diversity dyna mics of Sophora davidii community in Loess hilly region. J. Agric. Cult. Univ. Hebei 2006, 29, 1–5. [Google Scholar]
  45. Bowker, M.A.; Maestre, F.T.; Escolar, C. Biological crusts as a model system for examining the biodiversity-ecosystem function relationship in soils. Soil Biol. Biochem. 2009, 42, 405–417. [Google Scholar] [CrossRef]
  46. Housman, D.C.; Powers, H.H.; Collins, A.D.; Belnap, J. Carbon and nitrogen fixation differ between successional stages of biological soil crusts in the Colorado Plateau and Chihuahuan desert. J. Arid Environ. 2006, 66, 620–634. [Google Scholar] [CrossRef]
  47. Martens, D.A.; Reedy, T.E.; Lewis, D. Soil carbon content and composition of 130-year crop, pasture and forest land-use managements. Glob. Chang. Biol. 2003, 10, 65–78. [Google Scholar] [CrossRef]
  48. Li, X.J.; Yang, H.T.; Shi, W.L.; Li, Y.F.; Guo, Q. Afforestation with xerophytic shrubs accelerates soil net nitrogen nitrification and mineralization in the Tengger Desert, Northern China. Catena 2018, 169, 11–20. [Google Scholar] [CrossRef]
  49. Hoogmoed, M.; Cunningham, S.C.; Baker, P.J.; Beringer, J.; Cavagnaro, R.T. Is there more soil carbon under nitrogen-fixing trees than under non-nitrogen-fixing trees in mixed-species restoration plantings? Agric. Ecosyst. Environ. 2014, 188, 80–84. [Google Scholar] [CrossRef]
  50. Morris, S.J.; Bohm, S.; Haile-Mariam, S.; Paul, E.A. Evaluation of carbon accrual in afforested agricultural soils. Glob. Chang. Biol. 2007, 13, 1145–1156. [Google Scholar] [CrossRef]
  51. Guo, Y.J.; Ma, X.J.; Yu, S.; Xu, D.M. Effects of reseeding on soil organic carbon content and its distribution in degrade desert steppes. Acta Agrestia Sin. 2019, 27, 315–319. [Google Scholar]
  52. Weintraub, S.R.; Wieder, W.R.; Cleveland, C.C.; Townsend, A.R. Organic matter inputs shift soil enzyme activity and allocation patterns in a wet tropical forest. Biogeochemistry 2013, 114, 313–326. [Google Scholar] [CrossRef]
  53. Tian, H.Q.; Chen, G.H.; Zhang, C.; Melillo, J.M.; Hall, C.A.S. Pattern and variation of C:N:P ratios in China’s soils: A synthesis of observational data. Biogeochemistry 2010, 98, 139–151. [Google Scholar] [CrossRef]
  54. Herbert, D.A.; Williams, M.; Rastetter, E.B. A model analysis of N and P limitation on carbon accumulation in Amazonian secondary forest after alternate land-use abandonment. Biogeochemistry 2003, 65, 121–150. [Google Scholar] [CrossRef]
  55. LeBaue, D.S.; Treseder, K.K. Nitrogen limitation of net primary productivity in terrestrial ecosystems is globally distributed. Ecology 2008, 89, 371–379. [Google Scholar] [CrossRef] [PubMed]
  56. Schulte-Uebbing, L.; De Vries, W. Global-scale impacts of nitrogen deposition on tree carbon sequestration in tropical, and boreal forests: A meta-analysis. Glob. Chang. Biol. 2018, 24, e416–e431. [Google Scholar] [CrossRef]
  57. Han, X.Y.; Gao, G.Y.; Li, Z.S.; Chang, R.Y.; Jiao, L.; Fu, B.J. Effects of plantation age and precipitation gradient on soil carbon and nitrogen changes following afforestation in the Chinese Loess Plateau. Land Degrad. Dev. 2019, 30, 2298–2310. [Google Scholar] [CrossRef]
Figure 1. Study area and its sampling sites corresponding to four Caragana korshinskii shrub plantations differing in age: 10 years (S10), 30 years (S30), 50 years (S50), and 70 years old (S70), along with mobile sand dune (S0) as the non-afforested control.
Forests 15 01018 g001
Figure 2. General overview of the research sites in Mu Us Sandy Land. The four S10 to S70 sites were planted with the legume shrub Caragana korshinskii. The moving dune in the middle of the far-left panel shows the initial state common to all stand ages.
Forests 15 01018 g002
Figure 3. Soil bulk density (a), SOC concentration (b), STN concentration (c), and C:N ratio (d) of three soil depth layers in the mobile sand dune (0 years, in orange) and different-aged plantation stands of the Caragana korshinskii shrub. Within the same soil depth layer, different lower-case letters indicate significantly different (p < 0.05, LSD) mean values (±SE, n = 3 plots). SOC, soil organic carbon; STN, soil total nitrogen; likewise, below.
Forests 15 01018 g003
Figure 4. The changed size of the SOC (a) and STN (b) stocks in three soil depth layers, and their relative contributions (c,d) at five sites in the afforestation chronosequence: mobile sand dune (0 years) and the increasingly older sand-fixing plantation stands of the Caragana korshinskii shrub. Different lower-case letters indicate significant differences (p < 0.05, LSD) among SOC or STN stocks under the different stand ages of the C. korshinskii shrub.
Forests 15 01018 g004
Figure 5. Size of the SOC and STN stocks as a function of the SN (a,g), SC (b,h), SAB (c,i), GC (d,j), SAB (c,i) or GAB (e,k), and total litter(f,l) in the Caragana korshinskii afforestation chronosequence. SN, number of species; SC, shrub coverage; GC, grass coverage; SAB, shrub aboveground biomass; GAB, grass aboveground biomass. Shading indicates the 95% confidence interval of the relationship (regression line).
Forests 15 01018 g005
Figure 6. Relationship of C:N ratio to stand age (a), and that of the SOC stock to the soil STN stock (b) and C:N ratio (c) of the Caragana korshinskii afforestation chronosequence. The shaded area is the 95% confidence interval for the fitted regression curve.
Forests 15 01018 g006
Figure 7. Relationships between vegetation characteristics vis-à-vis stocks of SOC and STN based on the RDA (redundancy analysis). SN, number of species; SC, shrub coverage; SAB, shrub aboveground biomass; GC, grass coverage; GAB, grass aboveground biomass; SSOC, stock of soil organic carbon; and SSTN, stock of soil total nitrogen.
Forests 15 01018 g007
Table 1. Aboveground plant characteristics of the five stand age sites (each with three plots sampled) comprising the afforestation chronosequence.
Stand Age
(years)
Dominant
Species
Species NumberShrub Coverage (%)Shrub Aboveground Biomass (g·m−2)Grass Coverage (%)Grass Aboveground Biomass (g·m−2)Total Litter (g·m−2)
0
10Caragana korshinskii, Corispermum mongolicum2.8 ± 0.824.9 ± 0.6111.2 ± 3.29.3 ± 0.817.7 ± 0.77.0 ± 0.4
30C. korshinskii, Chenopodium album, Heteropappus altaicus, C. mongolicum, Setaria viridis13.4 ± 1.118.6 ± 1.351.9 ± 0.736.8 ± 1.552.3 ± 1.514.0 ± 0.2
50C. korshinskii, Artemisia scoparia, Bassia dasyphylla, Eragrostis pilosa, S. viridis11.2 ± 0.80.9 ± 0.148.6 ± 1.438.8 ± 1.653.2 ± 0.917.5 ± 0.2
70C. korshinskii, C. album, A. scoparia, Enneapogon desvauxii, Asparagus cochinchinensis12.5 ± 1.50.2 ± 0.023.1 ± 0.746.1 ± 0.870.1 ± 1.620.7 ± 0.2
F35.6726.7662.2331.583.52129.9
p<0.001<0.001<0.001<0.001<0.001<0.001
Note: Values are the mean ± standard error, n = 3 plots. For the F-ratio test, the numerator and denominator DF (degrees of freedom) are 3 and 8, respectively.
Table 2. One-way ANOVA for soil characteristics affects by stand age.
Stand Age
(years)
Soil Bulk Density
(g·cm−3)
SOC Concentration
(g·kg−1)
STN Concentration
(g·kg−1)
Soil C:N
Ratio
SOC Stock
(t·hm−2)
STN Stock
(t·hm−2)
01.5 ± 0.51.4 ± 0.40.1 ± 0.117.5 ± 1.98.15 ± 0.20.5 ± 0.5
101.5 ± 0.02.5 ± 0.10.1 ± 0.022.4 ± 0.314.8 ± 0.40.6 ± 0.0
301.5 ± 0.03.24 ± 0.10.1 ± 0.023.7 ± 1.018.4 ± 0.40.8 ± 0.1
501.5 ± 0.14.9 ± 0.20.2 ± 0.026.4 ± 0.726.0 ± 0.81.0 ± 0.1
701.5 ± 0.1 8.9 ± 0.5 0.3 ± 0.0 33.5 ± 1.144.6 ± 0.3 1.3 ± 0.1
F4.6291.5293.528.7499.9105.8
p<0.05<0.001<0.001<0.001<0.001<0.001
Note: Values are the mean ± standard error, n = 3 plots. For the F-ratio test, the numerator and denominator DF (degrees of freedom) are 4 and 10, respectively.
Table 3. Results of the RDA (redundancy analysis) ordination and Monte Carlo permutation tests.
Vegetation PropertiesExplained (%)Contribution (%)Fp
Litter (g·m−2)79.783.939.30.002 **
Number of species9.49.97.70.018 *
Shrub coverage (%)3.13.23.10.118
Grass aboveground biomass (g·m−2)1.51.61.60.256
Shrub aboveground biomass (g·m−2)0.80.90.80.416
Grass coverage (%)0.50.50.50.520
Characteristic parameterRDA1RDA2RDA3RDA4
Eigenvalue0.96130.00920.02940.0001
Explained variation94.0494.9699.44100.00
Correlation0.97860.71520.00000.0000
Test of significance of all canonical axes0.016
* p < 0.05; ** p < 0.005.
Disclaimer/Publisher’s Note: The statements, opinions and data contained in all publications are solely those of the individual author(s) and contributor(s) and not of MDPI and/or the editor(s). MDPI and/or the editor(s) disclaim responsibility for any injury to people or property resulting from any ideas, methods, instructions or products referred to in the content.

