


Variability of Concentrations of Potentially Toxic Metals in the Topsoil of Urban Forest Parks (Southern Poland)

Abstract
:1. Introduction
2. Materials and Methods
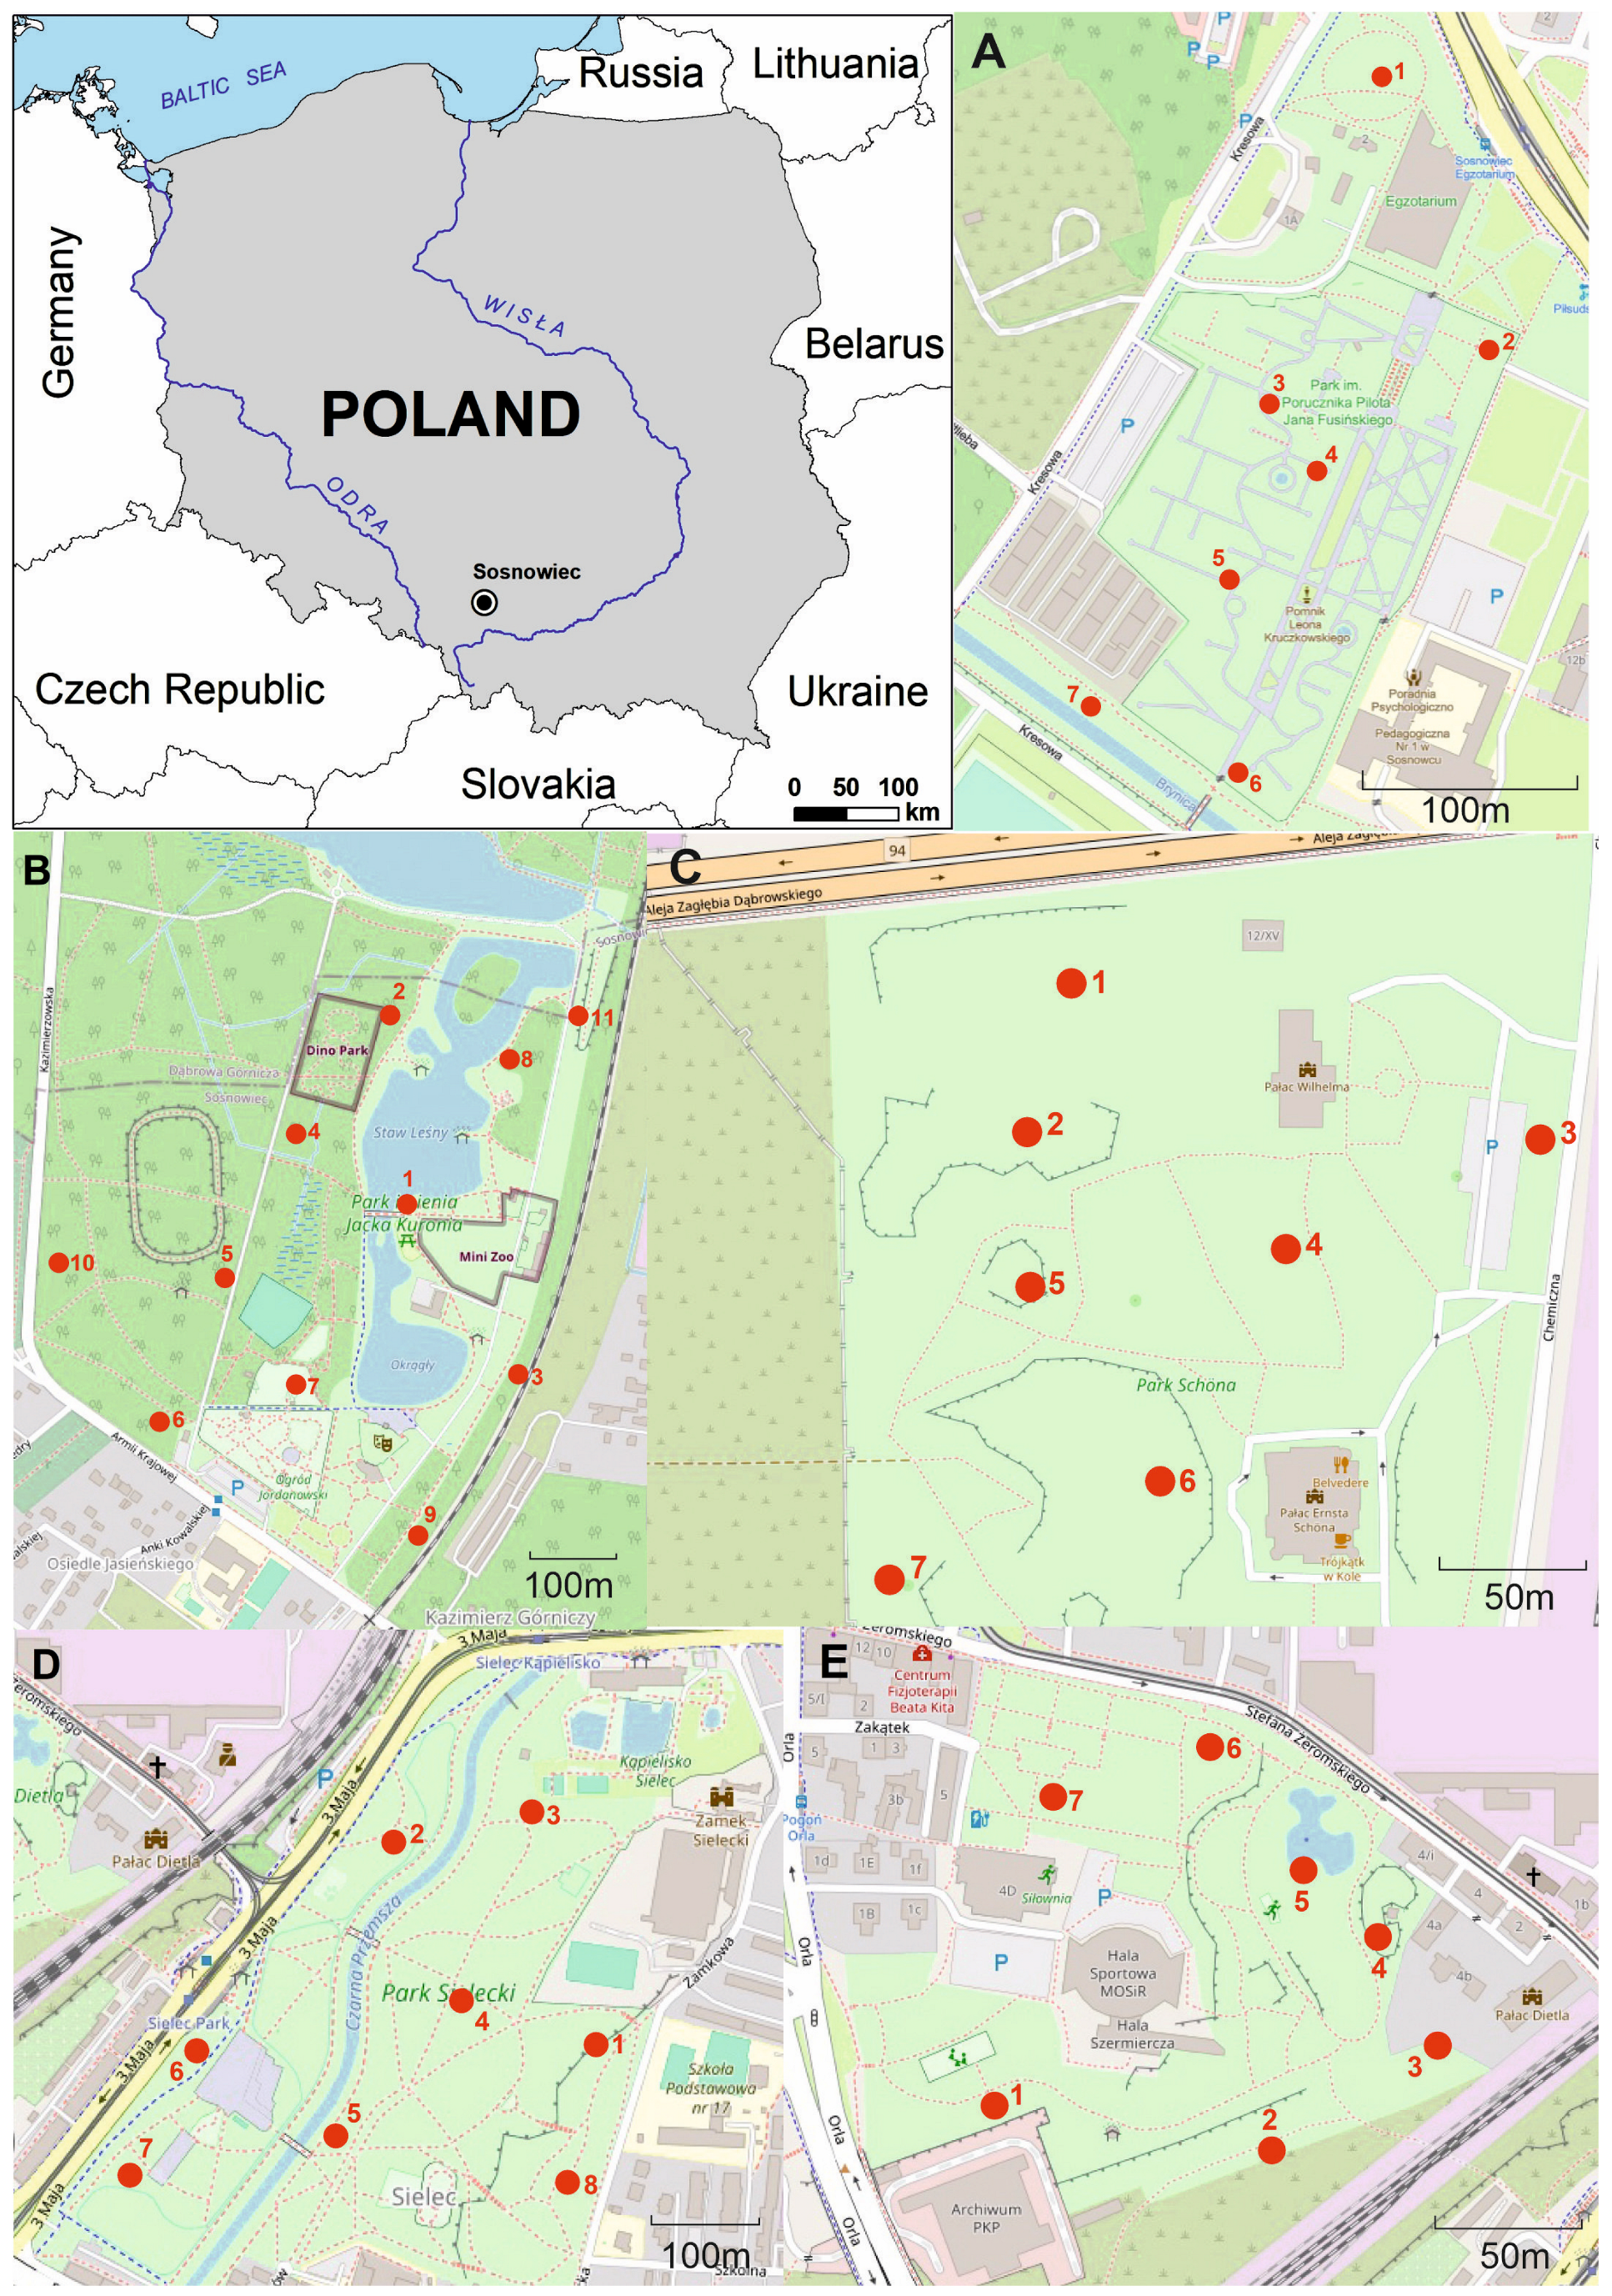
2.1. Study Area and Soil Sampling
2.2. Chemical and Physical Analysis of the Soil
2.3. Data Analyses—Environmental Indices
2.3.1. Enrichment Factors
2.3.2. Contamination Factor
2.3.3. Pollution Load Index
2.3.4. Potential Ecological Risk Index
- RI < 150—low risk
- 150 ≤ RI < 300—moderate risk
- 300 ≤ RI < 600—considerable risk
- 600 ≤ RI—very high risk.
2.3.5. Statistical Data
3. Results
3.1. Physiochemical Properties of Soil
3.2. Concentration of Potential Toxic Elements
| Park Sielecki (PS): | Zn > Pb > Ba > Sr > Cu > Cr > As > Ni > Cd > Co |
| Park Schöena (PSch): | Zn > Ba > Pb > Sr > Cu > Cr > Ni > As > Co > Cd |
| Park Kruczkowski (PK): | Zn > Pb > Ba > Sr > Cu > Cr > As > Ni > Cd > Co |
| Park Dietla (PD): | Zn > Pb > Ba > Sr > Cu > Cr > Ni > As > Cd > Co |
| Park Leśna (PL): | Zn > Pb > Ba > Sr > Cr > Cu > Ni > As > Cd > Co |
3.3. Correlation between Metals
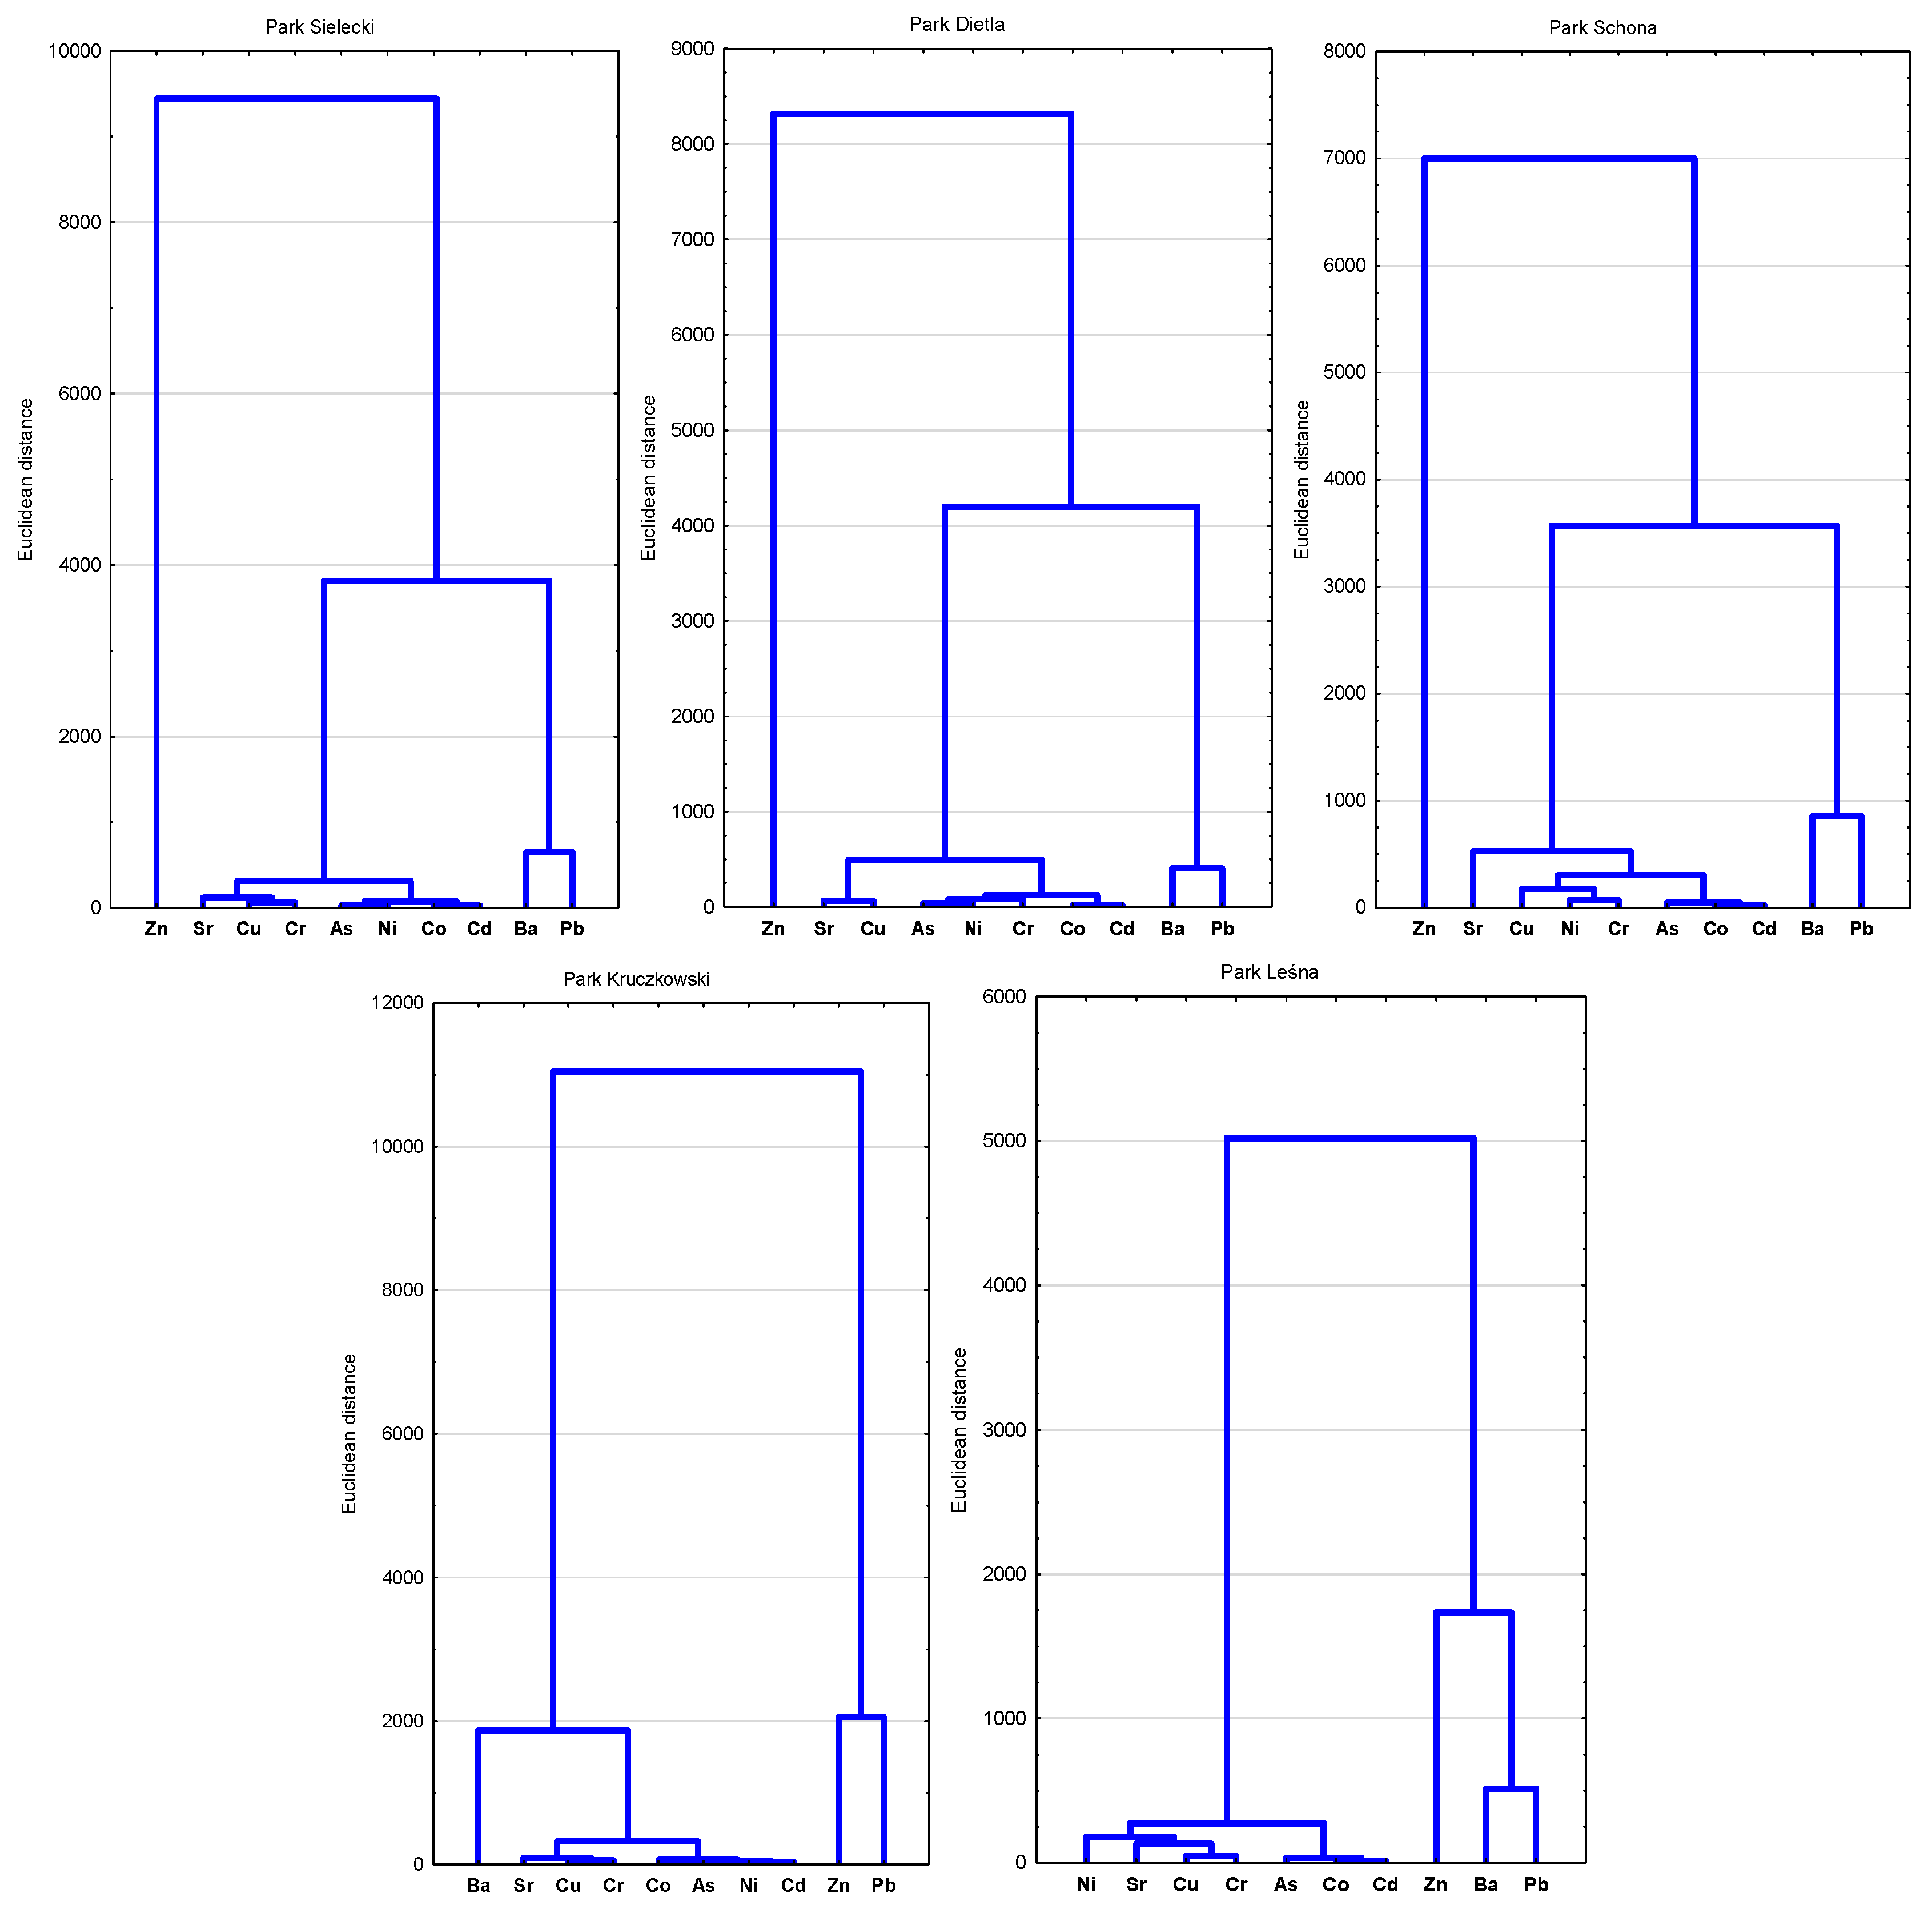
3.4. Similarity of Metal Content in the Parks
3.5. The Risk of Potential Toxic Element Contamination
4. Discussion
4.1. Variability of Basic Soil Properties
4.2. Factors Causing Spatial Variability of Potentially Toxic Elements
5. Conclusions
Supplementary Materials
Author Contributions
Funding
Data Availability Statement
Acknowledgments
Conflicts of Interest
References
- Drozdek, M.E.; Greinert, A.; Kostecki, J.; Tokarska-Osyczka, A.; Wasylewicz, R. Parki tematyczne na miejskich terenach pokopalnianych Sosnowca i Zielonej Góry. Acta Sci. Polonorum. Archit. 2017, 16, 65–77. [Google Scholar] [CrossRef]
- Razzaghian, F.; Rahnama, M.R. Ecological analysis of urban parks (case study: Mashhad Metropolitan). Int. J. Appl. 2012, 2, 136–142. [Google Scholar]
- Breuste, J.; Haase, D.; Elmqvist, T. Urban landscapes and ecosystem services. In Ecosystem Services in Agricultural and Urban Landscapes; Sandhu, H., Wratten, S., Cullen, R., Costanza, R., Eds.; Wiley: Hoboken, NJ, USA, 2013; pp. 83–104. [Google Scholar]
- Rahmonov, O.; Banaszek, J.; Pukowiec-Kurda, K. Relationships between heavy metal concentrations in Japanese knotweed (Reynoutria japonica Houtt.) tissues and soil in urban parks in southern Poland. In Proceedings of the IOP Conference Series: Earth and Environmental Science, Prague, Czech Republic, 3–7 September 2018; IOP Publishing: Bristol, UK, 2019; Volume 221, p. 012145. [Google Scholar] [CrossRef]
- Burghardt, W.; Morel, J.L.; Zhang, G.L. Development of the soil research about urban, industrial, traffic, mining and military areas (SUITMA). Soil Sci. Plant Nutr. 2015, 61 (Suppl. S1), 3–21. [Google Scholar] [CrossRef]
- Charzyński, P.; Hulisz, P.; Bednarek, R. (Eds.) Technogenic Soils of Poland; Polish Society of Soil Science: Toruń, Poland, 2013. [Google Scholar]
- Prokof’eva, T.V.; Poputnikov, V.O. Anthropogenic transformation of soils in the Pokrovskoe-Streshnevo Park (Moscow) and adjacent residential areas. Eurasian Soil Sci. 2010, 43, 701–711. [Google Scholar] [CrossRef]
- Kowalska, J.; Mazurek, R.; Gąsiorek, M.; Setlak, M.; Zaleski, T.; Waroszewski, J. Soil pollution indices conditioned by medieval metallurgical activity–A case study from Krakow (Poland). Environ. Pollut. 2016, 218, 1023–1036. [Google Scholar] [CrossRef] [PubMed]
- Charzyński, P.; Plak, A.; Hanaka, A. Influence of the soil sealing on the geoaccumulation index of heavy metals and various pollution factors. Environ. Sci. Pollut. Res. 2017, 24, 4801–4811. [Google Scholar] [CrossRef]
- Zgłobicki, W.; Telecka, M.; Skupiński, S. Assessment of short-term changes in street dust pollution with heavy metals in Lublin (E Poland)—Levels, sources and risks. Environ. Sci. Pollut. Res. 2019, 26, 35049–35060. [Google Scholar] [CrossRef]
- Chen, T.B.; Zheng, Y.M.; Lei, M.; Huang, Z.C.; Wu, H.T.; Chen, H.; Tian, Q.Z. Assessment of heavy metal pollution in surface soils of urban parks in Beijing, China. Chemosphere 2005, 60, 542–551. [Google Scholar] [CrossRef]
- Li, G.; Sun, G.X.; Ren, Y.; Luo, X.S.; Zhu, Y.G. Urban soil and human health: A review. Eur. J. Soil Sci. 2018, 69, 196–215. [Google Scholar] [CrossRef]
- Rahmonov, O.; Środek, D.; Pytel, S.; Kupka, T.; Makieieva, N. Accumulation of heavy metals in soil and Chelidonium majus L. in an urban environment. J. Elem. 2023, 28, 1329–1351. [Google Scholar] [CrossRef]
- Darko, G.; Dodd, M.; Nkansah, M.A.; Ansah, E.; Aduse-Poku, Y. Distribution and bioaccessibility of metals in urban soils of Kumasi, Ghana. Environ. Monit. Assess. 2017, 189, 1–13. [Google Scholar] [CrossRef] [PubMed]
- Rodríguez-Seijo, A.; Andrade, M.L.; Vega, F.A. Origin and spatial distribution of metals in urban soils. J. Soils Sediments 2017, 17, 1514–1526. [Google Scholar] [CrossRef]
- Ciupa, T.; Suligowski, R.; Kozłowski, R. Trace metals in surface soils under different land uses in Kielce city, south-central Poland. Environ. Earth Sci. 2020, 79, 14. [Google Scholar] [CrossRef]
- Greinert, A. The heterogeneity of urban soils in the light of their properties. J. Soils Sediments 2015, 15, 1725–1737. [Google Scholar] [CrossRef]
- Gąsiorek, M.; Kowalska, J.; Mazurek, R.; Pająk, M. Comprehensive assessment of heavy metal pollution in topsoil of historical urban park on an example of the Planty Park in Krakow (Poland). Chemosphere 2017, 179, 148–158. [Google Scholar] [CrossRef]
- Sarah, P.; Zhevelev, H.M.; Atar, O.Z. Urban park soil and vegetation: Effects of natural and anthropogenic factors. Pedosphere 2015, 25, 392–404. [Google Scholar] [CrossRef]
- Krzyżaniak, M.; Świerk, D.; Antoszewski, P. Factors Influencing the Health Status of Trees in Parks and Forests of Urbanized Areas. Forests 2021, 12, 656. [Google Scholar] [CrossRef]
- Bakhmatova, K.A.; Matynyan, N.N.; Sheshukova, A.A. Anthropogenic soils of urban parks: A review. Eurasian Soil Sci. 2022, 55, 64–80. [Google Scholar] [CrossRef]
- Madrid, L.; Diaz-Barrientos, E.; Ruiz-Cortés, E.; Reinoso, R.; Biasioli, M.; Davidson, C.M.; Duarte, A.C.; Grčman, H.; Hossack, I.; Hursthouse, A.S.; et al. Variability in concentrations of potentially toxic elements in urban parks from six European cities. J. Environ. Monit. 2006, 8, 1158–1165. [Google Scholar] [CrossRef]
- Wesolek, G. Sealing of soils. In Urban Ecology; Marzluff, J.M., Shulenberger, E., Endlicher, W., Alberti, M., Bradley, G., Ryan, C., Simon, U., Zumbunnen, C., Eds.; Springer Science, Business Media LLC: Berlin, Germany, 2008; pp. 161–179. [Google Scholar]
- Stroganova, M.N.; Miagkova, A.D.; Prokof’eva, T.V.; Skvortsova, I.N. Soils of Moscow and Urban Environment; PAIMS Press, Lomonosov Moscow State University: Moscow, Russia, 1998; pp. 1–178. [Google Scholar]
- Han, N.M.M.; Latif, M.T.; Othman, M.; Dominick, D.; Mohamad, N.; Juahir, H.; Tahir, N.M. Composition of selected heavy metals in road dust from Kuala Lumpur city centre. Environ. Earth Sci. 2014, 72, 849–859. [Google Scholar] [CrossRef]
- Rahmonov, O.; Czylok, A.; Orczewska, A.; Majgier, L.; Parusel, T. Chemical composition of the leaves of Reynoutria japonica Houtt. and soil features in polluted areas. Cent. Eur. J. Biol. 2014, 9, 320–330. [Google Scholar] [CrossRef]
- Bezuglova, O.S.; Gorbov, S.N.; Tischenko, S.A.; Aleksikova, A.S.; Tagiverdiev, S.S.; Sherstnev, A.K.; Dubinina, M.N. Accumulation and migration of heavy metals in soils of the Rostov region, south of Russia. J. Soils Sediments 2016, 16, 1203–1213. [Google Scholar] [CrossRef]
- Nezat, C.A.; Hatch, S.A.; Uecker, T. Heavy metal content in urban residential and park soils: A case study in Spokane, Washington, USA. Appl. Geochem. 2017, 78, 186–193. [Google Scholar] [CrossRef]
- Poňavič, M.; Wittlingerová, Z.; Čoupek, P.; Buda, J. Soil geochemical mapping of the central part of Prague, Czech Republic. J. Geochem. Explor. 2018, 187, 118–130. [Google Scholar] [CrossRef]
- Hung, W.C.; Hernandez-Cira, M.; Jimenez, K.; Elston, I.; Jay, J.A. Preliminary assessment of lead concentrations in topsoil of 100 parks in Los Angeles, California. Appl. Geochem. 2018, 99, 13–21. [Google Scholar] [CrossRef]
- Komorowski, A.; Szulc, W. Impact of traffic routes on the content of trace elements in soils in Warsaw agglomeration. Soil Sci. Annu. 2017, 68, 87–92. [Google Scholar] [CrossRef]
- Karczewska, A.; Kabała, C. The soils polluted with heavy metals and arsenic in Lower Silesia-the need and methods of reclamation. Zesz. Nauk. Uniw. Przyr. We Wrocławiu Rol. 2010, 96, 59–80. [Google Scholar]
- Dąbkowska-Naskręt, H.; Różański, S.; Bartkowiak, A. Forms and mobility of trace elements in soils of park areas from the city of Bydgoszcz, north Poland. Soil Sci. Annu. 2016, 67, 73–78. [Google Scholar] [CrossRef]
- Greinert, A.; Fruzińska, R.; Kostecki, J. Urban soils in Zielona Góra. In Technogenic Soils of Poland; Polish Society of Soil Science: Toruń, Poland, 2013; pp. 31–54. [Google Scholar]
- Greinert, A. Technogenic soils in Zielona Góra. In Technogenic Soils Atlas; Charzyński, P., Markiewicz, M., Świtoniak, M., Eds.; Polish Society of Soil Science: Toruń, Poland, 2013; pp. 141–164. [Google Scholar]
- Charzynski, P.; Bednarek, R.; Hulisz, P.; Zawadzka, A. Soils within Torun urban area. In Technogenic Soils of Poland; Polish Society of Soil Science: Torun, Poland, 2013; pp. 17–29. [Google Scholar]
- Łukasik, A.; Szuszkiewicz, M.; Magiera, T. Impact of artifacts on topsoil magnetic susceptibility enhancement in urban parks of the Upper Silesian conurbation datasets. J. Soils Sediments 2015, 15, 1836–1846. [Google Scholar] [CrossRef]
- Müller, G. Index of geo-accumulation in sediments of the Rhine River. Geol. J. 1969, 2, 108–118. [Google Scholar]
- Tomlinson, D.L.; Wilson, J.G.; Harris, C.R.; Jeffrey, D.W. Problems in the assessment of heavy-metal levels in estuaries and the formation of a pollution index. Helgoländer Meeresunters. 1980, 33, 566–575. [Google Scholar] [CrossRef]
- Luo, X.; Yu, S.; Li, X. The mobility, bioavailability, and human bioaccessibility of trace metals in urban soils of Hong Kong. Appl. Geochem. 2012, 27, 995–1004. [Google Scholar] [CrossRef]
- Luo, X.; Yu, S.; Zhu, Y.; Li, X. Trace metal contamination in urban soils of China. Sci. Total Environ. 2012, 421–422, 17–30. [Google Scholar] [CrossRef] [PubMed]
- Abramowicz, A.K.; Rahmonov, O. Element Cycling at Thermally Active Coal-Waste Dumps: A Case Study of Calamagrostis epigejos and Solidago canadensis. Resources 2024, 13, 73. [Google Scholar] [CrossRef]
- Kabata-Pendias, A.; Pedias, H. Biogeochemia Pierwiastków Śladowych; PWN: Warszawa, Poland, 1999. [Google Scholar]
- Łukowski, M. Koncepcja przestrzennego rozwoju miasta. In Rocznik Sosnowiecki; Gołosz, K., Ed.; Muzeum w Sosnowcu: Sosnowiec, Poland, 1999; pp. 9–27. [Google Scholar]
- Nadłonek, W.; Pasieczna, A.; Skreczko, S. Potentially Harmful Elements Content in Soil and Stream Sedi-ments in Southwestern Districts of Katowice (Southern Poland)–Geochemical Record of Historical Industrial Plants’ Activity. Environ. Prot. Nat. Resour. 2023, 34, 154–173. [Google Scholar] [CrossRef]
- Krzysztofik, R.; Rahmonov, O.; Kantor-Pietraga, I.; Dragan, W. The perception of urban forests in post-mining areas: A case study of Sosnowiec-Poland. Int. J. Environ. Res. Public Health 2022, 19, 3852. [Google Scholar] [CrossRef] [PubMed]
- Bednarek, R.M.; Dziadowiec, H.; Pokojska, U.; Prusinkiewicz, Z. Badania Ekologiczno-Gleboznawcze; Wydawnictwo Naukowe PWN, Polish Scientific Press: Warszawa, Poland, 2004; p. 343. [Google Scholar]
- Lis, J.; Pasieczna, A.; Siwek, Z. Geochemical atlas of Poland: 1: 2.500.000; Polish Geological Institute: Warsaw, Poland, 1995. [Google Scholar]
- Pasieczna, A. Naturalne i antropogeniczne czynniki zanieczyszczenia gleb miejskich. Zesz. Naukowe. Górnictwo/Politech. Śląska 2003, 256, 177–184. [Google Scholar]
- Förstner, U. Contaminated sediments. In Lectures on Environmental Aspects of Particle-Associated Chemicals in Aquatic Systems; Lecture Notes in Earth Sciences 21; Springer: Berlin, Germany, 1989; p. 155. [Google Scholar]
- Hakanson, L. An ecological risk index for aquatic pollution control. A sedimentological approach. Water Res. 1980, 14, 975–1001. [Google Scholar] [CrossRef]
- Loska, K.; Wiechuła, D.; Korus, I. Metal contamination of farming soils affected by industry. Environ. Int. 2004, 30, 159–165. [Google Scholar] [CrossRef]
- Barbieri, M. The importance of enrichment factor (EF) and geoaccumulation index (Igeo) to evaluate the soil contamination. J. Geol. Geophys. 2016, 5, 1–4. [Google Scholar] [CrossRef]
- Wedepohl, K.H. The composition of the continental crust. Geochim. Cosmochim. 1995, 59, 1217–1232. [Google Scholar] [CrossRef]
- Duzgoren-Aydin, N.S. Sources and characteristics of lead pollution in the urban environment of Guangzhou. Sci. Total Environ. 2007, 385, 182–195. [Google Scholar] [CrossRef] [PubMed]
- Sezgin, N.; Ozcan, H.K.; Demir, G.; Nemlioglu, S.; Bayat, C. Determination of heavy metal concentrations in street dusts in Istanbul E-5 highway. Environ. Int. 2003, 29, 979–985. [Google Scholar] [CrossRef] [PubMed]
- Napoletano, P.; Colombo, C.; Di Iorio, E.; Memoli, V.; Panico, S.C.; Ruggiero, A.G.; Santorufo, L.; Maisto, G.; De Marco, A. Integrated approach for quality assessment of technosols in experimental mesocosms. Sustainability 2021, 13, 9101. [Google Scholar] [CrossRef]
- Zhu, H.N.; Yuan, X.Z.; Zeng, G.M.; Jiang, M.; Liang, J.; Zhang, C.; Juan, Y.I.N.; Huang, H.J.; Liu, Z.F.; Jiang, H.W. Ecological risk assessment of heavy metals in sediments of Xiawan Port based on modified potential ecological risk index. Trans. Nonferrous Met. Soc. China 2012, 22, 1470–1477. [Google Scholar] [CrossRef]
- Ahamad, M.I.; Song, J.; Sun, H.; Wang, X.; Mehmood, M.S.; Sajid, M.; Su, P.; Khan, A.J. Contamination level, ecological risk, and source identification of heavy metals in the hyporheic zone of the Weihe River, China. Int. J. Environ. Res. Public Health 2020, 17, 1070. [Google Scholar] [CrossRef] [PubMed]
- Rahmonov, O.; Sobala, M.; Środek, D.; Karkosz, D.; Pytel, S.; Rahmonov, M. The spatial distribution of potentially toxic elements in the mountain forest topsoils (the Silesian Beskids, southern Poland). Sci. Rep. 2024, 14, 338. [Google Scholar] [CrossRef] [PubMed]
- Journal of Laws, Item 1395, the Regulations of the Ministry of the Environment, Regarding the Assessment Method of the Pollution of the Earth’s Surface. 2016. Available online: https://isap.sejm.gov.pl/isap.nsf/download.xsp/WDU20160001395/O/D20161395.pdf (accessed on 10 May 2024).
- Greinert, A. Studia Nad Glebami Obszaru Zurbanizowanego Zielonej Góry; Oficyna Wydawnicza Uniwersytetu Zielonogórskiego: Zielona Góra, Poland, 2003; ISBN 978-83-7481-437-9. [Google Scholar]
- Różkowski, K.; Różkowski, J.; Rahmonov, O. The Historical Aspect of the Impact of Zn and Pb Ore Mining and Land Use on Ecohydrological Changes in the Area of the Biała Przemsza Valley (Southern Poland). Land 2023, 12, 997. [Google Scholar] [CrossRef]
- Galušková, I.; Mihaljevič, M.; Borůvka, L.; Drábek, O.; Frühauf, M.; Němeček, K. Lead isotope composition and risk elements distribution in urban soils of historically different cities Ostrava and Prague, the Czech Republic. J. Geochem. Explor. 2014, 147, 215–221. [Google Scholar] [CrossRef]
- Matinyan, N.N.; Bakhmatova, K.A.; Korentsvit, V.A. Soils of the summer garden (Saint Petersburg). Eurasian Soil Sci. 2017, 50, 637–645. [Google Scholar] [CrossRef]
- Kusinska, A. Przemiany substancji organicznej w glebach zieleńców i parków miasta Łodzi. Rocz. Glebozn. 1991, 42, 101–107. [Google Scholar]
- Pokojska, U. Adsorbtion and Exchange of Cations by Forest Humus; UMK Press: Toruń, Poland, 1992. [Google Scholar]
- Oliver, M.A. Soil and human health: A review. Eur. J. Soil Sci. 1997, 48, 573–592. [Google Scholar] [CrossRef]
- Rahmonov, O.; Pukowiec-Kurda, K.; Banaszek, J.; Brom, K. Floristic diversity in selected city parks in southern Poland. Environ. Prot. Nat. Resour. 2019, 30, 8–17. [Google Scholar] [CrossRef]
- Lee, C.S.L.; Li, X.; Shi, W.; Cheung, S.C.N.; Thornton, I. Metal contamination in urban, suburban, and country park soils of Hong Kong: A study based on GIS and multivariate statistics. Sci. Total Environ. 2006, 356, 45–61. [Google Scholar] [CrossRef] [PubMed]
- Burt, R.; Hernandez, L.; Shaw, R.; Tunstead, R.; Ferguson, R.; Peaslee, S. Trace element concentration and speciation in selected urban soils in New York City. Environ. Monit. Assess. 2014, 186, 195–215. [Google Scholar] [CrossRef] [PubMed]
- Huot, H.; Joyner, J.; Córdoba, A.; Shaw, R.K.; Wilson, M.A.; Walker, R.; Muth, T.R.; Cheng, Z. Characterizing urban soils in New York City: Profile properties and bacterial communities. J. Soils Sediments 2017, 17, 393–407. [Google Scholar] [CrossRef]
- Dao, L.; Morrison, L.; Zhang, H.; Zhang, C. Influences of traffic on Pb, Cu and Zn concentrations in roadside soils of an urban park in Dublin, Ireland. Environ. Geochem. Health 2014, 36, 333–343. [Google Scholar] [CrossRef] [PubMed]
- Różkowski, J.; Rahmonov, O.; Zarychta, R.; Zarychta, A. Environmental Transformation and the Current State of Hydrogeological Condition in the Wojkowice Area—Southern Poland. Resources 2021, 10, 54. [Google Scholar] [CrossRef]
- Chudecka, J. Characteristics of the Soil Substrate in the Anthropogenic Layer of the Oldest Part of Szczecin; University Publishing House of the West Pomeranian University of Technology: Szczecin, Poland, 2009. [Google Scholar]
- Drozd, J. Soils of urban areas and methods of improving their fertility. In Art of Gardens in the Cityscape; Publishing House of Wroclaw University of Technology: Wroclaw, Poland, 1997; pp. 167–172. [Google Scholar]
- Cachada, A.; Pato, P.; Rocha-Santos, T.; da Silva, E.F.; Duarte, A.C. Levels, Sources and Potential Human Health Risks of Organic Pollutants in Urban Soils. Sci. Total Environ. 2012, 430, 184–192. [Google Scholar] [CrossRef]
- Malczyk, P.; Kedzia, W.; Nowak, M. Metale ciężkie w glebach miasta Bydgoszczy. Rocz. Glebozn. 1996, 47, 195–202. [Google Scholar]
- Grodzińska, K.; Szarek-Łukaszewska, G. Polish mountain forests: Past, present and future. Environ. Pollut. 1997, 98, 369–374. [Google Scholar] [CrossRef]
- Donisa, C.; Mocanu, R.; Steinnes, E.; Vasu, A. Heavy metal pollution by atmospheric transport in natural soils from the northern part of eastern Carpathians. Water Air Soil Pollut. 2000, 120, 347–358. [Google Scholar] [CrossRef]
- Baran, S.; Bielińska, E.J.; Kawiecka-Radomska, M. Content of heavy metals in urban park soils influenced by various anthropogenic changes. Inżynieria Sr. 2010, 137, 131–137. [Google Scholar]
- Markiewicz-Patkowska, J.; Hursthouse, A.; Przybyla-Kij, H. The interaction of heavy metals with urban soils: Sorption behaviour of Cd, Cu, Cr, Pb and Zn with a typical mixed brownfield deposit. Environ. Int. 2005, 31, 513–521. [Google Scholar] [CrossRef] [PubMed]
- Birch, G.F.; Vanderhayden, M.; Olmos, M. The nature and distribution of metals in soils of the Sydney estuary catchment. Australia. Water Air Soil Pollut. 2011, 216, 581–604. [Google Scholar] [CrossRef]
- Sayadi, M.H.; Shabani, M.; Ahmadpour, N. Pollution index and ecological risk of heavy metals in the surface soils of Amir-Abad Area in Birjand City, Iran. Health Scope 2015, 4, e21137. [Google Scholar] [CrossRef]

| Names of Park | Park Area [ha] | Year of Creation | Geographical Coordinates | Ecological Function | Soil Types | Number of Samples | History |
|---|---|---|---|---|---|---|---|
| Park Sielecki (PS) | 10.4 | 1835 | 50°17′6″ N 19°8′28″ E | Ecological, sport and recreation, economic, culture and entertainment | Fluvic Cambisol, Hortic Anthrosol | 24 | Established as a private palace park, open to the public since 1945. |
| Park Dietla (PD) | 6.13 | 1890 | 50°17′8″ N 19°8′10″ E | Ecological, sport and recreation | Hortic Anthrosol, Technic Anthrosol | 21 | Established as a palace walk park in a former deciduous forest, the sports infrastructure was built in the 1970s. |
| Park Schöena (PSch) | 5.5 | 1885 | 50°17′59″ N 19°8′35″ E | Palace and park complex, culture and entertainment | Fluvic Cambisol, Hortic Anthrosol | 21 | Neo-Romanesque palace−garden park |
| Park Kruczkowski (PK) | 4.8 | 1935 | 50°16′53″ N 19°6′14″ E | Ecological and recreation, biodiversity park | Urbic Technosol | 21 | Established as a dendrological garden, now an ecological center with an Exotarium. |
| Park Leśna (PL) | 48 | 1958 | 50°18′5″ N 19°14′26″ E | Ecological, sport and recreation, culture and entertainment | Technic Anthrosol, Fluvic Cambisol | 33 | Created on the site of a former sand quarry and later reclaimed as a forest park. |
| Urban Parks Names | Sampling Points | pH | Hh | H+ | Al3+ | Loss on Ignation | Corg | Nt | C/N | Pt | |
|---|---|---|---|---|---|---|---|---|---|---|---|
| H2O | KCl | [cmol (+) kg−1] | [%] | [mg kg−1] | |||||||
| Park Sielecki (PS) | S-1 | 6.8 | 6.3 | 2.76 | 0.72 | 0.16 | 3.35 | 1.85 | 0.181 | 10 | 272.4 |
| S-2 | 7.4 | 7.2 | 3.6 | 1.02 | 0.1 | 7.61 | 3.11 | 0.312 | 10 | 551 | |
| S-3 | 6.2 | 5.7 | 3.12 | 0.58 | 0.8 | 10.69 | 4.82 | 0.184 | 26 | 946 | |
| S-4 | 5.7 | 5.1 | 6.16 | 0.54 | 0.07 | 11.99 | 5.56 | 0.481 | 12 | 1840 | |
| S-5 | 6.6 | 6.1 | 3.48 | 1.96 | 2.04 | 7.21 | 3.75 | 0.125 | 30 | 250.8 | |
| S-6 | 7.3 | 6.6 | 2.72 | 0.54 | 0.42 | 3.12 | 2.29 | 0.322 | 7 | 978 | |
| S-7 | 7.1 | 6.4 | 2.52 | 0.94 | 0.48 | 11.79 | 6.49 | 0.091 | 71 | 105.2 | |
| S-8 | 6.9 | 6.3 | 1.84 | 0.69 | 0.04 | 8.81 | 4.53 | 0.223 | 20 | 535 | |
| Park Schöena (PSch) | PSch-1 | 6.7 | 6.1 | 0.6 | 0.4 | 0.4 | 31.08 | 14.3 | 0.131 | 109 | 320.1 |
| PSch-2 | 6.5 | 6.1 | 19.6 | 4.1 | 5.6 | 13.03 | 5.82 | 0.172 | 34 | 281.6 | |
| PSch-3 | 6.8 | 6.7 | 7.5 | 3.6 | 4.7 | 5.23 | 3.29 | 0.132 | 25 | 197.6 | |
| PSch-4 | 7.2 | 6.6 | 1.7 | 0.61 | 0.4 | 7.67 | 2.52 | 0.081 | 31 | 114.8 | |
| PSch-5 | 5.8 | 5.3 | 5.4 | 1.7 | 0.9 | 9.56 | 3.48 | 0.211 | 16 | 514.1 | |
| PSch-6 | 6.6 | 6.1 | 7.8 | 0.31 | 0.1 | 18.29 | 6.45 | 0.301 | 21 | 390.1 | |
| PSch-7 | 7.1 | 6.6 | 2.2 | 0.72 | 0.2 | 15.63 | 6.54 | 0.124 | 53 | 356 | |
| Park Kruczkowski (PK) | PK-1 | 7.1 | 6.4 | 9 | 6.4 | 12.24 | 7.39 | 4.22 | 0.142 | 30 | 96.8 |
| PK-2 | 6.9 | 6.2 | 4 | 2.12 | 1.72 | 7.18 | 5.17 | 0.11 | 47 | 107.2 | |
| PK-3 | 6.4 | 5.8 | 1.68 | 0.61 | 0.16 | 13.21 | 8.47 | 0.184 | 46 | 360 | |
| PK-4 | 6.4 | 5.9 | 1.16 | 0.28 | 0.04 | 10.65 | 5.07 | 0.071 | 71 | 209.6 | |
| PK-5 | 5.8 | 5.1 | 3.04 | 0.68 | 0.09 | 5.79 | 5.52 | 0.131 | 42 | 538 | |
| PK-6 | 7.1 | 6.6 | 1.04 | 0.14 | 0.11 | 9.18 | 4.66 | 0.042 | 111 | 260.8 | |
| PK-7 | 6.5 | 5.4 | 8.04 | 0.84 | 0.41 | 3.83 | 1.19 | 0.281 | 4 | 1252 | |
| Park Dietla (PD) | PD-1 | 6.3 | 5.5 | 2.72 | 0.32 | 0.02 | 21.72 | 11.12 | 0.271 | 41 | 575 |
| PD-2 | 6.6 | 6.1 | 7.48 | 4.6 | 2.96 | 9.42 | 5.29 | 0.142 | 37 | 157 | |
| PD-3 | 7.3 | 6.9 | 2.6 | 1.18 | 0.86 | 3.54 | 1.77 | 0.031 | 57 | 165.2 | |
| PD-4 | 5.9 | 5.3 | 3.88 | 1.66 | 0.98 | 4.62 | 4.11 | 0.012 | 343 | 218.8 | |
| PD-5 | 6.3 | 5.5 | 5.08 | 1.64 | 2.1 | 2.7 | 0.99 | 0.132 | 8 | 232.2 | |
| PD-6 | 7.0 | 6.4 | 1.12 | 0.06 | 0.02 | 9.27 | 5.79 | 0.101 | 57 | 529 | |
| PD-7 | 5.8 | 5.3 | 8.24 | 2.92 | 3.08 | 7.31 | 3.76 | 0.21 | 18 | 347 | |
| Park Leśna (PL) | PL-1 | 5.5 | 5.0 | 2 | 0.55 | 0.58 | 4.61 | 4.33 | 0.161 | 27 | 294.4 |
| PL-2 | 5.3 | 4.7 | 1.64 | 0.53 | 0.09 | 9.13 | 5.9 | 0.132 | 45 | 353 | |
| PL-3 | 5.6 | 5.0 | 2.64 | 0.78 | 0.6 | 5.73 | 3.87 | 0.271 | 14 | 800 | |
| PL-4 | 7.2 | 6.7 | 2.28 | 0.51 | 0.07 | 8.68 | 4.98 | 0.182 | 27 | 882 | |
| PL-5 | 5.4 | 5.1 | 3.48 | 1.31 | 1.03 | 12.94 | 8.66 | 0.091 | 95 | 162.4 | |
| PL-6 | 5.3 | 4.8 | 4.44 | 1.6 | 1.24 | 8.45 | 2.59 | 0.152 | 17 | 404 | |
| PL-7 | 4.7 | 4.2 | 1.08 | 0.32 | 0.26 | 8.01 | 4.17 | 0.084 | 50 | 233.6 | |
| PL-8 | 5.9 | 5.3 | 5.8 | 2.56 | 2.44 | 4.61 | 1.55 | 0.021 | 74 | 178.8 | |
| PL-9 | 6.4 | 5.8 | 5.28 | 3.28 | 0.6 | 6.08 | 3.51 | 0.121 | 29 | 209.6 | |
| PL-10 | 5.1 | 4.7 | 3.32 | 0.6 | 0.17 | 7.75 | 4.59 | 0.261 | 18 | 432 | |
| PL-11 | 6.9 | 6.4 | 4.56 | 1.08 | 0.64 | 7.74 | 3.61 | 0.201 | 18 | 878 | |
| Urban Parks | Sampling Points | Limit Values [61] | |||||||||
|---|---|---|---|---|---|---|---|---|---|---|---|
| 200 | 2 | 200 | 150 | 200 | 500 | 50 | 25 | 400 | 10–30 [43] | ||
| Pb | Cd | Cr | Ni | Cu | Zn | Co | As | Ba | Sr | ||
| mg kg−1 | |||||||||||
| Park Sielecki (PS) | S-1 | 410.7 | 2.0 | 31 | 14.1 | 15.0 | 997 | 5.4 | 14 | 377 | 55 |
| S-2 | 669.1 | 7.2 | 71 | 46.9 | 97.1 | 2338 | 17.0 | 33 | 606 | 147 | |
| S-3 | 624.5 | 19.3 | 57 | 32.3 | 81.3 | 2237 | 12.4 | 34 | 797 | 105 | |
| S-4 | 399.5 | 19.1 | 40 | 18.7 | 45.3 | 981 | 7.1 | 20 | 378 | 70 | |
| S-5 | 338.1 | 10.6 | 40 | 19.6 | 80.8 | 1315 | 7.2 | 24 | 367 | 73 | |
| S-6 | 910.8 | 9.3 | 39 | 19.4 | 49.4 | 3526 | 6.7 | 32 | 362 | 75 | |
| S-7 | 717.8 | 27.7 | 50 | 30.1 | 63.9 | 2727 | 11.4 | 52 | 541 | 96 | |
| S-8 | 255.8 | 17.3 | 54 | 26.4 | 38.9 | 1077 | 11.3 | 18 | 486 | 67 | |
| Mean values | 540.8 | 14.1 | 48 | 25.9 | 59.0 | 1900 | 9.8 | 28 | 489 | 86 | |
| Park Schöena (PSh) | PSch-1 | 387.7 | 14.1 | 78 | 96.7 | 186.5 | 2048 | 36.7 | 32 | 1137 | 391 |
| PSch-2 | 213.3 | 4.7 | 88 | 47.3 | 63.2 | 863 | 16.6 | 15 | 550 | 106 | |
| PSch-3 | 285.4 | 10.8 | 43 | 22.0 | 53.1 | 1056 | 7.6 | 19 | 352 | 68 | |
| PSch-4 | 538.2 | 12.6 | 72 | 45.6 | 117.7 | 1781 | 16.7 | 34 | 635 | 111 | |
| PSch-5 | 865.0 | 21.0 | 71 | 42.4 | 82.0 | 1880 | 16.4 | 41 | 660 | 104 | |
| PSch-6 | 585.1 | 17.2 | 59 | 43.1 | 107.1 | 2112 | 16.2 | 38 | 572 | 117 | |
| PSch-7 | 565.1 | 16.2 | 66 | 39.8 | 112.8 | 2118 | 14.9 | 27 | 580 | 136 | |
| Mean values | 491.4 | 13.8 | 68 | 48.1 | 103.2 | 1694 | 17.9 | 29 | 641 | 148 | |
| Park Kruczkowski (PK) | PK-1 | 426.4 | 15.0 | 51 | 35.4 | 65.6 | 1757 | 13.9 | 25 | 492 | 99 |
| PK-2 | 2040.3 | 37.3 | 69 | 44.1 | 105.2 | 3103 | 14.6 | 68 | 643 | 129 | |
| PK-3 | 2019.1 | 24.4 | 70 | 32.5 | 89.0 | 1827 | 11.3 | 40 | 513 | 109 | |
| PK-4 | 1913.4 | 29.0 | 59 | 33.1 | 79.2 | 2625 | 10.9 | 50 | 484 | 99 | |
| PK-5 | 894.5 | 18.8 | 41 | 22.7 | 51.9 | 1429 | 8.2 | 37 | 446 | 76 | |
| PK-6 | 343.7 | 9.3 | 54 | 23.5 | 71.5 | 997 | 7.7 | 11 | 329 | 77 | |
| PK-7 | 156.8 | 3.8 | 47 | 20.2 | 28.9 | 418 | 5.6 | 10 | 238 | 44 | |
| Mean values | 1113.5 | 19.7 | 56 | 30.2 | 70.2 | 1737 | 10.3 | 34 | 449 | 90 | |
| Park Dietla (PD) | PD-1 | 1102.4 | 25.6 | 88 | 75.2 | 209.0 | 2759 | 28.3 | 37 | 878 | 210 |
| PD-2 | 796.1 | 22.4 | 72 | 40.0 | 113.0 | 2153 | 12.2 | 25 | 610 | 120 | |
| PD-3 | 280.3 | 9.4 | 37 | 19.5 | 48.2 | 1161 | 6.9 | 22 | 386 | 77 | |
| PD-4 | 352.2 | 10.1 | 41 | 25.2 | 46.4 | 1243 | 8.7 | 29 | 439 | 71 | |
| PD-5 | 323.5 | 11.1 | 38 | 18.3 | 37.3 | 1044 | 5.9 | 21 | 382 | 64 | |
| PD-6 | 905.4 | 29.7 | 85 | 53.9 | 126.8 | 3351 | 20.0 | 58 | 670 | 139 | |
| PD-7 | 493.3 | 13.4 | 49 | 27.9 | 50.7 | 1276 | 9.8 | 19 | 477 | 91 | |
| Mean values | 607.6 | 17.4 | 59 | 37.1 | 90.2 | 1855 | 13.1 | 30 | 549 | 110 | |
| Park Leśna (PL) | PL-1 | 150.3 | 3.0 | 27 | 131.1 | 17.4 | 249 | 4.5 | 7 | 248 | 47 |
| PL-2 | 510.5 | 14.5 | 46 | 22.3 | 41.0 | 1035 | 8.0 | 23 | 414 | 75 | |
| PL-3 | 255.1 | 8.2 | 50 | 18.8 | 37.4 | 616 | 6.9 | 16 | 311 | 58 | |
| PL-4 | 128.8 | 2.8 | 61 | 30.1 | 34.7 | 507 | 10.0 | 8 | 390 | 87 | |
| PL-5 | 659.3 | 18.4 | 53 | 26.4 | 53.1 | 1287 | 9.0 | 24 | 450 | 84 | |
| PL-6 | 264.2 | 6.2 | 37 | 13.8 | 27.9 | 494 | 4.8 | 13 | 375 | 60 | |
| PL-7 | 228.7 | 5.5 | 40 | 14.8 | 21.8 | 352 | 4.7 | 14 | 390 | 62 | |
| PL-8 | 449.2 | 11.7 | 32 | 16.1 | 31.9 | 877 | 7.0 | 16 | 345 | 66 | |
| PL-9 | 245.0 | 8.5 | 67 | 23.8 | 38.9 | 900 | 9.6 | 20 | 486 | 83 | |
| PL-10 | 541.8 | 13.7 | 46 | 22.5 | 42.7 | 994 | 9.5 | 25 | 483 | 87 | |
| PL-11 | 208.0 | 10.4 | 30 | 16.3 | 30.5 | 680 | 6.6 | 13 | 351 | 75 | |
| Mean values | 331.0 | 9.4 | 44 | 30.6 | 34.3 | 726 | 7.3 | 16 | 386 | 71 | |
| Park Sielecki (PS) | Pb | Cd | Cr | Ni | Cu | Zn | Co | As | Ba | Sr |
|---|---|---|---|---|---|---|---|---|---|---|
| Pb | 1.000 | |||||||||
| Cd | 0.000 | 1.000 | ||||||||
| Cr | −0.012 | 0.359 | 1.000 | |||||||
| Ni | 0.238 | 0.333 | 0.934 *** | 1.000 | ||||||
| Cu | 0.357 | 0.190 | 0.683 * | 0.810 ** | 1.000 | |||||
| Zn | 0.810 ** | 0.095 | 0.228 | 0.524 | 0.548 | 1.000 | ||||
| Co | 0.119 | 0.405 | 0.970 *** | 0.976 *** | 0.786 * | 0.357 | 1.000 | |||
| As | 0.667 * | 0.548 | 0.539 | 0.738 * | 0.786 * | 0.762 * | 0.690 * | 1.000 | ||
| Ba | 0.071 | 0.452 | 0.862 ** | 0.786 * | 0.500 | 0.071 | 0.857 ** | 0.524 | 1.000 | |
| Sr | 0.619 | 0.262 | 0.683 | 0.833 ** | 0.929 *** | 0.714 | 0.786 | 0.905 ** | 0.571 | 1.000 |
| Park Schöena (PSch) | ||||||||||
| Pb | 1.000 | |||||||||
| Cd | 0.619 | 1.000 | ||||||||
| Cr | −0.095 | −0.333 | 1.000 | |||||||
| Ni | −0.024 | −0.286 | 0.905 ** | 1.000 | ||||||
| Cu | 0.452 | −0.071 | 0.548 | 0.667 * | 1.000 | |||||
| Zn | 0.762 * | 0.524 | −0.048 | 0.095 | 0.643 * | 1.000 | ||||
| Co | 0.095 | −0.190 | 0.905 ** | 0.952 *** | 0.738 * | 0.119 | 1.000 | |||
| As | 0.929 *** | 0.548 | 0.024 | 0.167 | 0.524 | 0.619 | 0.310 | 1.000 | ||
| Ba | 0.571 | 0.286 | 0.619 | 0.643 * | 0.833 ** | 0.571 | 0.786 * | 0.667 * | 1.000 | |
| Sr | 0.357 | −0.119 | 0.500 | 0.643 * | 0.905 ** | 0.714 * | 0.595 | 0.333 | 0.667 | 1.000 |
| Park Kruczkowski (PK) | ||||||||||
| Pb | 1.000 | |||||||||
| Cd | 0.964 | 1.000 | ||||||||
| Cr | 0.714 * | 0.643 | 1.000 | |||||||
| Ni | 0.679 * | 0.714 * | 0.607 | 1.000 | ||||||
| Cu | 0.857 ** | 0.821 * | 0.929 ** | 0.750 * | 1.000 | |||||
| Zn | 0.929 ** | 0.964 *** | 0.714 * | 0.857 ** | 0.857 ** | 1.000 | ||||
| Co | 0.786 * | 0.750 * | 0.571 | 0.929 ** | 0.714 * | 0.857 ** | 1.000 | |||
| As | 0.964 *** | 1.000 | 0.643 | 0.714 * | 0.821 * | 0.964 *** | 0.750 * | 1.000 | ||
| Ba | 0.893 ** | 0.821 * | 0.714 * | 0.857 ** | 0.821 * | 0.893 ** | 0.964 *** | 0.821 * | 1.000 | |
| Sr | 0.865 ** | 0.811 * | 0.865 ** | 0.883 ** | 0.937 *** | 0.901 ** | 0.901 ** | 0.811 * | 0.955 *** | 1.000 |
| Park Dietla (PD) | ||||||||||
| Pb | 1.000 | |||||||||
| Cd | 0.929 ** | 1.000 | ||||||||
| Cr | 1.000 | 0.929 ** | 1.000 | |||||||
| Ni | 0.964 *** | 0.857 ** | 0.964 *** | 1.000 | ||||||
| Cu | 0.893 ** | 0.821 * | 0.893 ** | 0.964 *** | 1.000 | |||||
| Zn | 0.929 ** | 0.893 ** | 0.929 ** | 0.964 *** | 0.929 ** | 1.000 | ||||
| Co | 0.964 *** | 0.857 ** | 0.964 *** | 1.000 | 0.964 *** | 0.964 *** | 1.000 | |||
| As | 0.643 | 0.571 | 0.643 | 0.679 * | 0.607 | 0.714 * | 0.679 * | 1.000 | ||
| Ba | 0.964 *** | 0.857 ** | 0.964 *** | 1.000 | 0.964 *** | 0.964 *** | 1.000 | 0.679 * | 1.000 | |
| Sr | 0.893 ** | 0.821 * | 0.893 ** | 0.964 *** | 1.000 | 0.929 ** | 0.964 *** | 0.607 | 0.964 *** | 1.000 |
| Park Leśna (Pl) | ||||||||||
| Pb | 1.000 | |||||||||
| Cd | 0.864 *** | 1.000 | ||||||||
| Cr | 0.178 | 0.123 | 1.000 | |||||||
| Ni | −0.182 | −0.064 | 0.360 | 1.000 | ||||||
| Cu | 0.700 ** | 0.745 ** | 0.697 ** | 0.318 | 1.000 | |||||
| Zn | 0.764 ** | 0.918 *** | 0.460 | 0.164 | 0.918 *** | 1.000 | ||||
| Co | 0.245 | 0.318 | 0.811 ** | 0.436 | 0.782 ** | 0.655 * | 1.000 | |||
| As | 0.868 *** | 0.849 *** | 0.462 | −0.005 | 0.863 *** | 0.872 *** | 0.502 | 1.000 | ||
| Ba | 0.433 | 0.446 | 0.680 * | 0.182 | 0.692 ** | 0.647 ** | 0.697 ** | 0.682 * | 1.000 | |
| Sr | 0.251 | 0.388 | 0.600 * | 0.361 | 0.699 ** | 0.644 ** | 0.872 *** | 0.484 | 0.780 ** | 1.000 |
| Sites | Ba | Sr | Cr | Zn | Ni | Cu | Co | Pb | As | Cd | |
|---|---|---|---|---|---|---|---|---|---|---|---|
| PS | Mean | 2.46 | 2.67 | 1.99 | 2.78 | 1.52 | 2.12 | 1.70 | 2.32 | 1.65 | 2.22 |
| Range | 2.03–3.17 | 2.02–3.44 | 1.36–2.56 | 1.82–3.67 | 0.64–2.38 | 0.15–2.84 | 0.84–2.5 | 1.24–3.07 | 0.64–2.53 | −0.58–3.2 | |
| PSch | Mean | 2.85 | 3.45 | 2.50 | 2.61 | 2.41 | 2.93 | 2.57 | 2.18 | 1.70 | 2.20 |
| Range | 1.99–3.68 | 2.33–30.3 | 1.84–2.87 | 1.64–2.93 | 1.28–3.42 | 1.97–3.78 | 1.34–3.61 | 0.98–3 | 0.73–2.18 | −0.64–2.51 | |
| PK | Mean | 2.34 | 2.74 | 2.21 | 2.65 | 1.74 | 2.37 | 1.78 | 3.36 | 1.93 | 2.71 |
| Range | 1.42–2.86 | 1.7–3.25 | 1.77–2.54 | 0.59–3.49 | 1.16–2.29 | 1.09–2.96 | 0.91–2.28 | 0.53–4.23 | 0.15–2.91 | 0.34–3.63 | |
| PD | Mean | 2.63 | 3.03 | 2.87 | 2.74 | 2.04 | 2.74 | 2.12 | 2.49 | 1.74 | 2.53 |
| Range | 2.1–3.31 | 2.24–3.59 | 1.62–2.87 | 1.91–3.6 | 1.02–3.06 | 1.46–3.95 | 0.97–3.27 | 1.37–3.35 | 1.07–2.68 | 1.64–3.3 | |
| PL | Mean | 2.12 | 2.40 | 1.88 | 1.39 | 1.76 | 1.34 | 1.28 | 1.61 | 0.85 | 1.64 |
| Range | 1.48–2.45 | 1.79–2.68 | 1.32–2.48 | −0.14–2.22 | 0.61–3.86 | 0.36–1.97 | 0.58–1.73 | 0.25–2.6 | −0.36–1.47 | −0.09–2.73 |
| Sites | Ba | Sr | Cr | Zn | Ni | Cu | Co | Pb | As | Cd | |
|---|---|---|---|---|---|---|---|---|---|---|---|
| PS | Mean | 37.12 | 42.77 | 26.72 | 46.22 | 19.34 | 29.32 | 21.95 | 33.62 | 4.72 | 31.47 |
| Range | 27.46–60.47 | 27.35–73.12 | 17.34–39.73 | 23.86–85.78 | 10.52–34.99 | 7.46–48.29 | 12.08–38.05 | 15.9–56.63 | 10.52–38.79 | 1.26–62 | |
| PSch | Mean | 48.62 | 73.4 | 38.13 | 41.21 | 35.9 | 51.33 | 40 | 30.55 | 29.95 | 30.89 |
| Range | 26.7–86.27 | 33.82–194.49 | 24.06–49.24 | 20.99–51.53 | 16.41–72.15 | 26.41–92.76 | 17.01–82.14 | 13.26–53.78 | 11.19–30.59 | 10.52–47 | |
| PK | Mean | 34.9 | 44.97 | 31.25 | 42.25 | 22.54 | 34.9 | 23.07 | 69.23 | 25.68 | 43.98 |
| Range | 18.05–48.78 | 21.88–64.16 | 22.94–39.17 | 10.17–75.49 | 15.07–32.9 | 14.37–52.32 | 12.53–32.68 | 9.74–126.86 | 7.46–50.73 | 8.5–83.49 | |
| PD | Mean | 41.64 | 54.85 | 32.77 | 45.13 | 27.71 | 44.86 | 29.34 | 37.77 | 22.48 | 38.9 |
| Range | 28.98–66.62 | 31.83–104.45 | 20.7–49.24 | 25.4–81.53 | 13.65–56.1 | 18.55–103.96 | 13.2–63.34 | 17.42–68.54 | 14.17–43.27 | 21.04–66.48 | |
| PL | Mean | 29.26 | 35.45 | 24.87 | 17.67 | 22.78 | 17.06 | 16.38 | 20.58 | 12.13 | 20.92 |
| Range | 18.81–36.84 | 23.37–43.27 | 15.1–37.49 | 6.05–31.31 | 10.29–97.81 | 8.65–26.41 | 10.07–22.38 | 8–40.99 | 5.22–18.65 | 6.26–41.18 |
| Sites | Ba | Sr | Cr | Zn | Ni | Cu | Co | Pb | As | Cd | PLI | |
|---|---|---|---|---|---|---|---|---|---|---|---|---|
| PS | Mean | 8.29 | 9.55 | 5.96 | 10.32 | 4.32 | 6.55 | 4.9 | 7.51 | 4.72 | 7.03 | 8.45 |
| PSch | Mean | 10.86 | 16.39 | 8.51 | 9.2 | 8.02 | 11.46 | 8.93 | 6.82 | 4.9 | 6.9 | 11.09 |
| PK | Mean | 7.61 | 10.04 | 6.98 | 9.43 | 5.03 | 7.79 | 5.15 | 15.46 | 5.73 | 9.82 | 10.23 |
| PD | Mean | 9.03 | 12.25 | 7.32 | 10.8 | 6.19 | 10.02 | 6.55 | 8.43 | 5.02 | 8.69 | 10 |
| PL | Mean | 6.53 | 7.91 | 5.55 | 3.94 | 5.09 | 3.81 | 3.66 | 4.59 | 2.71 | 4.67 | 5.84 |
| Cr | Zn | Ni | Cu | Pb | As | Cd | RI ** | |
|---|---|---|---|---|---|---|---|---|
| * | 2 | 1 | 5 | 5 | 5 | 10 | 30 | |
| PS | 11.93 | 10.32 | 21.61 | 32.75 | 37.55 | 47.28 | 210.9 | 372.59 |
| PSch | 17.03 | 9.21 | 40.1 | 57.33 | 34.12 | 49.03 | 207 | 414.06 |
| PK | 13.96 | 9.43 | 25.17 | 38.98 | 77.32 | 57.36 | 294.75 | 517.23 |
| PD | 14.64 | 10.08 | 30.95 | 50.10 | 42.18 | 50.23 | 260.7 | 459.2 |
| PL | 11.11 | 3.94 | 25.45 | 19.05 | 22.98 | 27.11 | 140.25 | 250.14 |
| City, Parks | Pb | Zn | Cd | Cu | As | Co | Reference |
|---|---|---|---|---|---|---|---|
| Parks in Sosnowiec (5) | 617 | 1582 | 15 | 71 | 28 | 58 | Current study |
| Toruń urban area, Poland | 25.23 | 23.75 | 0.15 | 11.8 | n.a. | n.a. | [9] |
| Zielona Góra, Poland | 85.2 | 293 | 0.58 | 33 | n.a. | n.a. | [34] |
| Parks in Katowice, Poland | 270 | 590 | 4.4 | 30 | n.a. | 7.0 | |
| Parks in Zabrze, Poland | 67.5 | 250 | 1.98 | 13.5 | n.a. | 4.1 | [37] |
| Parks in Dąbrowa Gornicza, Poland | 270 | 660 | 9.2 | 21 | n.a. | 4.1 | [37] |
| Parks in Tarnowskie Góry, Poland | 930 | 1390 | 9.0 | 22.0 | n.a. | 6.0 | [37] |
| New York, City Parks (Central, Pelham Bay Park, Van Cortland Park | 40–730 | 19–300 (81) | 0.1–3 (0.4) | 14–138 (46) | 1–46 (13) | 3–13 (7) | [71] |
| Soundview Park, NYC | 160–1049 | 184–792 | - | 48–529 | - | - | [72] |
| City Park ins Hong Kong, China | 7.7–496 (70) | 23–930 (781) | 0.11–1.36 | 1.3–277 (10.4) | - | 0.6–10.9 | [70] |
| Phoenix Park, Dublin, Ireland | 39 | 94 | - | 25 | -- | [73] | |
| Parks in Ostrava (9), Czech Republic | 27–125 (49) | 78–922 (151) | 0.3–2.4 | 18–175 (38) | 8–18 | 7–10 | [64] |
| Prague urban parks (13), Czech Republic | 22–213 | 63–285 | 0.2–0.1 | 16–88 | 11–31 | 10–17 | [64] |
| Alexandra Park, Glasgow, United Kingdom | 114–414 (179) | 67–305 (104) | n.a. | 33–113 (59) | n.a. | n.a. | [22] |
| Glasgow Green Park, Glasgow (Great Britain) | 98–676 (279) | 102–377 (174) | n.a | 24–113 (88) | n.a. | n.a. | [22] |
| Tivoli Park, Ljubljana | 39–225 (72) | 84–300 (103) | n.a. | 21–78 (31) | n.a. | n.a. | [22] |
| Valention Park, Turin, Italy | 68–257 (137) | 116 (317) | n.a. | 44–123 (83) | n.a. | n.a. | [22] |
| Galitos Park, Aveiro, Portugal | 7–38 (20) | 18–82 (49) | n.a | 8–61 (16) | n.a | n.a | [22] |
| Los Principes Park, Seville (Spain) | 43–247 (100) | 73–191 (99) | n.a. | 30–72 (47) | n.a. | n.a. | [22] |
| Stadsträdgarden. Uppsala, Sweden | 7–116 (36) | 27–193 (106) | n.a. | 8–90 (31) | n.a. | n.a. | [22] |
| Moscow, Russia | 74.2 | 58.2 | 0.3 | 24.1 | n.a | n.a | [24] |
| Hannover, Germany | 172 | 186 | 1.2 | 52 | n.a | n.a | [23] |
| Debrecen, Hungary | 10.3 | 67.7 | <1 | 7.1 | n.a | n.a | [9] |
Disclaimer/Publisher’s Note: The statements, opinions and data contained in all publications are solely those of the individual author(s) and contributor(s) and not of MDPI and/or the editor(s). MDPI and/or the editor(s) disclaim responsibility for any injury to people or property resulting from any ideas, methods, instructions or products referred to in the content. |
© 2024 by the authors. Licensee MDPI, Basel, Switzerland. This article is an open access article distributed under the terms and conditions of the Creative Commons Attribution (CC BY) license (https://creativecommons.org/licenses/by/4.0/).
Share and Cite
Rahmonov, O.; Kowal, A.; Rahmonov, M.; Pytel, S. Variability of Concentrations of Potentially Toxic Metals in the Topsoil of Urban Forest Parks (Southern Poland). Forests 2024, 15, 1020. https://doi.org/10.3390/f15061020
Rahmonov O, Kowal A, Rahmonov M, Pytel S. Variability of Concentrations of Potentially Toxic Metals in the Topsoil of Urban Forest Parks (Southern Poland). Forests. 2024; 15(6):1020. https://doi.org/10.3390/f15061020
Chicago/Turabian StyleRahmonov, Oimahmad, Agnieszka Kowal, Małgorzata Rahmonov, and Sławomir Pytel. 2024. "Variability of Concentrations of Potentially Toxic Metals in the Topsoil of Urban Forest Parks (Southern Poland)" Forests 15, no. 6: 1020. https://doi.org/10.3390/f15061020