
Effects of the Co-Application of Glucose, Nitrogen, and Elevated Temperature on Buried Black Soil Carbon in a Cool Temperate Deciduous Broad-Leaved Forest


Abstract
1. Introduction
2. Materials and Methods
2.1. Soil Sample
2.2. Incubation Experiment
2.3. Calculation of PE and Q10 and Ea Values
2.4. Microbial Biomass Carbon
2.5. Statistical Analysis
3. Results
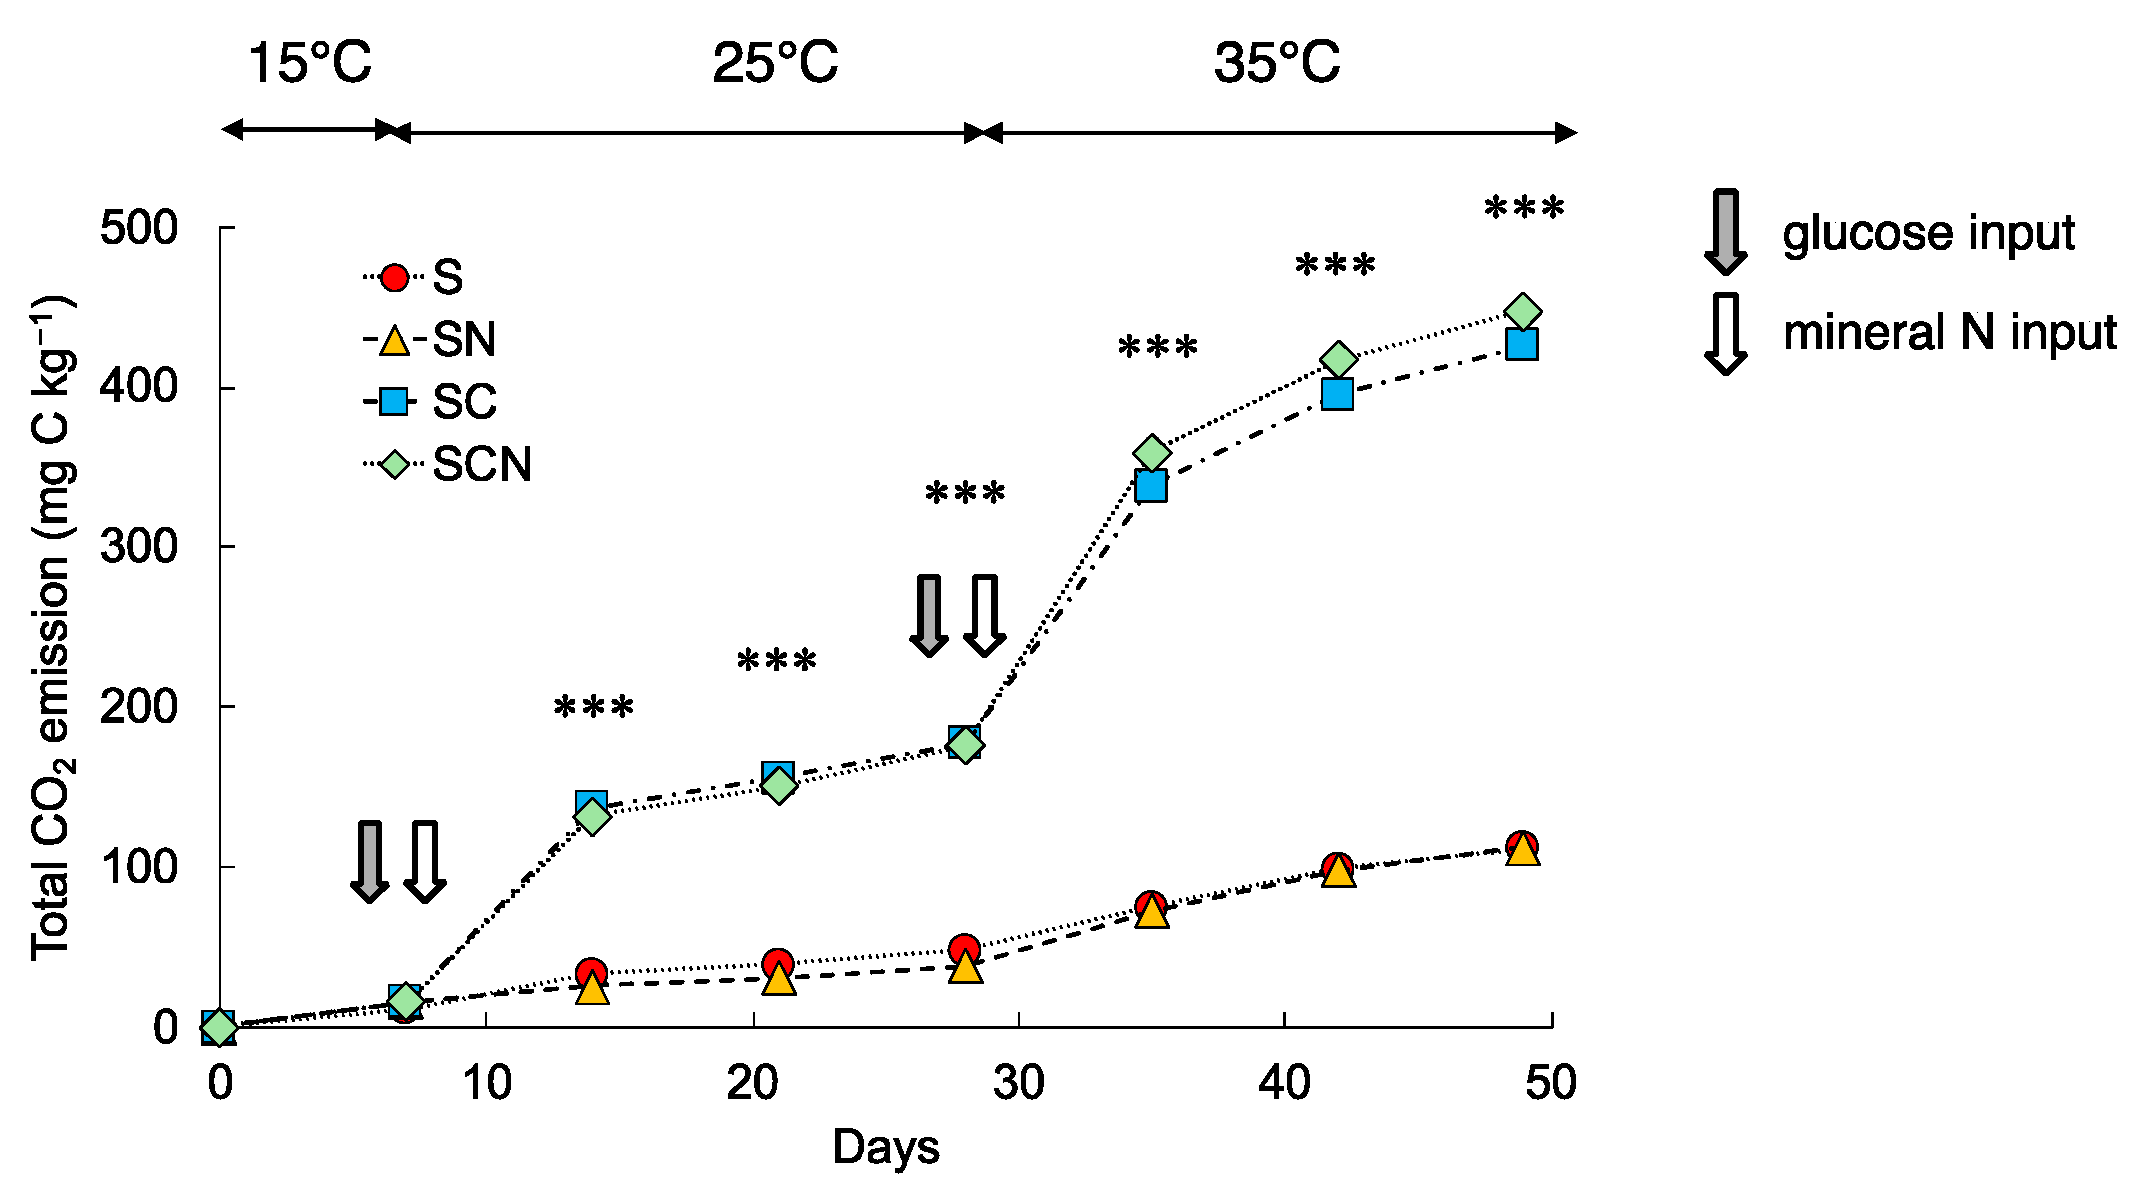
3.1. CO2 Emission
3.1.1. Total CO2
3.1.2. Glucose and Soil-Derived CO2
3.2. Priming Effect
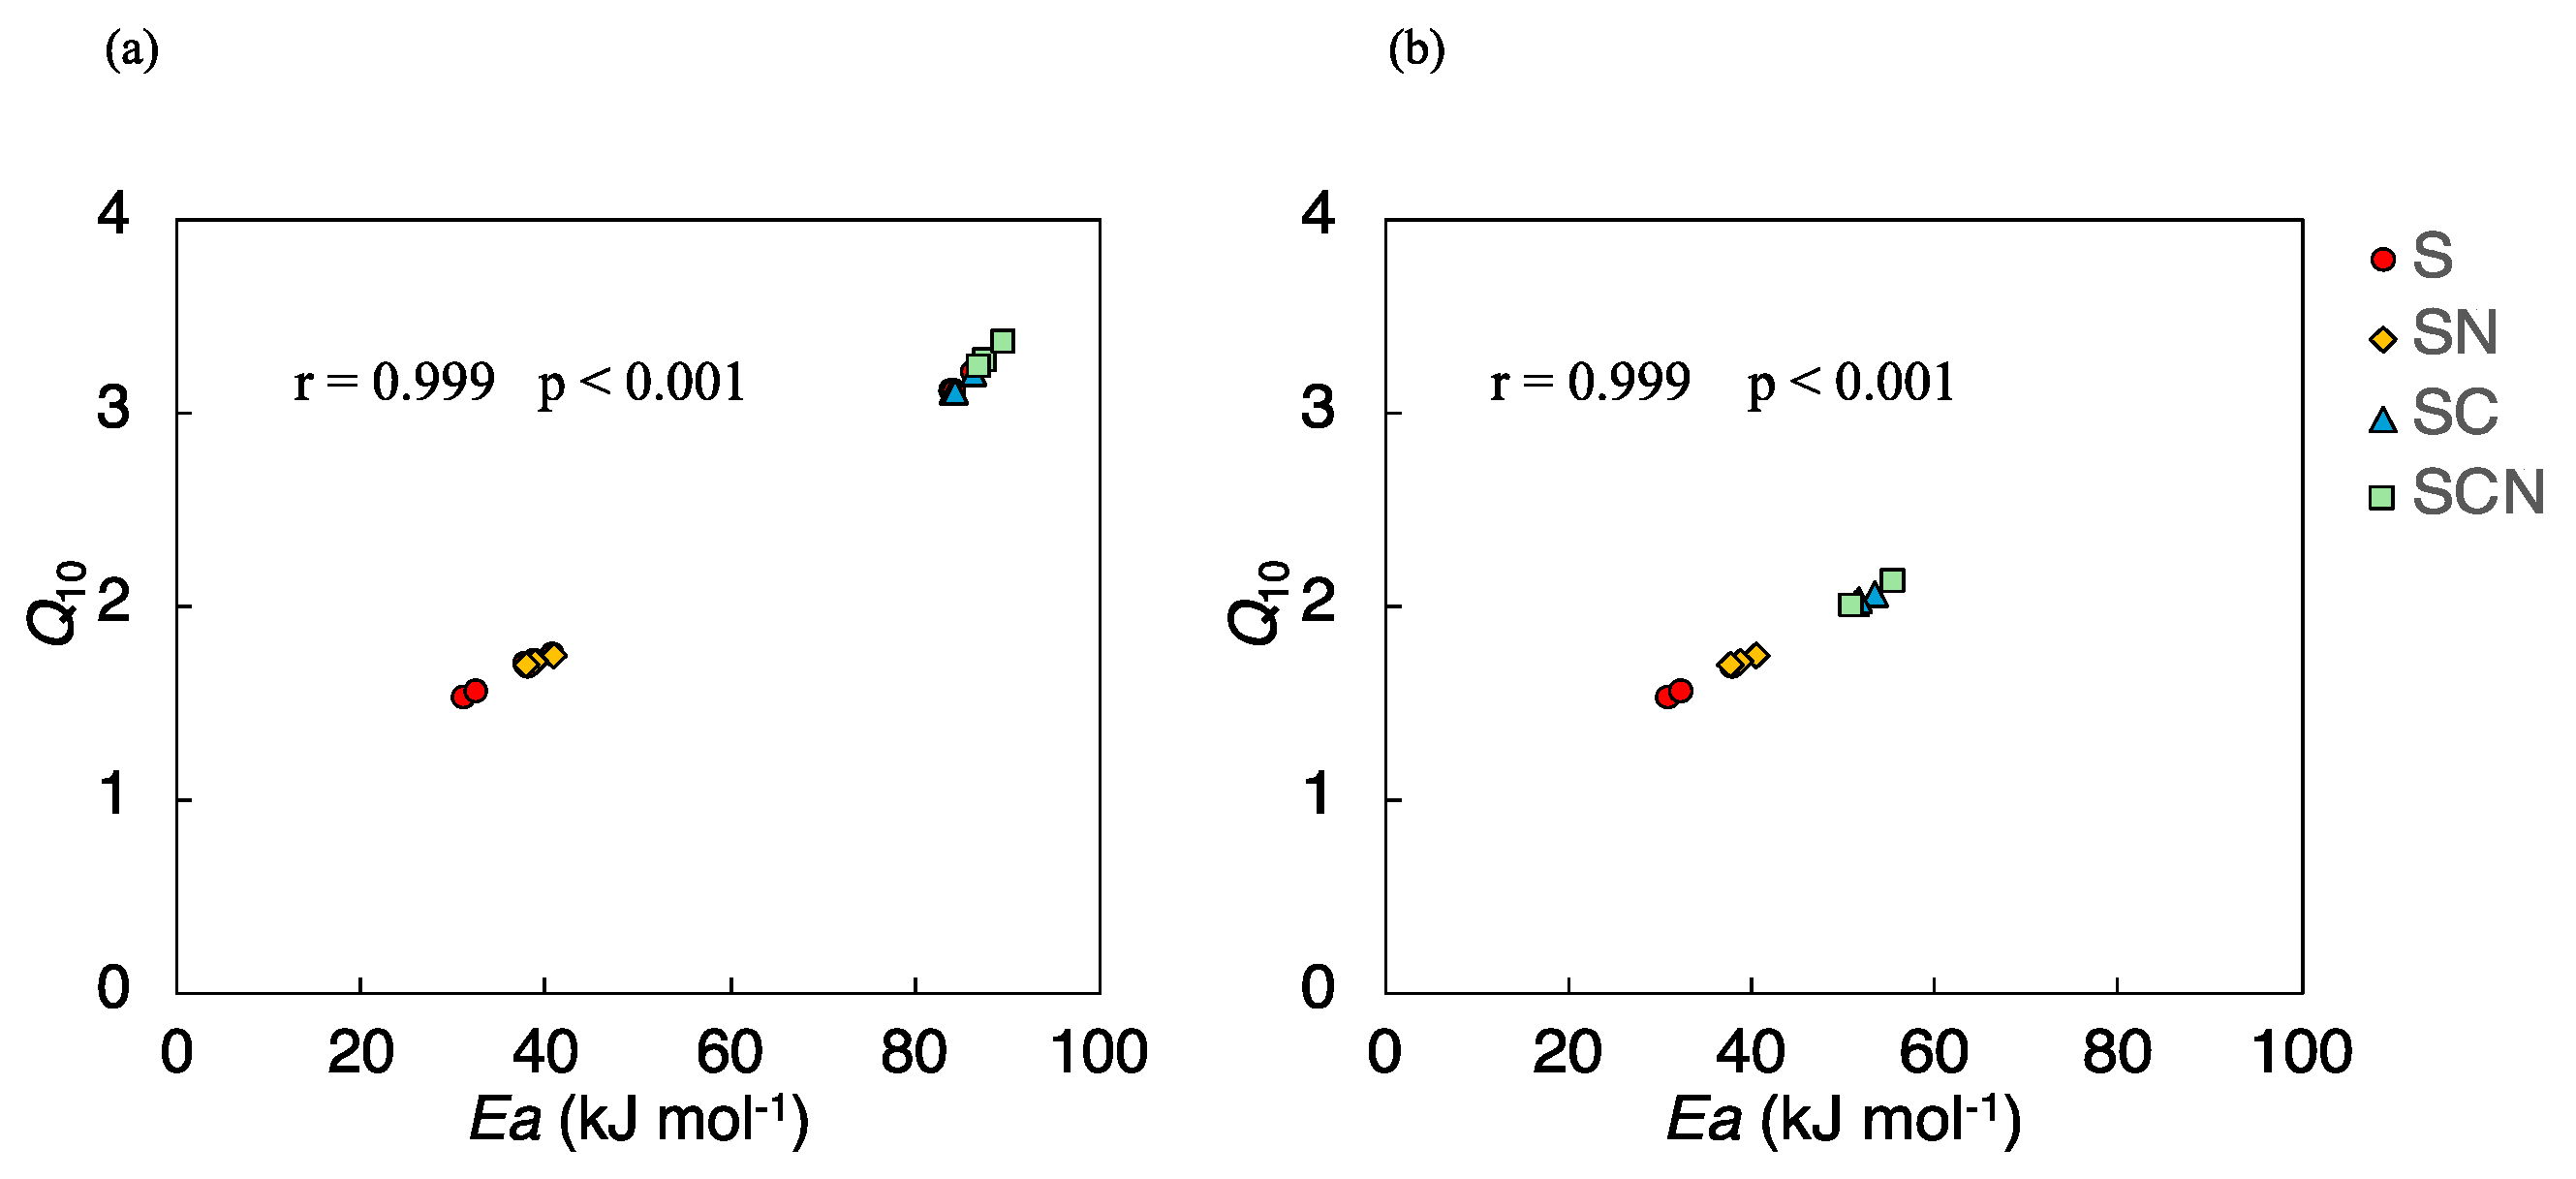
3.3. Temperature Sensitivity
3.3.1. Q10 Values
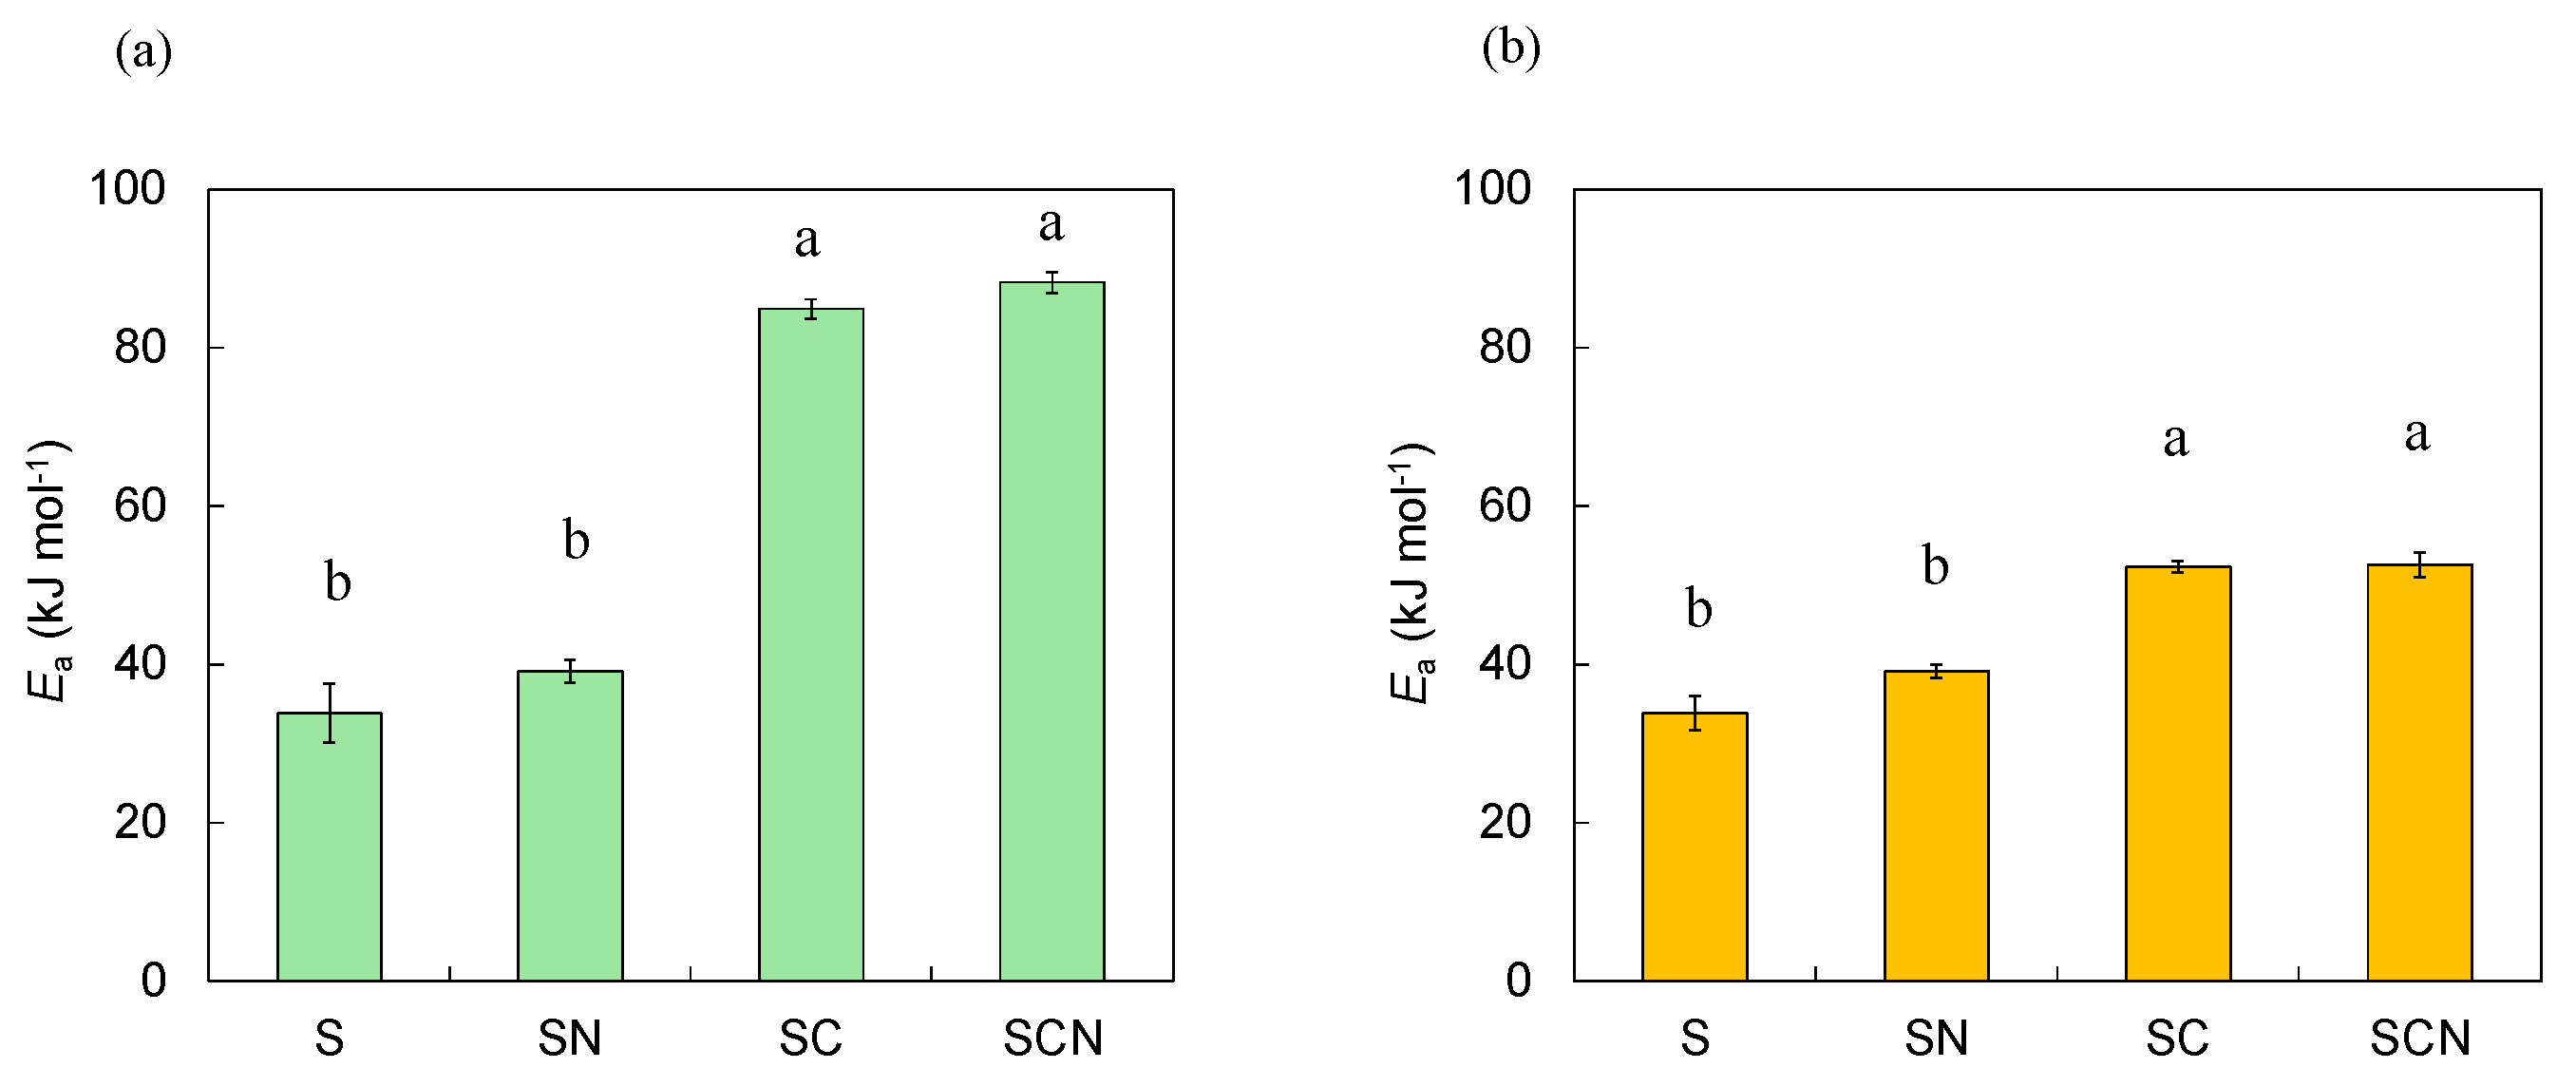
3.3.2. Activation Energy (Ea)
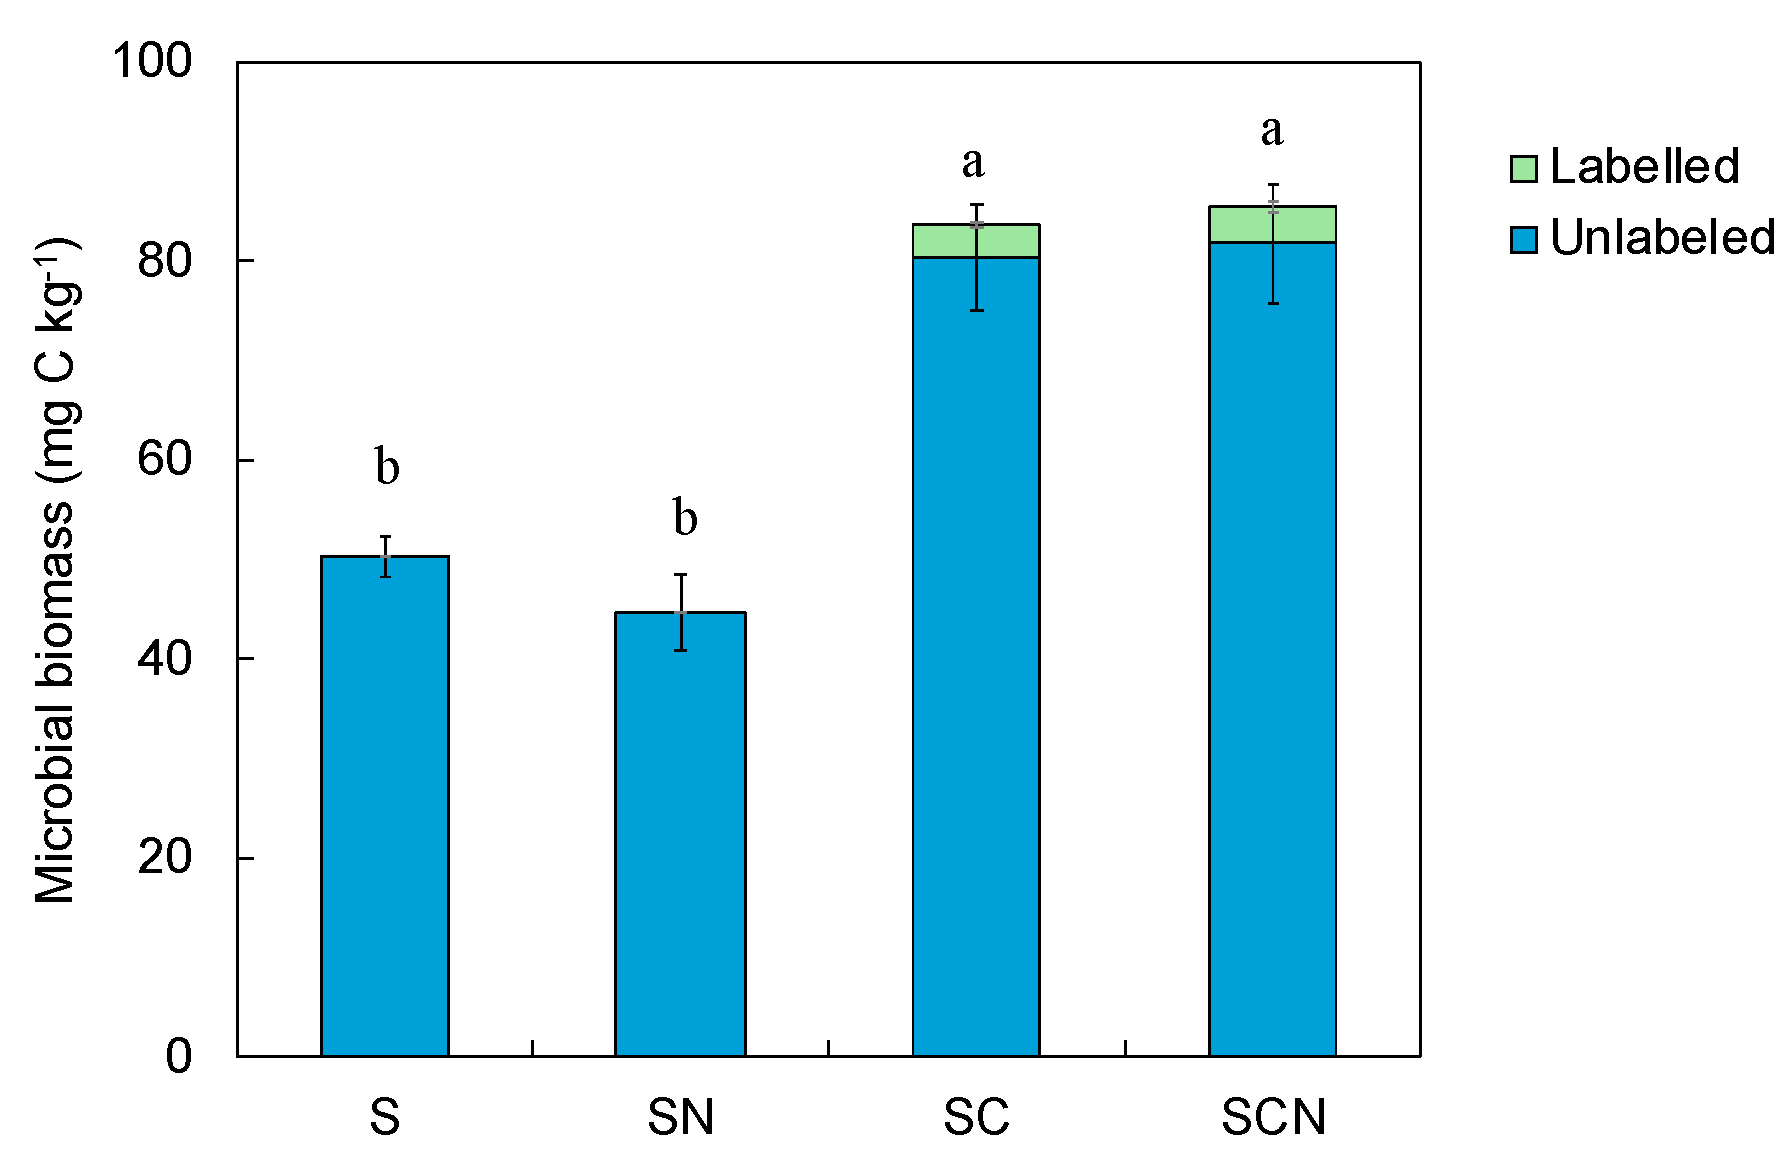
3.4. Microbial Biomass Carbon
4. Discussion
4.1. Glucose Dynamics
4.2. SOC Dynamics
4.3. Temperature Sensitivity
5. Conclusions
Author Contributions
Funding
Data Availability Statement
Acknowledgments
Conflicts of Interest
References
- Lal, R. Managing Soils and Ecosystems for Mitigating Anthropogenic Carbon Emissions and Advancing Global Food Security. BioScience 2010, 60, 708–721. [Google Scholar] [CrossRef]
- Davidson, E.A.; Janssens, I.A. Temperature Sensitivity of Soil Carbon Decomposition and Feedbacks to Climate Change. Nature 2006, 440, 165–173. [Google Scholar] [CrossRef]
- Amelung, W.; Bossio, D.; Vries, W.; Kögel-Knabner, I.; Lehman, J.; Amundson, R.; Bol, R.; Collins, C.; Lal, R.; Leifeld, J.; et al. Towards a Global-Scale Soil Climate Mitigation Strategy. Nat. Commun. 2020, 11, 5427. [Google Scholar] [CrossRef]
- Lal, R. Managing Soil Carbon Sequestration to Mitigate Climate Change. Geoderma 2004, 123, 1–22. [Google Scholar] [CrossRef]
- Conant, R.T.; Ryan, M.G.; Ågren, G.I.; Birge, H.E.; Davidson, E.A.; Eliasson, P.E.; Evans, S.E.; Frey, S.D.; Giardina, C.P.; Hopkins, F.M.; et al. Temperature and Soil Organic Matter Decomposition Rates—Synthesis of Current Knowledge and a Way Forward. Glob. Biol. 2011, 17, 3392–3404. [Google Scholar] [CrossRef]
- Kirschbaum, M.U.F. The Temperature Dependence of Organic−Matter Decomposition−Still a Topic of Debate. Soil Biol. Biochem. 2011, 38, 2510–2518. [Google Scholar] [CrossRef]
- He, P.; Li, L.J.; Dai, S.S.; Guo, X.L.; Nie, M.; Yang, X. Straw Addition and Low Soil Moisture Decreased Temperature Sensitivity and Activation Energy of Soil Organic Matter. Geoderma 2024, 442, 116802. [Google Scholar] [CrossRef]
- Wagai, R.; Kishimoto-Mo, A.W.; Yonemura, S.; Shirato, Y.; Hiradate, S.; Yagawaki, Y. Linking Temperature Sensitivity of Soil Organic Matter Decomposition to its Molecular Structure, Accessibility, and Microbial Physiology. Glob. Biol. 2013, 19, 13–25. [Google Scholar] [CrossRef]
- De Graaff, M.A.; van Groenigen, K.J.; Six, J.; Hungate, B.; van Kessel, C. Interactions Between Plant Growth and Soil Nutrient Cycling Under Elevated CO2: A Meta-Analysis. Glob. Biol. 2006, 12, 2077–2091. [Google Scholar] [CrossRef]
- Leppälammi-Kujansuu, J.; Salemaa, M.; Kleja, D.B.; Linder, S.; Helmisaari, H.S. Fine Root Turnover and Litter Production of Norway Spruce in a Long-Term Temperature and Nutrient Manipulation Experiment. Plant Soil 2014, 374, 73–88. [Google Scholar] [CrossRef]
- Kuzyakov, Y.; Friedel, J.K.; Stahr, K. Review of Mechanisms and Quantification of Priming Effects. Geoderma 2000, 32, 1485–1498. [Google Scholar] [CrossRef]
- Fontaine, S.; Mariotti, A.; Abbadie, L. The Priming Effect of Organic Matter: A Question of Microbial Competition? Soil Biol. Biochem. 2003, 35, 837–843. [Google Scholar] [CrossRef]
- Ghee, C.; Neilson, R.; Hallett, P.D.; Robinson, D.; Paterson, E. Priming of Soil Organic Matter Mineralisation is Intrinsically Insensitive to Temperature. Soil Biol. Biochem. 2013, 66, 20–28. [Google Scholar] [CrossRef]
- Feng, C.; Sun, H.; Zhang, Y. The Magnitude and Direction of Priming were Driven by Soil Moisture and Temperature in a Temperate Forest Soil of China. Pedobiologia 2021, 89, 150769. [Google Scholar] [CrossRef]
- Blagodatskaya, E.; Kuzyakov, Y. Mechanisms of Real and Apparent Priming Effects and their Dependence on Soil Microbial Biomass and Community Structure: Critical Review. Biol. Fertil. Soils 2008, 45, 115–131. [Google Scholar] [CrossRef]
- Wang, Q.; Wang, Y.; Wang, S.; He, T.; Liu, L. Fresh Carbon and Nitrogen Inputs Alter Organic Carbon Mineralization and Microbial Community in Forest Deep Soil Layers. Soil Biol. Biochem. 2014, 72, 145–151. [Google Scholar] [CrossRef]
- Hamer, U.; Marschner, B. Priming Effects in Different Soil Types Induced by Fructose, Alanine, Oxalic Acid and Catechol Additions. Soil Biol. Biochem. 2005, 37, 445–454. [Google Scholar] [CrossRef]
- Wang, Q.K.; Chen, L.C.; Yang, Q.P.; Sun, T.; Li, C.M. Different Effects of Single Versus Repeated Additions of Glucose on the Soil Organic Carbon Turnover in a Temperate Forest Receiving Long-Term N Addition. Geoderma 2019, 341, 59–67. [Google Scholar] [CrossRef]
- Xu, M.; Zeng, Q.; Liu, Y.; Liu, C.; Zhang, Q.; Mei, K.; Yuan, X.; Zhang, X.; Chen, Y. Keystone Soil Microbial Modules Associated with Priming Effect under Nitrogen- and Glucose-Addition Treatments. Forests 2023, 14, 1207. [Google Scholar] [CrossRef]
- Nottingham, A.T.; Griffiths, H.; Chamberlain, P.M.; Stott, A.W.; Tanner, E.V.J. Soil Priming by Sugar and Leaf-Litter Substrates: A Link to Microbial Groups. Appl. Soil Ecol. 2009, 42, 183–190. [Google Scholar] [CrossRef]
- Qiao, N.; Schaefer, D.; Blagodatskaya, E.; Zou, X.; Xu, X.; Kuzyakoy, Y. Labile Carbon Retention Compensates for CO2 Released by Priming in Forest Soils. Glob. Change Biol. 2014, 20, 1943–1954. [Google Scholar] [CrossRef]
- Pegoraro, E.; Mauritz, M.; Bracho, R.; Ebert, C.; Dijkstra, P.; Hungate, B.A.; Konstantinidis, K.T.; Luo, Y.; Schädel, C.; Tiedje, J.M. Glucose Addition Increases the Magnitude and Decreases the Age of Soil Respired Carbon in a Long-Term Permafrost Incubation Study. Soil Biol. Biochem. 2018, 129, 201–211. [Google Scholar] [CrossRef]
- Guenet, B.; Leloup, J.; Raynaud, X.; Bardoux, G.; Abbadie, L. Negative Priming Effect on Mineralization in a Soil Free of Vegetation for 80 Years. Eur. J. Soil Sci. 2010, 61, 384–391. [Google Scholar] [CrossRef]
- Magnani, F.; Mencuccini, M.; Borghetti, M.; Berbigier, P.; Berninger, F.; Delzon, S.; Grelle, A.; Hari, P.; Jarvis, P.G.; Kolari, P.; et al. The Human Footprint in the Carbon Cycle of Temperate and Boreal Forests. Nature 2007, 447, 848–850. [Google Scholar] [CrossRef]
- Galloway, J.N.; Dentener, F.J.; Capone, D.G.; Boyer, E.W.; Howarth, R.W.; Seitzinger, S.P.; Asner, G.P.; Cleveland, C.C.; Green, P.A.; Holland, E.A.; et al. Nitrogen Cycles: Past, Present, and Future. Biogeochemistry 2004, 70, 153–226. [Google Scholar] [CrossRef]
- Janssens, I.A.; Dieleman, W.; Luyssaert, S.; Subke, J.A.; Reichstein, M.; Ceulemans, R.; Ciais, P.; Dolman, A.J.; Grace, J.; Matteucci, G.; et al. Reduction of Forest Soil Respiration in Response to Nitrogen Deposition. Nat. Geosci. 2010, 3, 315–322. [Google Scholar] [CrossRef]
- Zhou, S.; Xiang, Y.; Tie, L.; Han, B.; Huang, C. Simulated Nitrogen Deposition Significantly Reduces Soil Respiration in an Evergreen Broadleaf Forest in Western China. PLoS ONE 2018, 13, e0204661. [Google Scholar] [CrossRef]
- Chen, C.; Chen, H.Y. Mapping Global Nitrogen Deposition Impacts on Soil respiration. Sci. Total Environ. 2023, 871, 161986. [Google Scholar] [CrossRef]
- Zang, C.; Niu, D.; Niu, D.; Hall, J.S.; Wen, H.; Li, X.; Fu, H.; Wan, C.; Elser, J.J. Effects of Simulated Nitrogen Deposition on Soil Respiration Components and Their Temperature Sensitivities in a Semiarid Grassland. Soil Biol. Biochem. 2014, 75, 113–123. [Google Scholar] [CrossRef]
- Guo, Z.; Qiang, W.; He, J.; Han, X.; Tan, X.; Ludwig, B.; Shen, W.; Kuzyakov, Y.; Gunina, A. Nitrogen Deposition Raises Temperature Sensitivity of Soil Organic matter decomposition in subtropical forest. Sci. Total Environ. 2024, 907, 167925. [Google Scholar] [CrossRef]
- Li, Q.; Tian, Y.; Zhang, X.; Xu, X.; Wang, H.; Kuzyakov, Y. Labile Carbon and Nitrogen Additions Affect Soil Organic Matter Decomposition More Strongly than Temperature. Appl. Soil Ecol. 2017, 114, 152–160. [Google Scholar] [CrossRef]
- Iimura, Y.; Fujimoto, M.; Tamura, K.; Higashi, T.; Kondo, M.; Uchida, M.; Yonebayashi, K.; Fujitake, N. Black Humic Acid Dynamics During Natural Reforestation of Japanese Pampas Grass (Miscanthus sinensis). Geoderma 2013, 57, 60–67. [Google Scholar] [CrossRef]
- Asano, M.; Wagai, R. Evidence of Aggregate Hierarchy at Micro- to Submicron Scales in an Allophanic Andisol. Geoderma 2014, 216, 62–74. [Google Scholar] [CrossRef]
- Iimura, Y.; Tabara, I.; Izumitsu, K.; Fujitake, N. Priming Effect of the Addition of Maize to a Japanese Volcanic Ash Soil and its Temperature Sensitivity: A Short-Term Incubation Study. Soil Sci. Plant Nutr. 2019, 65, 444–450. [Google Scholar] [CrossRef]
- Iimura, Y.; Tanaka, D.; Nagao, S.; Fujitake, N.; Ohtsuka, T. The Mineralization Rate of Black Soil Carbon in the Deep Layers of Japanese Volcanic Ash Soil may be Easily Accelerated by Labile Carbon Supply. Soil Sci. Plant Nutr. 2020, 66, 415–420. [Google Scholar] [CrossRef]
- Cao, R.; Chen, S.; Yoshitake, Y.; Ohnishi, T.; Iimura, Y.; Ohtsuka, T. The Nitrogen Cycle of a Cool-Temperate Deciduous Broad-Leaved Forest. Forests 2024, 15, 725. [Google Scholar] [CrossRef]
- Fontaine, S.; Henault, C.; Aamor, A.; Bdioui, N.; Bloor, J.M.G.; Maire, V.; Mary, B.; Revaillot, S.; Maron, P.A. Fungi Mediate Long Term Sequestration of Carbon and Nitrogen in Soil through their Priming Effect. Soil Biol. Biochem. 2011, 43, 86–96. [Google Scholar] [CrossRef]
- Yashiro, Y.; Shizu, Y.; Adachi, T.; Ohtsuka, T.; Lee, N.Y.; Iimura, Y.; Koizumi, H. The Effect of Dense Understory Dwarf Bamboo (Sasa senanensis) on Soil Respiration before and after Clearcutting of Cool Temperate Deciduous Broad-leaved Forest. Ecol. Res. 2012, 27, 577–586. [Google Scholar]
- Lefevre, R.; Barre, P.; Moyano, F.E.; Christensen, B.T.; Bardoux, G.; Eglin, T.; Girardin, C.; Houot, S.; Katterer, T.; van Oort, F.; et al. Higher Temperature Sensitivity for Stable than for Labile Soil Organic Carbon–Evidence from Incubations of Long-term Bare Fallow Soils. Glob. Change Biol. 2014, 20, 633–640. [Google Scholar] [CrossRef]
- Aoyama, M. Estimation of Microbial Biomass in Ando Soils by Measurement using a Handy Iuminometer. Jpn. Soc. Microbiol. 2005, 59, 41–44. [Google Scholar]
- Fontaine, S.; Bardoux, G.; Abbadie, L.; Mariotti, A. Carbon Input to Soil may decrease Soil Carbon content. Ecol. Lett. 2004, 7, 314–320. [Google Scholar] [CrossRef]
- Jones, D.L.; Edward, A.C. Influence of Sorption on the Biological Utilization of Two Simple Carbon Substrates. Soil Biol. Biochem. 1998, 30, 1895–1902. [Google Scholar] [CrossRef]
- Kuzyakov, Y. Priming Effects: Interactions between Living and Dead Organic Matter. Soil Biol. Biochem. 2010, 42, 1363–1371. [Google Scholar] [CrossRef]
- Anderson, J.P.E.; Domsch, K.H. A Physiological Method for the Quantitative Measurement of Microbial Biomass in Soils. Soil Biol. Biochem. 1978, 10, 215–221. [Google Scholar] [CrossRef]
- Yuan, Y.; Zhang, Z.; Chen, L.; Yang, C. The Formation of Protected SOM Facilitated by Labile C Input via Artificial Roots. Eur. J. Soil Sci. 2020, 100, 103231. [Google Scholar] [CrossRef]
- Schmidt, M.W.I.; Torn, M.S.; Abiven, S.; Dittmar, T.; Guggenberger, G.; Janssens, I.A.; Kleber, M.; Kogel−Knabner, I.; Lehmann, J.; Manning, D.A.C.; et al. Persistence of Soil Organic Matter as an Ecosystem Property. Nature 2011, 478, 49–56. [Google Scholar] [CrossRef]
- Lehmann, J.; Kleber, M. The Contentious Nature of Soil Organic Matter. Nature 2015, 528, 60–68. [Google Scholar] [CrossRef]
- Chen, R.; Senbayram, M.; Bragodatsky, S.; Myachina, O.; Dittert, K.; Lin, X.; Blagodatskaya, E.; Kuzyakov, Y. Soil C and N Availability Determine the Priming Effect: Microbial N Mining and Stoichiometric Decomposition Theories. Glob. Change Biol. 2014, 20, 2356–2367. [Google Scholar] [CrossRef]
- Tao, X.; Yang, Z.; Feng, J.; Jian, S.; Yang, Y.; Bates, C.T.; Wang, G.; Guo, X.; Ning, D.; Kempher, M.L.; et al. Experimental Warming Accelerates Positive Soil Priming in a Temperate Grassland Ecosystem. Nat. Commun. 2024, 15, 1178. [Google Scholar] [CrossRef]
- Li, X.; Feng, J.; Zhang, Q.; Zhu, B. Warming Inhibits the Priming Effect of Soil Organic Carbon Mineralization: A Meta-Analysis. Sci. Total Environ. 2023, 904, 166170. [Google Scholar] [CrossRef]
- Gershenson, J.; Bader, N.E.; Cheng, W. Effects of Substrate Availability on the Temperature Sensitivity of Soil Organic Matter Decomposition. Glob. Change Biol. 2009, 15, 176–183. [Google Scholar] [CrossRef]
- Zhang, S.; Wang, M.; Xiao, L.; Luo, Z. Reconciling Carbon Quality with Availability Predicts Temperature Sensitivity of Global Soil Carbon Mineralization. Proc. Natl. Acad. Sci. USA 2024, 121, e231384. [Google Scholar] [CrossRef]


| Depth | pH | T-C | C:N Ratio | MI 1 | δ13C | 14C Age 2 | ||
|---|---|---|---|---|---|---|---|---|
| (cm) | (H2O) | (KCl) | (NaF) | (g kg−1) | (‰) | (YrBP) | ||
| 40–50 | 5.1 | 4.3 | 11.5 | 89.4 | 16.0 | 1.64 | −19.8 | 4764–5082 |
| Primed CO2 (mg C kg−1) | ||||
|---|---|---|---|---|
| Days | Temp. °C | SN | SC | SCN |
| 7 | 15 | 0.6 ± 1.9 | 0.8 ± 2.9 | 1.1 ± 3.3 |
| 14 | 25 | −7.4 ± 2.9 | 22.4 ± 2.9 * | 21.1 ± 3.6 * |
| 21 | 25 | −8.3 ± 2.4 | 27.3 ± 2.6 ** | 26.3 ± 3.8 * |
| 28 | 25 | −9.5 ± 2.2 | 33.7 ± 2.2 *** | 34.3 ± 2.9 *** |
| 35 | 35 | −2.6 ± 1.3 | 61.5 ± 0.4 *** | 59.2 ± 2.6 *** |
| 42 | 35 | −0.8 ± 1.8 | 67.0 ± 1.4 *** | 67.6 ± 2.7 *** |
| 49 | 35 | 1.0 ± 2.1 | 74.0 ± 1.7 *** | 75.5 ± 2.9 *** |
Disclaimer/Publisher’s Note: The statements, opinions and data contained in all publications are solely those of the individual author(s) and contributor(s) and not of MDPI and/or the editor(s). MDPI and/or the editor(s) disclaim responsibility for any injury to people or property resulting from any ideas, methods, instructions or products referred to in the content. |
© 2024 by the authors. Licensee MDPI, Basel, Switzerland. This article is an open access article distributed under the terms and conditions of the Creative Commons Attribution (CC BY) license (https://creativecommons.org/licenses/by/4.0/).
Share and Cite
Iimura, Y.; Tanaka, D. Effects of the Co-Application of Glucose, Nitrogen, and Elevated Temperature on Buried Black Soil Carbon in a Cool Temperate Deciduous Broad-Leaved Forest. Forests 2024, 15, 1057. https://doi.org/10.3390/f15061057
Iimura Y, Tanaka D. Effects of the Co-Application of Glucose, Nitrogen, and Elevated Temperature on Buried Black Soil Carbon in a Cool Temperate Deciduous Broad-Leaved Forest. Forests. 2024; 15(6):1057. https://doi.org/10.3390/f15061057
Chicago/Turabian StyleIimura, Yasuo, and Daichi Tanaka. 2024. "Effects of the Co-Application of Glucose, Nitrogen, and Elevated Temperature on Buried Black Soil Carbon in a Cool Temperate Deciduous Broad-Leaved Forest" Forests 15, no. 6: 1057. https://doi.org/10.3390/f15061057
APA StyleIimura, Y., & Tanaka, D. (2024). Effects of the Co-Application of Glucose, Nitrogen, and Elevated Temperature on Buried Black Soil Carbon in a Cool Temperate Deciduous Broad-Leaved Forest. Forests, 15(6), 1057. https://doi.org/10.3390/f15061057