Article

Relationship between Green Space and Mortality in the Cities of the Yangtze River Delta Urban Agglomeration

1
School of Civil Engineering and Architecture, Zhejiang Sci-Tech University, Hangzhou 310018, China
2
Hangzhou Center for Disease Control and Prevention, Hangzhou 310012, China
*
Author to whom correspondence should be addressed.
These authors contributed equally to this work.
Forests 2024, 15(6), 1066; https://doi.org/10.3390/f15061066
Submission received: 28 May 2024 / Revised: 14 June 2024 / Accepted: 18 June 2024 / Published: 20 June 2024
(This article belongs to the Special Issue Urban Forests and Human Health)

Abstract

:
Intense work pressure and unhealthy lifestyles significantly threaten urban public health. Urban designs have quickly developed, such as the introduction of green space (GS), which has been suggested to improve public health. Prior epidemiological studies have investigated GS and mortality and have generally found potential benefits. However, these studies were primarily conducted in developed Western countries and the potential effects of GS on mortality in developing Asian countries are poorly understood. In this study, our goal was to investigate the effect of GS landscape attributes and socioeconomic conditions on all-cause mortality in 41 cities in the Yangtze River Delta urban agglomeration. Nine GS variables and seven socioeconomic variables were collected. An optimal general linear model with the selected variables was established using LASSO regression to explore the direction and relative importance of GSs and socioeconomic conditions for urban public health. The results showed that (1) socioeconomic conditions and GS jointly affect all-cause mortality, (2) people with greater personal wealth suffered less health risk, and (3) regularly shaped and highly connected GSs decreased the risk to public health. These findings suggest that reasonable GS policies and planning strategies are effective approaches for improving public health in Chinese cities.

1. Introduction

Urbanization has been the main trend in the era of human domination—in other words, the Anthropocene. Currently, 55% of the world’s population lives in urban areas, and the urban population is expected to reach 70% by 2050 [1]. With rapid urban expansion, the living environments and lifestyles of residents continue to change dramatically [2]. Intense work pressure and unhealthy lifestyles significantly threaten urban public health [3,4]. In response to this problem, urban health designs have quickly developed, such as the introduction of green space (GS), which has been suggested to improve public health [5]. GS promotes physical activity, reduces mental stress, and increases social interaction [6]. It also provides additional ecosystem services, such as air purification, heat island mitigation, and biodiversity maintenance [7]. Although some studies have reported the health risks of GS, such as exposure to allergens, pesticides, or disease vectors [8,9], most evidence supports that exposure to GS benefits public health [10,11].
Most existing studies on the health effects of GS have been conducted at small scales, such as in public parks or neighborhoods, using indices that measure the surrounding greenness [12,13]. The amount and accessibility of GS, plant diversity, canopy coverage, and green-looking ratio are commonly used to analyze users’ behavior and mental activities in GS [14], and consequently guide the design of parks, gardens, and backyards. However, few large-scale studies have been conducted across cities, provinces, or states, the results of which may be important for the planning of GS across a wider range [15]. Stakeholders, such as policymakers, urban managers, and urban planners, were more interested in the health effects of GS on a larger scale, but the absence of quantitative evidence from cross-city or cross-region studies hindered their implementation. Robust quantitative evidence from a cross-city analysis regarding GS and its health outcomes could facilitate reasonable and effective approaches, such as health impact assessment, and support public health policy making and application.
Mortality is a commonly used indicator of public health at city or regional scales. In China, more than 70% of deaths are caused by cardiovascular diseases and cancer [16]. GS may support cardiovascular health in the general population via multiple pathways such as mitigating heat waves and pollution [17,18], improving sleep [19], and enriching outdoor activities and relative social and physical recreation [20,21]. Prior epidemiological studies have investigated GS and mortality and have generally found potential benefits. However, these studies were primarily conducted in developed Western countries [10]. The potential effects of GS on mortality in developing Asian and African countries are poorly understood. To fill this knowledge gap, the objectives of the present study were to analyze the relationship between the landscape attributes of GSs and the all-cause mortality of cities in the Yangtze River Delta urban agglomeration (YRDUA), China. We also explored the relative contributions of socioeconomic conditions and GS to urban mortality. Our goal was to offer data-driven recommendations for the planning and management of GS to promote public health in Chinese cities.

2. Materials and Methods
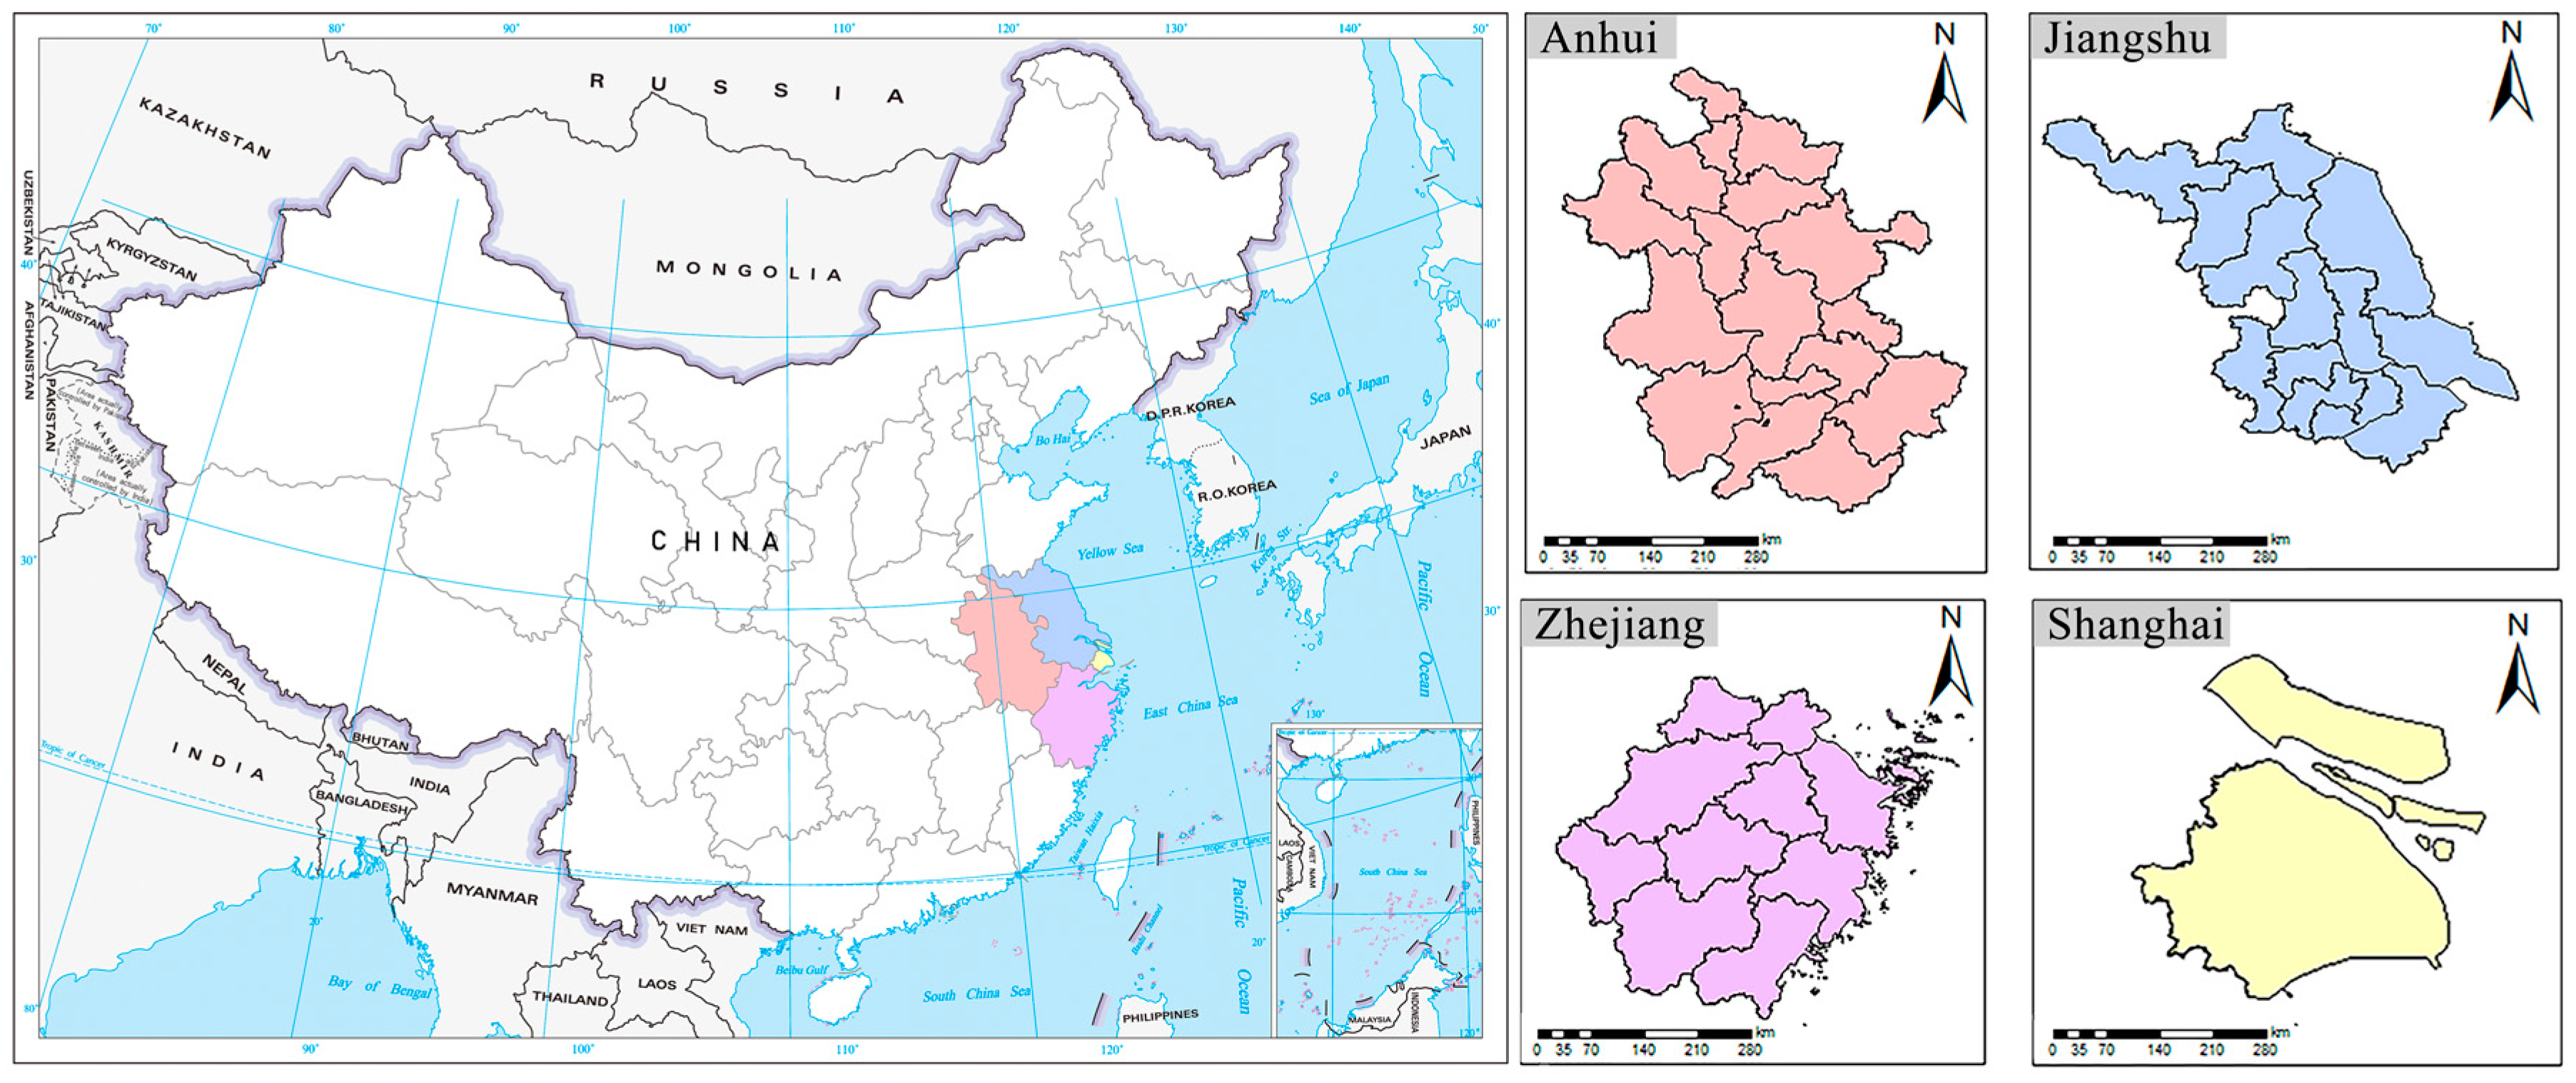
2.1. Study Region

The YRDUA is China’s most economically developed region, with the highest urbanization level in East China. The YRDUA is located at the range of 27°09′ N~35°20′ N and 114°54′ E~122°12′ E, which comprises 41 cities of the three provinces of Jiangsu, Zhejiang, Anhui, and one municipality of Shanghai (Figure 1, Table S1). Its area is 358,000 km2 with a more than 60% urbanization rate. The YRDUA has a subtropical monsoon climate. Its typical topographical pattern is high in the south with mountains and hills, and low in the north with plains. The total GDP of the YRDUA in 2023 exceeded 30.51 trillion (RMB), accounting for about 24% of the total national GDP. Among them, the GDP of Shanghai, Jiangsu, Zhejiang, and Anhui reached 4.72 trillion, 12.82 trillion, 8.26 trillion, and 4.71 trillion RMB, respectively. In this study, we analyzed the relationship between all-cause mortality and GSs in 41 cities of the YRDUA.

2.2. Data Collection

2.2.1. Landscape Attributes of GS

Raw land use and land cover (LULC) data in 2018 with 30 m resolution were obtained from the annual China Land Cover Dataset [22]. The raw data were reclassified into cropland, GS, water bodies, built-up areas, and bare land. Based on the reclassified LULC data, nine landscape indices of GSs (Table 1) were calculated using FRAGSTATS v4.2 (produced by McGarigal K., Cushman S.A., and Ene E.; available at https://fragstats.org/, accessed on 14 June 2014).

2.2.2. All-Cause Mortality and Socioeconomic Conditions

All-cause mortality data were obtained from the China Health Statistics Yearbook. The mortality rates of the 41 cities in 2018 were selected to avoid the influence of COVID-19 from 2019 to 2023. Then the mortalities were classified into five levels: critical (≥1%), high (0.8%–1%), medium (0.6%–0.8%), low (0.4%–0.6%), and mild (<0.4%). We also collected seven socioeconomic variables (see Table 2) from the China Urban Statistical Yearbook.

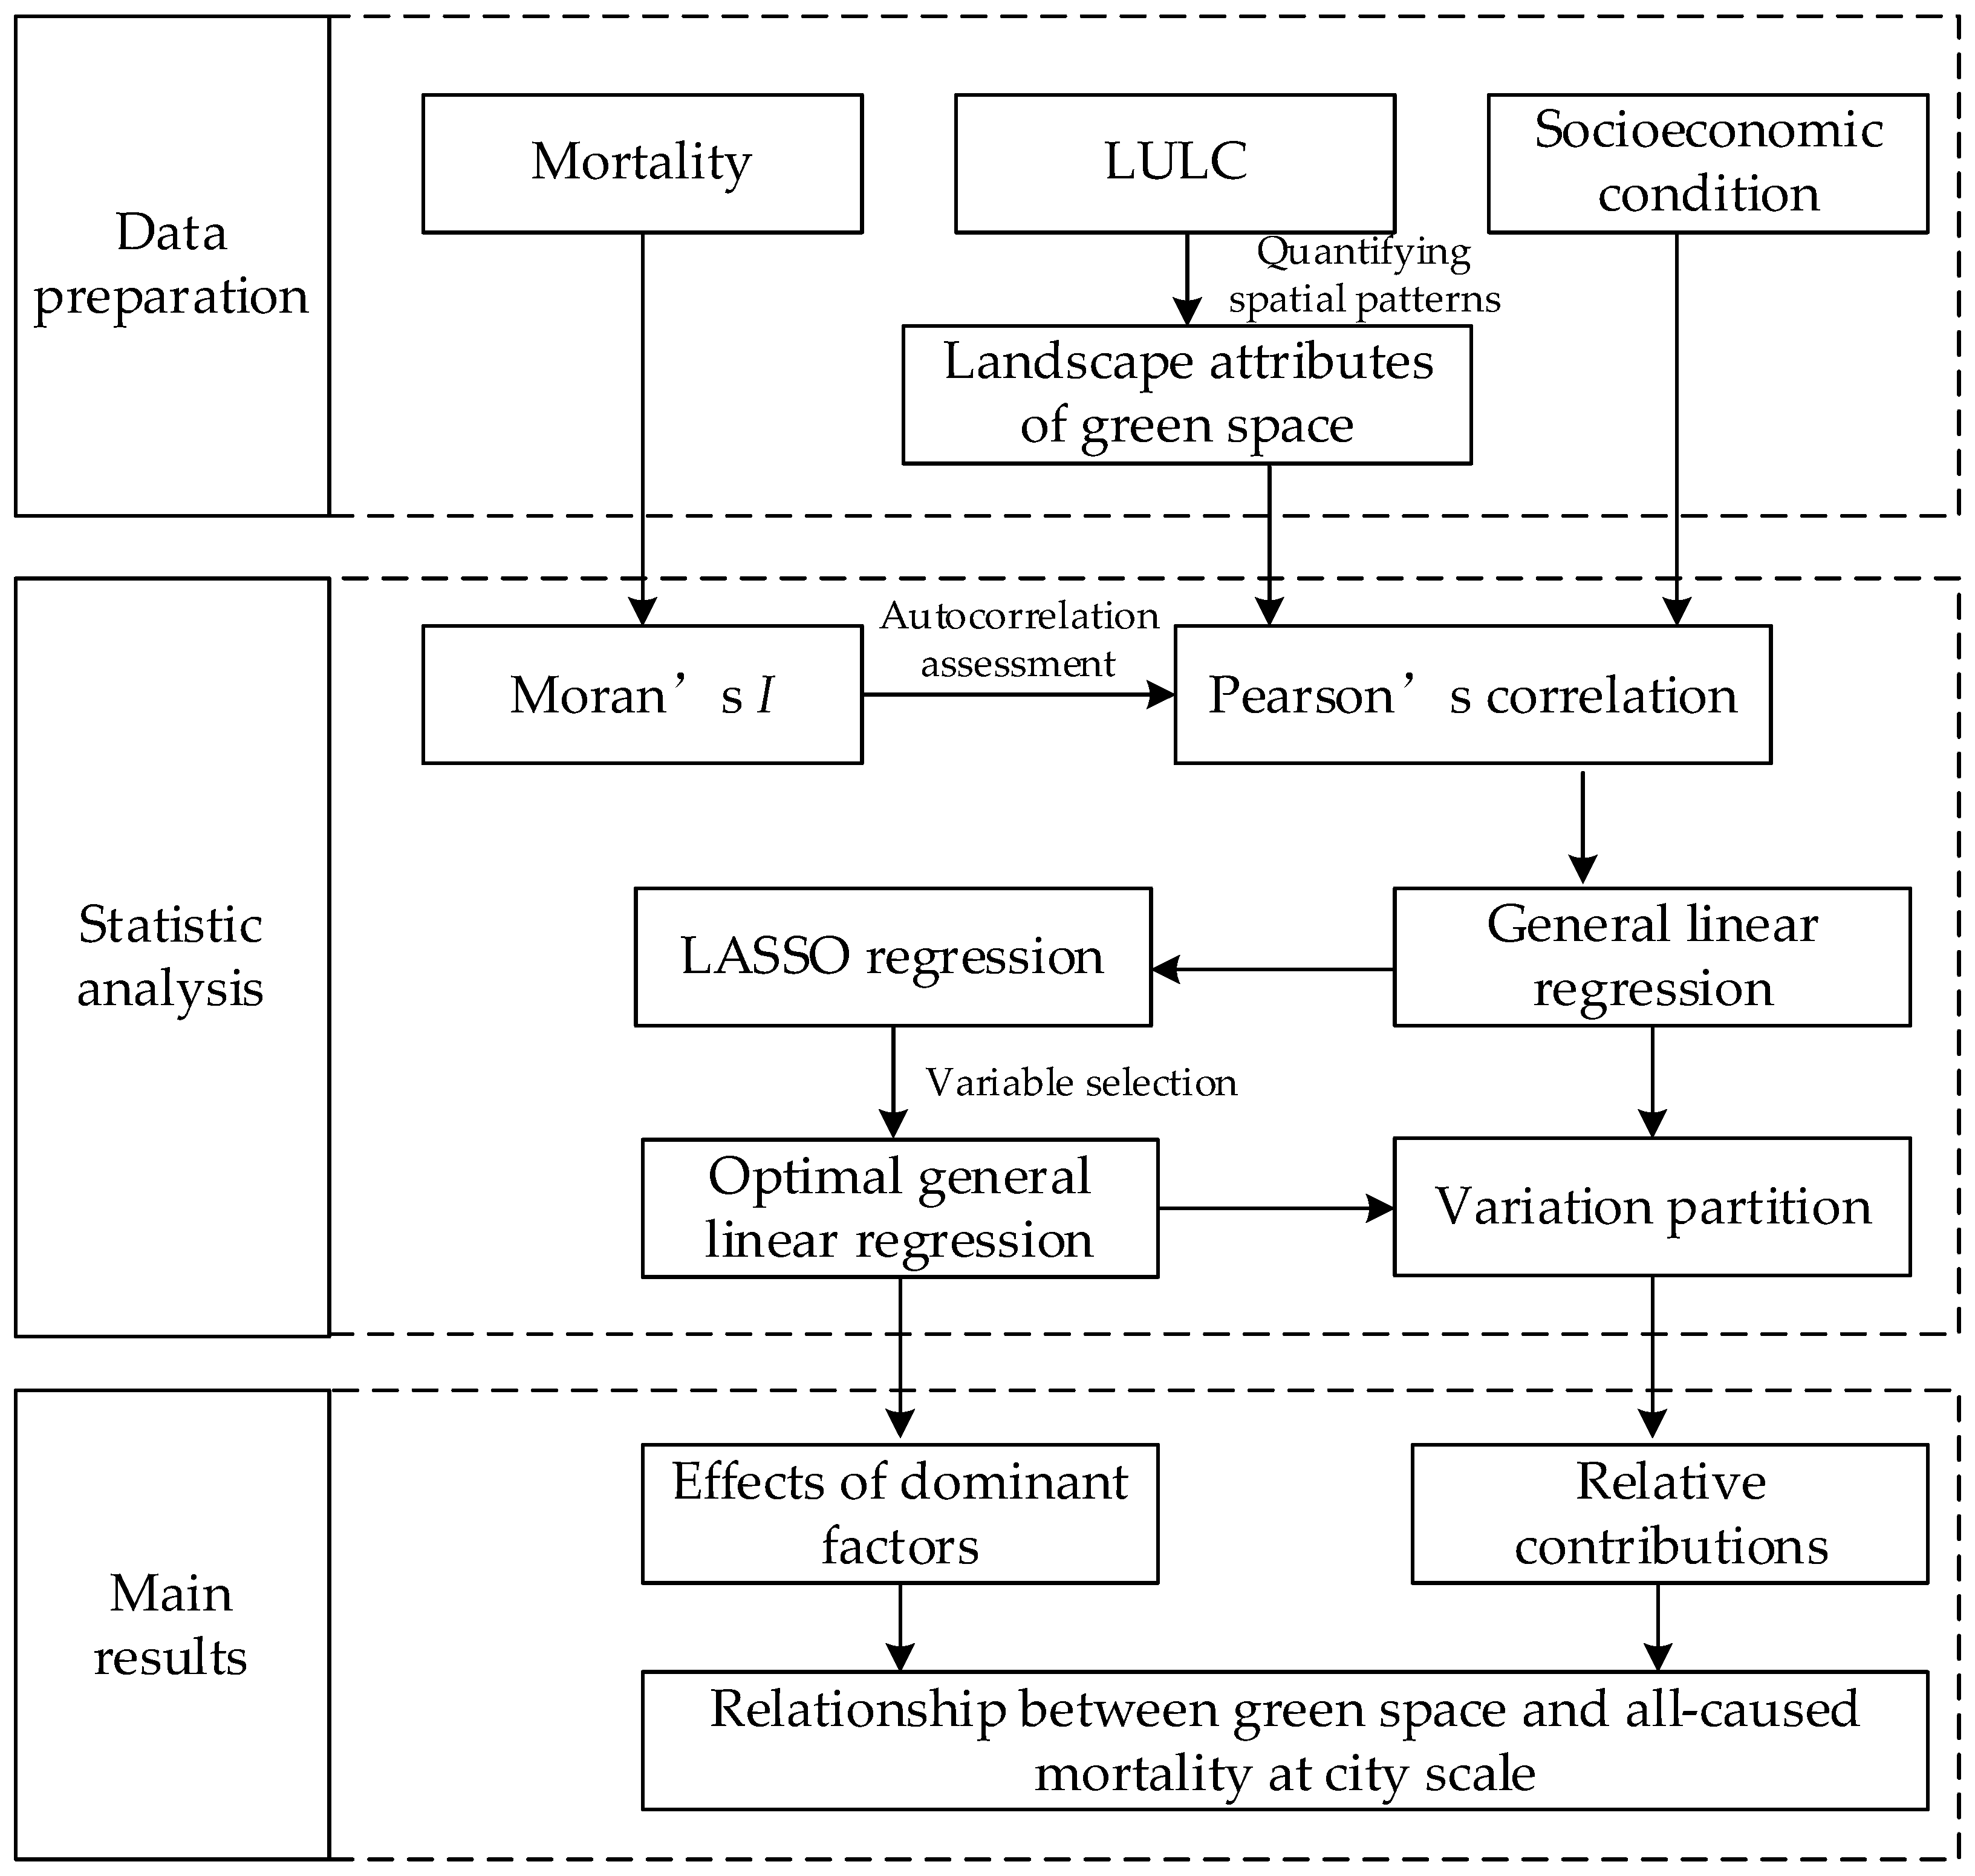
2.2.3. Statistical Analysis

Global Moran’s I was used to evaluate the spatial autocorrelation of the mortalities of the cities. Pearson’s correlation analysis was used to test the relationships between mortality and each variable and between different variables. After standardizing these 16 variables, we constructed two independent datasets involving socioeconomic and GS variables and applied them to a general linear model (GLM) to test their effects on all-cause mortality. GLM was mostly considered as a correlation analysis rather than a cause-effect analysis, which may misestimate the actual effect of multiple factors. However, in this study, it can be treated as a quasi-cause–effect analysis because it was confirmed that GS attributes and socioeconomic conditions were important in influencing mortality, as proved by many previous studies [4,10,12]. Furthermore, the relevant mortality-related variables in the YRDUA were selected using a penalized regression, the LASSO regression by the R package {glmnet} [23,24], to optimize the model. The relative contributions of GS and socioeconomic conditions were measured by variation partitioning using the R package {vegan} [25]. The analysis framework is shown in Figure 2.

3. Results

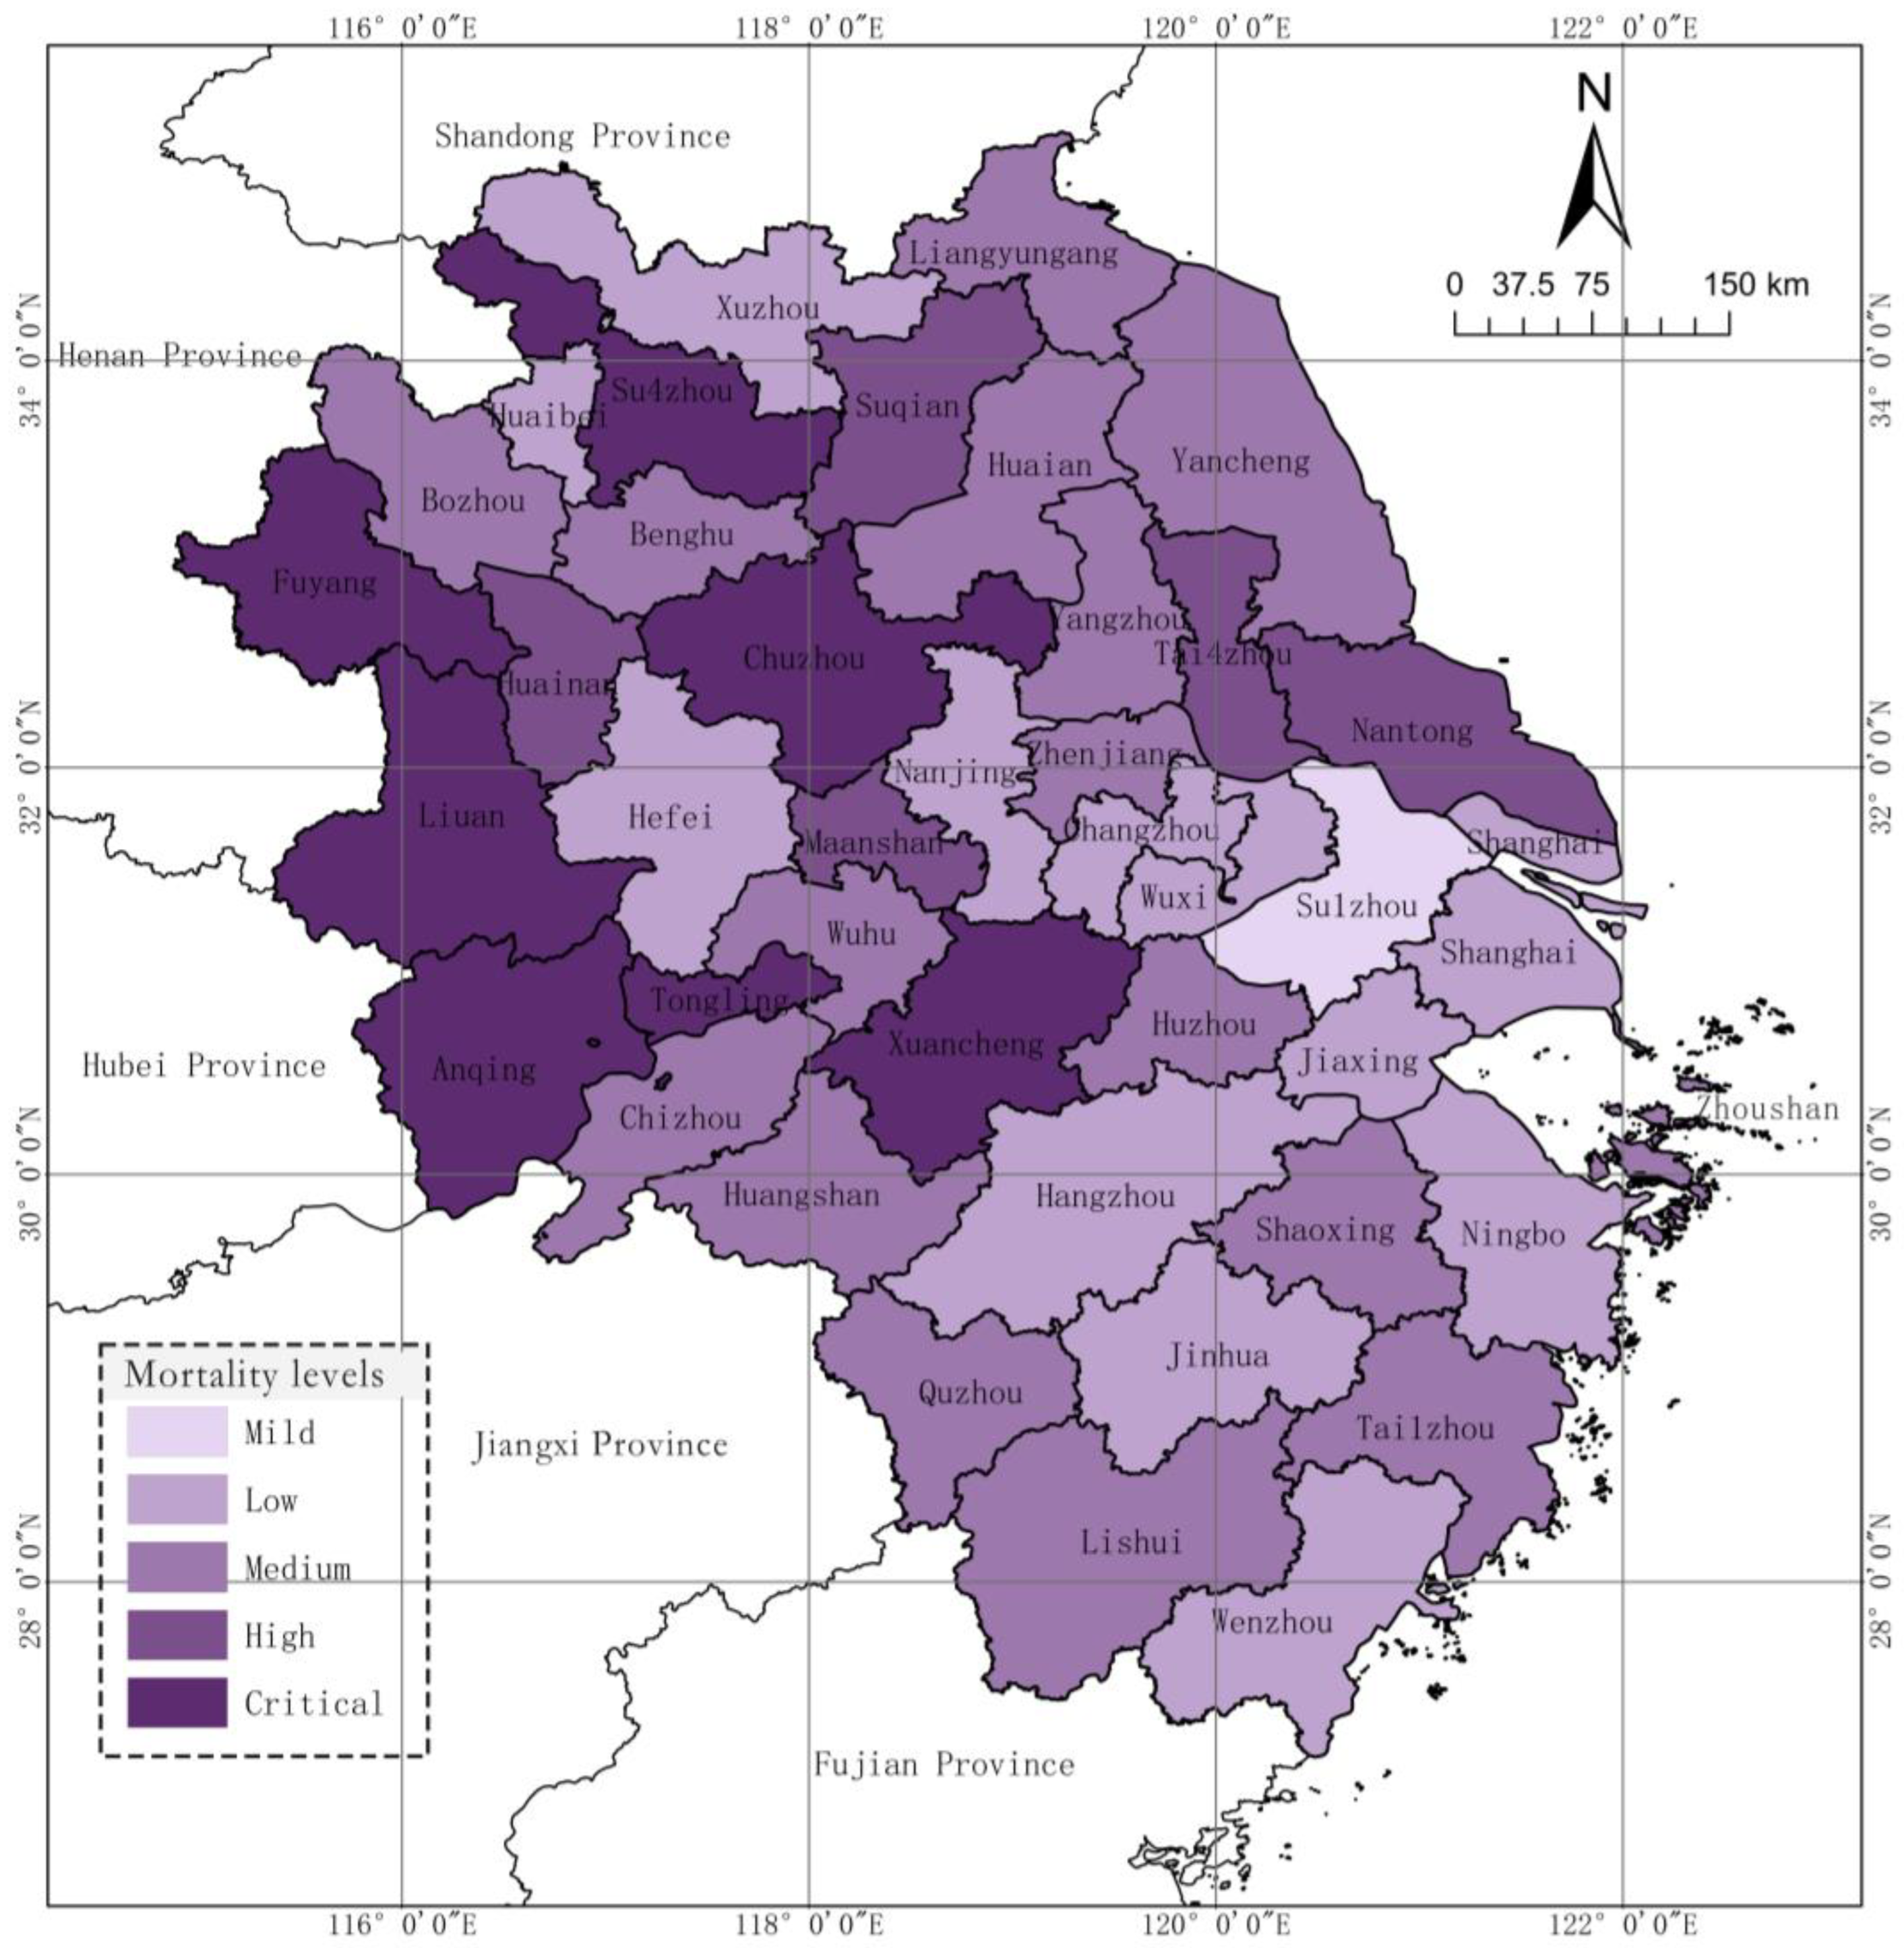
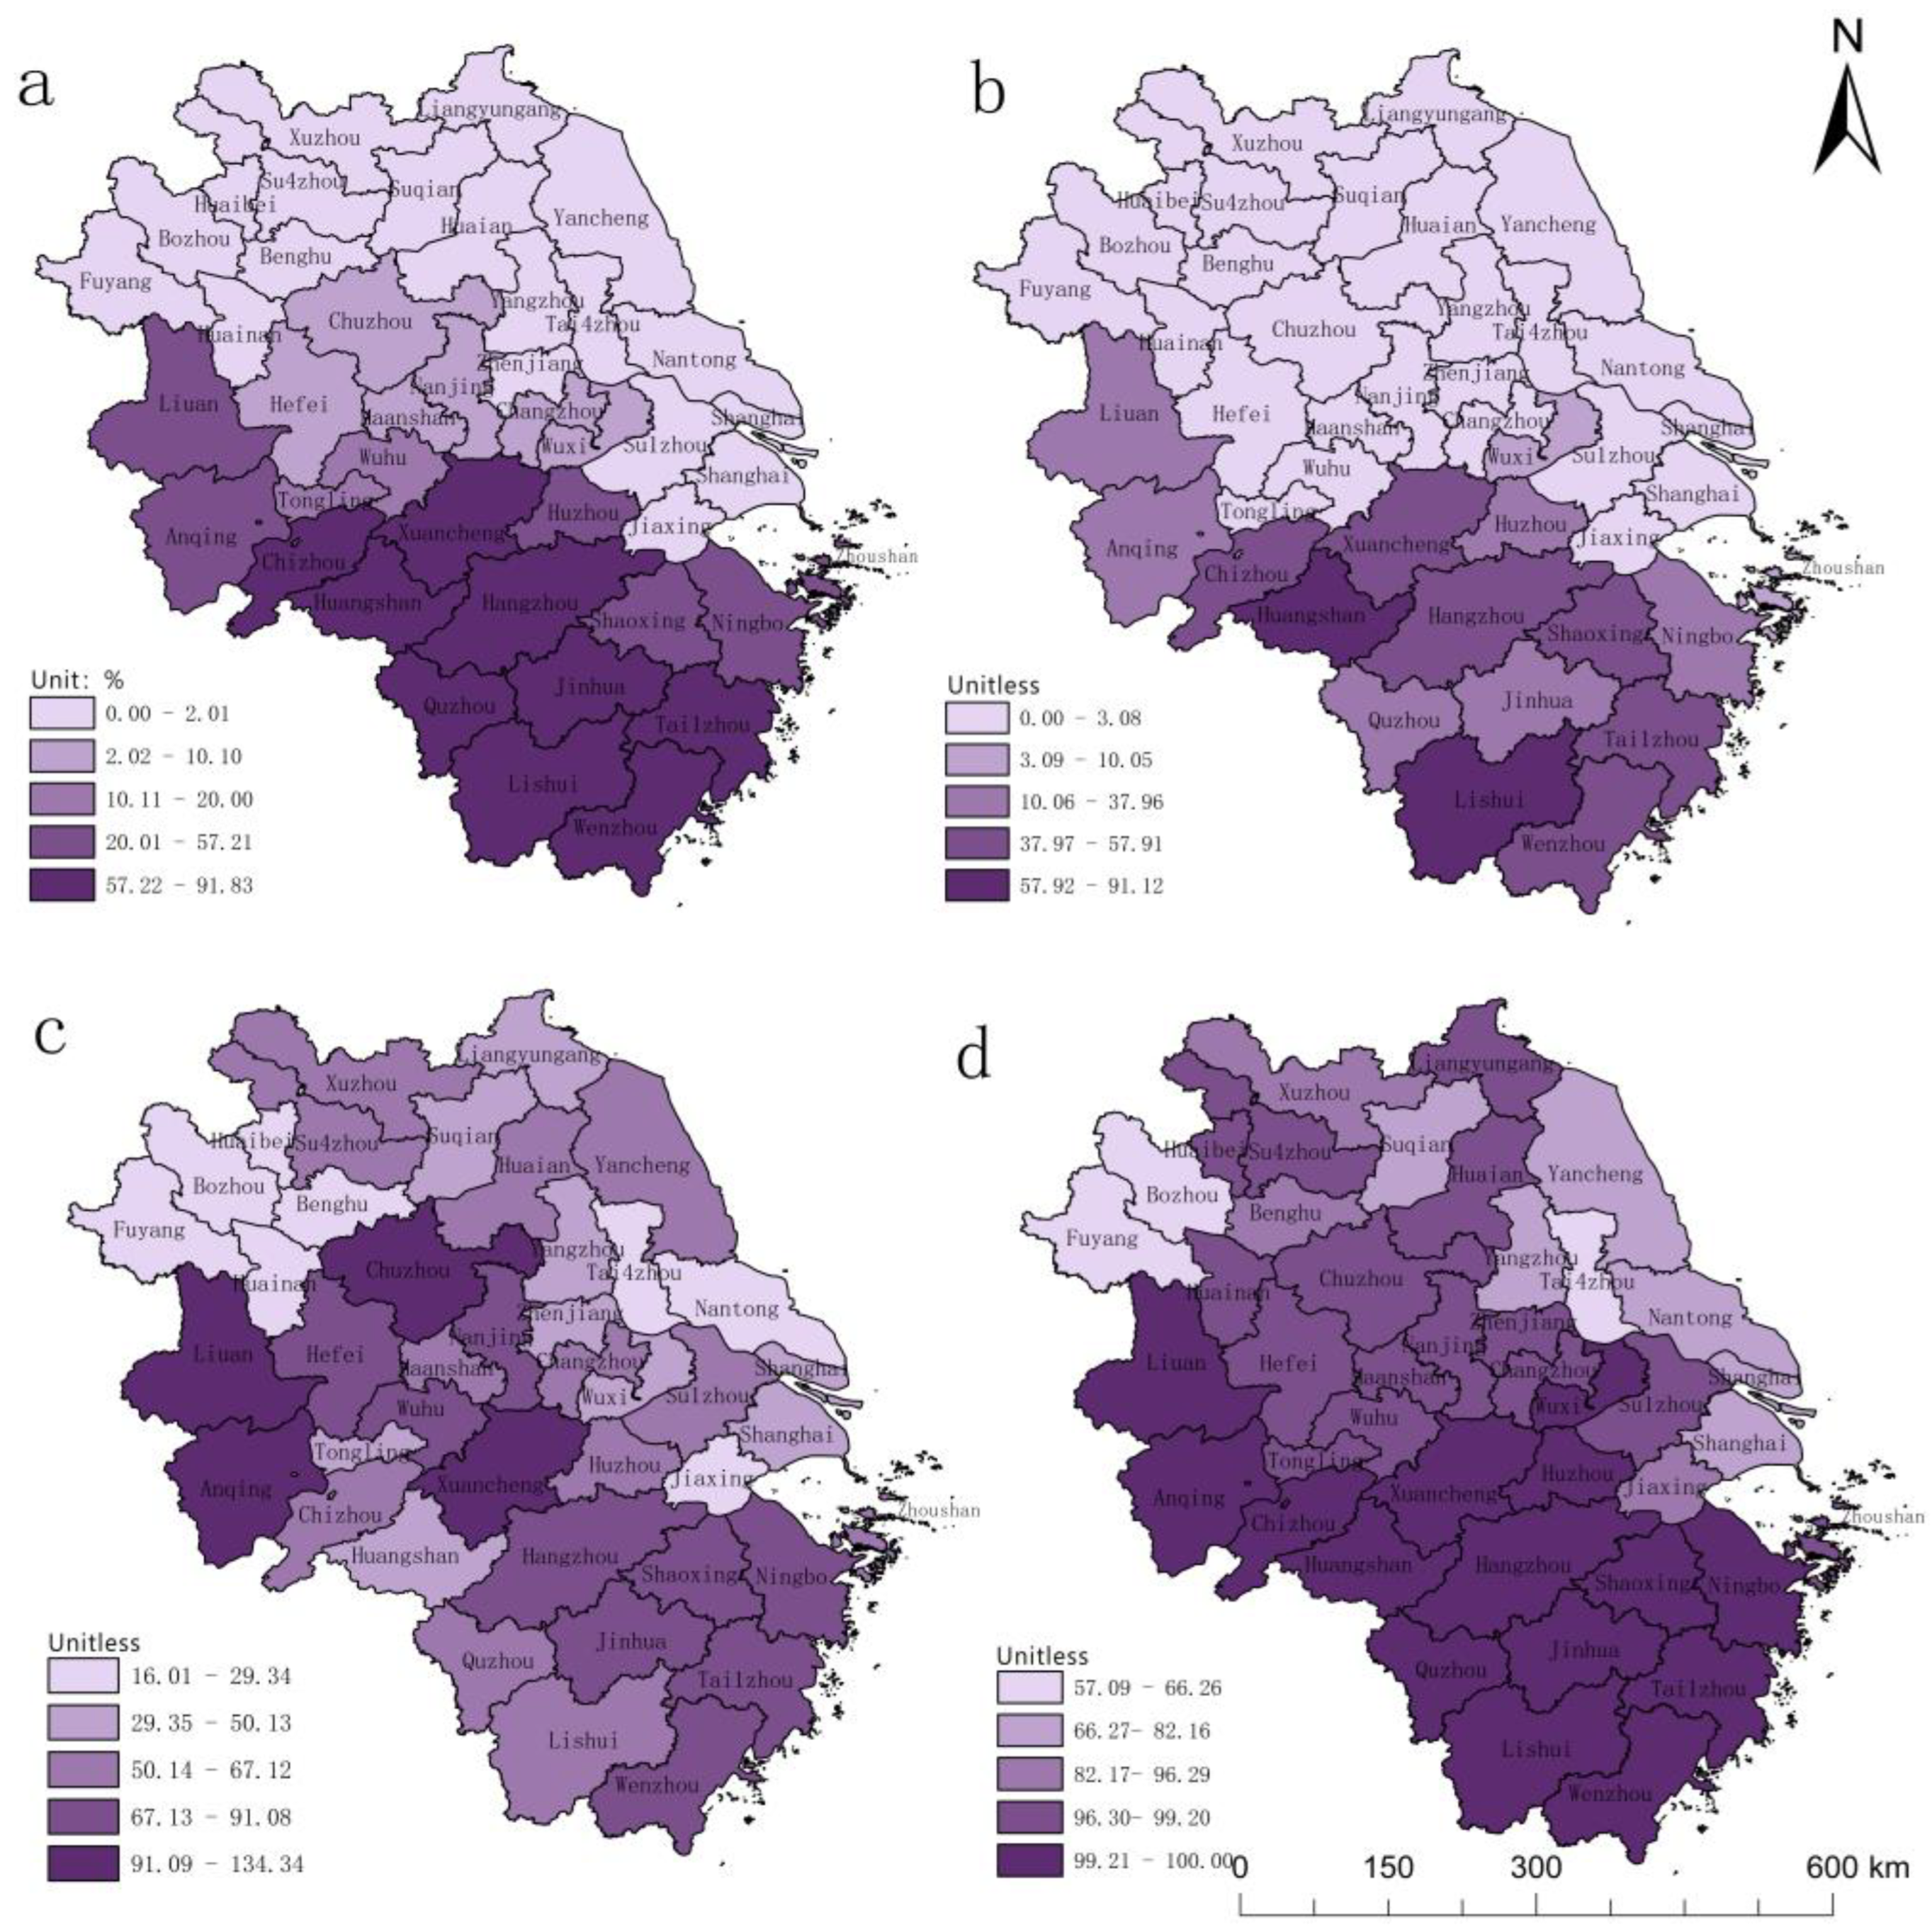
3.1. Spatial Pattern of All-Cause Mortality

The results of global Moran’s I showed that there was no significant autocorrelation of these cities’ mortalities (I = 0.04, p = 0.543). All-cause mortality in the YRDUA showed a spatial pattern of higher levels in the northwest and lower levels in the east (Figure 3). All-cause mortalities in 16 cities in the YRDUA were at a medium level. The cities with critical and high mortality levels are located at the western and northern edges of the YRDUA, mostly in Anhui Province. Cities with low and mild mortality levels are located in the eastern part of the YRDUA, which is better developed, such as Suzhou, Hangzhou, Ningbo, and Shanghai. Fuyang in Anhui Province was the city with the highest all-cause mortality (1.62%), whereas Suzhou in Jiangsu Province, which is famous for its many Chinese classical gardens, was the lowest (0.39%).

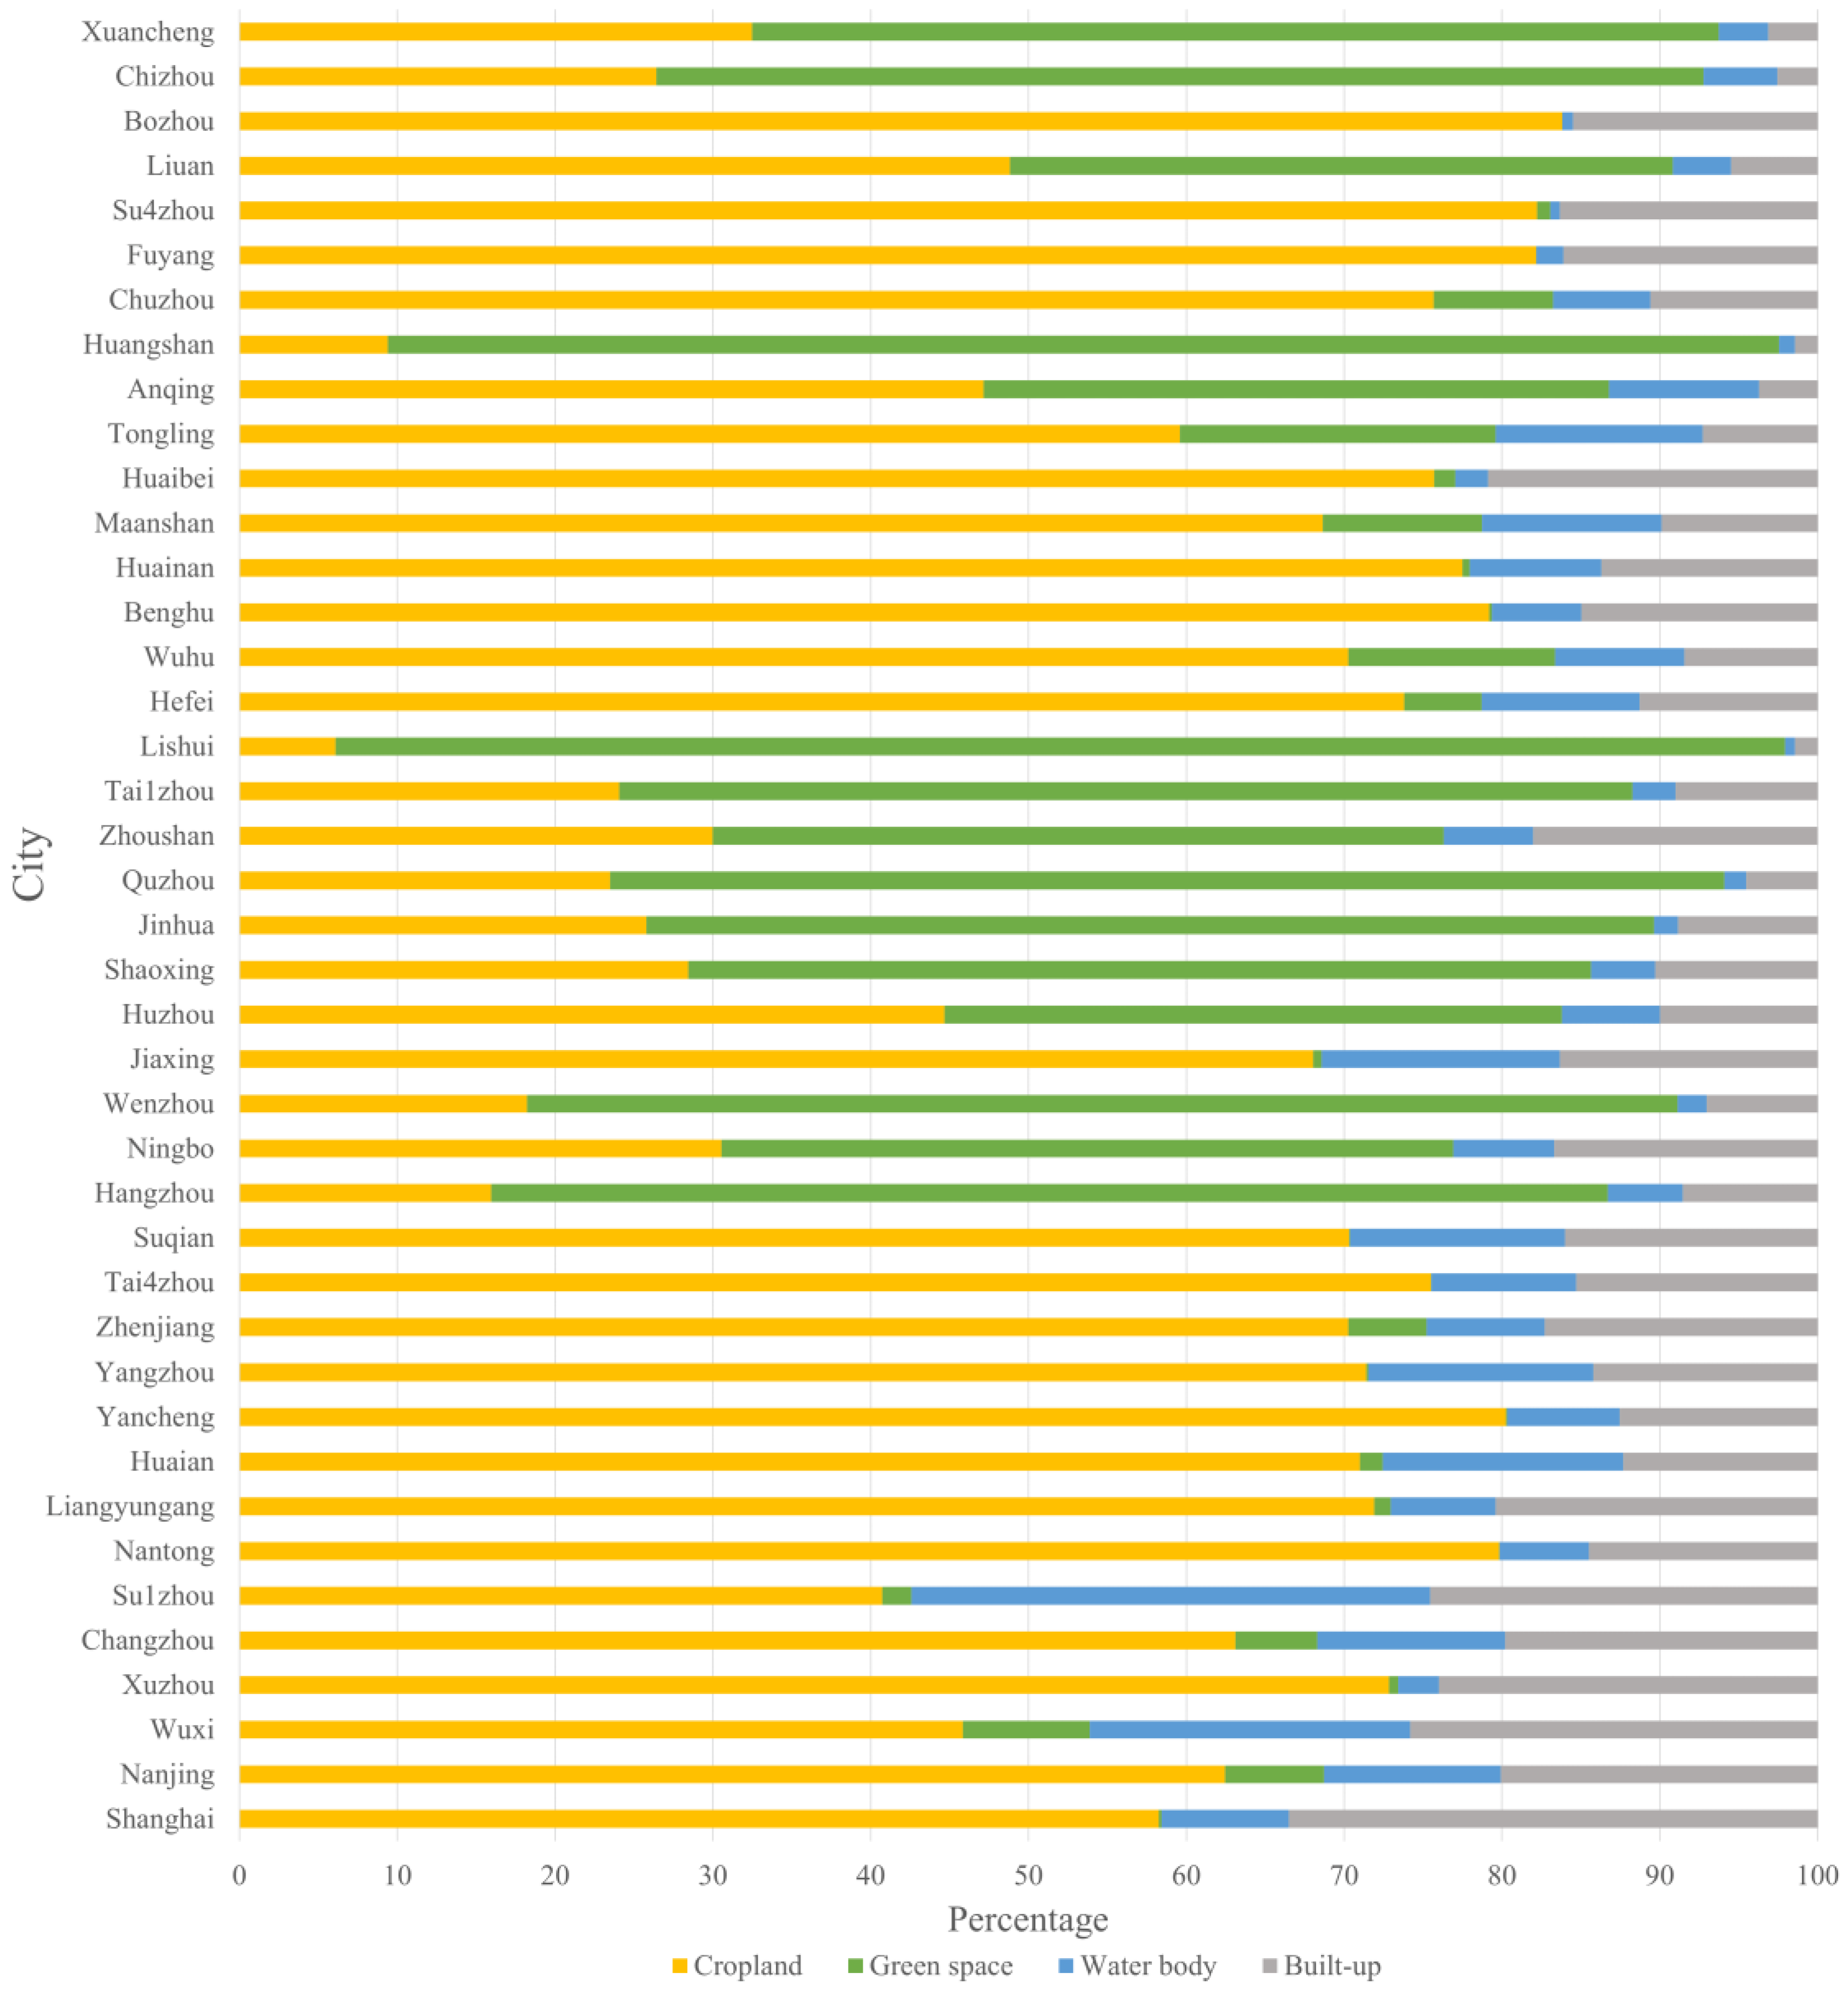
3.2. Spatial Variation of GS in the YRDUA

In terms of the proportion of LULC types, croplands were the main LULC type in the YRRUA, followed by GSs, built-up areas, and water bodies (Figure 4). A relatively higher ratio of water bodies was observed in cities in northern and southern Zhejiang than in other cities. As expected, Shanghai has the highest percentage of built-up areas. The cities in Zhejiang Province had the largest GS PLAND (Figure 5a), which also had the largest LPIs (Figure 5b).
Detailed values of the landscape attributes of GS across these cities in the YRDUA are listed in Table S1. LSI was an important indicator for assessing the shape complexity of GSs in this study. A higher LSI indicates a more irregular shape, leading to stronger edge effects that affect the GSs. The cities with higher LSIs were mainly located at the center and southeast of the YRDUA (Figure 5c) because of higher urbanization and artificial modification. The cohesion index assessed the aggregation of GS patches. A high cohesion value indicates high connectivity between GS patches and less fragmentation. The spatial pattern of the cohesion index was similar to that of PLAND, being higher in the south and lower in the north of the YRDUA (Figure 5d), which may be related to topography. The southern part of the YRDUA is a hilly area suitable for forests, and the northern part consists of plains that are suitable for cropland and urban construction.

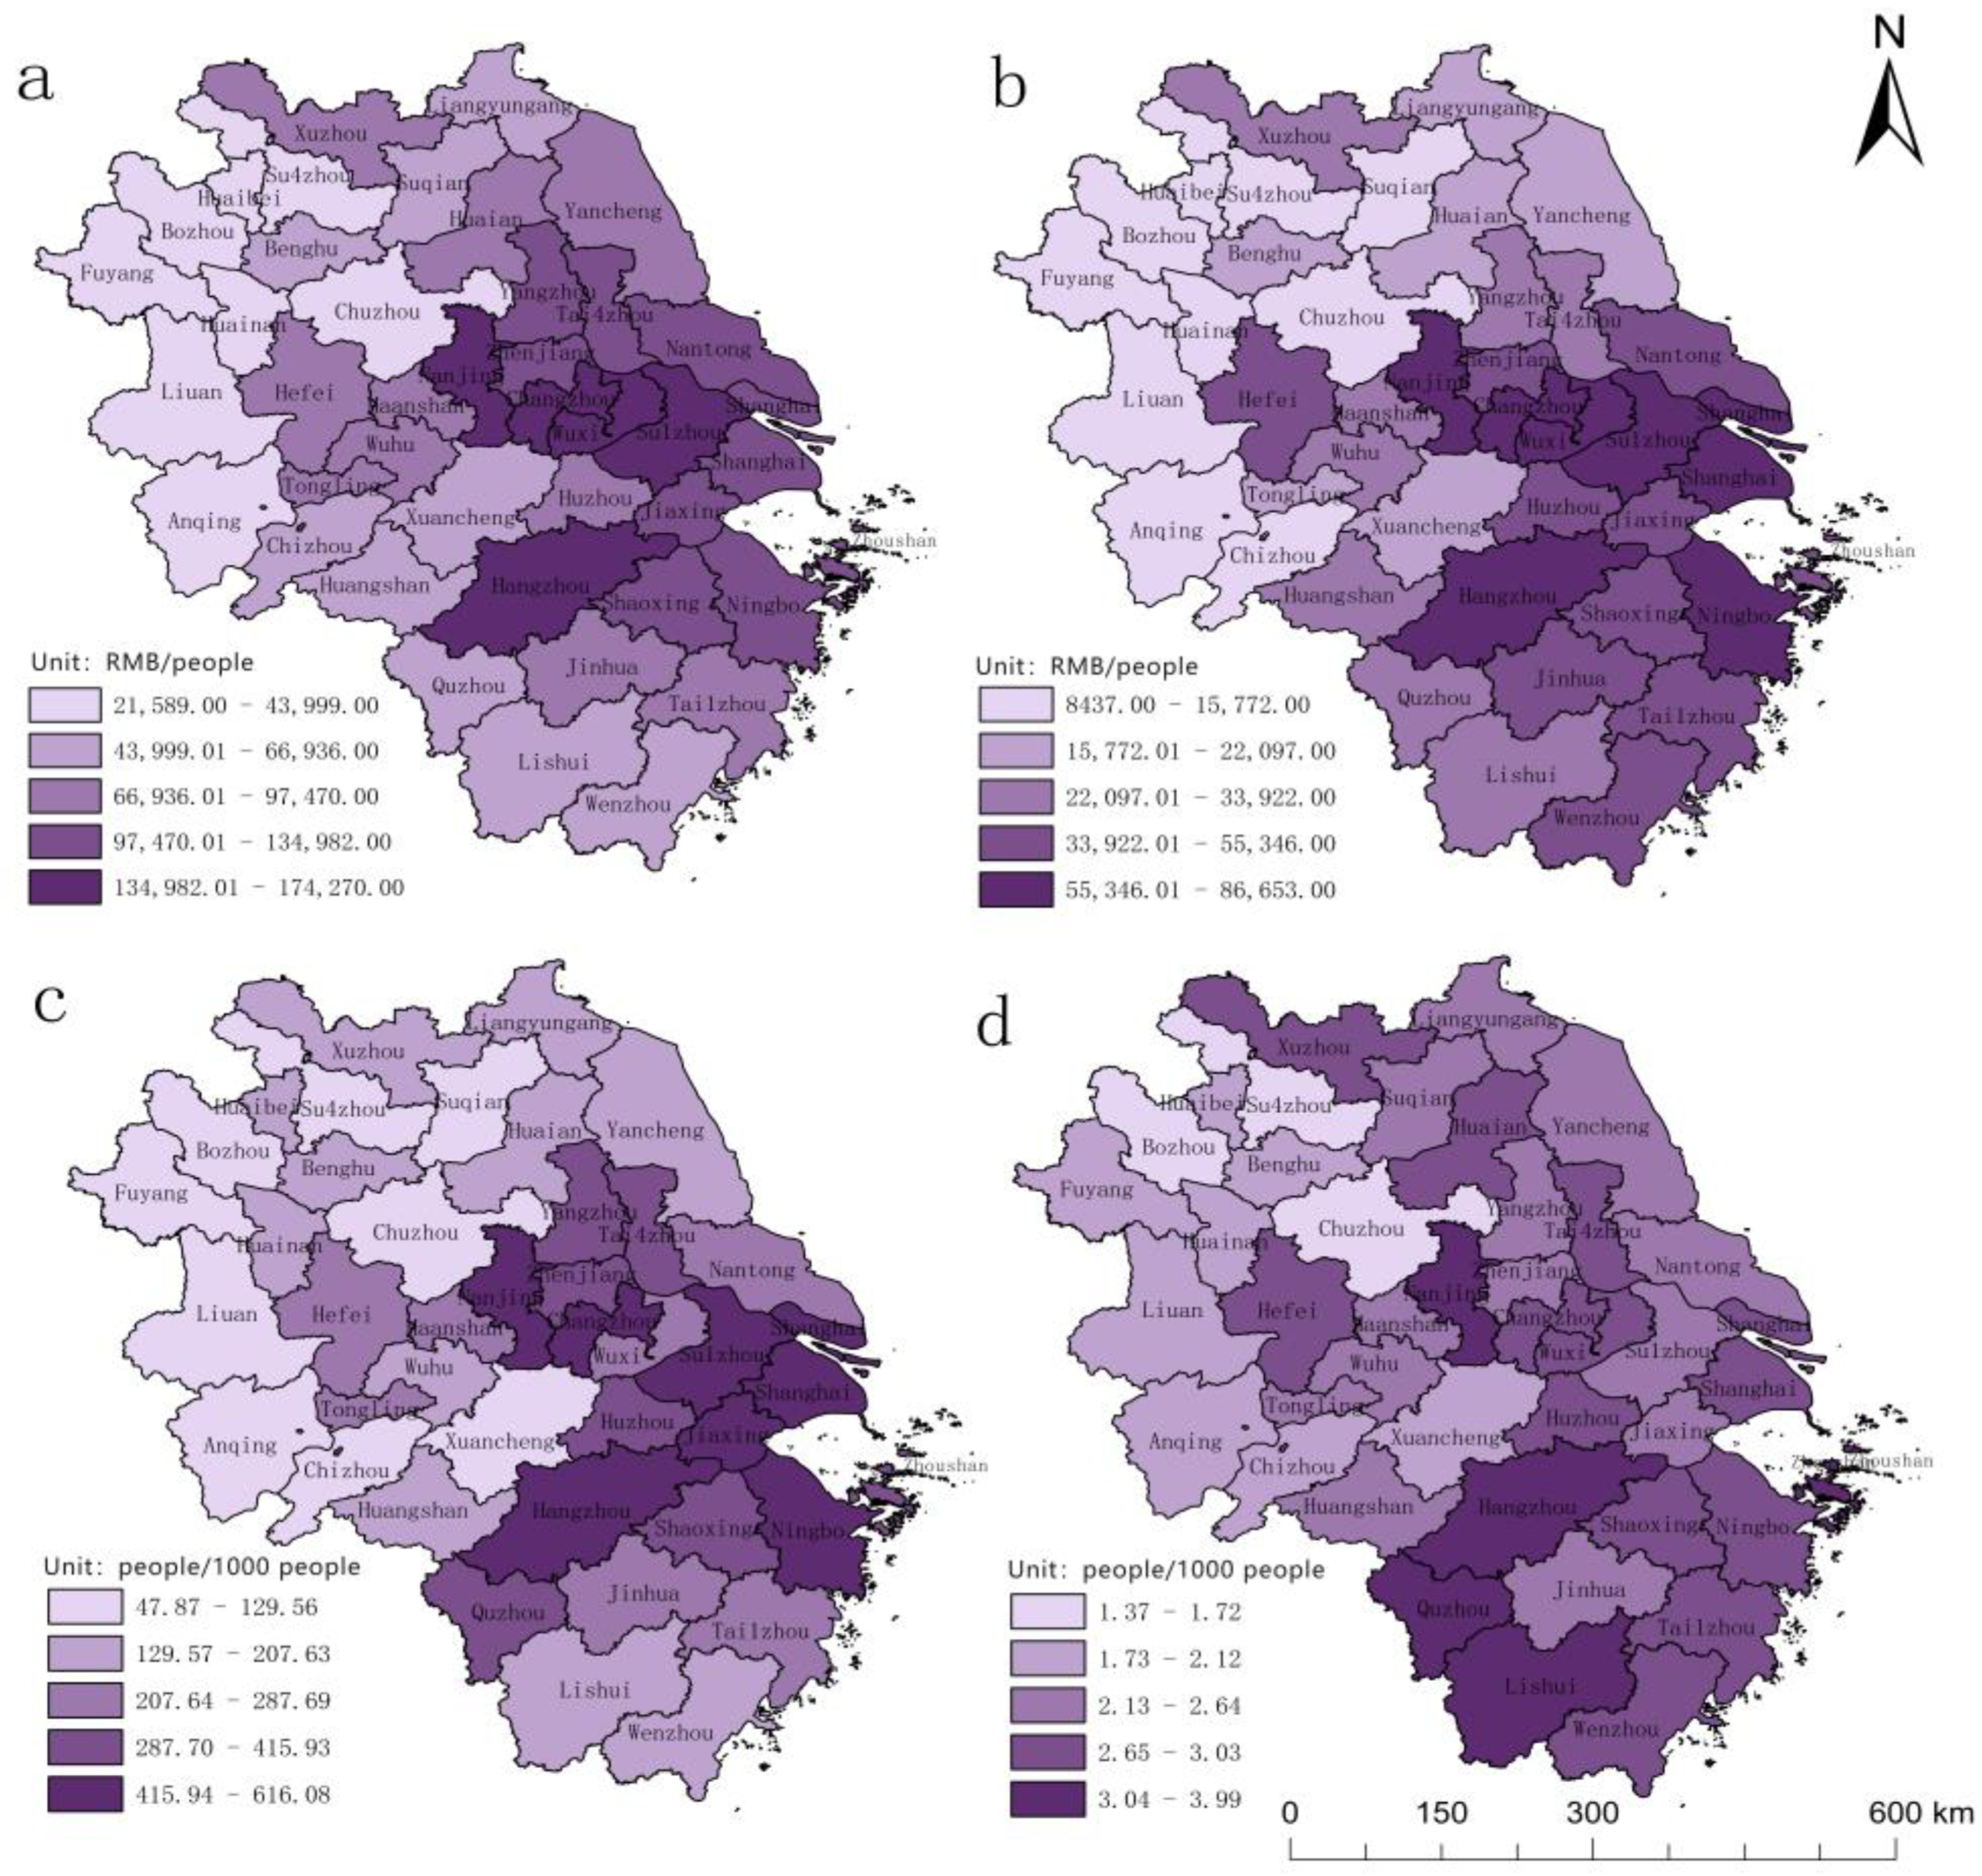
3.3. Socioeconomic Conditions of the Cities in the YRDUA

Detailed values of the socioeconomic conditions across these cities in the YRDUA are listed in Table S2. The population of the YRDUA reached 233.52 million, with 9559 km2 of urban built-up land and an RMB 21,854.18 billion GDP. Shanghai is the largest city with the largest population and the highest GDP. The highest GDP per capita was found in Wuxi, Jiangsu (174.27 thousand RMB), and the lowest was in Fuyang, Anhui (21.59 thousand RMB) (Figure 6a). Consumption expenditure per capita (CEpc) indirectly represents personal wealth. The highest CEpc was found in Shanghai (RMB 86.66 thousand), and the lowest was found in Suzhou, Anhui (RMB 8.44 thousand) (Figure 6b).
The number of participants with basic medical insurance, hospital beds, and registered doctors represented cities’ public health levels. Public willingness to participate in medical insurance was high in the east and low in the west (Figure 6c). The number of participants in the cities of Anhui Province was lower than those in Shanghai, Zhejiang, and Jiangsu Provinces. However, medical resources such as hospital beds and doctors did not show a regular spatial pattern (Figure 6d). The capital cities of every province and the richest cities had more medical resources.

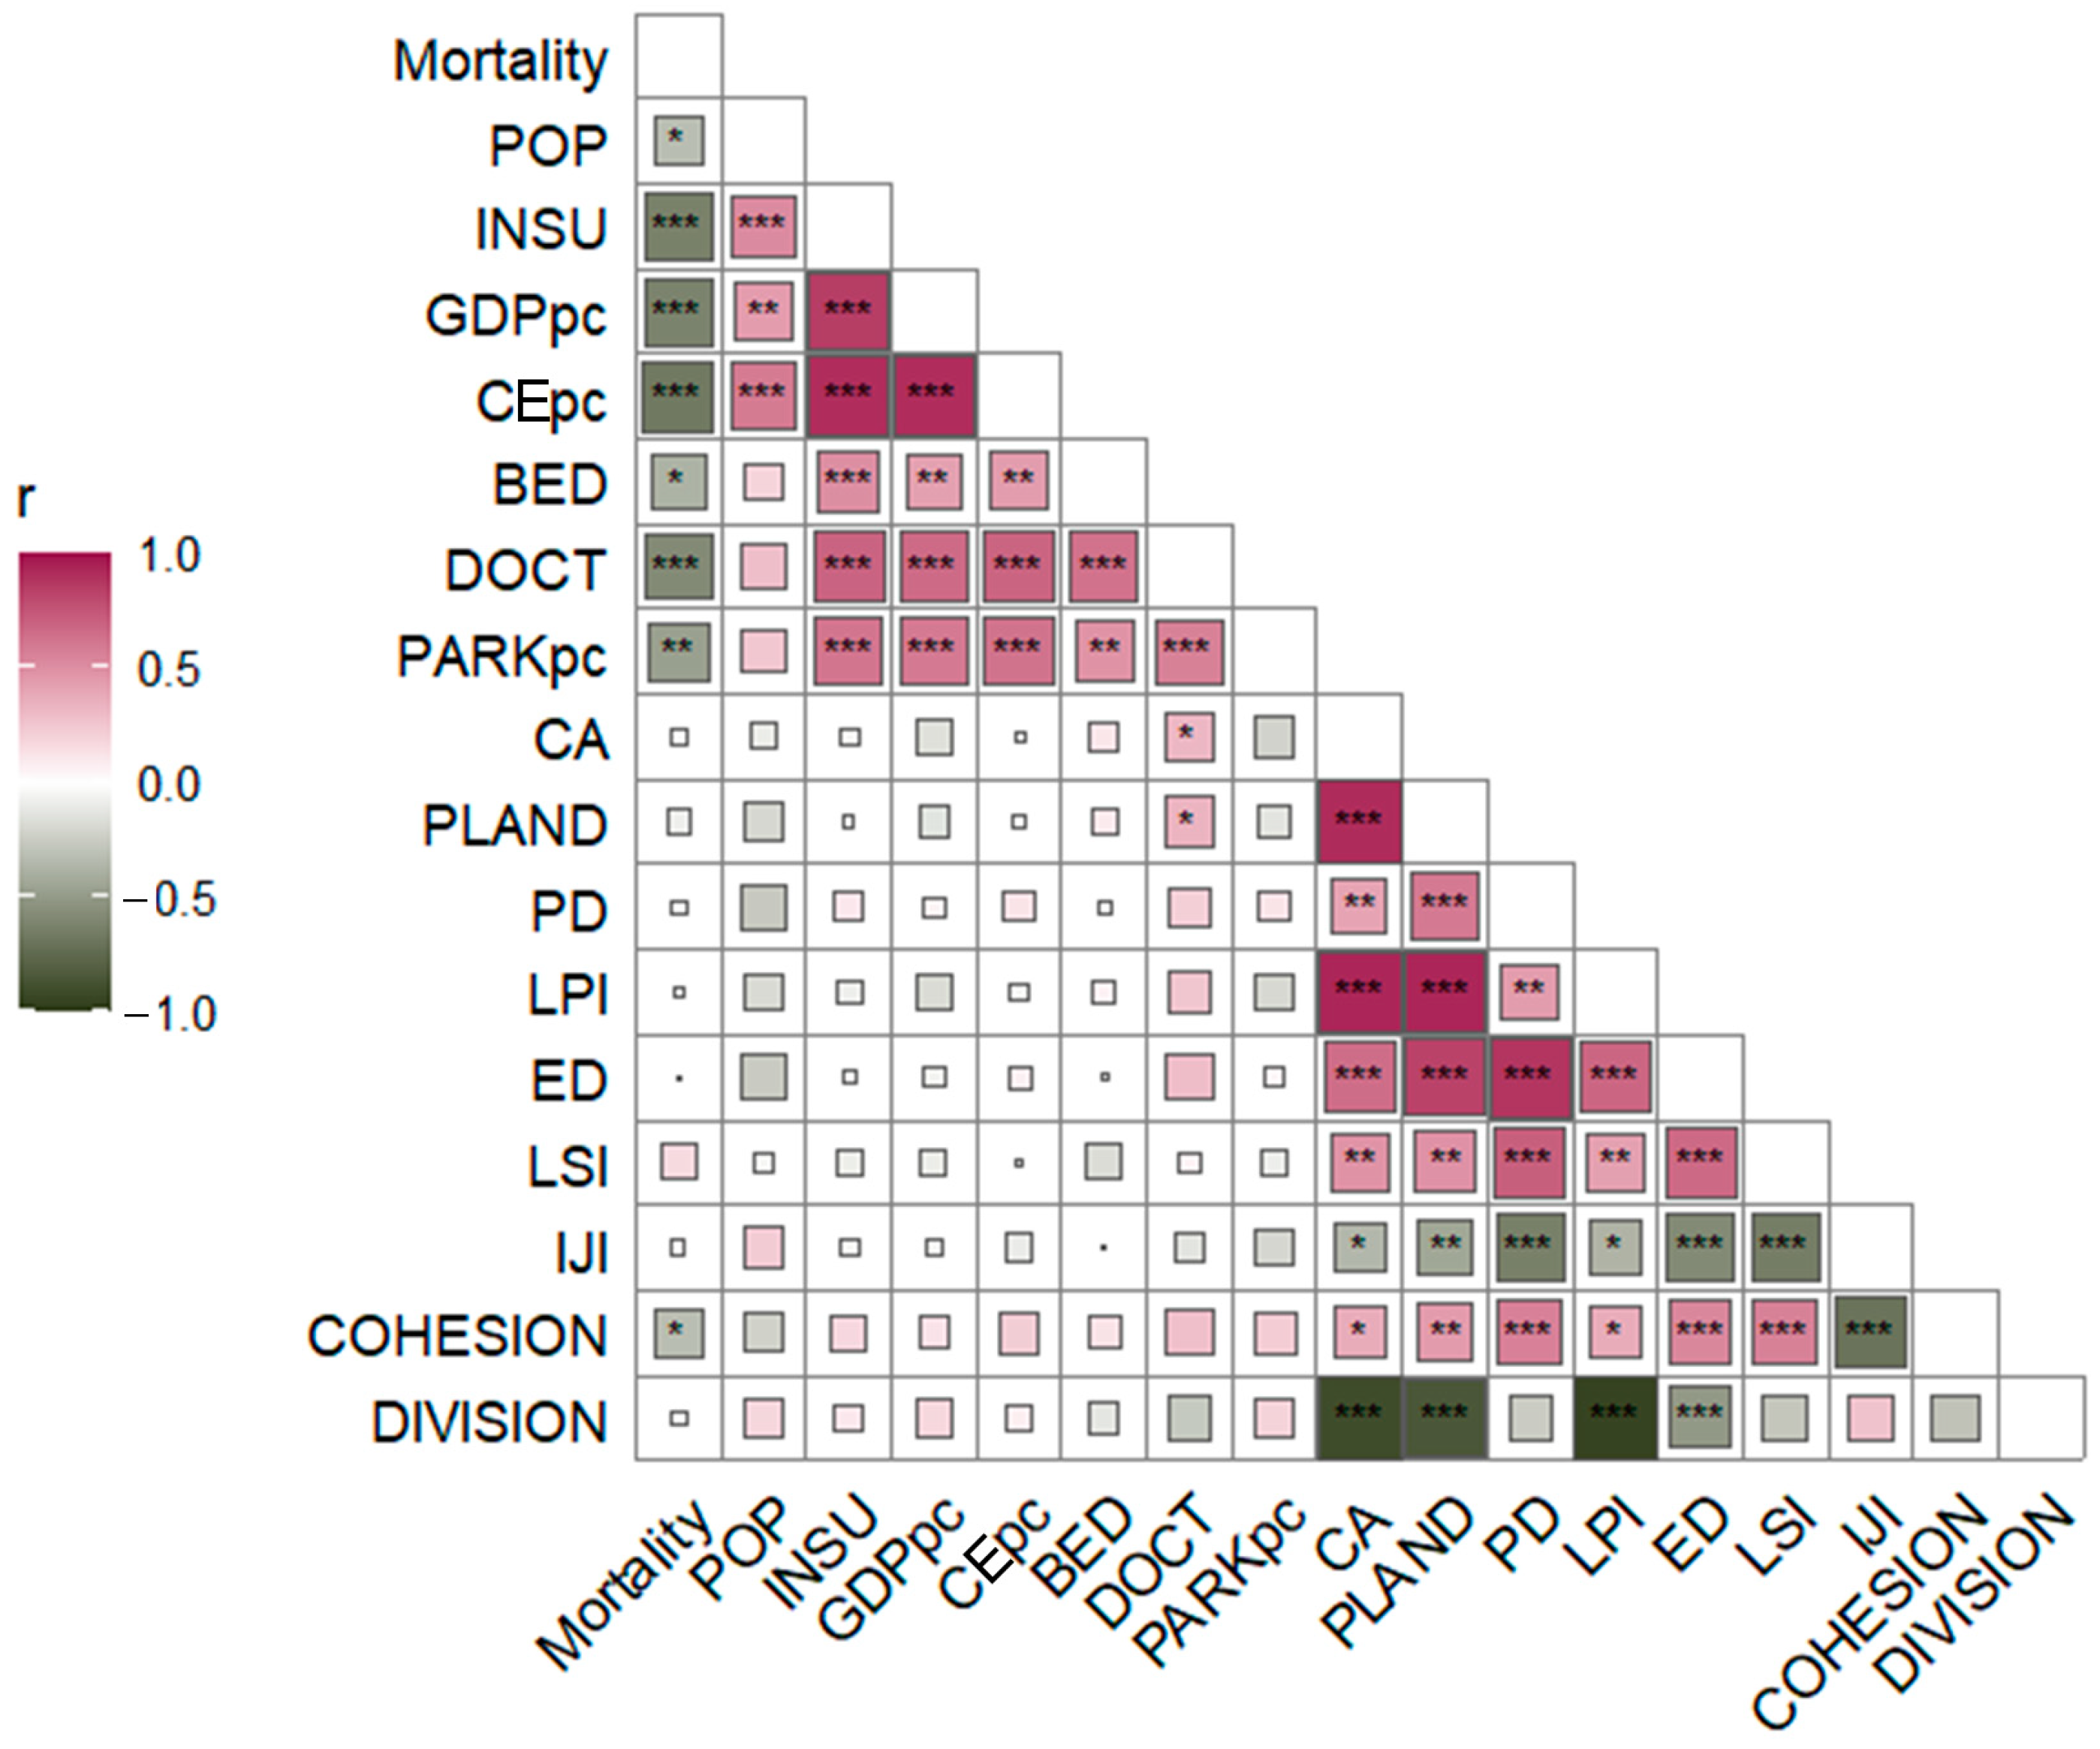
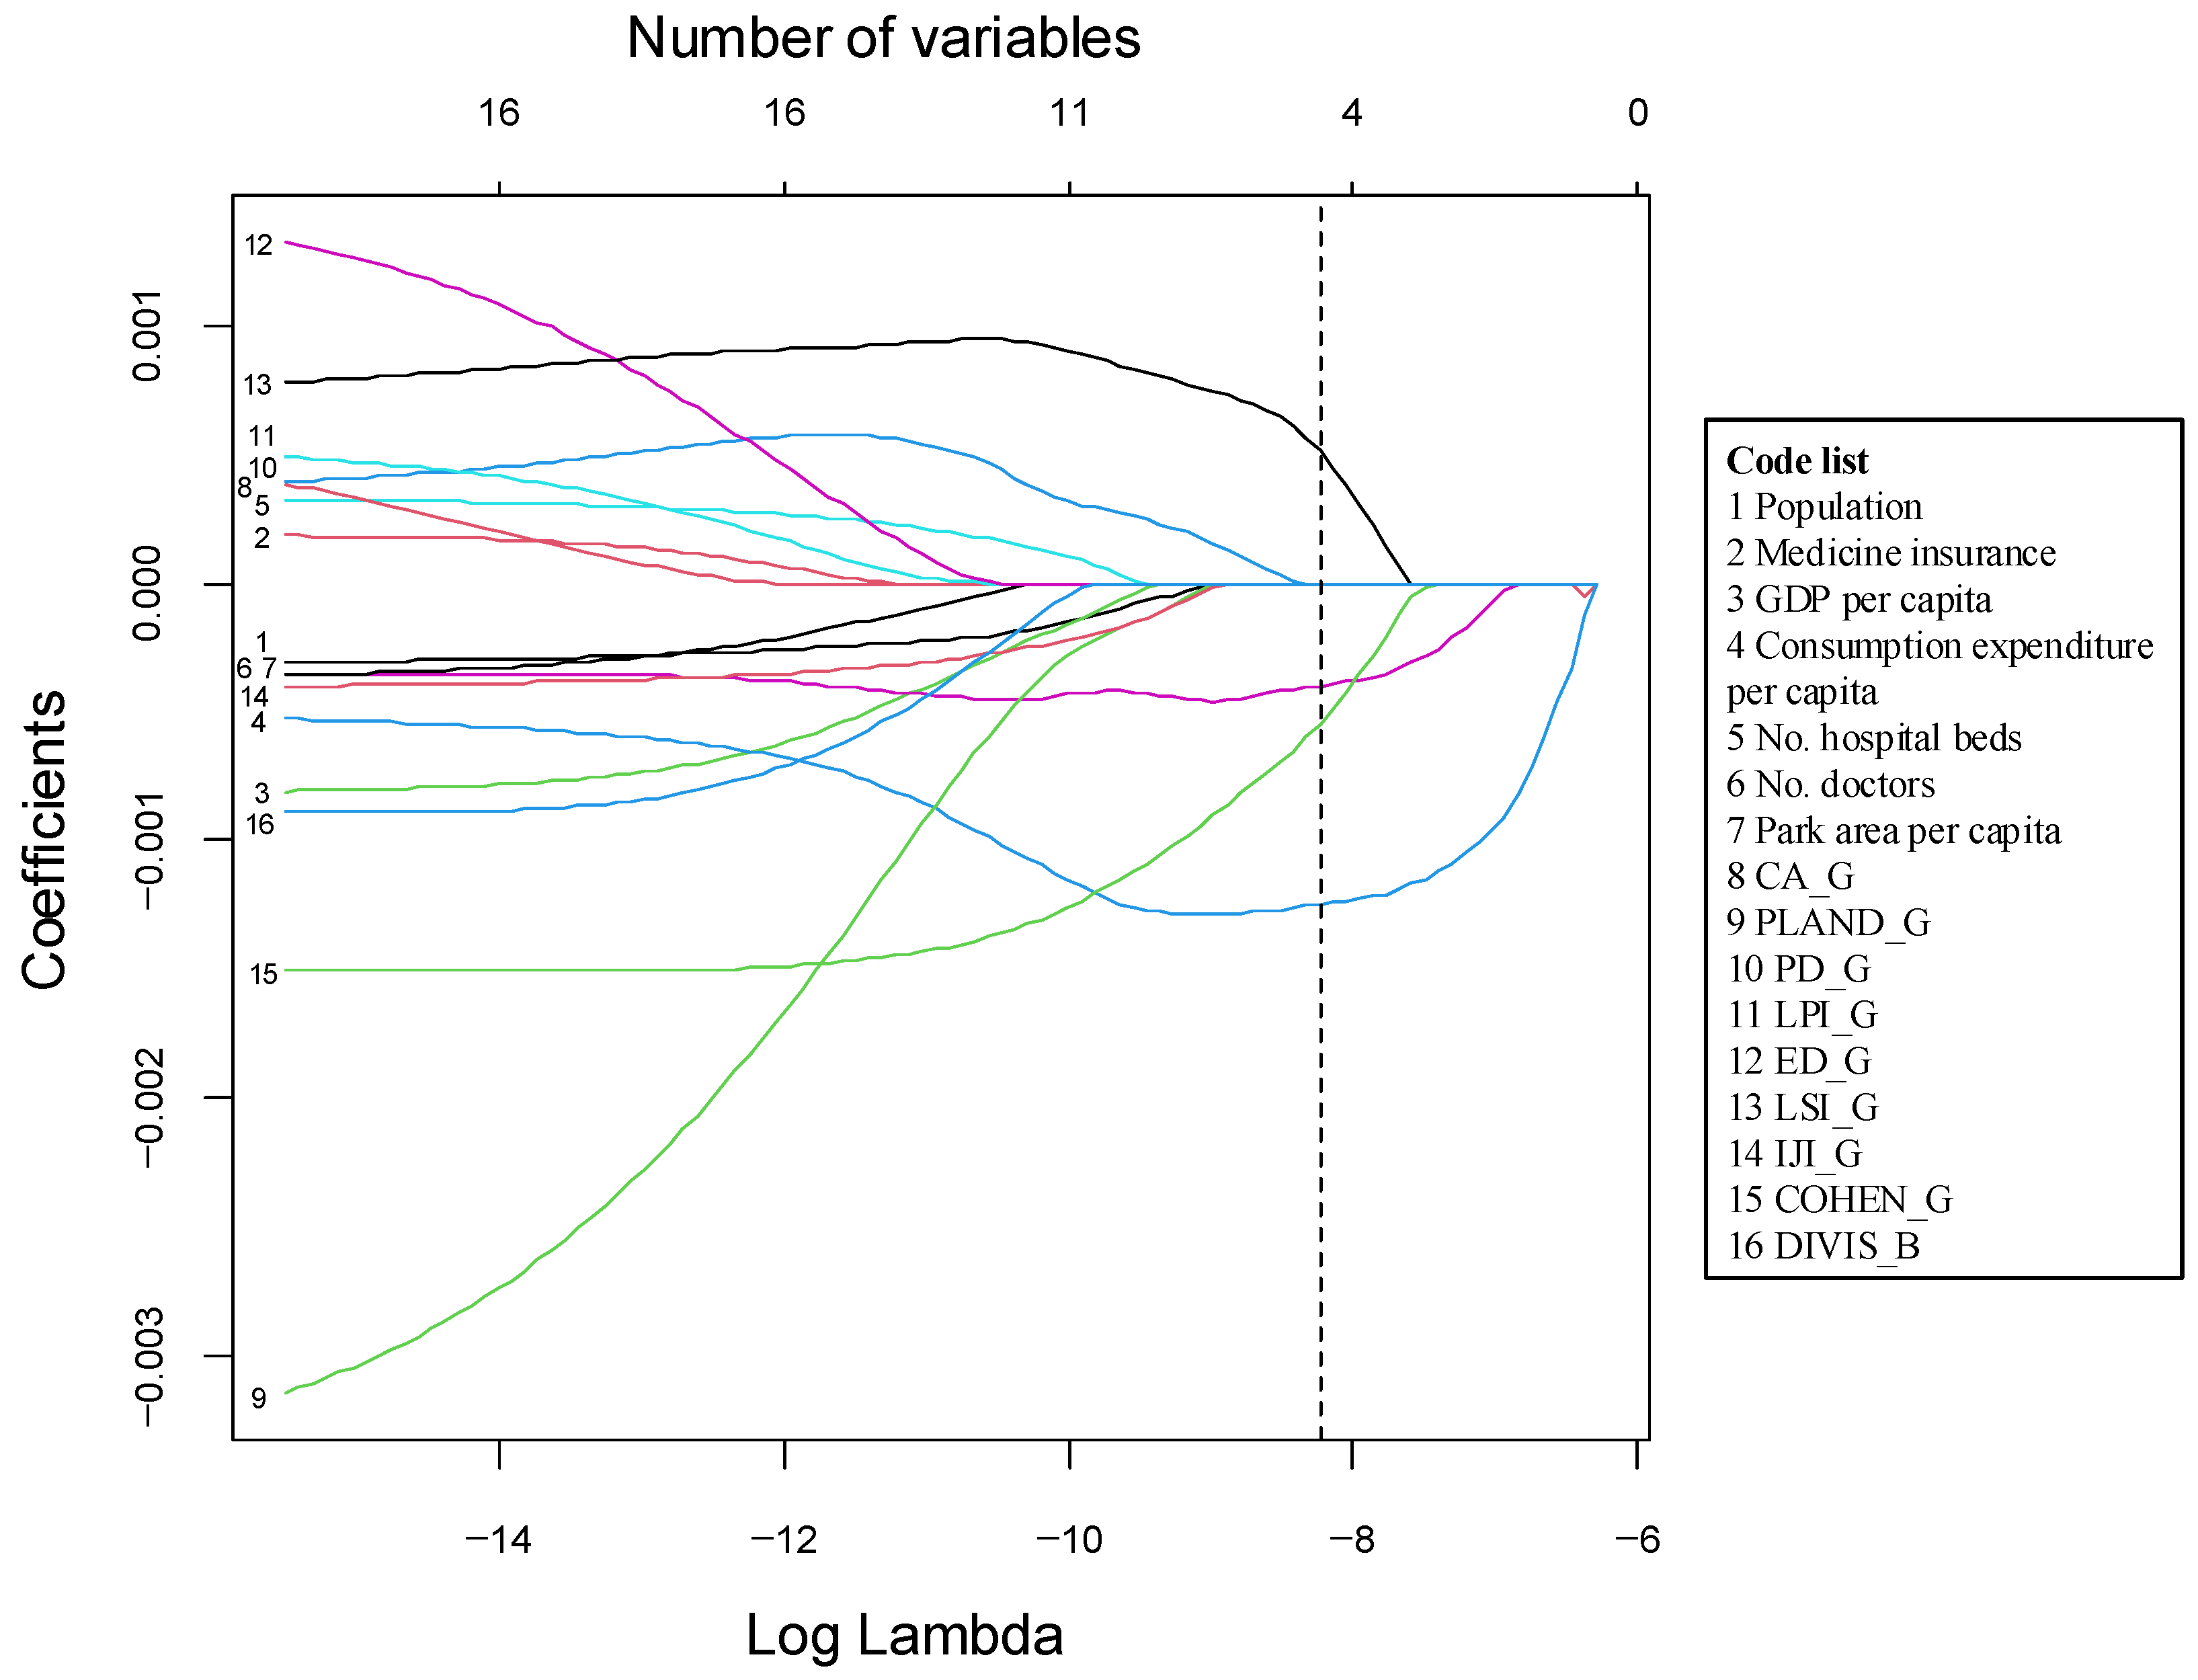
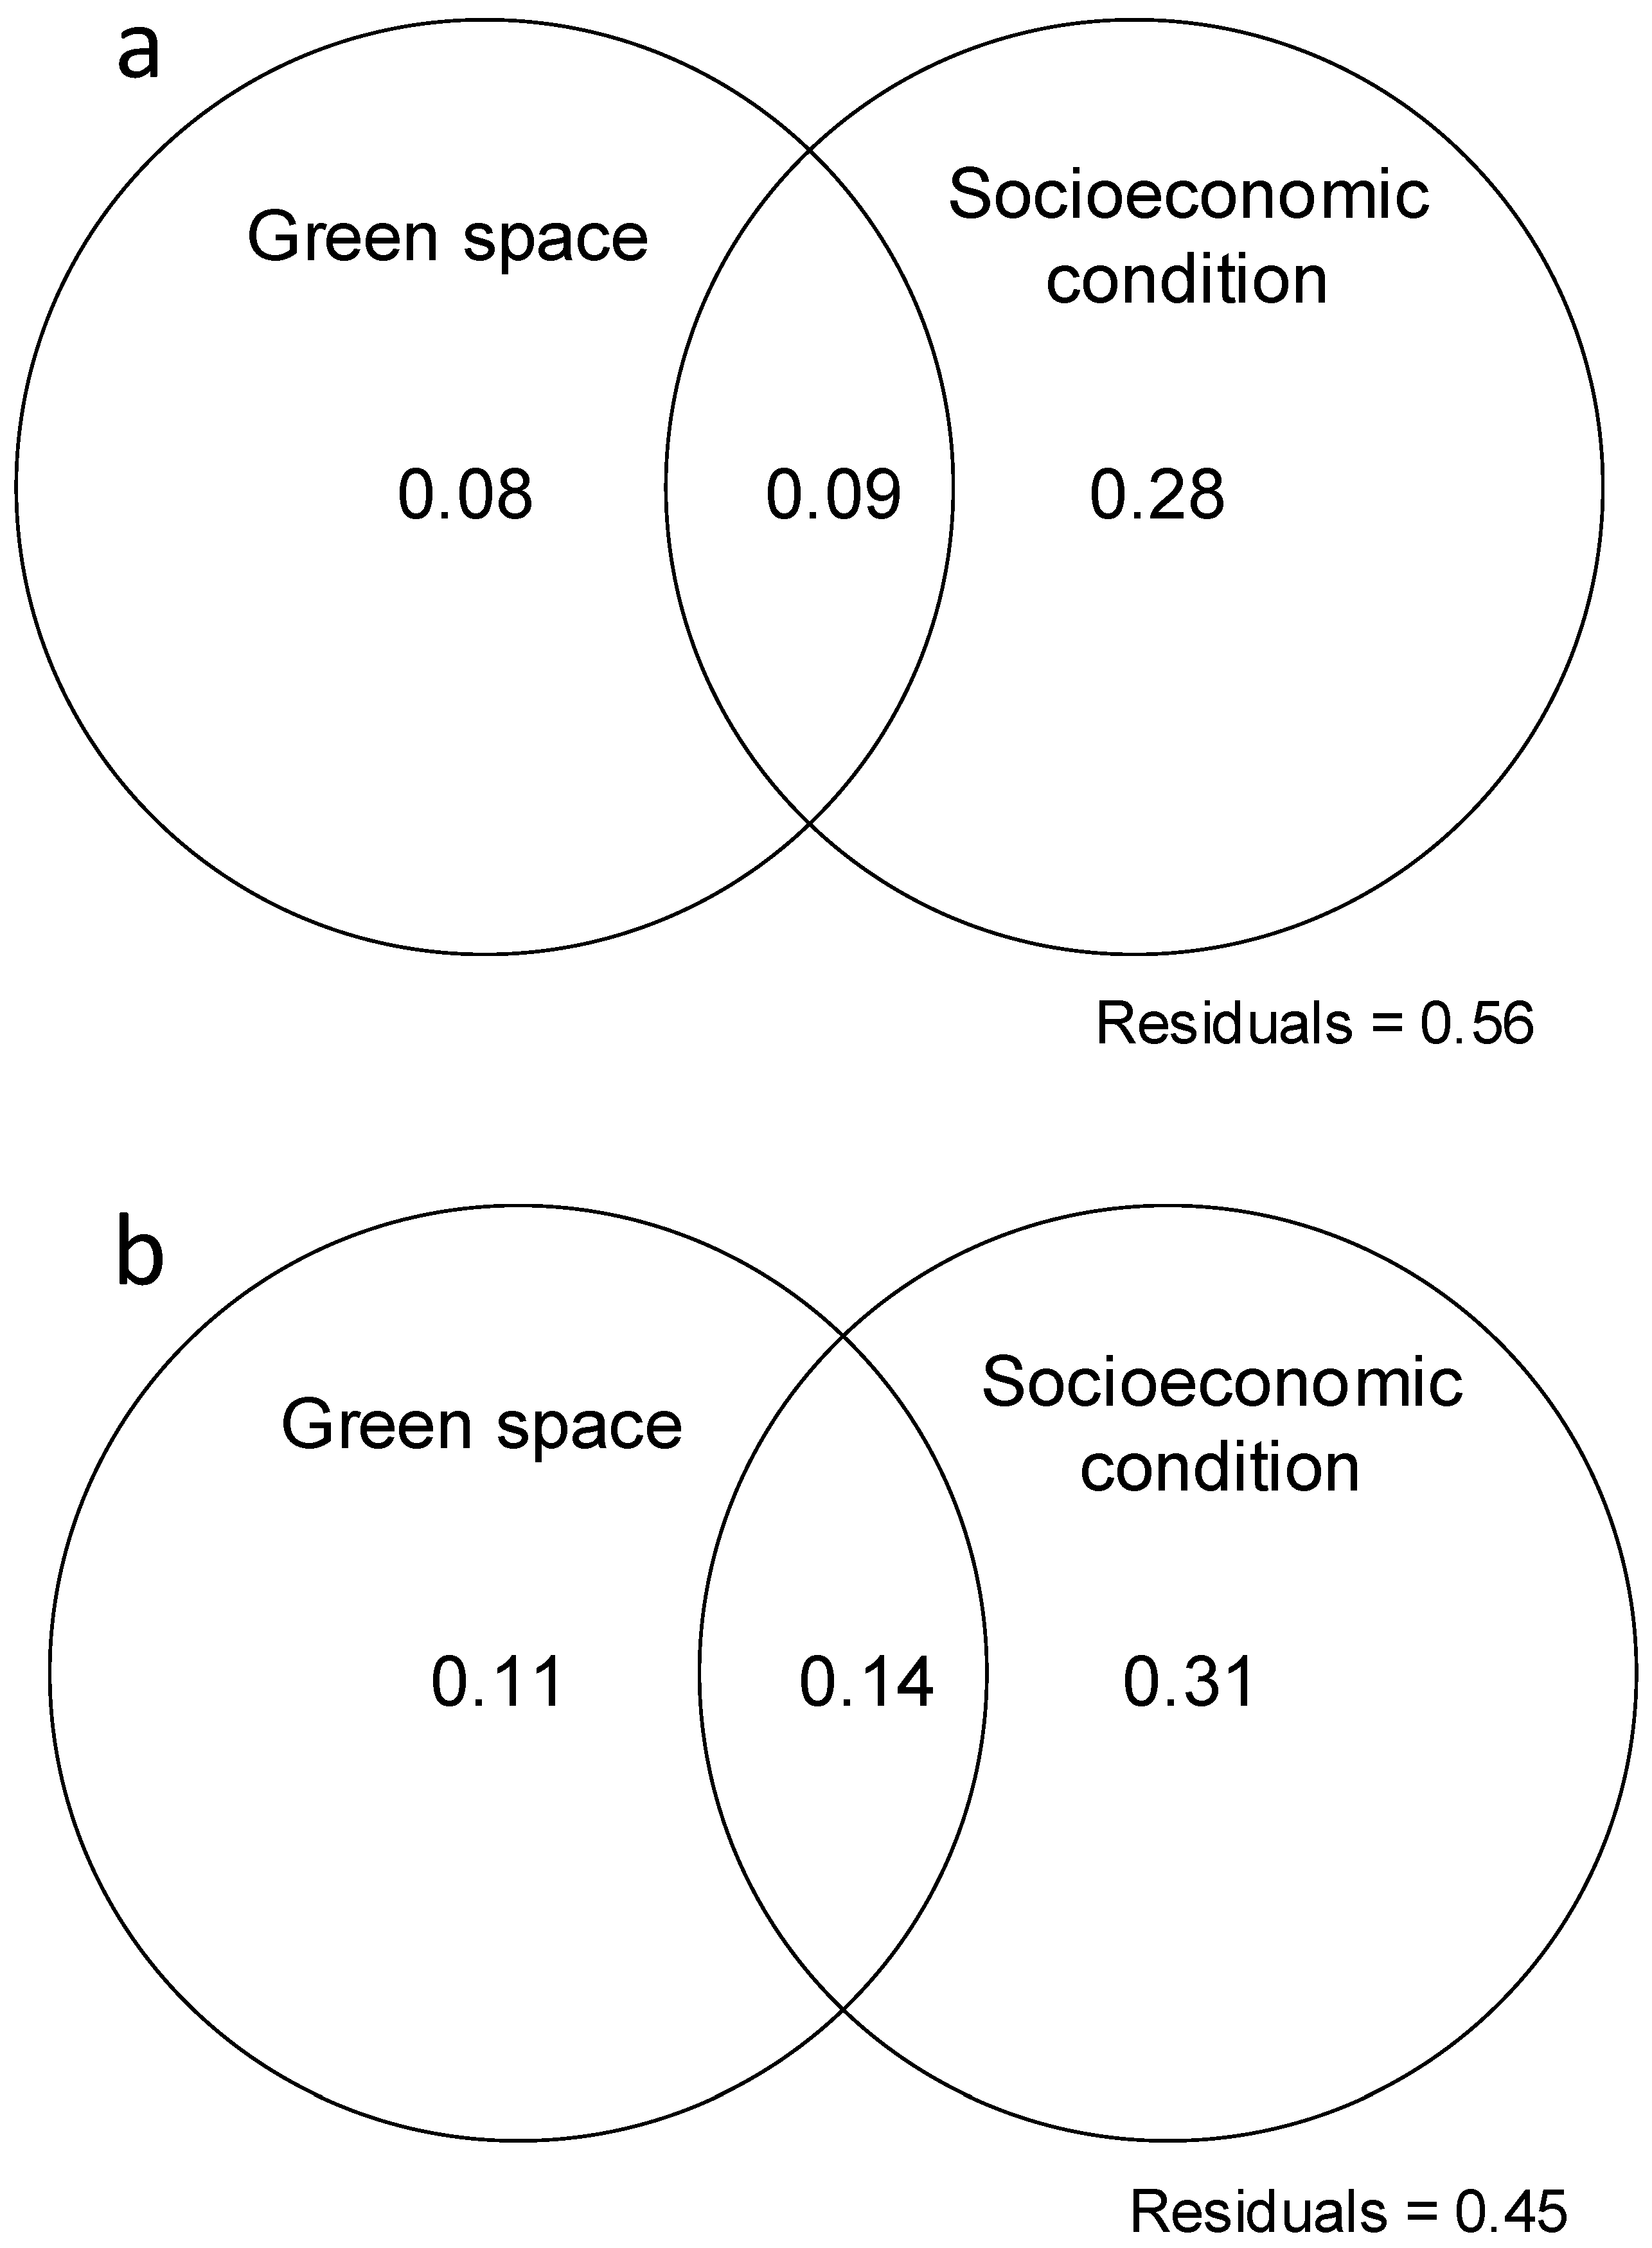
3.4. Effects of GS Attributes and Socioeconomic Conditions

Pearson’s correlation analysis showed that socioeconomic variables were strongly negatively correlated with all-cause mortality; however, only a few GS variables worked (Figure 7). Socioeconomic variables were also positively correlated with each other but were less correlated with GS attributes.
After standardization of the 16 variables, we constructed the original GLM involving socioeconomic and GS variables. To avoid the influence of collinearity between these variables, LASSO regression was applied to select the relevant variables driving all-cause mortality in the cities in the YRDUA for subsequent analysis (Figure 8). The final optimized GLM model contained two socioeconomic variables and two GS variables: CEpc, DOCT, LSI, and COHESION (Table 3). CEpc and COHESION had significant negative effects on all-cause mortality, whereas LSI had a significant positive effect. The DOCT effect was not statistically significant in the final model. Compared with the original model involving all 16 variables (Figure 9a), the relative contributions of socioeconomic factors and GS increased in the optimal models, as well as the overall explanatory power (Figure 9b). Socioeconomic conditions were the dominant drivers of all-cause mortality (31% independent and 14% joint contributions), as was our expectation. However, GS also played an important role in all-cause mortality (11% independent and 14% joint contributions).

4. Discussion

The longitudinal studies in the US, Canada, Australia, Spain, and Italy all found that the high-quality GS reduced local mortalities [26,27,28,29,30]. Based on studies that included 41 cities in the YRDUA, the richest region in China, we found lower mortality in cities with high connective GS and richer residents. These results suggest that reasonable GS policies and planning strategies to increase GS connectivity are effective approaches for improving public health.

4.1. Spatial Pattern of Mortality in the YRDUA

There was obvious spatial variation in all-cause mortality in the YRDUA. The southern region had a lower health risk than the northern region. This spatial heterogeneity may be because of differences in lifestyles, socioeconomic conditions, and environmental quality. A light diet with more seafood and vegetables in southern cities decreased the risk of cardiovascular disease [31]. Better economic and social development provide more nutrients, diverse foods, and sufficient medical resources. Because of the variation in topography, there were more forests in the southern cities and more croplands in the north. Forests provide better ecosystem services, such as purified air and water pollution, and regulate the climate, which improves local environmental quality [32].

4.2. Personal Wealth Is Strongly Correlated with Mortality

Socioeconomic conditions were the dominant factors influencing all-cause mortality in the cities in the YRDUA. In our study, consumption expenditure per capita, representing personal wealth, was found to drive city-level mortality. A study covering 12 provinces in China supported that the resident groups with low individual-level integrated socioeconomic status had a 65% higher risk of all-cause mortality [33]. High-income residents were willing to perform physical exercise, live in greener habitats, and prefer a healthy diet and lifestyle. They also have easy access to better medical and healthcare resources. Most low-income families cannot afford long-term medications for chronic diseases, such as cardiovascular diseases. Based on this finding, the development of targeted policies should be encouraged to improve healthcare accessibility, equally benefit people, and reduce the mortality of cardiovascular disease and cancer in people with low incomes [11], especially in Anhui Province, the western part of the YRDUA. Some studies have also reported that regional-level socioeconomic conditions such as medical resources [34] and GDP [35] had no significant effects in our study. The YRDUA is the most urbanized region in China, with a well-established transportation infrastructure [36]. People living in small cities and towns easily share the abundant medical resources of the surrounding large cities. However, the cities in the YRDUA are better developed than most others in China [15], although there are economic gaps between them. Public health is less limited by urban development in the YRDUA. We speculate that the sharing of medical resources and the high level of development weakened the effects of city-level socioeconomic variations.

4.3. Landscape Configuration of GS Affected Mortality

Our results also showed that GS played an important role in all-cause mortality, although personal-level socioeconomic conditions were the dominant drivers. In previous studies, most GS indices, such as the amount, NDVI, accessibility, and area ratio, were related to mortality [10,37,38]. Beyond our expectations, we found that the indices of landscape configuration, LSI, and COHESION were more important for all-cause mortality than landscape composition in the YRDUA.
A higher LSI increases the health risk caused by GS overexposure. The complex boundary of the GS increases the interface between the natural and human worlds, introducing more negative effects in human society, such as epidemic pathogens, allergens, and wild animal attacks. A higher LSI indicates intense GS fragmentation. The fragmented GS patches are too small to provide sufficient ecosystem services and health benefits [39].
The COHESION values negatively correlated with all-cause mortality. Higher GS connectivity leads to a lower risk of all-cause mortality, which is also consistent with the finding of stronger fragmentation of GS associated with poor health in the Taipei metropolitan area because of the GS replacement by heavy industry [40]. A study of US cities also found that neighborhoods with more aggregated GS morphologies had a lower prevalence of non-communicable diseases [41]. More connected GS forms a GS network that provides more ecological services, such as improving air quality, reducing the heat island effect, and increasing opportunities for outdoor activities and social communication, which, in turn, improves physical and mental health [42]. Larger connected GSs also provide sufficient space for thematic events and exhibitions to attract residents.
Some previous case studies reported the importance of the amount of GS for urban public health and mortality at the neighborhood scale [10]. In our studies, the CA and PLAND of GS, which represented GS amount, were not found to be significantly correlated with city-scale mortality in the YRDUA. We speculated that the users of large integrated parks and country parks, such as the Hangzhou Westlake Scenic Area, are mainly from outside of this region, which provided less health benefits to local residents. Another reason is that the large and dense GS would reduce the willingness of local users to physically exercise, especially single visitors who consider potential criminal risks [43,44]. European studies also supported that neighboring GS was better for the health of local residents than the total GS amount in the city, and reduced the natural-cause and suicide mortality [45,46].

4.4. Study Limitations

Although all-cause mortality was the most accurate, objective, and accessible data for urban public health measures, the effect of green space on its components, such as cardiovascular mortality, cancer mortality, infectious disease mortality, or accidental mortality varied widely. How to distinguish the specific effects of green space on different causes of death is a key question for urban public health management that was not answered in the study. A long-term longitudinal social survey is necessary to investigate this issue [47]. Another limitation was that the study did not consider non-fatal health risks, such as subhealth conditions, mental illness, and chronic diseases. These non-fatal health risks are more prevalent in the public but are difficult to identify and measure. Large-scale demographic and health censuses [10] and international and interdisciplinary collaborations [7,11] will illustrate the detailed effects of green space on overall public health.

5. Conclusions

The present study of the cities in the YRDUA found that the all-cause mortality showed a spatial pattern of “high in the south and low in the north”. Socioeconomic conditions and GS jointly affect all-cause mortality. Regarding socioeconomic conditions, people with greater personal wealth had fewer health risks. Regarding the health effects of GSs, regularly shaped and connected GSs would decrease the risk to public health. Based on these findings, we suggest that public health policies consider the equity of healthcare resources when caring for poor families in cities. The construction of a GS network should also be included in urban planning.

Supplementary Materials

The following supporting information can be downloaded at: https://www.mdpi.com/article/10.3390/f15061066/s1, Table S1: Details of landscape attributes of green space of the cities in the YRDUA; Table S2: Details of socioeconomic condition of the cities in the YURDA.

Author Contributions

Conceptualization, Y.W. and G.H.; Methodology, M.L. and G.H.; Validation, G.H.; Formal analysis, M.L. and G.H.; Resources, Y.W. and G.H.; Data curation, M.L.; Writing—original draft preparation, M.L.; Writing—review and editing, M.L., Y.W. and G.H.; Visualization, M.L. and G.H.; Supervision, G.H.; Project administration, G.H.; Funding acquisition, Y.W. and G.H. All authors have read and agreed to the published version of the manuscript.

Funding

This work was supported by the National Natural Science Foundation of China (32171570), the Medical Science and Technology Project of Zhejiang Province (2023KY1002), and the Hangzhou Key Medicine Discipline Fund for Hygienic Microbiology Laboratory.

Data Availability Statement

The datasets used in this study are available in open databases listed in the article.

Acknowledgments

We are particularly grateful to the editor and reviewers for their valuable comments on this manuscript. The authors thank the graduate students in Landscape Architecture from Zhejiang Sci-Tech University for their assistance with data collection.

Conflicts of Interest

The authors declare no conflicts of interest.

References

  1. United Nations. World Population Prospects 2022, 1 July 2022. Available online: https://population.un.org/wpp (accessed on 15 March 2024).
  2. Lu, Z.N.; Chen, H.Y.; Hao, Y.; Wang, J.Y.; Song, X.J.; Mok, T.M. The dynamic relationship between environmental pollution, economic development and public health: Evidence from China. J. Clean. Prod. 2017, 166, 134–147. [Google Scholar] [CrossRef]
  3. Zhao, X.Y.; Wang, W.J.; Wan, W.Y. Regional differences in the health status of Chinese residents: 2003–2013. J. Geogr. Sci. 2018, 28, 741–758. [Google Scholar] [CrossRef]
  4. Zhang, Y.B.; Li, Y.; Geng, T.T.; Pan, X.F.; Zhou, Y.F.; Liu, G.; Pan, A. Overall lifestyles and socioeconomic inequity in mortality and life expectancy in China: The China health and nutrition survey. Age Ageing 2022, 51, afac167. [Google Scholar] [CrossRef] [PubMed]
  5. Nieuwenhuijsen, M.J.; Khreis, H.; Verlinghieri, E.; Mueller, N.; Rojas-Rueda, D. Participatory quantitative health impact assessment of urban and transport planning in cities: A review and research needs. Environ. Int. 2017, 103, 61–72. [Google Scholar] [CrossRef] [PubMed]
  6. Kondo, M.C.; Fluehr, J.M.; McKeon, T.; Branas, C.C. Urban green space and its impact on human health. Int. J. Environ. Res. Public Health 2018, 15, 445. [Google Scholar] [CrossRef] [PubMed]
  7. Sandifer, P.A.; Sutton-Grier, A.E.; Ward, B.P. Exploring connections among nature, biodiversity, ecosystem services, and human health and well-being: Opportunities to enhance health and biodiversity conservation. Ecosyst. Serv. 2015, 12, 1–15. [Google Scholar] [CrossRef]
  8. Azmy, M.M.; Hosaka, T.; Numata, S. Responses of four hornet species to levels of urban greenness in Nagoya city, Japan: Implications for ecosystem disservices of urban green spaces. Urban. For. Urban. Green. 2016, 18, 117–125. [Google Scholar] [CrossRef]
  9. Lõhmus, M.; Balbus, J. Making green infrastructure healthier infrastructure. Infect. Ecol. Epidemiol. 2015, 5, 30082. [Google Scholar] [CrossRef] [PubMed]
  10. Rojas-Rueda, D.; Nieuwenhuijsen, M.J.; Gascon, M.; Perez-Leon, D.; Mudu, P. Green spaces and mortality: A systematic review and meta-analysis of cohort studies. Lancet Planet. Health 2019, 3, e469–e477. [Google Scholar] [CrossRef]
  11. Wolch, J.R.; Byrne, J.; Newell, J.P. Urban green space, public health and environmental justice: The challenge of making cities “just green enough”. Landsc. Urban. Plan. 2014, 125, 234–244. [Google Scholar] [CrossRef]
  12. Felici, A.; Peduzzi, G.; Giorgolo, F.; Spinelli, A.; Calderisi, M.; Monreale, A.; Farinella, R.; Pellungrini, R.; Canzian, F.; Campa, D. The local environment and germline genetic variation predict cancer risk in the UK Biobank prospective cohort. Environ. Res. 2024, 241, 117562. [Google Scholar] [CrossRef] [PubMed]
  13. Aerts, R.; Stas, M.; Vanlessen, N.; Hendrickx, M.; Bruffaerts, N.; Hoebeke, L.; Dendoncker, N.; Dujardin, S.; Saenen, N.D.; Van Nieuwenhuyse, A.; et al. Residential green space and seasonal distress in a cohort of tree pollen allergy patients. Int. J. Hyg. Environ. Health 2020, 223, 71–79. [Google Scholar] [CrossRef]
  14. Markevych, I.; Schoierer, J.; Hartig, T.; Chudnovsky, A.; Hystad, P.; Dzhambov, A.M.; de Vries, S.; Triguero-Mas, M.; Brauer, M.; Nieuwenhuijsen, M.J.; et al. Exploring pathways linking greenspace to health: Theoretical and methodological guidance. Environ. Res. 2017, 158, 301–317. [Google Scholar] [CrossRef] [PubMed]
  15. Chen, R.; Cui, X.; Lei, Y. Coordination analysis of urban forest and urban development level: A case study of the Yangtze River Delta urban agglomeration, China. Sustainability 2023, 15, 15165. [Google Scholar] [CrossRef]
  16. National Health Commission of PRC. China Health Statistics Yearbook; Peking Union Medical College Press: Beijing, China, 2021. [Google Scholar]
  17. Ng, E.; Chen, L.; Wang, Y.; Yuan, C. A study on the cooling effects of greening in a high-density city: An experience from Hong Kong. Build. Environ. 2012, 47, 256–271. [Google Scholar] [CrossRef]
  18. Yuan, C.; Shan, R.; Zhang, Y.; Li, X.-X.; Yin, T.; Hang, J.; Norford, L. Multilayer urban canopy modelling and mapping for traffic pollutant dispersion at high density urban areas. Sci. Total Environ. 2019, 647, 255–267. [Google Scholar] [CrossRef] [PubMed]
  19. Astell-Burt, T.; Feng, X. Does sleep grow on trees? A longitudinal study to investigate potential prevention of insufficient sleep with different types of urban green space. SSM Popul. Health 2020, 10, 100497. [Google Scholar] [CrossRef]
  20. Harris, V.; Kendal, D.; Hahs, A.K.; Threlfall, C.G. Green space context and vegetation complexity shape people’s preferences for urban public parks and residential gardens. Landsc. Res. 2018, 43, 150–162. [Google Scholar] [CrossRef]
  21. Holtan, M.T.; Dieterlen, S.L.; Sullivan, W.C. Social life under cover: Tree canopy and social capital in Baltimore, Maryland. Environ. Behav. 2015, 47, 502–525. [Google Scholar] [CrossRef]
  22. Yang, J.; Huang, X. The 30 m annual land cover dataset and its dynamics in China from 1990 to 2019. Earth Syst. Sci. Data 2021, 13, 3907–3925. [Google Scholar] [CrossRef]
  23. Friedman, J.; Hastie, T.; Tibshirani, R. Regularization paths for generalized linear models via coordinate descent. J. Stat. Softw. 2010, 33, 1–22. [Google Scholar] [CrossRef] [PubMed]
  24. Tay, J.K.; Narasimhan, B.; Hastie, T. Elastic net regularization paths for all generalized linear models. J. Stat. Softw. 2023, 106, 1–31. [Google Scholar] [CrossRef] [PubMed]
  25. Legendre, P.; Legendre, L. Numerical Ecology; 3rd English edition; Elsevier Science BV.: Amsterdam, The Netherlands, 2012. [Google Scholar]
  26. Crouse, D.L.; Pinault, L.; Balram, A.; Hystad, P.; Peters, P.A.; Chen, H.; von Donkelaar, A.; Martin, R.V.; Ménard, R.; Robinchaud, A.; et al. Urban greenness and mortality in Canada’s largest cities: A national cohort study. Lancet Planet. Health 2017, 1, e289–e297. [Google Scholar] [CrossRef] [PubMed]
  27. James, P.; Hart, J.E.; Banay, R.F.; Laden, F. Exposure to greenness and mortality in a nationwide prospective cohort study of women. Environ. Health Perspect. 2016, 124, 1344–1352. [Google Scholar] [CrossRef] [PubMed]
  28. Nieuwenhuijsen, M.J.; Gascon, M.; Martinez, D.; Ponjoan, A.; Blanch, J.; Garcia-Gil, M.D.M.; Ramos, R.; Foraster, M.; Mueller, N.; Espinosa, A.; et al. Air pollution, noise, blue space, and green space and premature mortality in Barcelona: A mega cohort. Int. J. Environ. Res. Public Health 2018, 15, 2405. [Google Scholar] [CrossRef] [PubMed]
  29. Zijlema, W.L.; Stasinska, A.; Blake, D.; Dirgawati, M.; Flicker, L.; Yeap, B.B.; Golledge, J.; Hankey, G.J.; Nieuwenhujisen, M.; Heyworth, J. The longitudinal association between natural outdoor environments and mortality in 9218 older men from Perth, Western Australia. Environ. Int. 2019, 125, 430–436. [Google Scholar] [CrossRef] [PubMed]
  30. Orioli, R.; Antonucci, C.; Scortichini, M.; Cerza, F.; Marando, F.; Ancona, C.; Manes, F.; Davoli, M.; Michelozzi, P.; Forastiere, F.; et al. Exposure to residential greenness as a predictor of cause-specific mortality and stroke incidence in the Rome longitudinal study. Environ. Health Perspect. 2019, 127, 27002. [Google Scholar] [CrossRef] [PubMed]
  31. Estruch, R.; Ros, E.; Salas-Salvadó, J.; Covas, M.I.; Corella, D.; Arós, F.; Gómez-Gracia, E.; Ruiz-Gutiérrez, V.; Fiol, M.; Lapetra, J.; et al. Primary prevention of cardiovascular disease with a Mediterranean diet supplemented with extra-virgin olive oil or nuts. N. Engl. J. Med. 2018, 378, e34. [Google Scholar] [CrossRef] [PubMed]
  32. Livesley, S.J.; McPherson, G.M.; Calfapietra, C. The urban forest and ecosystem services: Impacts on urban water, heat, and pollution cycles at the tree, street, and city scale. J. Environ. Qual. 2016, 45, 119–124. [Google Scholar] [CrossRef]
  33. Zhu, Y.; Wang, Y.; Shrikant, B.; Tse, L.A.; Zhao, Y.; Liu, Z.; Wang, C.; Xiang, Q.; Rangarajan, S.; Li, S.; et al. Socioeconomic disparity in mortality and the burden of cardiovascular disease: Analysis of the Prospective Urban Rural Epidemiology (PURE)-China cohort study. Lancet Public Health 2023, 8, e968–e977. [Google Scholar] [CrossRef]
  34. Li, C.C.; Du, Z.C.; Fan, S.J.; Mute Browning, M.H.E.; Knibbs, L.D.; Bloom, M.S.; Zhao, T.Y.; Jalaludin, B.; Heinrich, J.; Liu, X.X.; et al. Association between long-term green space exposure and mortality in China: A difference-in-differences analysis of national data in 2000, 2010 and 2019. Sci. Total Environ. 2023, 887, 164023. [Google Scholar] [CrossRef] [PubMed]
  35. Wang, F.; Liu, S.; Chen, T.; Zhang, H.; Zhang, Y.; Bai, X. How urbanization affects residents’ health risks: Evidence from China. Environ. Sci. Pollut. Res. Int. 2023, 30, 35554–35571. [Google Scholar] [CrossRef]
  36. Wang, F.; Wei, X.; Liu, J.; He, L.; Gao, M. Impact of high-speed rail on population mobility and urbanisation: A case study on Yangtze River Delta urban agglomeration, China. Transp. Res. A 2019, 127, 99–114. [Google Scholar] [CrossRef]
  37. Twohig-Bennett, C.; Jones, A. The health benefits of the great outdoors: A systematic review and meta-analysis of greenspace exposure and health outcomes. Environ. Res. 2018, 166, 628–637. [Google Scholar] [CrossRef] [PubMed]
  38. Gascon, M.; Triguero-Mas, M.; Martínez, D.; Dadvand, P.; Rojas-Rueda, D.; Plasència, A.; Nieuwenhuijsen, M.J. Residential green spaces and mortality: A systematic review. Environ. Int. 2016, 86, 60–67. [Google Scholar] [CrossRef]
  39. Mitchell, M.G.; Suárez-Castro, A.F.; Martínez-Harms, M.J.; Maron, M.; McAlpine, C.A.; Gaston, K.J.; Johansen, K.L.; Rhodes, J.R. Reframing landscape fragmentation’s effects on ecosystem services. Trends Ecol. Evol. 2015, 30, 190–198. [Google Scholar] [CrossRef] [PubMed]
  40. Yeh, C.T.; Cheng, Y.Y.; Liu, T.Y. Spatial characteristics of urban green spaces and human health: An exploratory analysis of canonical correlation. Int. J. Environ. Res. Public Health 2020, 17, 3227. [Google Scholar] [CrossRef] [PubMed]
  41. Wang, H.; Tassinary, L.G. Association between greenspace morphology and prevalence of non-communicable diseases mediated by air pollution and physical activity. Landsc. Urban. Plan. 2024, 242, 10493. [Google Scholar] [CrossRef]
  42. Sugawara, H.; Shimizu, S.; Takahashi, H.; Hagiwara, S.; Narita, K.-I.; Mikami, T.; Hirano, T. Thermal influence of a large green space on a hot urban environment. J. Environ. Qual. 2016, 45, 125–133. [Google Scholar] [CrossRef] [PubMed]
  43. Hu, J.; Wu, J.; Sun, Y.; Zhao, X.; Hu, G. Spatiotemporal influence of urban park landscape features on visitor behavior. Sustainability 2023, 15, 5248. [Google Scholar] [CrossRef]
  44. Hegetschweiler, K.T.; de Vries, S.; Arnberger, A.; Bell, S.; Brennan, M.; Siter, N.; Olafsson, A.S.; Voigt, A.; Hunziker, M. Linking demand and supply factors in identifying cultural ecosystem services of urban green infrastructures: A review of European studies. Urban. For. Urban. Green. 2017, 21, 48–59. [Google Scholar] [CrossRef]
  45. Bereziartua, A.; Chen, J.; De Hoogh, K.; Rodopoulou, S.; Andersen, Z.J.; Bellander, T.; Brandt, J.; Fecht, D.; Forastiere, F.; Gulliver, J.; et al. Exposure to surrounding greenness and natural-cause and cause-specific mortality in the ELAPSE pooled cohort. Environ. Int. 2022, 166, 107341. [Google Scholar] [CrossRef] [PubMed]
  46. Hagedoorn, P.; Helbich, M. Longitudinal effects of physical and social neighbourhood change on suicide mortality: A full population cohort study among movers and non-movers in the Netherlands. Soc. Sci. Med. 2022, 294, 114690. [Google Scholar] [CrossRef]
  47. Ji, J.S.; Zhu, A.; Shi, X. Interaction between residential greenness and air pollution mortality: Analysis of the Chinese Longitudinal Healthy Longevity Survey. Lancet Planet. Health 2020, 4, e107–e115. [Google Scholar] [CrossRef] [PubMed]
Figure 1. The spatial location of Yangtze River Delta urban agglomeration (colored part) in East China. Data source: Standard Map Service System, (GS (2019)1683, http://bzdt.ch.mnr.gov.cn/, accessed on 14 June 2014).
Forests 15 01066 g001
Figure 2. Brief analysis framework of this study.
Forests 15 01066 g002
Figure 3. Spatial pattern of all-cause mortalities in the YRDUA.
Forests 15 01066 g003
Figure 4. Area ratio of LULC types across the cities in the YRDUA.
Forests 15 01066 g004
Figure 5. Landscape attributes of green space in the YRDUA. (a) PLAND; (b) LPI; (c) LSI; (d) COHESION. The groups of the values in the legends were based on the natural breaks’ classification.
Forests 15 01066 g005
Figure 6. Socioeconomic conditions in the YRDUA. (a) GDP per capita; (b) consumption expenditure per capita; (c) number of participants in basic medical insurance per 1000 people; (d) number of doctors per 1000 people. The groups of the values in the legends were based on the natural breaks’ classification.
Forests 15 01066 g006
Figure 7. Pearson’s correlation analysis between all-cause mortality and the green space and socioeconomic variables. The sizes of the squares in the grid indicated the absolute values of the correlation coefficient. * p < 0.05; ** p < 0.01; *** p < 0.001.
Forests 15 01066 g007
Figure 8. Variable selection based on the LASSO penalized regression. The dashed line indicates the optimal lambda value in cross-validation.
Forests 15 01066 g008
Figure 9. Independent and joint effects of green space and socioeconomic conditions to all-cause mortality using variation partition. (a) The original model with 16 variables; (b) the optimal model with four variables.
Forests 15 01066 g009
Table 1. Landscape indices of the green spaces of these cities in the YRDUA.
CodeLandscape IndicesUnitDescription
CATotal Areakm2Total area of green space in the target city
PLANDPercentage of Landscape%Proportional abundance of green space in the landscape
PDPatch DensityItem/km2Number of green space patches divided by total landscape area
LPILargest Patch Index-Area of the largest patch of green space divided by total landscape area
EDEdge Densitykm/km2Sum of the lengths of all edge segments of green space, divided by the total landscape area
LSILandscape Shape Index-A standardized measure of total edge or edge density of green space that adjusts for the size of the landscape
IJIInterspersion and Juxtaposition Index-A measure of class aggregation like the contagion index, but rather isolates the interspersion or intermixing of green space.
COHESIONPatch Cohesion Index-A measure of the physical connectedness of green space patches
DIVISIONLandscape Division Index-The probability that two randomly chosen pixels in the landscape are not situated in the same patch of green space
Table 2. Socioeconomic variables of these cities in the YRDUA.
VariablesCodeDescription
PopulationPOPPopulation of each city
GDP per capitaGDPpcGross Domestic Product per capita of each city
Consumption expenditure per capitaCEpcAll expenditures of the resident to meet the daily consumption of households
Number of participants in basic medical insuranceINSUNumber of participants in basic medical insurance per 1000 population
Number of hospital bedsBEDNumber of hospital beds per 1000 population
Number of doctorsDOCTNumber of registered doctors per 1000 population
Park area per capitaPARKpcPark area per capita of each city
Table 3. Effects of the selected variables on the all-cause mortality in the optimized GLM model.
VariablesEstimateS.E.tp-Value
CEpc−5.82 × 10−81.87 × 10−8−3.1160.004
DOCT−8.92 × 10−48.06 × 10−4−1.1070.276
LSI4.14 × 10−51.36 × 10−53.0510.004
COHESION−9.75 × 10−53.33 × 10−5−2.9290.006
Disclaimer/Publisher’s Note: The statements, opinions and data contained in all publications are solely those of the individual author(s) and contributor(s) and not of MDPI and/or the editor(s). MDPI and/or the editor(s) disclaim responsibility for any injury to people or property resulting from any ideas, methods, instructions or products referred to in the content.

