Article

Intraspecific Trait Variation Regulates Biodiversity and Community Productivity of Shrublands in Drylands

1
State Key Laboratory of Desert and Oasis Ecology, Xinjiang Institute of Ecology and Geography, Chinese Academy of Sciences, Urumqi 830011, China
2
University of Chinese Academy of Sciences, Beijing 100049, China
3
Fukang Station of Desert Ecology, Chinese Academy of Sciences, Fukang 831505, China
4
State Key Laboratory of Subtropical Silviculture, Zhejiang A&F University, Hangzhou 311300, China
*
Authors to whom correspondence should be addressed.
Forests 2024, 15(6), 911; https://doi.org/10.3390/f15060911
Submission received: 27 April 2024 / Revised: 16 May 2024 / Accepted: 21 May 2024 / Published: 23 May 2024

Abstract

:
Intraspecific variation (Intra-V) has played an important role in determining the responses of ecosystem functions to climate change. However, its specific role in the regulation of ecosystem functions during community assembly is less investigated. In this study, we conducted a transect survey in northwest China and determined different plant functional types, namely resource-conservative, medium, and resource-acquisitive strategies, which describe resource-use strategies of plants in multi-functional dimensions. Plant functional traits including canopy, wood density (WD), height, specific leaf area (SLA), and leaf nitrogen (N) and phosphorus (P) concentrations were determined. Ecological filters, including external filtering (assembly processes at the regional scale), internal filtering (assembly processes within a certain community), and functional redundancy, were employed to examine plant environment interactions. We found that with the decrease in environmental pressure, dominant shrub plants changed from conservative to acquisition species in drylands. Specifically, a benign environment (such as stable and adequate precipitation, loose soil, and increased acid deposition) significantly increased plant mean traits, such as SLA and WD of shrubs, especially for conservative strategy plants. In addition, a benign environment mainly reduced the functional redundancy of SLA (FRedSLA) by strengthening internal filtering and, ultimately, increased aboveground biomass but decreased species richness. Our results suggest that conservative strategy plants with stronger adaptability to the external environment may exhibit more competitive advantages and play a more important role in community construction under future climate scenarios of gradual warming and wetting in northwest China. Our results also revealed that trait-based Intra-V may be a more reasonable ecological filter than plant mean traits for predicting the structure and function of dryland ecosystems.

1. Introduction

Precipitation is the primary limiting factor affecting the stability and ecosystem productivity of drylands, which account for approximately 40% of global terrestrial ecosystems and continue to expand [1,2,3]. Global climate change has affected precipitation and non-growing season snowfall in drylands, and changes in precipitation regimes have significantly affected biodiversity and ecosystem productivity [4,5]. Given the trends of warming and humidification in northwest China, the atmospheric acid deposition (i.e., NHx and NOx) with precipitation is expected to alleviate the N constraint of drylands and improve soil salinization through acid neutralization [6,7]. Soil fertility is an important environmental factor that affects plant functional traits, determines plant competitiveness, and ultimately changes the structure and function of ecosystems [8,9]. For example, in fertile soils, plants typically have higher leaf N content and promote photosynthesis to increase ecosystem productivity [10,11]. Recent studies have shown that incorporating intraspecific trait variations into community assembly processes can effectively assess how ecosystem functions respond to climate change [12,13]. However, few studies have considered the effects of community assembly processes on ecosystem functions, such as biodiversity and ecosystem productivity, compared to climate and soil [10].
The response of plant functional traits to environmental changes is reflected in intraspecific variation (Intra-V) and species turnover such as plant functional types (PFTs) [14,15]. A recent study suggested that Intra-V may be a more important factor in community composition than species turnover [16]. Intra-V is determined by the external environment and genetic inheritance, which play an important role in determining how plants adapt to environmental changes [17]. In general, a higher Intra-V indicates that the species occupies a broader niche space and, therefore, has greater adaptability to the environment [18,19]. A global meta-analysis of 25 plant functional traits showed that Intra-V accounted for approximately 25% of the total variation in traits within communities [20]. Under environmental stress, the responses of the different PFTs were quite different. For example, acquisitive strategy plants tend to exhibit higher Intra-V than did conservative strategy plants (i.e., leaf specific area and leaf nitrogen (N) and phosphorus (P) contents) [21,22]. Conservative strategies generally resist environmental pressures by enhancing form construction such as high wood density [22,23]. In summary, compared to species turnover, Intra-V plays an equal or even more critical role in explaining the response of ecosystem functions to short-term climate change [24,25].
Compared with plant mean traits, Intra-V explains the niche space and functional overlap of different species within a community [26,27]. In real ecosystems, different species are not randomly combined into communities but are determined by external filtering generated by abiotic factors (i.e., climate and soil conditions) and internal filtering generated by biological factors (e.g., competition and parasitism) [4,28]. Therefore, the community is the product of external and internal filtering of PFTs [4]. In general, external filtering selects plants with similar resource-use strategies, resulting in the convergence of plant functional traits [29,30] and thereby increasing functional redundancy (Figure 1). Internal filtering may cause competition and parasitism, increasing the divergence of plant functional traits [29,30], thereby reducing functional redundancy (Figure 1). Internal filtering increases the possibility of the coexistence of plant species by promoting trait separation; however, some studies indicate that internal filtering may lead to the convergence of plant traits [29,31]. Although many studies have been conducted based on plant mean traits and Intra-V, the effects of trait-based external and internal filtering on ecosystem functions, such as species richness and aboveground biomass, during community assembly processes remain unknown [4,32], especially in ecologically fragile drylands.
Recent studies have found that traits that characterize plant morphology (such as canopy, height, and wood density) and ‘leaf economic spectra’ together explain more than 75% of the variation in plant functional traits [20,33]. This is because the combination of plant morphological characteristics and leaf economic traits represents the trade-offs of plants in a multidimensional function space, such as growth, survival, competition, and reproduction [34,35]. For example, high wood density means that plants invest in expensive morphological construction to prevent damage by herbivores and strong winds, increasing the possibility of survival while giving up high hydraulic conductivity, thus weakening photosynthesis [36,37,38]. Therefore, plants with a high wood density generally have a conservative strategy [37], whereas, plants at the front of ‘leaf economic spectrum’ promote nutrient acquisition and turnover by maintaining high specific leaf area (SLA) and leaf N and P content to increase ecosystem productivity [39,40]. In general, these plants belong to acquisitive strategy plants [39]. A larger canopy and tree height are conducive to plant resource occupation, which is a comprehensive reflection of plant competitiveness (e.g., photosynthesis and canopy interception) [41,42]. This strategy usually occurs in established species, and plays an important role in the stability of community structures and functions [41,42]. However, few studies have comprehensively considered the trade-off between these functional traits as plant strategies in the process of community assembly in arid regions. This is because when compared to tropical forests, shrublands have lower plant species diversity [43], a simpler vertical community structure [43,44], more specific morphological structure (e.g., succulent stems and leaves) [43,45], and less impact on global forest carbon sequestration [46]. Further, some studies have suggested that plant species in drylands were more inclined to cooperate with each other, rather than trade-off to survive in high-pressure environments [47,48,49].
To fill these knowledge gaps, we conducted a transect survey in northwest China and determined a series of plant functional traits, including plant morphology, plant nutrients, and soil fertility, to reveal the assembly process of shrub communities and their impact on ecosystem functions under changing environments. This study aims to test the following three hypotheses: 1. Stable and sufficient precipitation is the environmental filter to facilitate the strategic divergence of shrubs in drylands from conservative to acquisitive strategies. Specifically, this effect is achieved by increasing acquisitive traits, such as height, canopy, SLA, and leaf N and P content, ultimately increasing biodiversity and ecosystem productivity. 2. Ecological filters, such as external and internal filtering, play opposite roles in causing functional redundancy in shrub communities, thus affecting ecosystem functions in drylands. 3. The external environment, rather than ecological filters, plays a major role in determining ecosystem functions (i.e., species richness and aboveground biomass) in drylands.

2. Materials and Methods

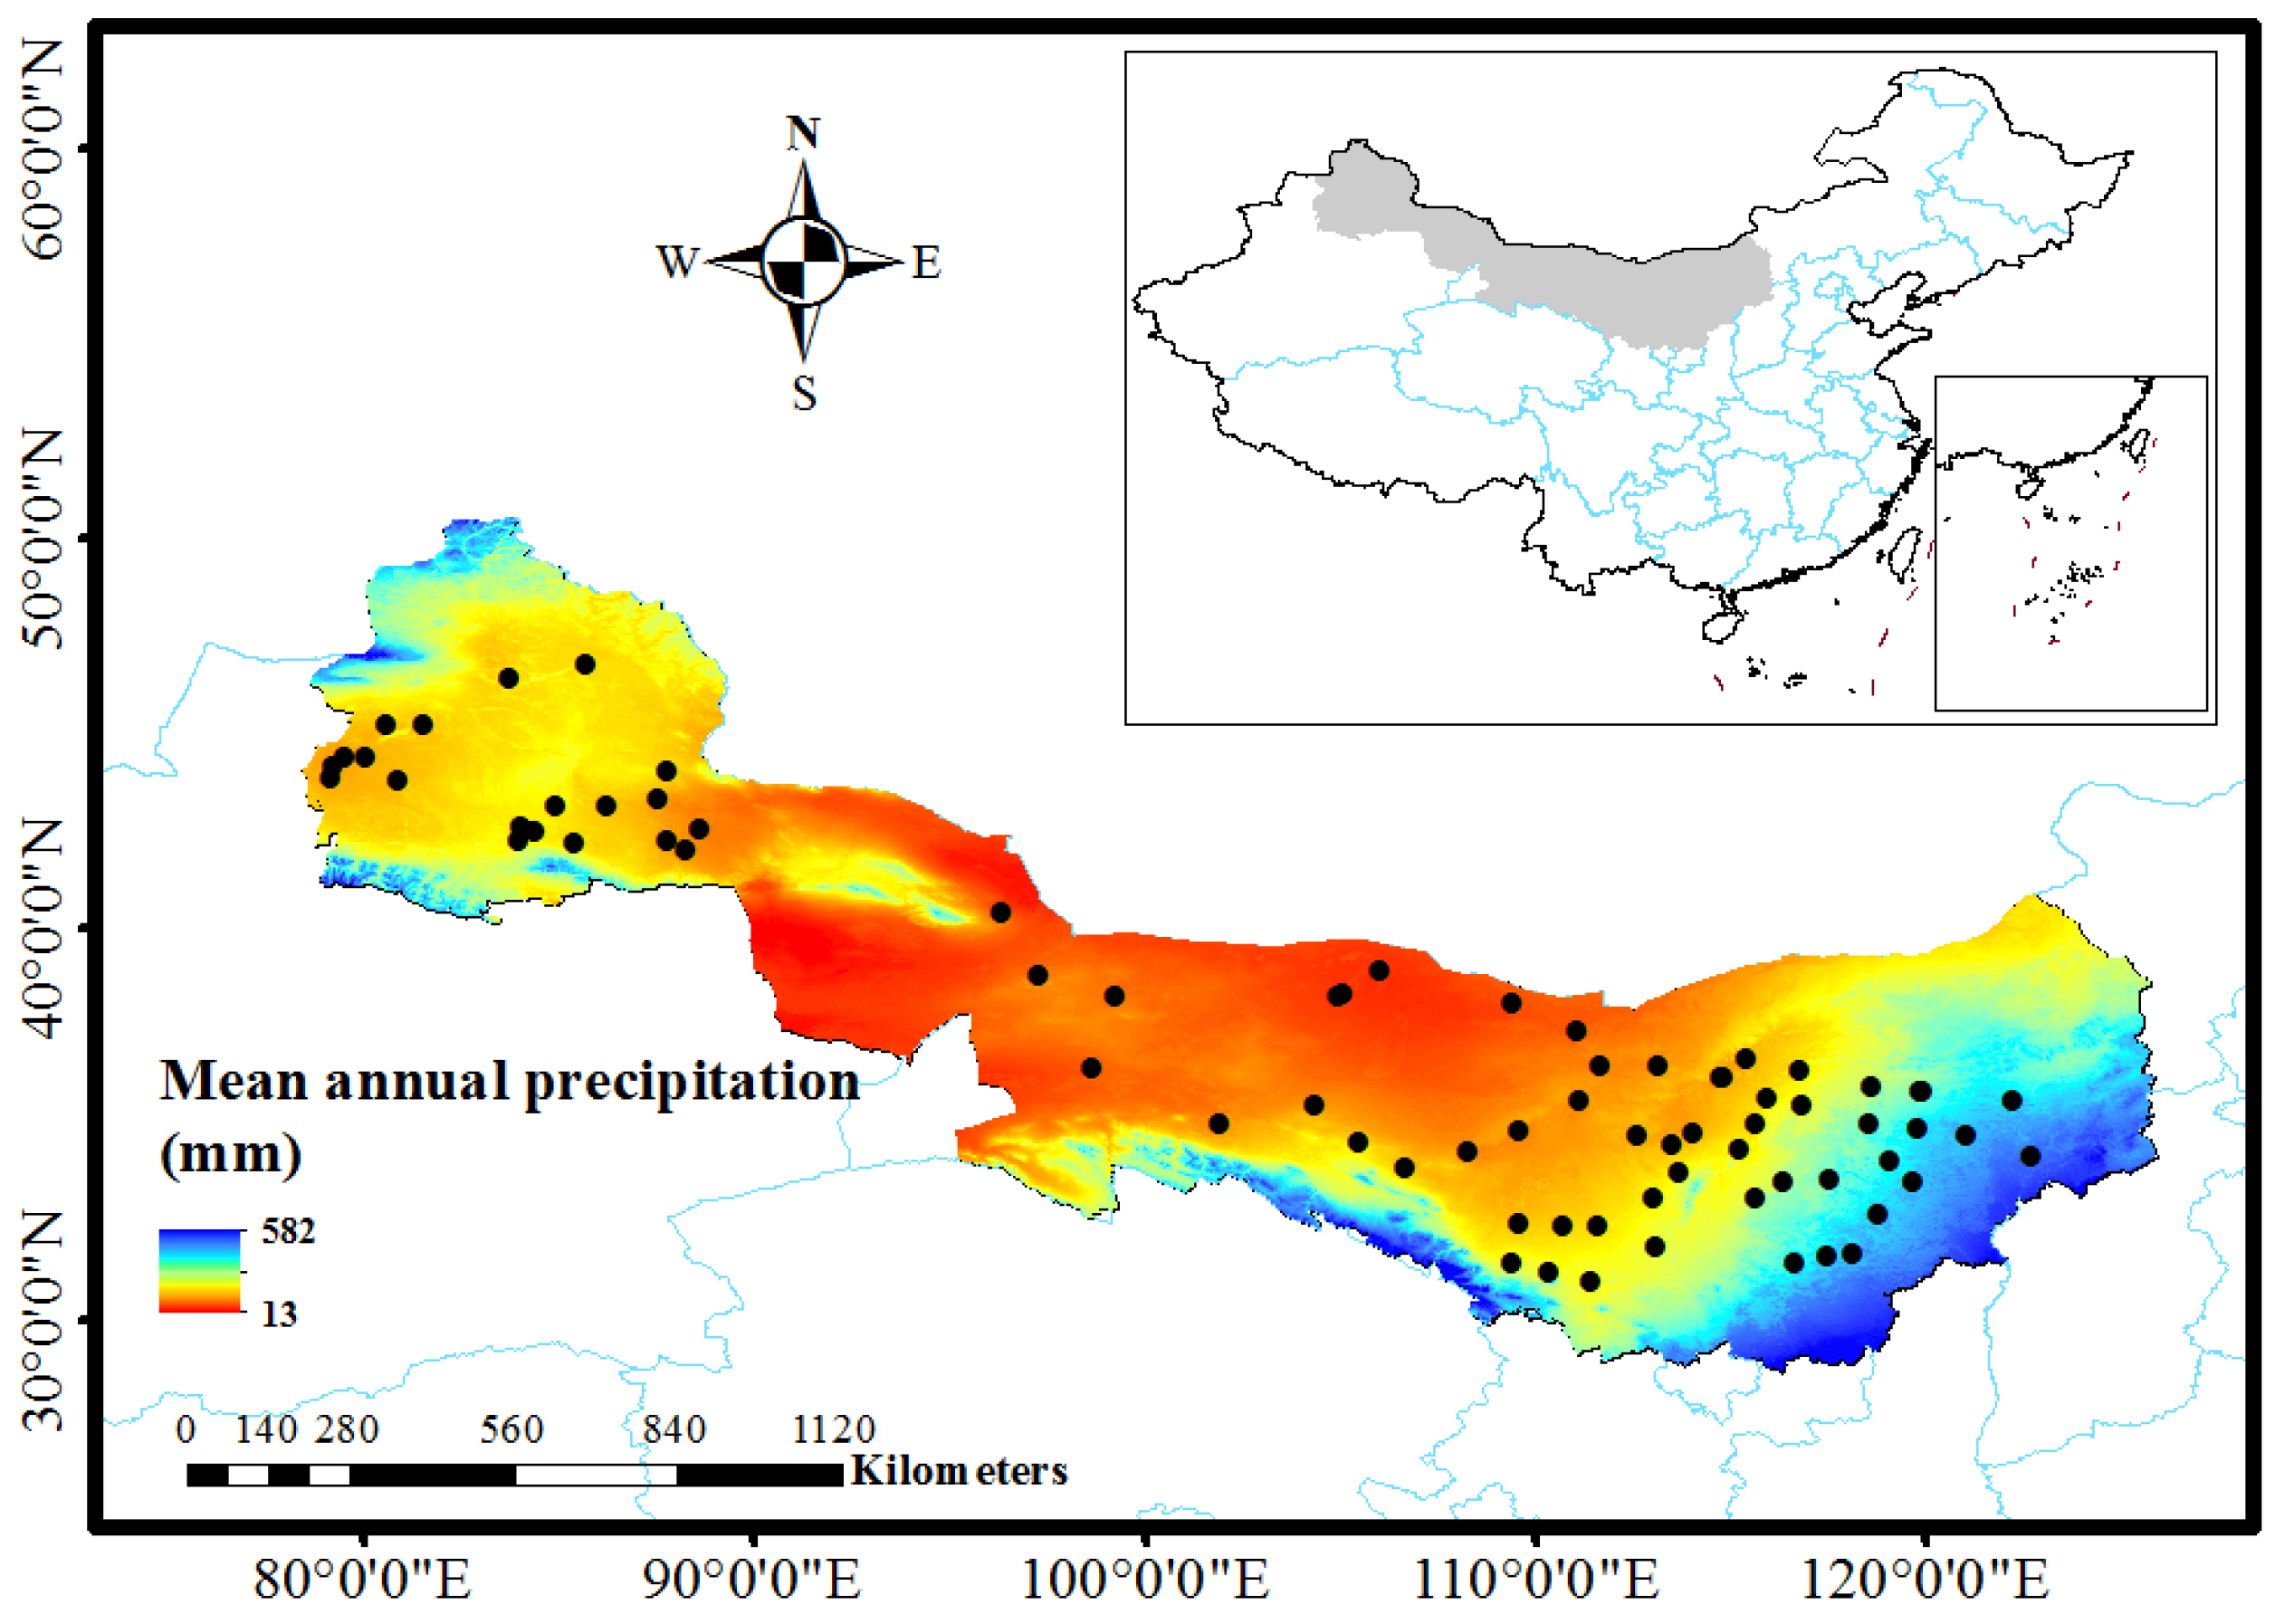
2.1. Study Site and Field Sampling

This study was conducted along a transect in northwest China (84°58′–111°6′ E, 37°26′–46°55′ N) (Figure 2). The study area is located in the hinterland of Eurasia, where the Qinghai–Tibet Plateau blocks the entry of ocean water vapor. Therefore, the region has a typical temperate continental climate, with precipitation ranging from 38 to 403 mm, whereas the precipitation in most regions is less than 200 mm, and only the central and western parts of the Inner Mongolian Plateau can reach 200 mm. The temperature ranges from 3.95 to 9.86 °C, and the annual evaporation more than 2500 mm. The vegetation in this region is sparse and mostly comprises drought-tolerant shrubs, semi-shrubs, dwarf semi-trees, and xerophytic herbs. The soil types include chestnut, grey desert, brown desert, and aeolian sandy soil. The soil is stunted and deficient in water and other nutrients.
Field sampling was completed during the growing season (June–September 2021). In total, 78 shrub communities and 30 shrub species were sampled. Four 20 × 20 m quadrats, not less than 1 km apart, were established in each sampling plot. The species richness, abundance, height, and canopy ((a + b)/2; here, a and b were the lengths of the long and short axes of the crown, respectively) of all shrubs in each quadrat were recorded. The branchlets of each species in the quadrat were sampled, with no fewer than four replicates. The collected plant samples were immediately stored in crispers on an ice pack. The plant samples were divided into two parts. The first part was used to scan the leaf area (LA, four replicates were measured), and then dry the scanned leaves at 60 °C to constant weight to obtain leaf dry mass (LDM). The specific leaf area (SLA) SLA = LA/LDM was calculated. The remaining portion was deoxidized at 105 °C for 30 min and then dried at 80 °C to a constant weight for chemical property determination. Wood density (WD) was calculated as the ratio of dry mass to the volume of dried branches
W D = m 3.14 × ( d / 2 ) 2 × L
where m is the dry mass of the branch, d is the branch diameter, and L is the length of the cross-cut branch (2–3 cm in length).
Three surface (0–20 cm) soil samples from each plot were sampled and mixed as composite samples. During the collection process, rocks and plant litter were removed from the soil and filtered again (through a 2 mm sieve) after the soil was air-dried.
The dried plant samples were ground using a Ball Mill (NM200 Ball Mill; Retsch, Haan, Germany) and the air-dried soil samples were analyzed. Soil organic carbon (SOC), total nitrogen (soil TN), and total phosphorus (TP) contents were determined by referring to soil and agricultural chemistry analyses [50]. The soil pH (pH) and electrical conductivity (EC) were determined using a sample with a 1:5 soil: water ratio.

2.2. Quantification the Effect of External and Internal Filters on Plant Functional Traits

External filtering represents the screening of the regional environment for intraspecific trait variations in the community. It was calculated as the ratio of the trait variation coefficient of the local community to that of the regional species pool [30]:
T I C : I R = σ I C 2 σ I R 2
here, T I C : I R represented the external filtering strength (“T” for various traits); σ I C 2 was the variation coefficient of the individual trait at community level (community level); and σ I R 2 was the variation coefficient of the individual trait at regional scale (regional level).
Internal filtering characterizes intraspecific trait variations, such as competition and parasitism, within local communities, as calculated using the formula described by Violle et al. [30]:
T I P : I C = σ I P 2 σ I C 2
here, T I P : I C represented the internal filtering strength (“T” for various traits); σ I P 2 was the trait variation coefficient of individuals species within local community (population level); and σ I C 2 was the variation coefficient of the individual trait at community level (community level).

2.3. Calculating Functional Redundancy of Plant Functional Traits

Functional redundancy (FRed) was defined as two species occupying a similar niche space [51]. The FRed calculation was based on trait probability density (TPD). Specifically, we divided the trait distribution ranges into N-dimensional cells and counted the number of species (M) with TPD values greater than zero:
F R e d = i = 1 N M i × V × T D P C i 1
where FRed is functional redundancy, N is the number of divided cells, i is the number from 1 to N, and Mi is the number of species of each cell for each trait probability density (TPDi); V is the size of the N cells composing the grid (hypervolume estimated as the product of the edges of the cells); and T D P C i is the probability density function of the community. The calculation of FRed was based on the R 4.3.1, TPD, and ks packages [52,53].

2.4. Classification the Plant Functional Types of Shrub Plants

Hierarchical clustering was conducted on the six mean plant traits of each species at the regional level to identify the PFTs. In this analysis, dissimilarities between observations were expressed as Euclidean distances (Figure S1). The optimum number of clusters (three in this case) was selected after computing the sum of the squared errors. In summary, we classified shrub plant strategy into three PFTs, namely conservative, medium, and acquisitive, and the classification results were exhibited with the load diagram of principal component analysis (PCA) (Figure 3).

2.5. Environmental Predictors

Key climatic and soil variables were selected to evaluate the effects of environmental changes on the community assembly processes of shrub plants. Five climate variables, mean annual precipitation (MAP), mean annual temperature (MAT), precipitation seasonality (Ps), and temperature seasonality (Ts), were used as climate predictors. The MAP, MAT, Ps, and Ts were extracted from the WorldClim2 dataset [54]. Atmospheric H+ input was used to examine the effects of atmospheric deposition and was obtained by data integration [55]. For soil properties, three physical variables, namely soil sand (sand), silt (silt), and clay (clay), and eight chemical properties, namely soil organic carbon (SOC), total phosphorus (TP), total nitrogen (TN), EC, pH, C:N ratio (Soil C:N), C:P ratio (Soil C:P), and N:P ratio (Soil N:P) were used. Data on sand, silt, and clay in the surface soil (0–20 cm) were obtained from the World Soil database (WISE30sec) [56]. To reduce analysis complexity, we independently performed PCA for climate and soil predictors. For climate, the first principal component axis (PC1) explained 51.04% of the total variation and was positively related to harsh environments with high Ps but low MAP, MAT, and Ts (Figure S2a), whereas the second principal component axis (PC2) explained 28.26% of the total variation and was positively related to benign environments with high MAP but low MAT and Ts (Figure S2a). For soil predictors, PC1 explained 28.1% of the total variation and was positively correlated with high soil sand and pH, but low soil clay, silt, EC, and TP (Figure S2b), whereas PC2 was positively correlated with high soil C:N, soil C:P, and SOC, but low soil pH, TN, and Soil TP (Figure S2b). Furthermore, to elaborate on the relationship between climate, H+ input, and soil predictors, we ran another PCA for all environmental predictors (Figure S2c). We found that in a benign environment, the H+ input was higher and the soil had increased sand but decreased Silt and Clay (Figure S2c).

2.6. Statistical Analysis

All analyses were conducted using the R 4.3.1 [57]. First, to simplify the analysis, plant functional traits with maximum load in the three strategy dimensions of conservative, medium, and acquisitive (i.e., WD, Canopy, and SLA) were selected as a subset. Co-inertia analysis (COIA) was used to examine whether the subset with the above three plant functional traits could represent the multivariate structure of plant allocation strategies as well as the complete database with six plant functional traits. COIA provides a correlation coefficient (‘RV’) that characterizes the correlation between the two matrices. This coefficient is bounded between zero (i.e., no association) and one (i.e., maximum association), with significance (p-value) assessed using a Monte Carlo test (with 100,000 permutations). To implement COIA, PCA was used for both matrices after data transformation to improve normality. Analyses were performed using the ADE4 package (version 1.7-22) [58].
Linear regression analysis (LRA) was used to evaluate the relationships among environmental pressures, plant mean traits, community assembly processes, and ecosystem functions. Specifically, we tested how environment changes affect plant mean traits at PFTs of conservative, medium, and acquisitive and regional scales (all species). In this LRA, all explanatory variables were normalized (Z-score, average = 0; standard deviation = 1) to obtain a standardized path coefficient. We tested how external filtering, internal filtering, functional redundancy, and plant mean traits affected species richness and aboveground biomass at the regional scale.
Based on the previous results, a piecewise structural equation model (pSEM) was established to illustrate the hypothesized multilinear path relationships. Five environmental predictors (Cli PC1, Cli PC2, H+ input, Soil PC1, and Soil PC2), two mean traits (WD and SLA), two indicators of assembly processes (SLAIC:IR and SLAIP:IC), and the functional redundancy of SLA (FRedSLA) were considered predictors of ecosystem functions of species richness and aboveground biomass in pSEM. In our pSEM, when the p-value of the Fisher’s C statistic was greater than 0.05, the fit was considered acceptable [59,60]. All the explanatory variables in the pSEM were z-scored (average = 0; standard deviation = 1) to obtain a standardized path coefficient.

3. Results

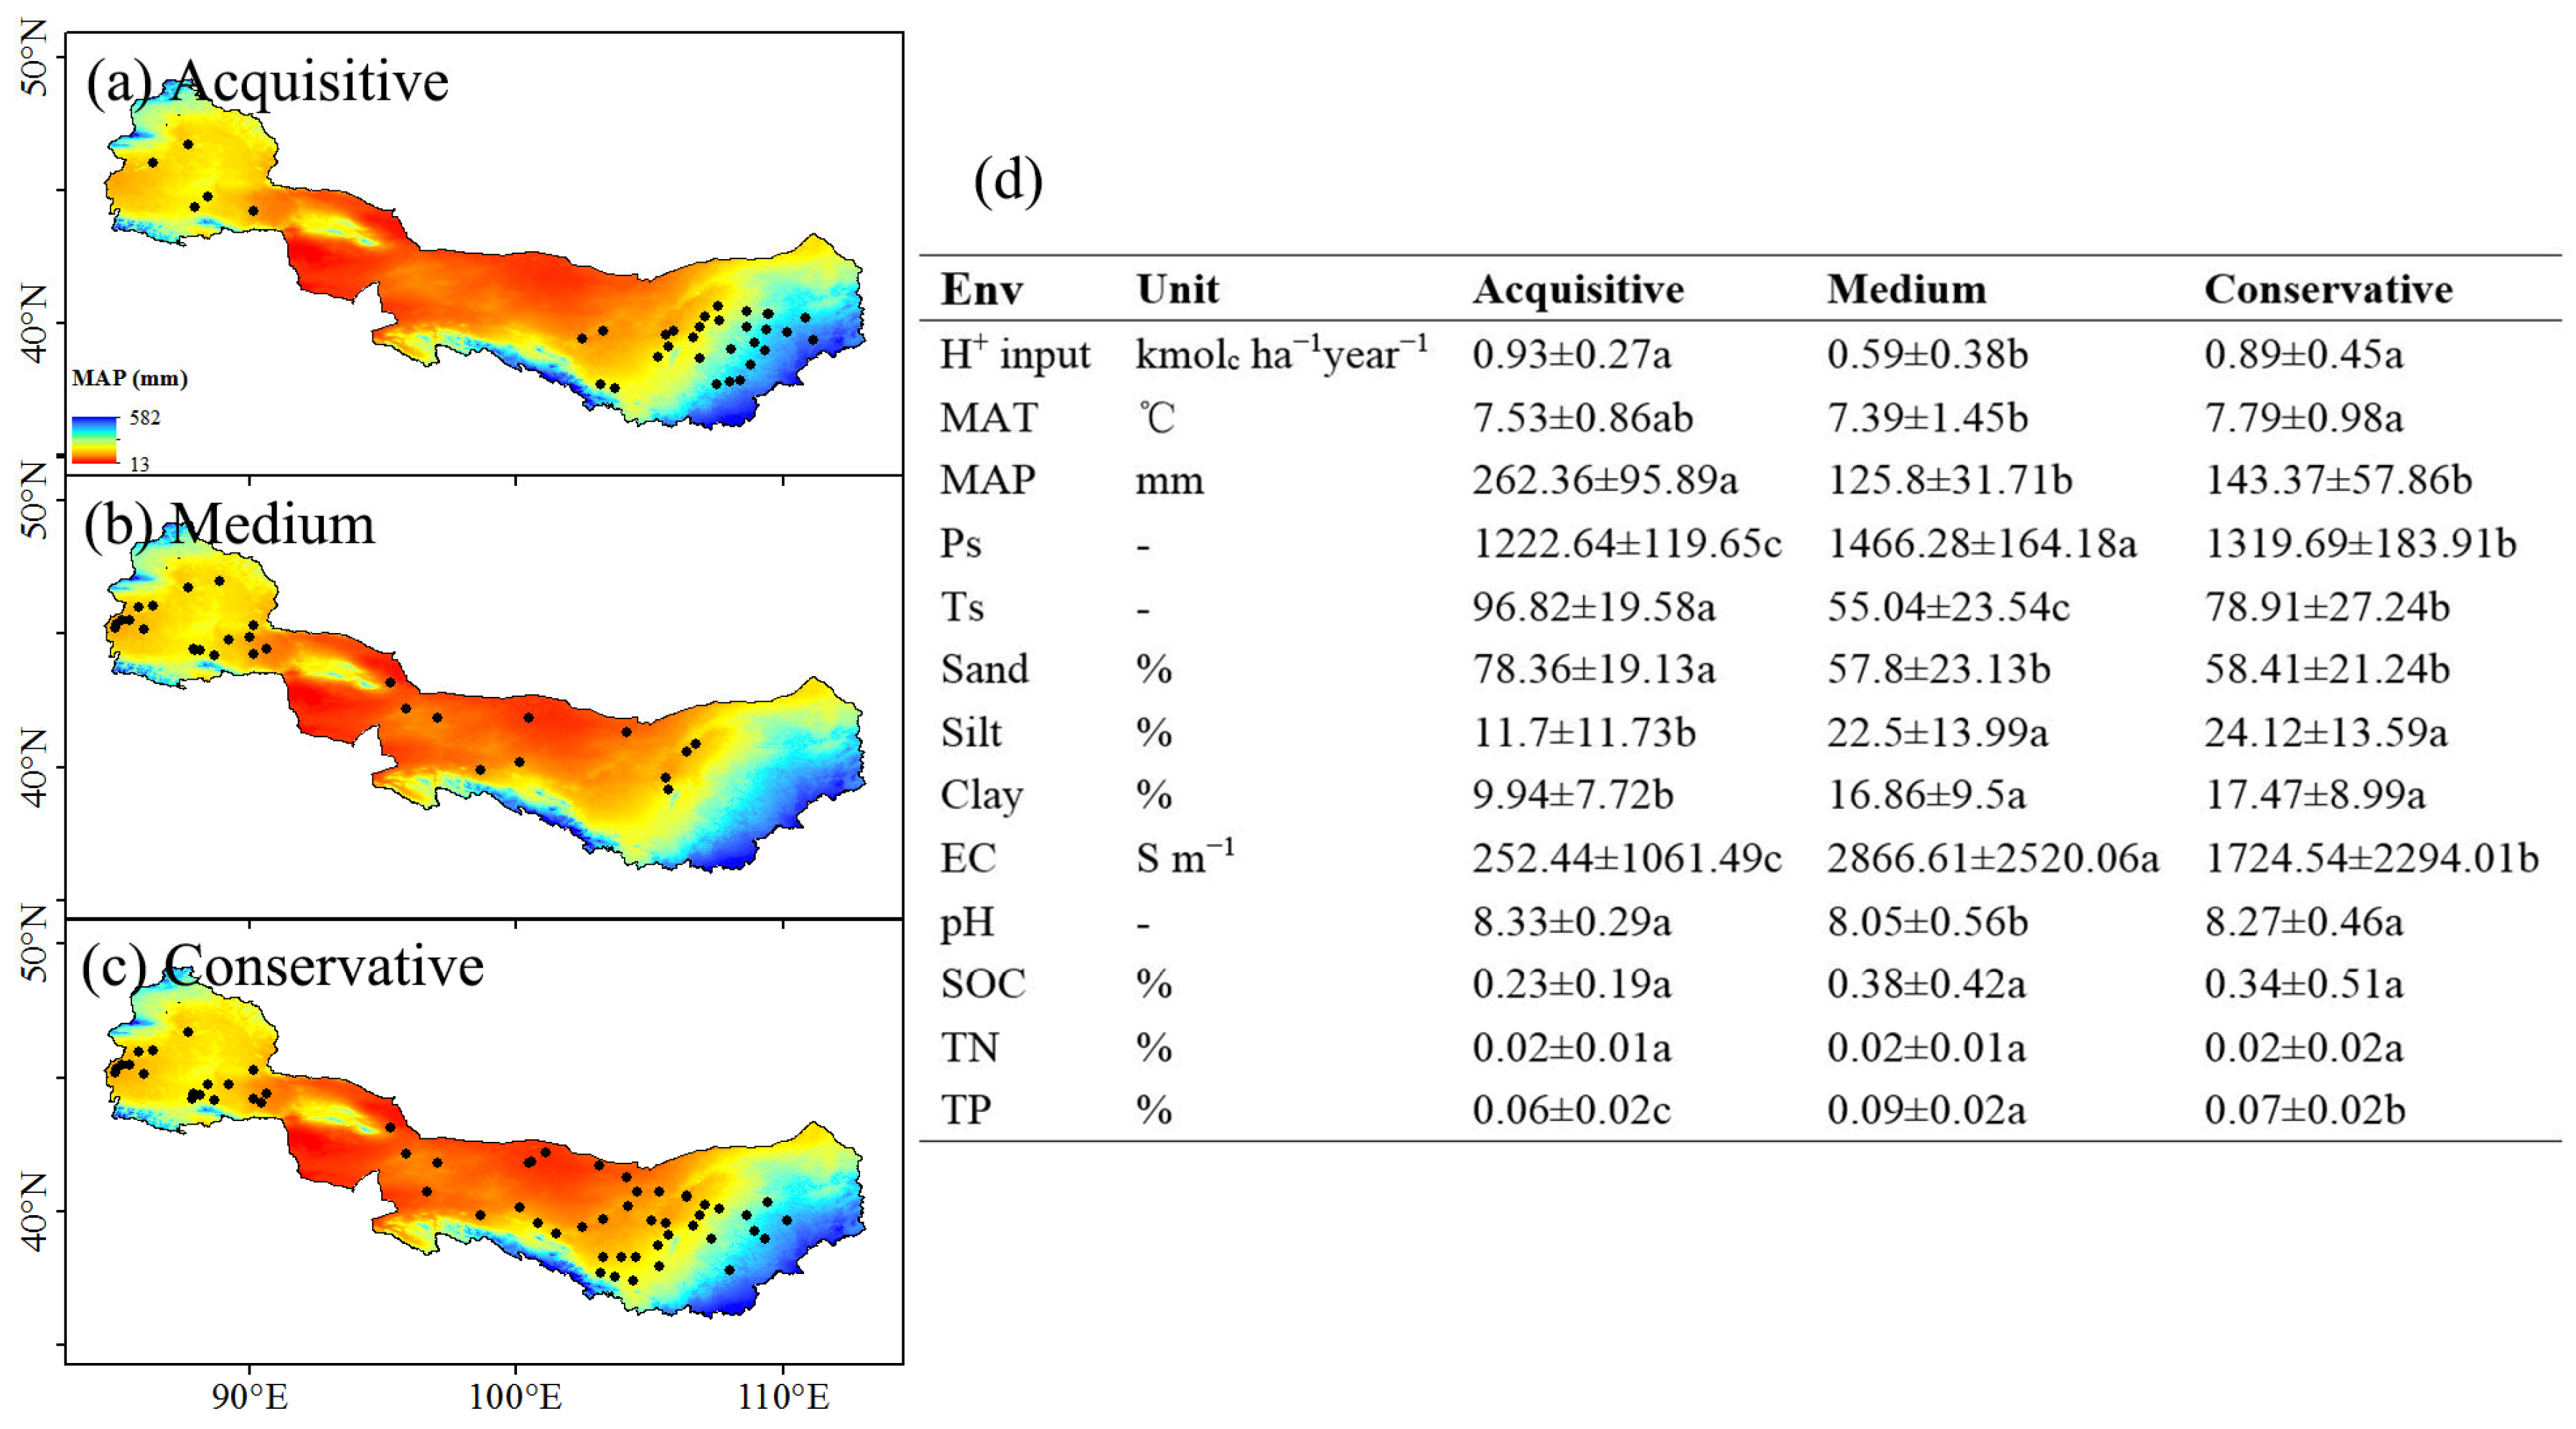
3.1. The Classification of Resource-Use Strategy for Shrublands in Northwest China

Through hierarchical cluster analysis combined with PCA visualization, resource-use strategies for shrubs in northwest China were classified (Figure 3 and Figure 4). The results showed that the ‘acquisitive’ strategy plants (6 species) were dominated by high resource-use capacities (with high SLA and leaf N and P concentration), and generally characterized by annual above-ground biomass plants, such as Nitraria sibirica, Halimodendron halodendron, and Artemisia ordosica, and mainly distributed in the central and western part of the Inner Mongolia Plateau (with mean annual precipitation of 262.36 mm) (Figure 3 and Figure S3a,d), whereas the ‘conservative’ strategy plants accounted for the largest proportion of the study area (18 species, with high wood density, small canopy, and low SLA) (Figure 3). For example, Lycium ruthenicum, Sarcozygium xanthoxylum, and Sabina vulgaris were the dominant species distributed in arid environments with a mean annual precipitation of 143.37 mm (Figure 3 and Figure S3c,d). The ‘medium’ strategy plants were characterized by the combination of both environmental tolerance and resource acquisition abilities (6 species, with large canopy, certain wood density and SLA), which play a major role in nutrient distribution and turnover of the population. For example, Haloxylon persicum, Haloxylon ammodendron, and Ephedra major are the dominant species and are mainly distributed in the Gurbantunggut Desert in Xinjiang and the Hexi Corridor in Gansu Province, with a mean annual precipitation of 125.80 mm (Figure 3 and Figure S3b,d).

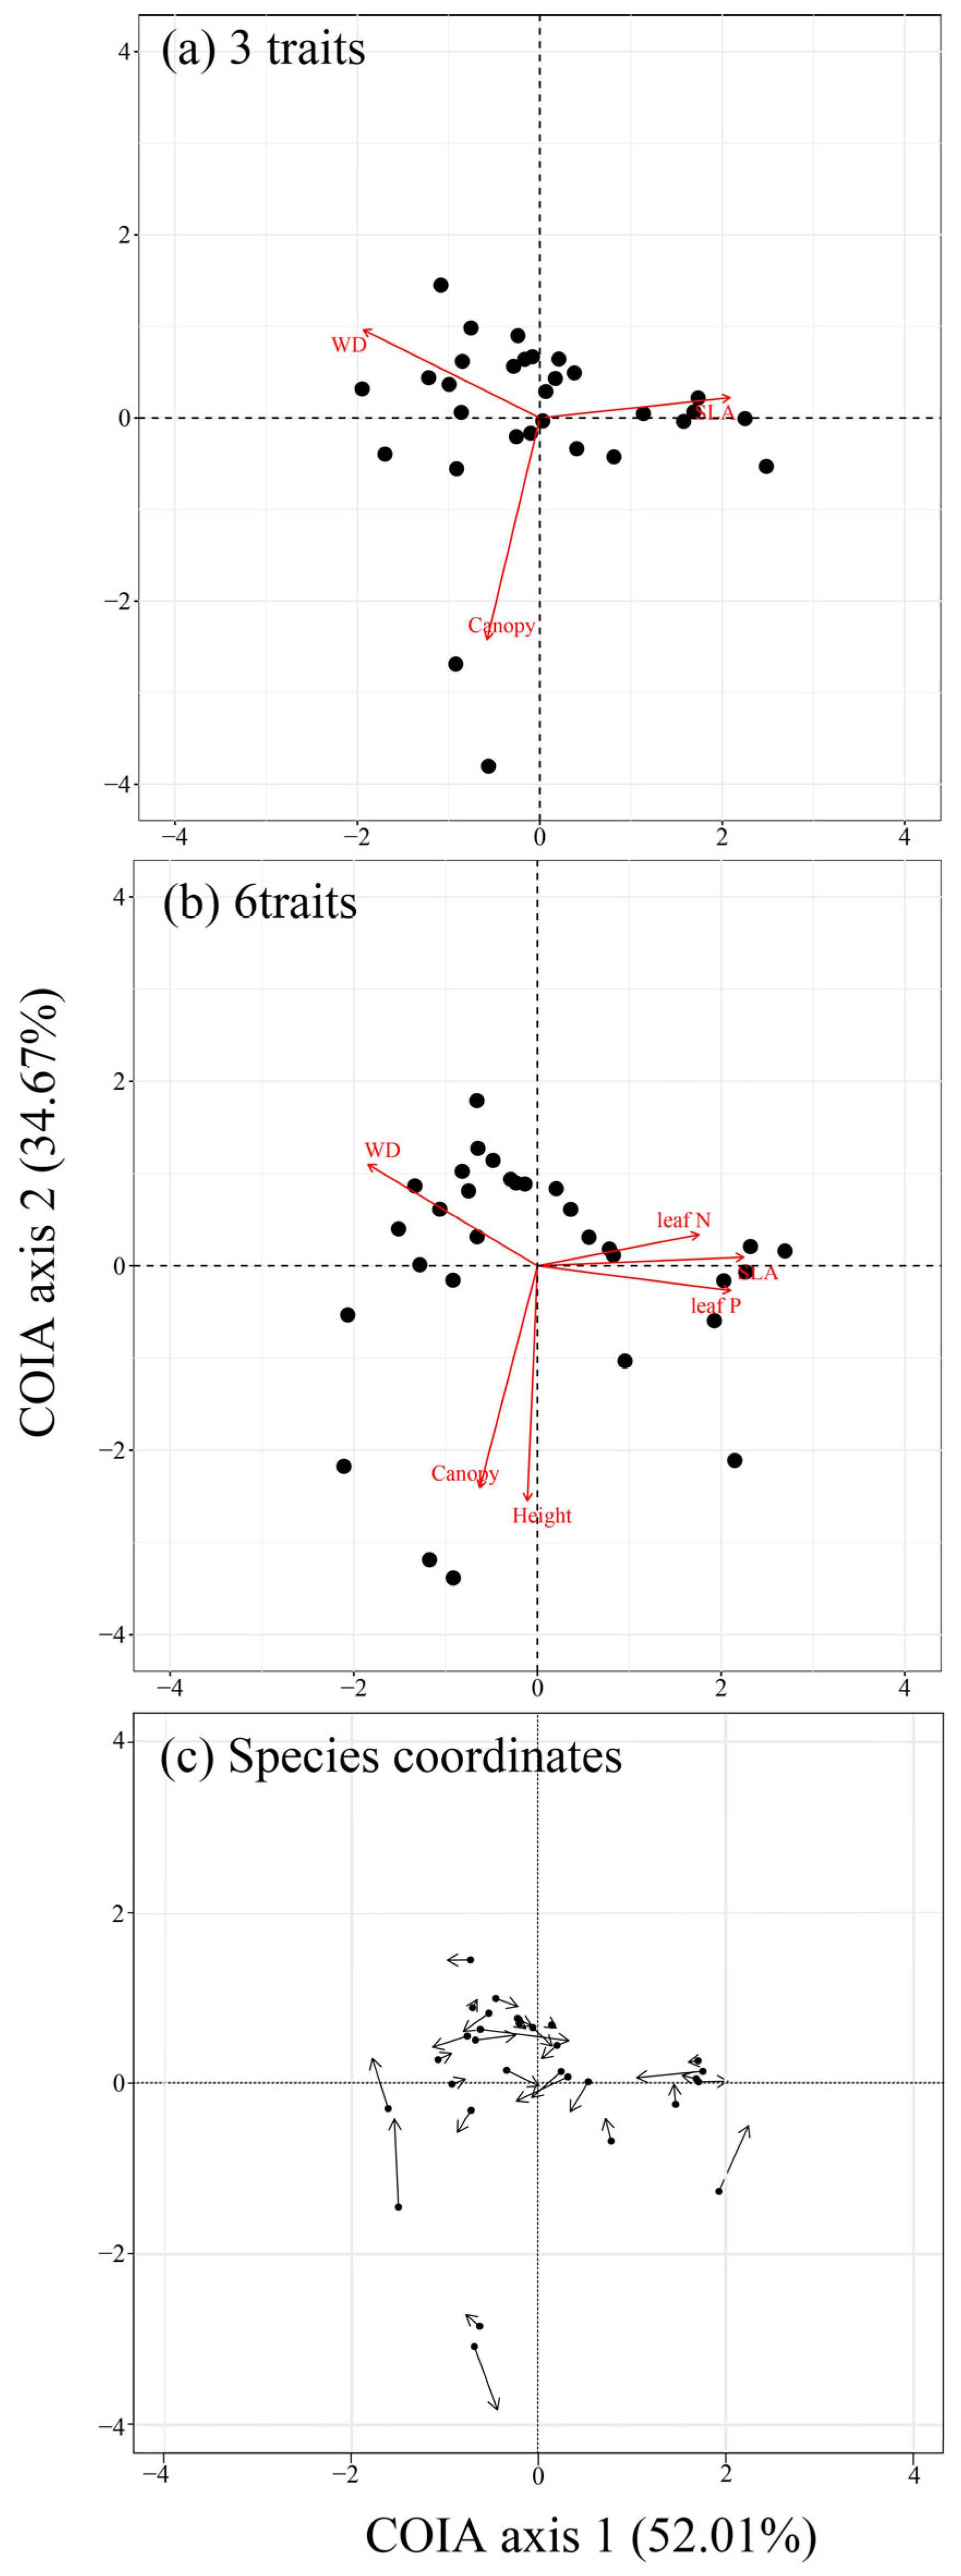
3.2. The Results of Co-Inertia Analysis

We found high consistency in the multivariate trait space generated by three and six traits (RV = 0.79, p < 0.001; Figure 5). That is, when three functional traits were used instead of the original six traits, the information loss of plants in different spatial dimensions was lower; thus, the selected subset of the three traits could effectively express the overall strategy of the plants (Figure 5).

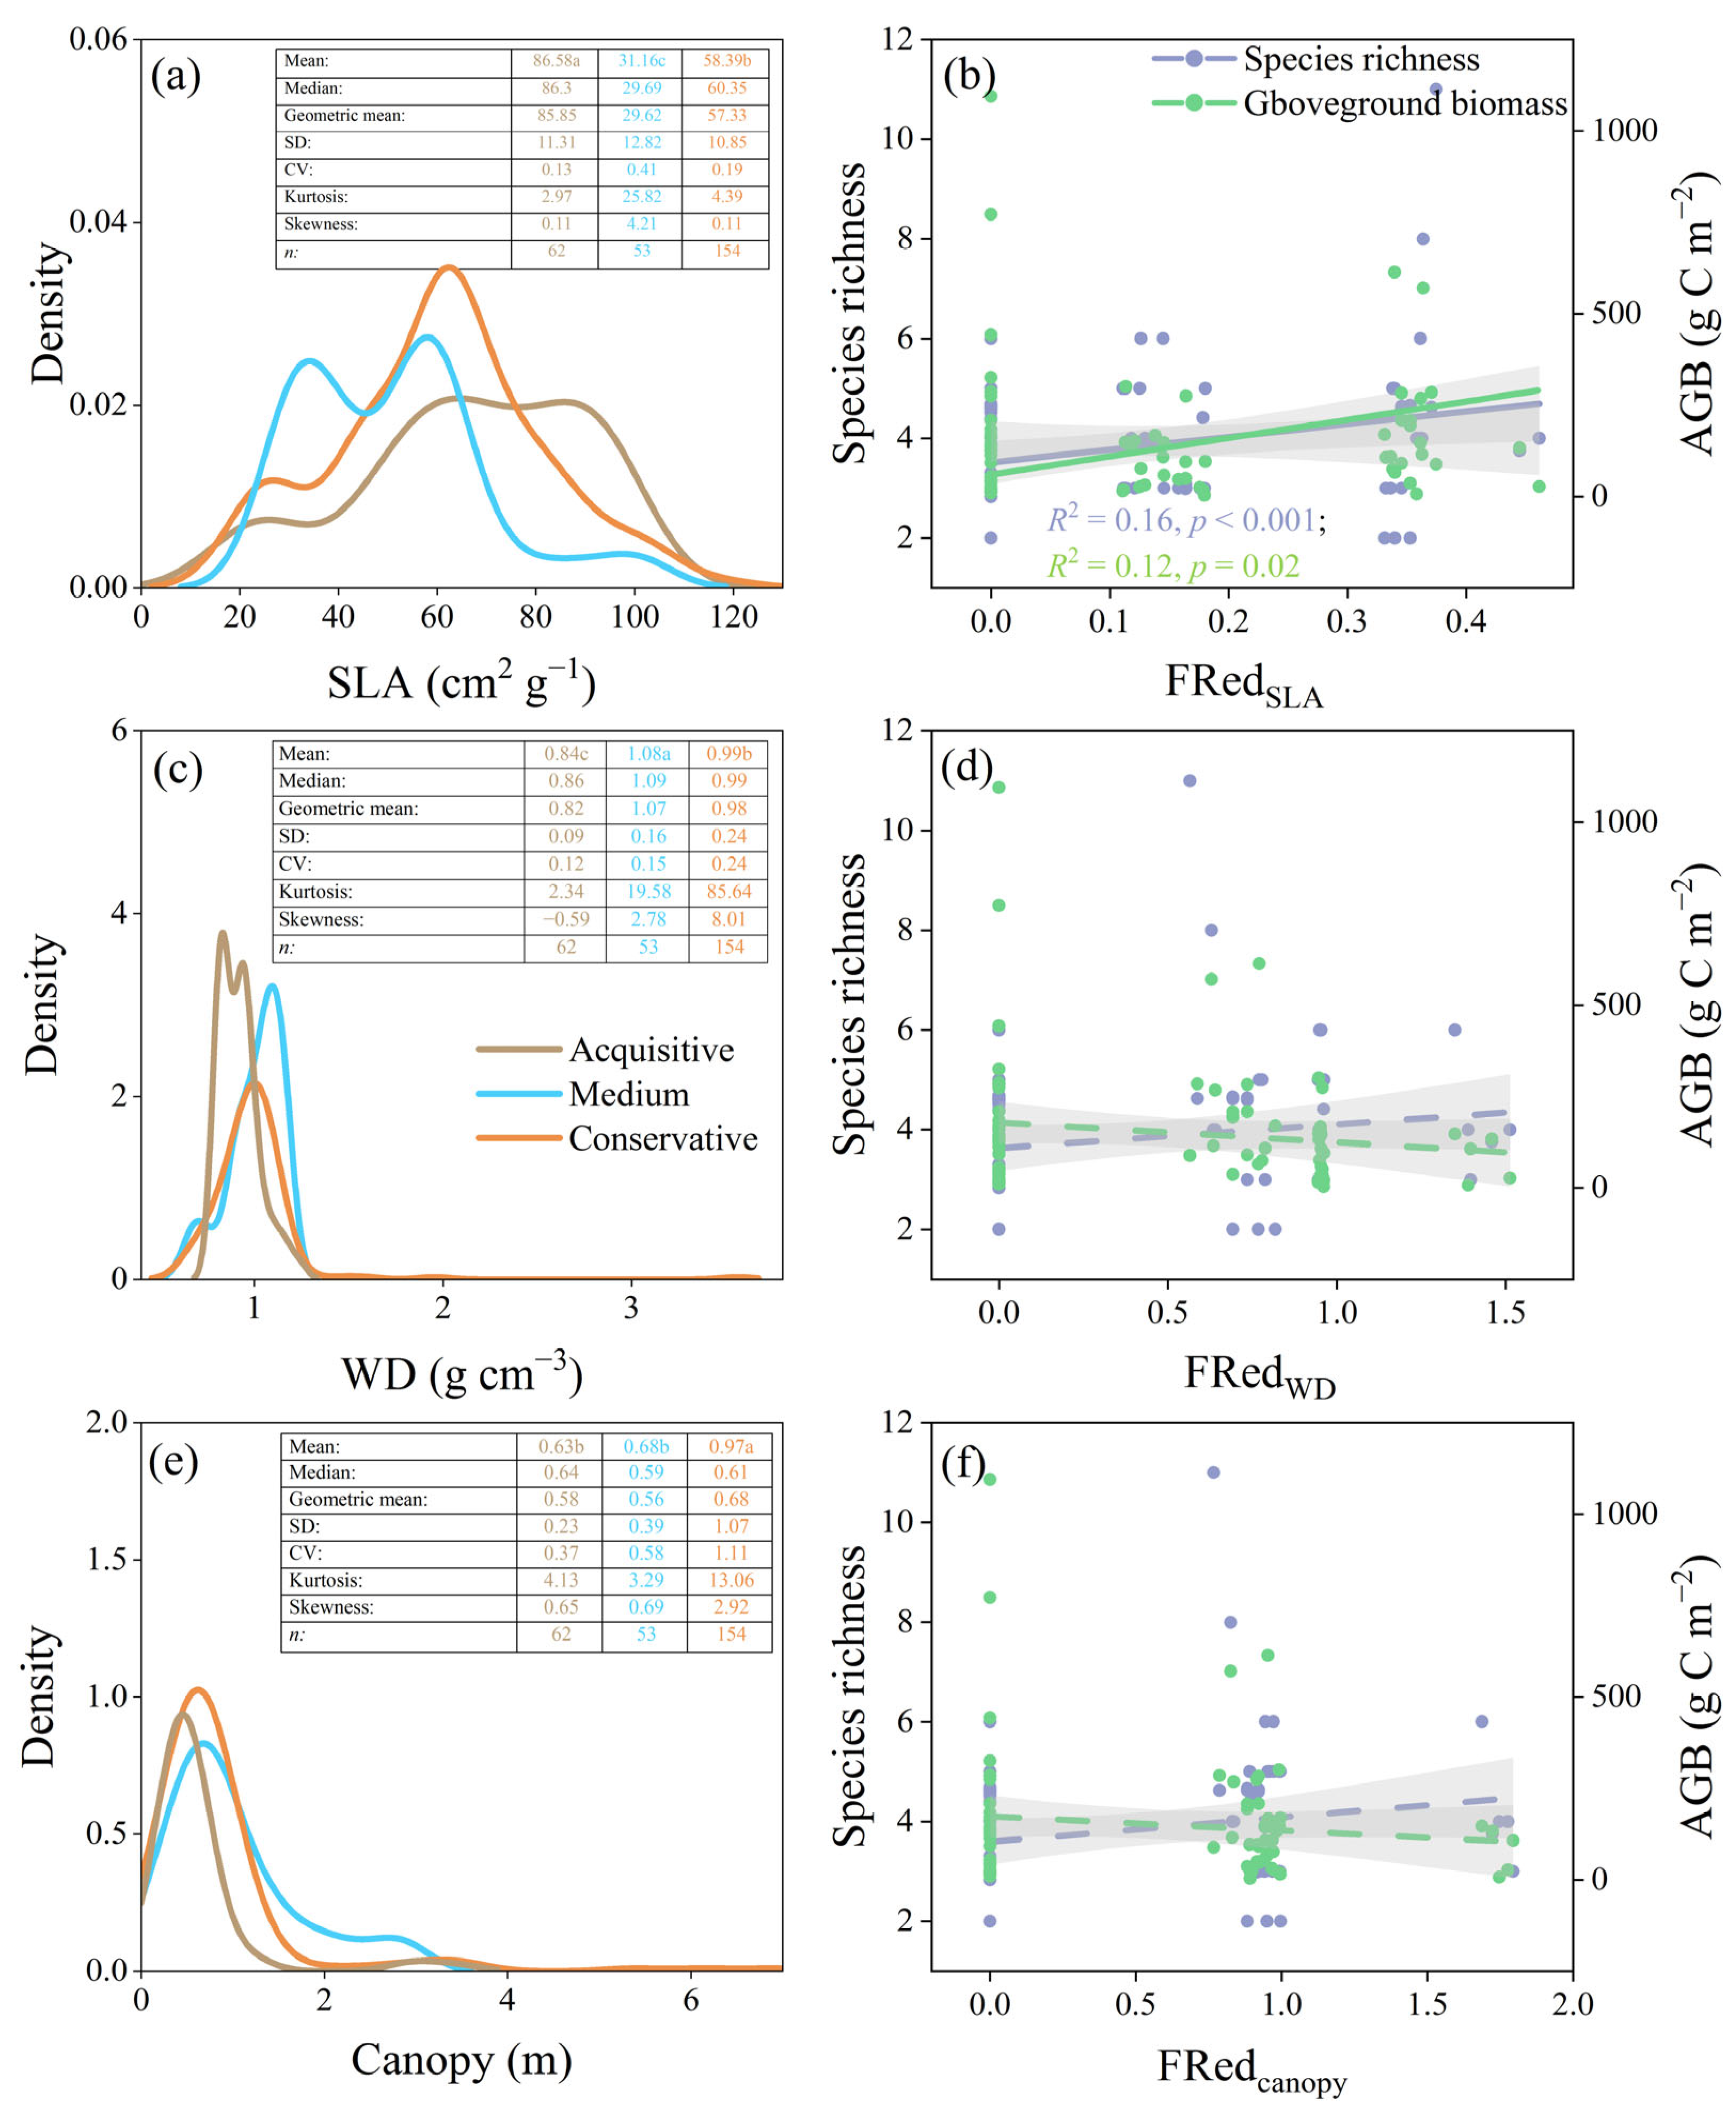
3.3. Relationships between Environment Pressure, Assembly Processes, and Ecosystem Functions

The density plots showed that resource-use strategies among PFTs were significantly different in the SLA, WD, and canopy (p < 0.05; Figure 6a,c,e). Moreover, the functional redundancy of SLA (FRedSLA), rather than the functional redundancy of WD (FRedWD) and canopy (FRedcanopy), increased species diversity and aboveground biomass (Figure 6b,d,f). In addition, our analysis based on mean plant traits showed that SLA and WD affected species diversity and aboveground biomass (Figure S3).
Linear regression analysis based on plant mean traits showed that climatic conditions, acid deposition, and soil properties significantly affected the nutrient acquisition strategies of shrubs at different PFTs and regional scales (Figure 7a,b,c). Specifically, SLA was positively correlated with H+ input (R2 = 0.09, p < 0.001) and Soil PC1 (correlated with benign soil conditions; R2 = 0.13, p < 0.001), whereas it was negatively correlated with Cli PC1 (correlated with harsh climate conditions; R2 = 0.33, p < 0.001) (Figure 4 and Figure 7a), and was mainly reflected in conservative strategy plants (p < 0.05; Figure 7a). Wood density was positively correlated with Cli PC1 at the regional scale (R2 = 0.05, p < 0.001), whereas it was negatively correlated with H+ input (R2 = 0.01, p < 0.05) and Soil PC1 (R2 = 0.02, p < 0.05) (Figure 7b), and was less affected by the external environment at different PFTs (Figure 7b). However, canopy and environmental pressures were uncoupled at both the regional and PFTs scales (Figure 7c).
External and internal filtering play different roles in the community clustering. Specifically, the external filtering of SLA (SLAIC:IR) insignificantly correlated with species richness (p > 0.05; Figure 8a) but was significantly decreased aboveground biomass (R2 = 0.12, p < 0.01; Figure 8b). However, internal filtering of SLA (SLAIP:IC) increased species richness (R2 = 0.15, p < 0.001; Figure 8c) and aboveground biomass (R2 = 0.13, p < 0.001; Figure 8d).
Our pSEM yielded acceptable results for the hypothesized linear relationships (AIC = 4736, Fisher’s C = 22.78, df = 24, and p-value = 0.27). In detail, species richness was directly correlated with Soil PC1 (positively correlated with benign environments; standardized path coefficient [SPC] = −0.17, p < 0.05) and FRedSLA (SPC = 0.26, p < 0.05). For indirect path relationships, with the reduction in environmental pressures (environmental conditions with high Cli PC2, H+ input, and Soil PC1), SLAIC:IR and FRedSLA both decreased, but SLAIP:IC increased and ultimately decreased species richness (Figure 9a). Aboveground biomass was directly correlated with SLAIP:IC (SPC = 0.16, p < 0.05), Cli PC1 (SPC = −0.27, p < 0.05), and FRedSLA (SPC = −0.09, p < 0.05; Figure 9a). For indirect path relationships, with the reduction in environmental pressures (high H+ input and Soil PC1), SLAIP:IC increased, whereas FRedSLA decreased, ultimately increasing the aboveground biomass (Figure 9a). Overall, species richness was positively correlated with Cli PC1, SLAIC:IR, and FRedSLA, but negatively correlated with Cli PC2, H+ input, Soil PC1, and SLAIP:IC (Figure 9b). Aboveground biomass was positively correlated with Cli PC2, H+ input, Soil PC1, and SLAIP:IC, but negatively correlated with Cli PC1, SLAIC:IR, and FRedSLA (Figure 9c).

4. Discussion

4.1. Precipitation Regimes Shaping Resource-Use Strategy Division of Shrub Community in Northwest China

Our study showed that the effect of precipitation regimes on PFTs was mainly achieved through conservative strategy plants and was mainly reflected in the mean specific leaf area (Figure 7a). This result was consistent with our hypothesis that precipitation regimes were the driving forces determining the transition from conservative to acquisitive strategies for shrubs in drylands. This driving effect becomes more evident with the gradual humidification in northwest China [61]. On the one hand, this may be because conservative strategy plants are widely distributed in drylands (Figure 4c), and ecological processes in these regions are generally limited by water availability, resulting in underutilized space and nutrients in these regions [4,62]. Once environmental stress is relieved, species with stronger environmental adaptation, such as conservative strategic plants, will accelerate their occupation of benign environmental habitats [39]. In contrast, studies in recent years have shown that acquisitive strategy plants are at a disadvantage in the face of increasing seasonal precipitation and continuous drought events [39,63,64]. This is mainly due to acquisitive strategy plants having sacrificed part of the structural investment while maintaining high nutrient uptake and turnover [65,66]. That is, acquisitive strategy plants tend to gain competitive advantages in environments with adequate light, water, and nutrients, while conservative strategy plants gain the greatest competitive advantage in arid regions where water resources are limited [39]. Our results confirmed that changes in precipitation regimes not only adjusted the physiological and biochemical strategies of shrubs in drylands (at a short-term scale) [67,68], but also caused morphological adjustments (on a long-term scale) to adapt to the changes in precipitation regimes (Figure 5a,b). However, these adjustments mainly occurred in conservative strategy plants (Figure 5a,b).
Similar to the precipitation regimes, the effect of acid deposition on the resource-use strategies of shrubs in drylands was mainly achieved by promoting the specific leaf area of conservative strategy plants (Figure 7a), which is consistent with Hypothesis 1. On the one hand, this may be due to the increased atmospheric N deposition with precipitation alleviated the N limitation of the arid ecosystems, thus promoting N absorption in plants [69,70,71]. However, water is a catalyst of nutrient turnover in arid regions, and a lack of precipitation may lead to plant nutrient failure [72]. In addition, CaCO3 and exchangeable base cations are consumed during soil acid neutralization [73], which improves soil salinization in arid regions, thereby creating a soil environment conducive to plant survival. This is consistent with our results that Soil PC1 (positively correlated with H+ input) was positively correlated with specific leaf area but negatively correlated with wood density (Figure 7a). That is, acid deposition in arid regions facilitated the conversion of plant resource-use strategies from conservative to acquisitive.

4.2. Intraspecific Trait Variation Mediates Assembly Processes and Ecosystem Functions

Due to differences in environmental adaptation and evolution, the responses of different species to environmental changes during the process of community assembly are not uniform [39,65,74], therefore, considering intraspecific trait variation can reveal the impact of niche overlap on ecosystem functions. Generally, strong external filtering leads to the convergence of plant traits, whereas weak external filtering leads to the divergence of plant traits, thus increasing functional redundancy and, ultimately, community stability [28,29]. This study found that the benign environmental conditions (high MAP, but low Ps) enhanced external filtering of SLA (indicated by lower SLAIC:IR), which means that with the increase in precipitation, the converged trait species such as acquisitive strategy species were more conducive to competition (Figure 6a). Due to intensifying competition for limited resources, strong internal filtering may lead to niche separation of similar resource-use species within the local community, thus reducing functional redundancy; however, higher resource utilization increases community stability [31,75,76]. As expected, we found that benign environmental conditions (high H+ input and Soil PC1, which were positively correlated with high MAP) promoted the internal filtering of SLA (SLAIP:IC) (Figure 9a). This means that with an increase in precipitation, species competition and resource utilization increase, ultimately promoting community productivity (Figure 9c). Therefore, external and internal filtering played opposite roles in shrub community assembly, which is consistent with Hypothesis 2.
Our results showed that the effects of internal filtering on species richness and above-ground biomass were equivalent to those of the external environment in arid regions, whereas the effects of external filtering were limited (Figure 7b,c). This may be due to the narrow environmental gradients (mean annual precipitation less than 200 mm) of dryland ecosystems compared to those of forest ecosystems [72], which limit the effects of external filtering. However, environmental changes (i.e., increased precipitation) have promoted productivity increases through internal filtering by strengthening intraspecific competition (Figure 9). In other words, the reduction in species richness may have been due to the exclusion of functionally distinct species [77]. This was implied in the spatial distribution from conservative to acquisitive strategy plants (Figure 4). That is, the stronger resource acquisition capability of acquisitive strategy plants excluded conservative and medium strategy plants. However, our results showed that improved environmental conditions (i.e., high MAP, H+ input, and Soil PC1) mainly increased the resource acquisition ability of conservative strategy plants (Figure 5a,b). Therefore, under the scenario of gradual warming and wetting in northwest China, conservative strategy plants will gradually gain a competitive advantage and make greater contributions to community stability and productivity.

5. Conclusions

Through a transect survey in northwest China, this study examined the importance of ecological filters in community assembly processes of drylands. We found that the external environment influenced ecosystem functions mainly by adjusting niche allocation (i.e., functional redundancy) through the adjustment of trait-based internal filtering rather than plant mean traits during the assembly of shrub communities. Specifically, stable and sufficient precipitation, along with loose soil and acid deposition, increased the internal filtering of specific leaf areas, and this effect was mainly observed in the conservative strategy plants. In other words, when the water limitation is alleviated, conservative strategy plants with strong adaptability to the environment can maximize the utilization of limited resources and ultimately increase community productivity. However, internal filtering caused by intraspecific competition has led to a decrease in species richness in shrub communities from harsh to benign environments. Given the climate scenario of gradual warming and humidification in northwest China in the future, conservative strategy plants, which are the most widely distributed, are expected to have greater competitive advantages and play a more important role in the stability and productivity of dryland ecosystems. This study provides an empirical framework to validate the importance of ecological filters in regulating ecosystem functions such as species richness and productivity. Our findings highlight the importance of integrating trait-based ecological filters into models that predict ecosystem structures and functions in the context of climate change.

Supplementary Materials

The following supporting information can be downloaded at: https://www.mdpi.com/article/10.3390/f15060911/s1, Figure S1: Hierarchical clustering results of shrubland communities in northwest China. Dissimilarities between the observations were expressed as Euclidean distance; Figure S2: Principal component analysis (PCA) of (a) climate, (b) soil, and (c) total environmental predictors. Percentage of variance explained by each axis are shown in the axis legend; Figure S3: Liner relationships between (a,b) SLA (specific leaf area), (c,d) WD (wood density), and (e,f) Canopy and species richness and AGB (aboveground biomass), respectively; Table S1: Summary of the shrub plants communities in northwest China.

Author Contributions

X.Z. and Y.L. designed this research; L.D. led the writing of the manuscript with substantial contributions by S.T., N.Z., B.Z., X.M. and L.T. All authors have read and agreed to the published version of the manuscript.

Funding

This work was financially supported by the third Xinjiang Scientific Expedition Program (grant no. 2022xjkk0901); the National Natural Sciences Foundation of China (No. 42171068 and No. 42330503).

Data Availability Statement

The datasets used and/or analyzed during the current study are available from the corresponding author on reasonable request.

Conflicts of Interest

The authors declare no conflicts of interest.

References

  1. Li, S.Y.; Miao, L.J.; Jiang, Z.H.; Wang, G.J.; Gnyawali, K.R.; Zhang, J.; Zhang, H.; Fang, K.; He, Y.; Li, C. Projected drought conditions in Northwest China with CMIP6 models under combined SSPs and RCPs for 2015–2099. Adv. Clim. Chang Res. 2020, 11, 210–217. [Google Scholar] [CrossRef]
  2. Miao, L.; Li, S.; Zhang, F.; Chen, T.; Shan, Y.; Zhang, Y. Future Drought in the Dry Lands of Asia Under the 1.5 and 2.0 °C Warming Scenarios. Earths Future 2020, 8, e2019EF001337. [Google Scholar] [CrossRef]
  3. Zhu, S.; Li, C.; Shao, H.; Ju, W.; Lv, N. The response of carbon stocks of drylands in Central Asia to changes of CO2 and climate during past 35 years. Sci. Total Environ. 2019, 687, 330–340. [Google Scholar] [CrossRef] [PubMed]
  4. Deng, M.; Liu, W.; Li, P.; Jiang, L.; Li, S.; Jia, Z.; Yang, S.; Guo, L.; Wang, Z.; Liu, L. Intraspecific trait variation drives grassland species richness and productivity under changing precipitation. Ecosphere 2021, 12, e03707. [Google Scholar] [CrossRef]
  5. Li, K.; Liu, X.; Song, L.; Gong, Y.; Lu, C.; Yue, P.; Tian, C.; Zhang, F. Response of alpine grassland to elevated nitrogen deposition and water supply in China. Oecologia 2015, 177, 65–72. [Google Scholar] [CrossRef] [PubMed]
  6. Diao, H.; Chen, X.; Zhao, X.; Dong, K.; Wang, C. Effects of nitrogen addition and precipitation alteration on soil respiration and its components in a saline-alkaline grassland. Geoderma 2022, 406, 115541. [Google Scholar] [CrossRef]
  7. Gong, H.; Han, Y.; Li, J.; Liu, Z.; Hou, R.; Zhang, Y.; Dou, W.; Wang, B.; Ouyang, Z. Responses of Phragmites australis to Nitrogen Addition along Salinity Gradients in Coastal Saline-Alkali Soil. Land 2022, 11, 2320. [Google Scholar] [CrossRef]
  8. Delgado-Baquerizo, M.; Maestre, F.T.; Reich, P.B.; Jeffries, T.C.; Gaitan, J.J.; Encinar, D.; Berdugo, M.; Campbell, C.D.; Singh, B.K. Microbial diversity drives multifunctionality in terrestrial ecosystems. Nat. Commun. 2016, 7, 10541. [Google Scholar] [CrossRef] [PubMed]
  9. Wagg, C.; Bender, S.F.; Widmer, F.; van der Heijden, M.G.A. Soil biodiversity and soil community composition determine ecosystem multifunctionality. Proc. Natl. Acad. Sci. USA 2014, 111, 5266–5270. [Google Scholar] [CrossRef]
  10. Grace, J.B.; Anderson, T.M.; Seabloom, E.W.; Borer, E.T.; Adler, P.B.; Harpole, W.S.; Hautier, Y.; Hillebrand, H.; Lind, E.M.; Paertel, M.; et al. Integrative modelling reveals mechanisms linking productivity and plant species richness. Nature 2016, 529, 390–393. [Google Scholar] [CrossRef]
  11. Walde, M.; Allan, E.; Cappelli, S.L.; Didion-Gency, M.; Gessler, A.; Lehmann, M.M.; Pichon, N.A.; Grossiord, C. Both diversity and functional composition affect productivity and water use efficiency in experimental temperate grasslands. J. Ecol. 2021, 109, 3877–3891. [Google Scholar] [CrossRef]
  12. Chatanga, P.; Sieben, E.J.J. Variation in Plant Functional Composition of the Afromontane Palustrine Wetlands Along an Altitudinal Gradient in Lesotho. Wetlands 2020, 40, 2539–2552. [Google Scholar] [CrossRef]
  13. Thomas, H.J.D.; Myers-Smith, I.H.; Bjorkman, A.D.; Elmendorf, S.C.; Blok, D.; Cornelissen, J.H.C.; Forbes, B.C.; Hollister, R.D.; Normand, S.; Prevey, J.S.; et al. Traditional plant functional groups explain variation in economic but not size-related traits across the tundra biome. Glob. Ecol. Biogeogr. 2019, 28, 78–95. [Google Scholar] [CrossRef] [PubMed]
  14. Thakur, D.; Hadincova, V.; Schnablova, R.; Synkova, H.; Haisel, D.; Wilhelmova, N.; Dostalek, T.; Munzbergova, Z. Differential effect of climate of origin and cultivation climate on structural and biochemical plant traits. Funct. Ecol. 2023, 37, 1436–1448. [Google Scholar] [CrossRef]
  15. Zuo, X.; Zhao, S.; Cheng, H.; Hu, Y.; Wang, S.; Yue, P.; Liu, R.; Knapp, A.K.; Smith, M.D.; Yu, Q.; et al. Functional diversity response to geographic and experimental precipitation gradients varies with plant community type. Funct. Ecol. 2021, 35, 2119–2132. [Google Scholar] [CrossRef]
  16. Des Roches, S.; Post, D.M.; Turley, N.E.; Bailey, J.K.; Hendry, A.P.; Kinnison, M.T.; Schweitzer, J.A.; Palkovacs, E.P. The ecological importance of intraspecific variation. Nat. Ecol. Evol. 2018, 2, 57–64. [Google Scholar] [CrossRef] [PubMed]
  17. Moran, E.V.; Hartig, F.; Bell, D.M. Intraspecific trait variation across scales: Implications for understanding global change responses. Glob. Chang. Biol. 2016, 22, 137–150. [Google Scholar] [CrossRef] [PubMed]
  18. Griffin-Nolan, R.J.J.; Sandel, B. Global intraspecific trait-climate relationships for grasses are linked to a species’ typical form and function. Ecography 2023, 2023, e06586. [Google Scholar] [CrossRef]
  19. Raffard, A.; Cucherousset, J.; Santoul, F.; Di Gesu, L.; Blanchet, S. Climate and intraspecific variation in a consumer species drive ecosystem multifunctionality. Oikos 2023, 2023, e09286. [Google Scholar] [CrossRef]
  20. Siefert, A.; Violle, C.; Chalmandrier, L.; Albert, C.H.; Taudiere, A.; Fajardo, A.; Aarssen, L.W.; Baraloto, C.; Carlucci, M.B.; Cianciaruso, M.V.; et al. A global meta-analysis of the relative extent of intraspecific trait variation in plant communities. Ecol. Lett. 2015, 18, 1406–1419. [Google Scholar] [CrossRef]
  21. Gorne, L.D.; Diaz, S.; Minden, V.; Onoda, Y.; Kramer, K.; Muir, C.; Michaletz, S.T.; Lavorel, S.; Sharpe, J.; Jansen, S.; et al. The acquisitive-conservative axis of leaf trait variation emerges even in homogeneous environments. Ann. Bot-Lond. 2022, 129, 709–722. [Google Scholar] [CrossRef] [PubMed]
  22. Wang, S.; Wang, W.; Wang, S.; Yang, L.; Gu, J. Intraspecific variations of anatomical, morphological and chemical traits in leaves and absorptive roots along climate and soil gradients: A case study with Ginkgo biloba and Eucommia ulmoides. Plant Soil 2021, 469, 73–88. [Google Scholar] [CrossRef]
  23. Baez, S.; Homeier, J. Functional traits determine tree growth and ecosystem productivity of a tropical montane forest: Insights from a long-term nutrient manipulation experiment. Glob. Chang. Biol. 2018, 24, 399–409. [Google Scholar] [CrossRef] [PubMed]
  24. Hurtado, P.; Prieto, M.; Aragon, G.; de Bello, F.; Martinez, I. Intraspecific variability drives functional changes in lichen epiphytic communities across Europe. Ecology 2020, 101, e03017. [Google Scholar] [CrossRef] [PubMed]
  25. Jung, V.; Albert, C.H.; Violle, C.; Kunstler, G.; Loucougaray, G.; Spiegelberger, T. Intraspecific trait variability mediates the response of subalpine grassland communities to extreme drought events. J. Ecol. 2014, 102, 45–53. [Google Scholar] [CrossRef]
  26. Benavides, R.; Valladares, F.; Wirth, C.; Mueller, S.; Scherer-Lorenzen, M. Intraspecific trait variability of trees is related to canopy species richness in European forests. Perspect. Plant Ecol. 2019, 36, 24–32. [Google Scholar] [CrossRef]
  27. Zhang, L.; Cappelli, S.L.; Huang, M.; Liu, X.; Xiao, Y.; Cardou, F.; Rong, Y.; Zhou, S. Intraspecific trait variability mediates the effect of nitrogen addition and warming on aboveground productivity. Oikos 2023, 2023, e09559. [Google Scholar] [CrossRef]
  28. Fu, H.; Yuan, G.; Jeppesen, E. Trait-based community assembly of submersed macrophytes subjected to nutrient enrichment in freshwater lakes: Do traits at the individual level matter? Ecol. Indic. 2020, 110, 105895. [Google Scholar] [CrossRef]
  29. Kraft, N.J.B.; Godoy, O.; Levine, J.M. Plant functional traits and the multidimensional nature of species coexistence. Proc. Natl. Acad. Sci. USA 2015, 112, 797–802. [Google Scholar] [CrossRef]
  30. Violle, C.; Enquist, B.J.; McGill, B.J.; Jiang, L.; Albert, C.H.; Hulshof, C.; Jung, V.; Messier, J. The return of the variance: Intraspecific variability in community ecology. Trends Ecol. Evol. 2012, 27, 244–252. [Google Scholar] [CrossRef]
  31. Hart, S.P.; Schreiber, S.J.; Levine, J.M. How variation between individuals affects species coexistence. Ecol. Lett. 2016, 19, 825–838. [Google Scholar] [CrossRef] [PubMed]
  32. Zheng, S.; Chi, Y.; Yang, X.; Li, W.; Lan, Z.; Bai, Y. Direct and indirect effects of nitrogen enrichment and grazing on grassland productivity through intraspecific trait variability. J Appl. Ecol. 2022, 59, 598–610. [Google Scholar] [CrossRef]
  33. Messier, J.; McGill, B.J.; Enquist, B.J.; Lechowicz, M.J. Trait variation and integration across scales: Is the leaf economic spectrum present at local scales? Ecography 2017, 40, 685–697. [Google Scholar] [CrossRef]
  34. E-Vojtko, A.; Junker, R.R.; de Bello, F.; Gotzenberger, L. Floral and reproductive traits are an independent dimension within the plant economic spectrum of temperate central Europe. New Phytol. 2022, 236, 1964–1975. [Google Scholar] [CrossRef] [PubMed]
  35. Lubbe, F.C.; Klimes, A.; Dolezal, J.; Jandova, V.; Mudrak, O.; Janecek, S.; Bartuskova, A.; Klimesova, J. Carbohydrate storage in herbs: The forgotten functional dimension of the plant economic spectrum. Ann. Bot-Lond. 2021, 127, 813–825. [Google Scholar] [CrossRef] [PubMed]
  36. de Souza, B.C.; Carvalho, E.C.D.; Oliveira, R.S.; de Araujo, F.S.; de Lima, A.L.A.; Rodal, M.J.N. Drought response strategies of deciduous and evergreen woody species in a seasonally dry neotropical forest. Oecologia 2020, 194, 221–236. [Google Scholar] [CrossRef]
  37. Onoda, Y.; Richards, A.E.; Westoby, M. The relationship between stem biomechanics and wood density is modified by rainfall in 32 Australian woody plant species. New Phytol. 2010, 185, 493–501. [Google Scholar] [CrossRef] [PubMed]
  38. Zhang, Y.B.; Yang, D.; Zhang, K.Y.; Bai, X.L.; Wang, Y.S.D.; Wu, H.D.; Ding, L.Z.; Zhang, Y.J.; Zhang, J.L. Higher water and nutrient use efficiencies in savanna than in rainforest lianas result in no difference in photosynthesis. Tree Physiol. 2022, 42, 145–159. [Google Scholar] [CrossRef] [PubMed]
  39. Jing, H.; Xiong, X.; Jiang, F.; Pu, X.; Ma, W.; Li, D.; Liu, Z.; Wang, Z. Climate change filtered out resource-acquisitive plants in a temperate grassland in Inner Mongolia, China. Sci. China Life Sci. 2023, 67, 403–413. [Google Scholar] [CrossRef] [PubMed]
  40. Sun, K.; Sun, R.; Li, Y.; Ji, H.; Jia, B.; Xu, Z. Plant economic strategies in two contrasting forests. BMC Plant Biol. 2023, 23, 366. [Google Scholar] [CrossRef]
  41. Deng, Y.; Deng, X.; Dong, J.; Zhang, W.; Hu, T.; Nakamura, A.; Song, X.; Fu, P.; Cao, M. Detecting growth phase shifts based on leaf trait variation of a canopy dipterocarp tree species (Parashorea chinensis). Forests 2020, 11, 1145. [Google Scholar] [CrossRef]
  42. Zhao, G.; Chen, F.; Yuan, C.; Yang, J.; Shen, Y.; Zhang, S.; Yang, J.; Ayemele, A.G.; Li, X.; Xu, J. Response strategies of woody seedlings to shading and watering over time after topsoil translocation in dry-hot karst region of China. For. Ecol. Manag. 2022, 519, 120319. [Google Scholar] [CrossRef]
  43. Xu, H.G.; Liu, S.R. Effects of soil salinization on halophytic vegetation. Inn. M. Pr. 2004, 16, 1–2. [Google Scholar]
  44. Zhang, C.; Wang, Y.; Jia, X.; Shao, M.a.; An, Z. Impacts of shrub introduction on soil properties and implications for dryland revegetation. Sci. Total Environ. 2020, 742, 140498. [Google Scholar] [CrossRef] [PubMed]
  45. Litalien, A.; Zeeb, B. Curing the earth: A review of anthropogenic soil salinization and plant-based strategies for sustainable mitigation. Sci. Total Environ. 2020, 698, 134235. [Google Scholar] [CrossRef] [PubMed]
  46. Liu, H.; Xu, C.; Allen, C.D.; Hartmann, H.; Wei, X.; Yakir, D.; Wu, X.; Yu, P. Nature-based framework for sustainable afforestation in global drylands under changing climate. Glob. Chang. Biol. 2022, 28, 2202–2220. [Google Scholar] [CrossRef] [PubMed]
  47. Dhehibi, B.; Fouzai, A.; Frija, A.; Adhim, M.A.; M’Hamed, H.C.; Ouerghemmi, H.; Rekik, M. Assessing complementary synergies for integrated crop-livestock systems under conservation agriculture in Tunisian dryland farming systems. Front. Sustain. Food Syst. 2023, 6, 1022213. [Google Scholar] [CrossRef]
  48. Su, N.; Zhao, Y.; Ding, G.; Duan, W. Relationships between key dryland ecosystem services: A case study in Ordos, China. Front. Earth Sci. 2022, 10, 937491. [Google Scholar] [CrossRef]
  49. Camara, A.S. Do woody plants create ‘fertile islands’ in dryland New Zealand? N. Z. J. Ecol. 2021, 45, 1–7. [Google Scholar] [CrossRef]
  50. Bao, S.D. Soil Agrochemical Analysis, 3rd ed.; Agriculture Press: Beijing, China, 2000. [Google Scholar]
  51. Carmona, C.P.; de Bello, F.; Mason, N.W.H.; Leps, J. Traits without borders: Integrating functional diversity across scales. Trends Ecol. Evol. 2016, 31, 382–394. [Google Scholar] [CrossRef]
  52. Carmona, C.P.; de Bello, F.; Mason, N.W.H.; Leps, J. Trait probability density (TPD): Measuring functional diversity across scales based on TPD with R. Ecology 2019, 100, e02876. [Google Scholar] [CrossRef] [PubMed]
  53. Duong, T. ks: Kernel density estimation and kernel discriminant analysis for multivariate data in R. J. Stat. Softw. 2007, 21, 1–16. [Google Scholar] [CrossRef]
  54. Fick, S.E.; Hijmans, R.J. WorldClim 2: New 1-km spatial resolution climate surfaces for global land areas. Int. J. Climatol. 2017, 37, 4302–4315. [Google Scholar] [CrossRef]
  55. Du, L.; Tian, S.C.; Zhao, N.; Zhang, B.; Mu, X.H.; Tang, L.S.; Zheng, X.J.; Li, Y. Evaluating soil acidification risk and its effects on biodiversity-ecosystem multifunctionality relationships in the drylands of China. For. Ecosyst. 2024, 11, 100178. [Google Scholar] [CrossRef]
  56. Batjes. World Soil Property Estimates for Broad-Scale Modelling (WISE30sec). (ISRIC Report; No. 2015/01). ISRIC—World Soil Information. 2015. Available online: https://edepot.wur.nl/400244 (accessed on 1 July 2015).
  57. R Core Team. R: A Language and Environment for Statistical Computing; R Foundation for Statistical Computing: Vienna, Austria, 2021; Available online: https://www.R-project.org/ (accessed on 1 July 2015).
  58. Dray, S.; Dufour, A.-B. The ade4 package: Implementing the duality diagram for ecologists. J. Stat. Softw. 2007, 22, 1–20. [Google Scholar] [CrossRef]
  59. Lefcheck, J.S. PIECEWISESEM: Piecewise structural equation modelling in R for ecology, evolution, and systematics. Methods Ecol. Evol. 2016, 7, 573–579. [Google Scholar] [CrossRef]
  60. Shipley, B. Confirmatory path analysis in a generalized multilevel context. Ecology 2009, 90, 363–368. [Google Scholar] [CrossRef] [PubMed]
  61. Chen, F.; Xie, T.; Yang, Y.; Chen, S.; Chen, F.; Huang, W.; Chen, J. Discussion of the “warming and wetting” trend and its future variation in the drylands of Northwest China under global warming. Sci. China Earth Sci. 2023, 66, 1241–1257. [Google Scholar] [CrossRef]
  62. Mason, N.W.H.; Mouillot, D.; Lee, W.G.; Wilson, J.B. Functional richness, functional evenness and functional divergence: The primary components of functional diversity. Oikos 2005, 111, 112–118. [Google Scholar] [CrossRef]
  63. Reich, P.B. The world-wide ‘fast-slow’ plant economics spectrum: A traits manifesto. J. Ecol. 2014, 102, 275–301. [Google Scholar] [CrossRef]
  64. Wright, I.J.; Reich, P.B.; Westoby, M. Strategy shifts in leaf physiology, structure and nutrient content between species of high- and low-rainfall and high- and low-nutrient habitats. Funct. Ecol. 2001, 15, 423–434. [Google Scholar] [CrossRef]
  65. LaForgia, M.L.; Harrison, S.P.; Latimer, A.M. Invasive species interact with climatic variability to reduce success of natives. Ecology 2020, 101, e03022. [Google Scholar] [CrossRef] [PubMed]
  66. Mendez-Toribio, M.; Ibarra-Manriquez, G.; Paz, H.; Lebrija-Trejos, E. Atmospheric and soil drought risks combined shape community assembly of trees in a tropical dry forest. J. Ecol. 2020, 108, 1347–1357. [Google Scholar] [CrossRef]
  67. Wang, X.G.; Lu, X.T.; Zhang, H.Y.; Dijkstra, F.A.; Jiang, Y.G.; Wang, X.B.; Lu, J.Y.; Wuyunna; Wang, Z.W.; Han, X.G. Changes in soil C:N:P stoichiometry along an aridity gradient in drylands of northern China. Geoderma 2020, 361, 114087. [Google Scholar] [CrossRef]
  68. Wertin, T.M.; Reed, S.C.; Belnap, J. C3 and C4 plant responses to increased temperatures and altered monsoonal precipitation in a cool desert on the Colorado Plateau, USA. Oecologia 2015, 177, 997–1013. [Google Scholar] [CrossRef] [PubMed]
  69. Andrews, H.M.; Krichels, A.H.; Homyak, P.M.; Piper, S.; Aronson, E.L.; Botthoff, J.; Greene, A.C.; Jenerette, G.D. Wetting-induced soil CO2 emission pulses are driven by interactions among soil temperature, carbon, and nitrogen limitation in the Colorado Desert. Glob. Chang. Biol. 2023, 29, 3205–3220. [Google Scholar] [CrossRef] [PubMed]
  70. Wang, J.; Wen, X. Divergent responses of nitrogen availability to aridity in drylands. Plant Soil 2023, 482, 111–125. [Google Scholar] [CrossRef]
  71. Zhang, X.; Hasi, M.; Li, A.; Tan, Y.; Daryanto, S.; Wang, L.; Zhang, X.; Chen, S.; Huang, J. Nitrogen addition amplified water effects on species composition shift and productivity increase. J. Plant Ecol. 2021, 14, 816–828. [Google Scholar] [CrossRef]
  72. Zhou, X.B.; Zhang, Y.M. Review on the ecological effects of N deposition in arid and semi-arid areas. Acta Ecol. Sin. 2009, 29, 3835–3845. [Google Scholar]
  73. Zhang, Q.; Wang, Q.; Zhu, J.; Xu, L.; Li, M.; Rengel, Z.; Xiao, J.; Hobbie, E.A.; Piao, S.; Luo, W.; et al. Higher soil acidification risk in southeastern Tibetan Plateau. Sci. Total Environ. 2021, 755, 143372. [Google Scholar] [CrossRef]
  74. Lohbeck, M.; Poorter, L.; Lebrija-Trejos, E.; Martinez-Ramos, M.; Meave, J.A.; Paz, H.; Perez-Garcia, E.A.; Eunice Romero-Perez, I.; Tauro, A.; Bongers, F. Successional changes in functional composition contrast for dry and wet tropical forest. Ecology 2013, 94, 1211–1216. [Google Scholar] [CrossRef] [PubMed]
  75. Neyret, M.; Bentley, L.P.; Oliveras, I.; Marimon, B.S.; Marimon-Junior, B.H.; de Oliveira, E.A.; Passos, F.B.; Castro Ccoscco, R.; dos Santos, J.; Reis, S.M.; et al. Examining variation in the leaf mass per area of dominant species across two contrasting tropical gradients in light of community assembly. Ecol. Evol. 2016, 6, 5674–5689. [Google Scholar] [CrossRef] [PubMed]
  76. Wood, C.M.; McKinney, S.T.; Loftin, C.S. Intraspecific functional diversity of common species enhances community stability. Ecol. Evol. 2017, 7, 1553–1560. [Google Scholar] [CrossRef]
  77. Mayfield, M.M.; Levine, J.M. Opposing effects of competitive exclusion on the phylogenetic structure of communities. Ecol. Lett. 2010, 13, 1085–1093. [Google Scholar] [CrossRef]
Figure 1. Conceptual diagram depicting environmentally driven community assembly processes of shrublands in northwest China. On the right panel, different colors represent different species. T I C : I R is the external filtering strength (“T” for various traits); σ I C 2 is the variation coefficient of an individual trait at community level (community level); σ I R 2 is the variation coefficient of an individual trait at regional scale (regional level). T I P : I C is the internal filtering strength (“T” for various traits); σ I P 2 is the trait variation coefficient of individuals species within local community (population level); σ I C 2 is the variation coefficient of an individual trait at community level (community level).
Forests 15 00911 g001
Figure 2. Geographical distribution of the sampling plots. Each black point represents an individual sampling plot. The map was edited based on standard national boundary (GS(2023)2767), and the boundary was not modified.
Forests 15 00911 g002
Figure 3. Classification of resource-use strategies for shrublands in northwest China. The division of plant resource-use strategies based on cluster analysis of six functional traits, and the clustering results are shown in Figure S1. Species names are shown under the corresponding catalogs. SLA, specific leaf area; WD, wood density; Canopy, shrub canopy; Height, shrub height; Leaf N, leaf N concentration; Leaf P, leaf P concentration.
Forests 15 00911 g003
Figure 4. Geographical distribution of (a) acquisitive, (b) medium, and (c) conservative and (d) their environment conditions, respectively, in northwest China. In (d), different lowercase letters indicate significant differences (p < 0.05) under multiple comparisons (least significance difference).
Forests 15 00911 g004
Figure 5. Projection of two main axes of co-inertia analysis (COIA) for 30 shrub species: variable loadings for dataset including (a) three traits, (b) six traits, and (c) a joint representation of species scores from the three traits (arrow tips) and six trait (dots) data sets. WD, wood density; SLA, specific leaf area; Canopy, shrub canopy; Height, shrub height; Leaf N, leaf N concentration; Leaf P, leaf P concentration.
Forests 15 00911 g005
Figure 6. Distribution of (a) SLA (specific leaf area), (c) WD (wood density), and (e) Canopy (shrub canopy) and their functional redundancy (b,d,f) affected species richness and AGB (aboveground biomass) in northwest China. Different lowercase letters indicate significant differences (p < 0.05) under multiple comparisons (least significance difference). SD, standard deviation; CV, the variation coefficient of plant trait; FRedSLA, functional redundancy of specific leaf area; FRedWD, functional redundancy of wood density; FRedcanopy, functional redundancy of shrub canopy.
Forests 15 00911 g006
Figure 7. Environment affecting mean shrub functional traits of (a) SLA (specific leaf area), (b) WD (wood density), and (c) Canopy (shrub canopy) in northwest China. In (ac), on the left, solid and blank circles represent significant and non-significant standardized path relationships of LRA, respectively; error bars represent the 95% confidence intervals of parameter estimates; and on the right, the percentage of variation explained by each LRA model across all species are shown. Asterisk indicates significant relationships: * p < 0.05, *** p < 0.001. Cli PC1 and PC2, the first and second principal component axis of climatic predictors, respectively; H+ input, atmospheric acid deposition; Soil PC1 and PC2, the first and second principal component axis of soil predictors, respectively.
Forests 15 00911 g007
Figure 8. External (TIC:IR; (a,b) and internal (TIP:IC; (c,d) filtering processes on three plant functional traits influenced species richness and AGB (aboveground biomass) in northwest China. Solid and dashed lines denote significant and non-significant liner regression analysis, respectively. Only R2 and p values with significant relationship are shown. Canopy, shrub canopy; SLA, specific leaf area; WD, wood density.
Forests 15 00911 g008
Figure 9. Final pSEM of environmentally driven external and internal filtering processes on species richness and AGB (aboveground biomass) in northwest China (a), with the goodness of model evaluation as AIC = 4736, Fisher’s C = 22.78, df = 24, and p-value = 0.27, and the direct and indirect effects extracted from pSEM, affecting (b) species richness and (c) aboveground biomass. In (a), black and red lines/numbers represent positive and negative relationships (p < 0.05), respectively; gray and dashed lines denote insignificant path relationships (p > 0.05); single-headed and double-headed arrows represent causal pathways and co-varying relationships, respectively; and the variation of endogenous variable explained by each liner regression model are presented as R2. Cli PC1 and PC2, the first and second principal component axis of climate predictors, respectively; Soil PC1 and PC2, the first and second principal component axis of soil predictors, respectively; WD, wood density; SLA, specific leaf area; SLAIC:IR, external filtering of specific leaf area; SLAIP:IC, internal filtering of specific leaf area; FRedSLA, functional redundancy of specific leaf area.
Forests 15 00911 g009
Disclaimer/Publisher’s Note: The statements, opinions and data contained in all publications are solely those of the individual author(s) and contributor(s) and not of MDPI and/or the editor(s). MDPI and/or the editor(s) disclaim responsibility for any injury to people or property resulting from any ideas, methods, instructions or products referred to in the content.

