Abstract
Allometry reflects the quantitative relationship between the allocation of resources among different organs. Understanding patterns of forest biomass allocation is critical to comprehending global climate change and the response of terrestrial vegetation to climate change. By collecting and reorganizing the existing allometric models of tree species in China, we established a database containing over 3000 empirical allometric models. Based on this database, we analyzed the model parameters and the effect of climate on forest biomass allocation under the context of ‘optimal allocation theory’. We showed that (1) the average and median exponent of power functions for above-ground biomass were 2.344 and 2.385, respectively, which significantly deviated from the theoretical prediction of 2.667 by metabolic theory (p < 0.01). (2) The parameters of the allometric model were not constant, and not significantly correlated with temperature, precipitation, latitude, and elevation (p > 0.05), but were more closely related to individual size (p < 0.01). (3) Among different types of forests, the proportion of above-ground biomass in tropical rainforests and subtropical evergreen rainforests was significantly higher than that in temperate forests and boreal forests (p < 0.05). The proportion of trunk and branch biomass allocated to tropical rainforest was significantly higher than that of boreal forest (p < 0.05), while the proportion of root and leaf biomass allocated to tropical rainforest was significantly lower than that of boreal forest (p < 0.05). (4) The abiotic environment plays a crucial role in determining the allocation of plant biomass. The ratio of below-ground/above-ground biomass is significantly and negatively correlated with both temperature and rainfall (p < 0.01), and significantly and positively correlated with altitude and latitude (p < 0.01). This means that as temperature and rainfall increase, there is a decrease in the amount of biomass allocated to below-ground structures such as roots. On the other hand, as altitude and latitude increase, there is an increase in below-ground biomass allocation. These findings highlight the importance of considering the influence of abiotic factors on plant growth and development.
1. Introduction
Forest ecosystems cover 31% of the Earth’s land area and contain at least 80% of the planet’s terrestrial biomass. They are the largest carbon reservoir in the world and play a crucial role in the global carbon cycle. These ecosystems are essential for regulating the global carbon balance and mitigating the impacts of climate change [1,2]. Therefore, there is an urgent need for fast and easy methods to accurately assess the biomass of forest ecosystems. While several techniques, such as remote sensing and modeling, exist for estimating forest biomass at different scales, they all rely on a single tree allometric model [2].
The relationship between the size of an organism and its body structure and function is known as allometry [3,4]. As early as the 1880s, Rubner proposed that an organism’s metabolic rate is proportional to the 2/3 power of its body size [5]. This concept of a 2/3 proportional index has been widely accepted and proven [6,7,8,9,10]. Later, Huxley discovered that the growth rates of different tissues in an animal can be expressed using a typical power function as,
where Y is the biological characteristic, M is the individual size, Y0 is the allometric constant, and b is the weighting exponent (scaling exponent) [3,4].
Based on this, Brody et al. and Kleiber further proposed Kleiber’s law, stating that the basal metabolic rate of an animal is exponentially closer to 3/4 than to 2/3 of its individual size [11,12,13]. They also suggested that this rule may also apply to plants. This “3/4 scale rule” was later found to govern many other phenomena, including those relating to plants, and has received considerable support [14,15,16,17,18,19,20].
In 1997–2000, Geoffrey West, James Brown, and Brian Enquist proposed a special scaling rule between individual size and function. This resulted in the well-known fractal-like resource distribution networks model (WBE) [21,22,23,24]. According to this theory, all living organisms rely on a fractal distribution network within their bodies. This network supplies the necessary substances to sustain life in different parts of the organism. These networks are designed to help organisms make the most of their resources, while also minimizing potential resistance and risks, and maximizing the area for resource exchange with the environment (such as root and leaf areas). This concept has been extensively studied and developed by various researchers, leading to the discovery of a common set of 1/4 scale relationships among organisms [21,22,23,24,25]. This theory, known as WBE, is currently considered the most comprehensive explanation for allometry. However, it has also faced criticism and challenges from other theoretical perspectives [26,27].
The biomass allometric equation allows researchers to estimate the biomass of organisms by measuring certain morphological characteristics. This quantitative relationship is expressed as the equation between plant diameter at breast height (D) and biomass (M),
where a is the base value, the exponent b of above-ground plant biomass is theoretically equal to 8/3 (≈2.667) [22]. The b value was suggested to be independent of biological species or habitat [28]. Because this scaling relationship reflects the minimum physiological constraints on the transport of plant resources through the network from the exchange surface to the metabolic organization, it is dependent on the optimal structure of the tree [21,22,23,24].
Although this theoretical scaling index has been empirically validated from multiple datasets around the globe [29], there have been numerous studies that have found the above-ground biomass allometric parameter b to be statistically different from 2.667 [30,31]. Plants distribute the organic matter produced from photosynthesis to different parts of their body, resulting in varying proportions of biomass in each organ. This allocation process is influenced by factors such as resource availability and climate, which in turn affect productivity, fluxes, and other important processes within an ecosystem [32]. From an allometric perspective, allocation is a size-dependent process. Allometry refers to the quantitative relationship between the allocation of resources among different organs [33]. As resources allocated to one function or organ cannot be allocated to other functions or organs, allocation implies making trade-offs. Therefore, there have been attempts to investigate the relationship between resource allocation in the plant growth process from an economic perspective. It is believed that to succeed in the competition, any production should aim to minimize costs and payments while maximizing profits. This suggests that internal resources must be optimally allocated between competing processes [34]. Thus, according to the optimal allocation theory, plants make physiological adjustments in both short-term and long-term adaptation to acquire more available resources in organs that receive limited resources [34,35]. The way plants distribute their biomass, particularly below-ground and above-ground, is influenced by environmental changes [36]. For instance, warmer temperatures can increase the above-ground allocation of plant biomass [37], while higher precipitation usually decreases the proportion of below-ground biomass [38]. However, predicting the effects of climate on plant biomass allocation becomes difficult at larger regional scales due to its complexity and variability.
In this study, we established a database containing over 3000 empirical models of biomass allometry by collecting and organizing existing biomass allometric models of tree species in China. Our aim was to explore the following questions: (1) Does the allometric parameters, specified to be a and b here, vary with the environment or remain constant? (2) Based on the allometry database, what are the characteristics of forest biomass allocations among different forest types in China? (3) According to optimal allocation theory, does the proportion of below-ground/above-ground biomass decline with increasing temperature or rainfall?
2. Materials and Methods
2.1. WBE Model
The WBE model is an integrated model based on the branching geometry of plants, plant hydrodynamics, and biomechanics [21,22,23,24,25]. The model assumes that (1) organisms are filled with branching networks; (2) the number of end branches of the network (e.g., leaves and petioles) is an invariant constant; (3) biomechanical constraints are homogeneous; and (4) the energy required to allocate resources is minimized or energy dissipation is minimized [21,22,23,24,25].
According to model theory, there are three parameters that constitute the framework of the pipeline network, a, ā and n [21]. The exponents a and ā determine the scaling relationship between the branching radii of branches and tubes scale within a plant, respectively [21,22]. The a is determined by mechanical constraints, and the ā is determined by hydrodynamic forces [21,22]. According to this scaling relationship, there is a 3/4 exponential relationship between metabolic rate and individual size and an 8/3 exponential relationship between individual radius and biomass.
2.2. Database on Allometric Model
Diameter at breast height (DBH) is an important and reliable measurement in tree research and has been found to be highly correlated with plant biomass [39,40]. Utilize the CNKI https://www.cnki.net/ (accessed on 16 March 2022) and the VIP http://qikan.cqvip.com/ (accessed on 25 March 2022), Wanfang Data http://g.wanfangdata.com.cn/ (accessed on 4 April 2022), using keywords such as “forest biomass”, “biomass equation”, and “allometric”, collect relevant literature on allometric models in different regions of China. Finally, 977 articles published from 1979 to 2023 were selected. Based on this literature, we created a database containing 3557 empirical models that capture the allometric relationships between DBH and plant biomass. The model takes the form of a power function with DBH as a single variable (Model 2). The database also includes tree species information, research objects, fitting data, site information, and citation information. Tree species information includes the names of tree species, the origin of the stand (including plantation, virgin forest, and secondary forest), and the type of forest (including tropical rainforest, subtropical evergreen forest, temperate forest, boreal forest, and others). Research objects are categorized into trunk, branch, leaf, above-ground, below-ground/root, and whole, based on plant organs/parts. The information used for fitting includes the parameters of the allometric model (a, b), coefficient of determination (R2), fitting sample (n), starting diameter at breast height (Dmin, cm), and maximum diameter at breast height (Dmax, cm). Site information such as latitude and longitude (°), mean annual temperature (°C), mean annual rainfall (mm), and altitude (m) of the study site was also included. Our final database consisted of 163 deciduous and 195 evergreen tree species, totaling 407 tree species from 190 genera and 77 families, covering 911 study sites in various regions of China (Figure 1).
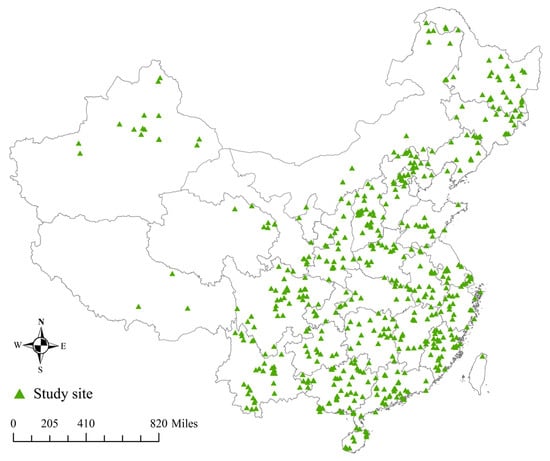
Figure 1.
Distribution of study sites in China.
2.3. Parameters of the Allometric Model
Before using the allometric model, we screened the data. Literature studies with coefficients of determination less than 0.80 were first excluded. And extreme outliers (which are usually biologically improbable if they are extreme outliers) were eliminated. We transform the allometric model logarithmically beforehand to give the data a normal distribution.
Although this change may introduce a new bias, it has become a commonly used method in the study of allometry [41].
This is because temperature and humidity can both significantly impact the size and functioning of trees in forests, and may also play a key role in shaping geographic patterns related to latitude and elevation (Figure 2). Our study focused on the influence of environmental factors on allometric model parameters, specifically mean annual temperature, mean annual rainfall, altitude, and latitude. To better understand these relationships, mean annual temperature was divided into five levels: <5 °C, 5–10 °C, 10–15 °C, 15–20 °C, and ≥20 °C, with each level representing a 5 °C difference. Additionally, based on mean annual rainfall, climate types were classified as semi-arid (<500 mm), semi-humid (500–800 mm), and humid (<800 mm). Taking into consideration China’s national conditions, the mean annual rainfall was further divided into four levels: <500 mm, 500–800 mm, 800–1200 mm, and ≥1200 mm. The land on our planet is classified into five main types of land-forms based on altitude: plateaus (>1000 m), mountains (500–1000 m), hills (200–500 m), plains (0–200 m), and basins (−200–0 m). After collecting data, we divided the altitude into four levels: <200 m, 200–500 m, 500–1000 m, and ≥1000 m. Considering the distribution range of our country, the latitude is divided into four levels, with each level covering a range of 10°: 15–25°, 25–35°, 35–45°, and 45–55°. In order to further explore the impact of the environment on various organ parameters, we divided temperature, annual rainfall, altitude, and latitude into different levels.
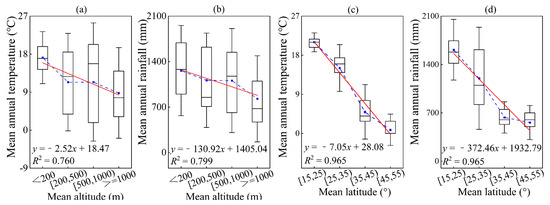
Figure 2.
The variation in temperature and rainfall changing along with the average values of altitude and latitude. Among them, (a,b) altitude; (c,d) latitude; (a,c) temperature; (b,d) rainfall. The blue square in the box plot represents the average value. The red solid line is a linear fitting line.
2.4. Allocation of Biomass
The biomass of individual samples was initially calculated using the heterogeneous growth model. Next, the overall forest biomass was determined based on the diameter distribution of trees. Furthermore, the biomass allocation of different parts of each forest was calculated. Finally, the impact of climate on biomass allocation was evaluated. The effect of climate on biomass allocation was assessed by considering the mean annual temperature and mean annual precipitation.
The size distribution of trees in a forest can often be understood by fitting their diameters to different models, such as the exponential, log-normal, and Weibull models [42]. Among these, the Weibull model has been found to be particularly applicable to both natural forests and plantations [43]. In this study, we utilized a three-parameter Weibull model to describe the distribution of tree diameters in the forest:
where a is the location parameter, b is the scale parameter and c is the shape parameter.
2.5. Analysis of Statistical Differences
The independent sample t-test was used to compare statistical differences in coefficients between different organs. Furthermore, the relationship between environmental factors and model coefficients, as well as forest biomass allocation, was analyzed using Person correlation analysis. All calculations and statistical analyses in this study were performed using Python 3.8. Additionally, plots were created using Origin 2021.
3. Results
3.1. Parameters of the Allometric Model
We analyzed a total of 2324 empirical allometric models of biomass. The results revealed that the parameters of the allometric model were not consistent. Parameter a ranged from 0.001 to 0.981 (Mean = 0.074, SD = 0.153), while parameter b ranged from 1.082 to 4.892 (Mean = 2.365, SD = 0.630) (Figure 3). The average values of parameter b for trunk, branch, leaf, and root were 2.390, 2.518, 2.239, and 2.276, respectively. Independent samples t-tests showed that the parameter b for the leaf was significantly smaller compared to that of the trunk, branch, and root (p = 0.0001, p < 0.01) (Table S1). The parameter b for the branch was significantly greater than that of the trunk, leaf, and root (p = 0.0001, p < 0.01). There was no significant difference in the parameter b between above-ground and whole (p = 0.574, p > 0.05), while the parameter b for below-ground was significantly smaller than that of above-ground and whole (p = 0.020, p < 0.05). Specifically, the range of the above-ground parameter b varied between 1.209 and 3.208 (SD = 0.391), with an average of 2.344 and a mid-point of 2.385. These values were found to be significantly different from the expected value of 8/3 (≈2.667) according to the WBE model (p = 0.0001, p < 0.01). This suggests that the actual values of b deviate from the theoretical prediction.
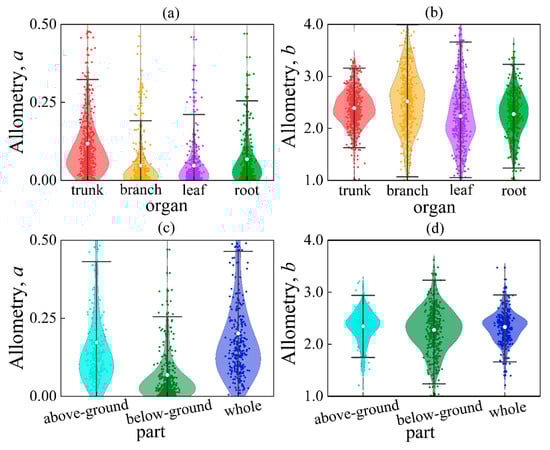
Figure 3.
Comparison of parameters a or b between different organs/parts. Among them, (a) parameters a for different organs; (b) parameters b for different organs; (c) parameters a for different parts; (d) parameters b for different organs. The white circle in the box plot represents the average value.
The analysis of log-transformed parameter a and parameter b revealed a strong and significant negative relationship (p = 0.0001, p < 0.01) between the parameters of various organs. In fact, the coefficients of determination were above 0.70 for all cases (see Figure 4), indicating a high level of correlation.
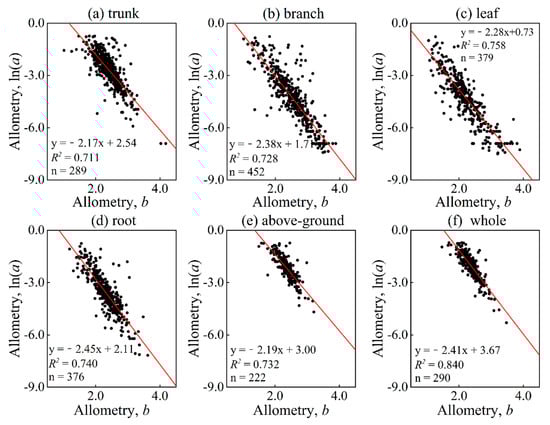
Figure 4.
Relation between parameters a and b distinguished in different organs and parts. Among them, (a–f) represent the trunk, branch, leaf, root, above-ground, and whole, respectively. The red solid line is a linear fitting line.
We examined the impact of temperature, rainfall, altitude, and latitude on various organ parameters and found that the overall allometric model parameters a and b were not directly associated with these factors (p > 0.05) (Figures S1–S4). Furthermore, there was no significant correlation between temperature and the different organ parameters a and b (p = 0.303, p > 0.05) (Figure 5a,b). As temperatures increased, the different organ parameters a or b showed a similar trend, with intermittent changes of decrease and increase. Interestingly, parameters a and b exhibited opposite variations, with parameter a decreasing when parameter b was elevated. With the increase in rainfall, only the parameter a of the trunk showed a significant and positive correlation with rainfall (y = 0.01x + 0.09, R2 = 0.938) (p = 0.001, p < 0.01). However, the rest of the organ parameter b did not show a significant correlation with rainfall (p = 0.124, p > 0.05) (Figure 5c,d). This suggests that different plant organs respond differently to changes in temperature and rainfall. As altitude or latitude increases, the parameters of the trunk and branch change more significantly, while the parameters of the leaf and root show less change (Figure 5e–h). The parameters of different organs do not have a direct relationship with altitude or latitude (p > 0.05).
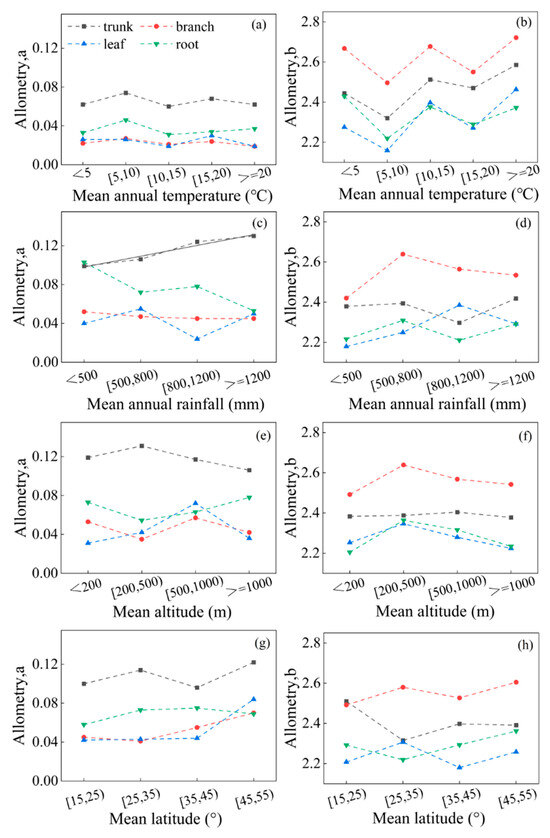
Figure 5.
The variation of parameters in different organs changing with average values of temperature, rainfall, altitude, and latitude. Among them, (a,c,e,g) parameter a; (b,d,f,h) parameter b; (a,b) temperature; (c,d) rainfall; (e,f) altitude; (g,h) latitude. The black solid line is a linear fitting line.
3.2. Distributional Characteristics of Forest Biomass
The above-ground biomass makes up approximately 80.0% of the total biomass, which is about four times that of the below-ground biomass in the same forest type (Figure 6a). The largest proportion of above-ground biomass was found in tropical rainforests at 83.38%, followed by subtropical evergreen forests at 83.25% and temperate forests at 78.28%. Boreal forests had the smallest above-ground biomass at only 76.17%. The differences between these regions were statistically significant, with tropical rainforests and subtropical evergreen forests allocating more above-ground biomass compared to temperate and boreal forests (p < 0.05). This suggests that plants in warmer and wetter regions tend to allocate more biomass above-ground.
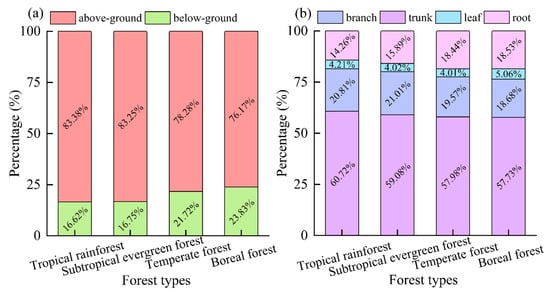
Figure 6.
Percentage of biomass of different organs/parts of different forest types. Among them, (a) percentage of biomass of above-ground and below-ground; (b) percentage of biomass of trunk, branch, leaf, and root.
When looking at the different organs, the trunk of a tree holds the most biomass, making up about 60.0% of the total. This is followed by the branches and roots, which account for about 35.0% of the total biomass. The leaves, on the other hand, only make up a small proportion of about 5.0% of the whole biomass (Figure 6b). Among the different types of forests, the tropical rainforest has the highest proportion of trunk biomass at 60.73%, while the boreal forest has the lowest at 57.73%. It is worth noting that the proportion of trunk biomass in tropical rainforests and subtropical evergreen forests is significantly higher than that in temperate forests and boreal forests (p < 0.05). Additionally, the proportion of branch biomass in tropical rainforests is significantly higher than that in boreal forests, and the proportion of root biomass in tropical rainforests is significantly lower than that in boreal forests (p < 0.05). This emphasizes the importance of the trunk in storing the majority of a tree’s biomass, particularly in tropical and subtropical forests. Therefore, the trunk plays a crucial role in the overall health and growth of a tree. The proportion of leaf biomass in boreal forests is notably higher compared to other forest types (p < 0.05). This indicates that plants in the tropics primarily increase their above-ground biomass by distributing a larger amount of trunk and branch biomass.
Correlation analysis revealed that trunk biomass was significantly and positively associated with the biomass of other organs, while the proportion of trunk biomass to the total biomass showed a significant and negative correlation with the proportion of other organs to the total biomass (p = 0.0001, p < 0.01) (Table 1 and Table 2). This suggests that as the tree grows, the trunk biomass and its contribution to the total biomass increase gradually. However, the leaf and branch biomass did not show significant correlations with either the biomass or the proportion of above-ground and below-ground biomass (p > 0.05). Interestingly, there was a highly significant positive correlation between leaf and branch biomass (p = 0.0001, p < 0.01), and a significant positive correlation (p = 0.011, p < 0.05) between their proportion to the total biomass. This indicates that the allocation of leaf biomass is primarily influenced by branch biomass rather than other organs.

Table 1.
The correlation between biomass of different organs/parts.
Table 2.
The correlation between biomass of different organs/parts and the proportion of whole biomass.
3.3. Factors That Affect Forest Biomass Allocation
As temperature increases, the proportion of whole biomass accounted for by different organs also changes (Figure 7a). The proportion of trunk to whole biomass is positively correlated with temperature (p = 0.0001, p < 0.05), while the proportion of branch and root to whole biomass is negatively correlated with temperature (p = 0.019, p < 0.05). Additionally, the ratio of below-ground/above-ground biomass decreases with increasing temperature (y = −0.02x + 0.31, R2 = 0.959) (p = 0.0001, p < 0.01). On average, the ratio of below-ground/above-ground biomass decreases by 2.08% for every 5 °C increase in mean annual temperature (Figure 7b). This trend is primarily driven by the ratio of above-ground/whole biomass increasing with temperature (y = 0.01x + 0.76, R2 = 0.905) (p = 0.0001, p < 0.01). Furthermore, changes in above-ground biomass with temperature are mainly due to an increase in the ratio of trunk/above-ground biomass (y = 0.01x + 0.62, R2 = 0.784) (p = 0.036, p < 0.05) (Figure 7c). These findings suggest that temperature plays a significant role in the allocation of forest biomass to different organs. The ratio of above-ground to whole biomass and the ratio of trunk to above-ground biomass increased by an average of 1.15% and 0.80%, respectively, for every 5 °C rise in mean annual temperature. This finding suggests that as temperatures continue to increase, there will be a corresponding increase in the above-ground-to-whole biomass and trunk-to-above-ground biomass ratios. This could have significant implications for the whole biomass and structure of plant communities.
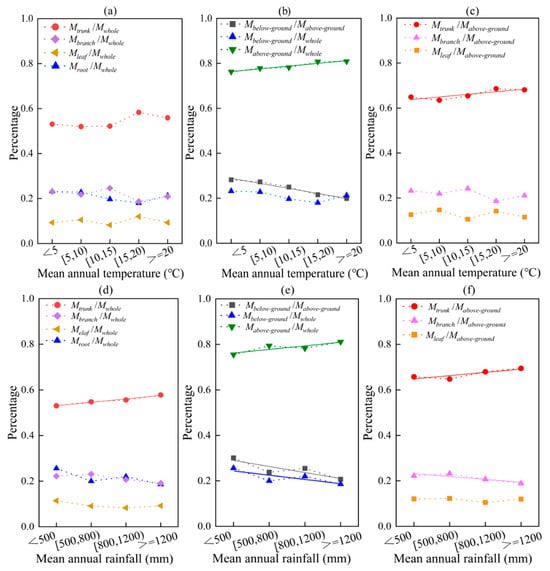
Figure 7.
The effects of average values of temperature and rainfall on biomass allocation in different organs/parts. Among them, (a–c) temperature; (d–f) rainfall. The solid line is a linear fitting line.
The proportion of trunk-only biomass to the total biomass in different organs increased (y = 0.02x + 0.52, R2 = 0.957) with increasing rainfall (p = 0.020, p < 0.05) (Figure 7d). The ratio of below-ground/above-ground biomass decreased with increasing rainfall (y = −0.03x + 0.32, R2 = 0.760) (p = 0.0001, p < 0.01), and for every 300 mm increase in mean annual rainfall, the ratio of below-ground/above-ground biomass decreased by an average of 3.13%. This was a result of both the increase in above-ground biomass with increasing rainfall (y = 0.02x + 0.76, R2 = 0.743) (p = 0.031, p < 0.05) and the decrease in below-ground biomass with increasing rainfall (y = −0.02x + 0.26, R2 = 0.654) (p = 0.0001, p < 0.01) (Figure 7e). Like temperature, the above-ground biomass varied with rainfall due to the increase in the ratio of trunk/above-ground biomass with temperature (y = 0.014x + 0.64, R2 = 0.756) (p = 0.025, p < 0.05) (Figure 7f). As the temperature and rainfall increased, the proportion of branch/above-ground biomass showed a decreasing trend (y = −0.012x + 0.24, R2 = 0.730) (p = 0.0001, p < 0.01). This suggests that the plants gradually allocated more biomass to their trunk, resulting in an increase in above-ground biomass and a decrease in the ratio of below-ground/above-ground biomass allocation. Interestingly, there was no significant correlation between temperature, rainfall, and leaf biomass allocation (p = 0.230, p > 0.05). This indicates that factors other than temperature and rainfall may be responsible for the allocation of biomass in the leaves.
As the altitude increases, the amount of tree branches, leaves, and roots in relation to the total biomass all show an upward trend, except for the trunk (Figure 8a). The proportion of trunk to total biomass decreases with increasing altitude (y = −0.02x + 0.61, R2 = 0.707) (p = 0.0001, p < 0.01), while the proportion of leaf to total biomass increases (y = 0.01x + 0.01, R2 = 0.958) (p = 0.027, p < 0.05). The ratio of below-ground/above-ground biomass also increases with altitude (y = 0.01x + 0.21, R2 = 0.730) (p = 0.031, p < 0.05), with an average increase of 1.01% for every 500 m in altitude (Figure 8b). This is mainly caused by the decrease in the proportion of above-ground to total biomass with increasing altitude (y = −0.004x + 0.82, R2 = 0.896) (p = 0.380, p > 0.05).
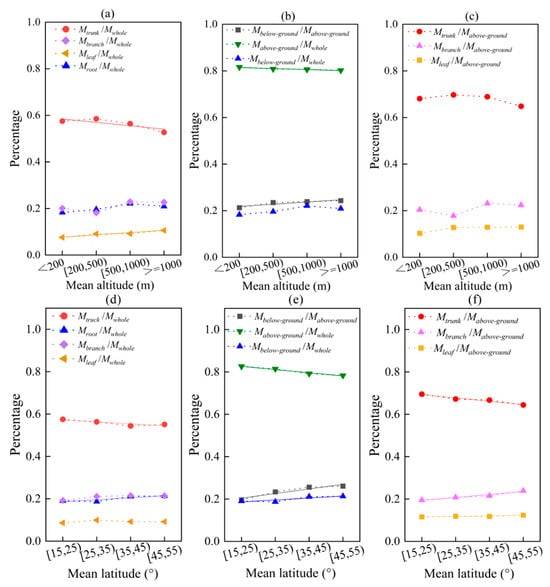
Figure 8.
The effects of average values of altitude and latitude on biomass allocation in different organs/parts. Among them, (a–c) altitude; (d–f) latitude. The solid line is a linear fitting line.
The proportion of trunk to total biomass decreases as latitude increases (y = −0.01x + 0.58, R2 = 0.741) (p = 0.252, p > 0.05), while the proportion of root to total biomass increases with increasing altitude (y = 0.01x + 0.18, R2 = 0.774) (p = 0.021, p < 0.05) (Figure 8d). The ratio of below-ground/above-ground biomass also increases with increasing latitude (y = 0.02x + 0.18, R2 = 0.845) (p = 0.0001, p < 0.01), with an average increase of 1.01% in the below-ground to above-ground biomass ratio for every 10° increase in latitude (Figure 8e). This is a result of the combined effects of the decrease in above-ground biomass with increasing latitude (y = −0.02x + 0.84, R2 = 0.774) (p = 0.0001, p < 0.01), and the increase in below-ground biomass with increasing latitude (y = 0.01x + 0.18, R2 = 0.774) (p = 0.036, p > 0.05). The decrease in above-ground biomass is mainly due to a significant decrease in trunk biomass with increasing latitude (y = 0.02x + 0.71, R2 = 0.926) (p = 0.0001, p < 0.01) (Figure 8f).
4. Discussion
4.1. Allometric Parameters
Allometric scale relationships play a crucial role in modern biology. The WBE model suggests that plants and animals have invariant 1/4 scale relationships [21,22,23,24,28]. However, our findings do not support this conclusion as we discovered a scale index distribution ranging from 1.209 to 3.208 (SD = 0.391) (Figure 3). According to the WBE model, all living organisms maintain their life activities through a fractal distribution network [21,22,23,28]. However, no experiment has ever been able to demonstrate that branch transport structures at all levels of the plant grow and develop strictly according to the WBE model [44]. Additionally, it is unlikely that different trees are structurally identical [45]. Therefore, using the same parameter “b” regardless of its magnitude is hardly acceptable. The scale index of plants should be universally variable [46,47,48,49,50], and the range of scale index can vary significantly even within the same species [47]. The 2/3 and 3/4 scale index are both exceptional values [51].
The statistical analysis revealed that the average and median values of the allometric model parameter b for above-ground biomass were 2.344 and 2.385, respectively. Both values were significantly different from the theoretical value of 2.667 for the WBE model (p = 0.0001, p < 0.01) (Figure 3). In fact, several studies have demonstrated that the allometric scale index for above-ground biomass is statistically different from 8/3. For instance, Chen and Zhu calculated the biomass of 10 tree species in northeastern China and found that the average value of the allometric model parameter b for above-ground biomass was 2.33 [52]. Chroust measured the biomass of various plants in the European region and noted that the mean value of the allometric model parameter b for above-ground biomass was 2.32 [53]. These studies have been conducted in various regions around the world, indicating that the average value for the above-ground biomass allometric model parameter b should be around 2.30 [30,31,54,55,56] (Table S2). Our findings align more closely with this value. Therefore, we propose that the parameter b of the above-ground biomass allometric model should be approximately 2.33 instead of 2.67.
The statistical difference between the theoretical and empirical values of biomass scale indices of plant above-ground parts has been explained based on fractal geometry [57,58]. The above-ground portion of a plant can be viewed as a cone with non-integer dimensions, and its volume can be approximated as , where D0 is the trunk base diameter and H is the tree height. It is generally accepted that tree height is proportional to basal diameter, while mass is proportional to volume. Thus, , b0 is a scaled relationship between tree height and diameter. Therefore, the mass-to-diameter scale relationship should have a magnitude between 2 and 3. Since the cone volume is 1/3 that of the cylinder, the tree height-diameter scaling relation b0 should be equal to 1/3. Thus, the plant diameter-biomass scaling index should be approximately equal to , not 2.67. This is also close to our results.
There was a significant negative correlation between parameter a and parameter b for different organs (Figure 4). This result has been widely observed [29,58,59,60]. It has been suggested that this correlation may be related to the plant’s mechanical load-bearing ability [58]. However, White and Gould argued that the relationship between parameter a and parameter b is due to the choice of measurement units or the algebraic equation itself and that no biological explanation can be deduced from it [59]. There is currently no plausible biological explanation for this negative correlation between scale factors, and it has been discussed less in other studies.
Correlation analysis showed that the allometric scale index was not directly correlated with temperature, rainfall, altitude, and latitude (p > 0.05) (Figure 5). Additionally, we found that there was also no significant difference in scale index among different tree species and different forest types (p > 0.05). This supports the conjecture that the scale index in the WBE model is not influenced by biological species or habitat [61]. It also implies the validity of using a generalized scale index for different tree species and climatic regions. This is because although the scale index may be influenced by multiple factors, it is universally convergent [58]. These findings suggest that the scale index is a reliable measure that can be applied across various species and environments. The relationship between different organ parameters and environmental factors was examined through correlation analysis, which showed that the trunk parameter was significantly and positively correlated with rainfall (p = 0.0001, p < 0.01). This could be due to its close connection with wood density. It is widely acknowledged that the trunk parameter and wood density have a positive correlation [56,58,60]. This finding is also consistent with the results of Návar et al. [62].
We found that all scale indices showed a gradual increase as the mean diameter (D) increased (p = 0.0001, p < 0.01) (Figure 9). For every 12 cm increase in D, the below-ground, above-ground, and whole-scale indices increased by an average of 0.02, 0.07, and 0.07, respectively. This could be attributed to the relationship between H and D, as suggested by fractal geometry theory [58,63,64]. Maintaining a constant H-D scale can also ensure a constant D-biomass scale [64]. However, the growth rate of D relative to H increases with tree size [29]. Therefore, the scale size should be closely related to the developmental stage of the individual, and trees of different sizes may have different scale relationships [60]. These findings suggest that D-biomass scaling is a crucial factor in understanding the growth and development of trees.
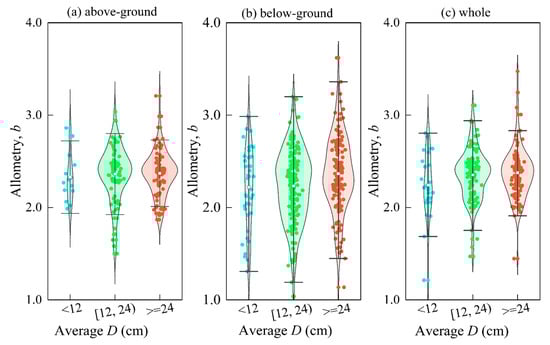
Figure 9.
The change of the exponent of allometry with the size of the D. Among them, (a) above-ground; (b) below-ground; (c) whole.
The theory is also supported by Zianis & Mencuccinai and Anfodillo et al. [58,65]. The b value is usually lower in smaller trees, probably because the stems of smaller trees are usually green, which contributes to the overall assimilation of the plant. The effect of gravity on the plant is not as important as in taller plants, and a branching network full of organisms may not be fully established [22,23,29].
4.2. Biomass Allocation
According to our research, the proportion of above-ground biomass in tropical and subtropical rainforests is significantly higher than that in temperate and boreal forests (p < 0.05) (Figure 6). This trend is also evident when comparing different organs, with the proportion of trunk and branch biomass in tropical rainforest being significantly higher than in boreal forest (p < 0.05), while the proportion of root and leaf biomass is significantly lower (p < 0.05). This pattern is not limited to specific regions, as it has been observed globally: low-latitude tropical regions tend to have higher above-ground biomass, while high-latitude cold regions have higher below-ground biomass [66,67]. In tropical regions with low latitudes, where there is abundant water and heat, the main obstacles for plant growth often arise from the competition for light among leaves. As a result, plants tend to reduce root growth and even increase root mortality, while at the same time enhancing the allocation of biomass to branch and lead [68,69]. This strategy allows plants to maximize the use of scarce light resources by sacrificing root growth [32,33,34]. On the other hand, in cold regions with high latitudes, the limiting factors for plant growth are more related to the competition for water among roots [67]. As a response, plants usually allocate more resources to their roots or symbiotic microorganisms in order to optimize water absorption [35,36].
This may be because the boreal forests in our database are mainly composed of coniferous trees (such as Pinus koraiensis and Pinus massoniana, etc.), and the larger leaf biomass may be partially due to lower leaf replacement rates [35]. Additionally, the allometric relationship between leaf biomass and whole biomass is mainly influenced by soil nutrients and moisture. In conditions of fertile soil or inadequate soil moisture, plants tend to allocate more biomass to leaves [70]. This could explain the higher leaf biomass found in our database, as these forests may have access to sufficient soil nutrients and moisture. This highlights the importance of understanding the relationship between soil conditions and leaf biomass in boreal forests. With this knowledge, we can better predict and manage the health and productivity of these important ecosystems.
4.3. Affecting Biomass Allocation Patterns
The allocation of biomass among different organs in plants reflects the optimal allocation of plant resources, and this optimal pattern may change in response to changes in environmental resources [34,35]. Correlation analysis has shown that the ratio of below-ground/above-ground biomass is significantly negatively correlated with mean annual temperature and mean annual rainfall (p = 0.0001, p < 0.01) (Figure 7). For every 5 °C increase in mean annual temperature, the ratio of below-ground/above-ground biomass decreases by an average of 2.08%, and for every 300 mm increase in mean annual rainfall, it decreases by an average of 3.13%. This supports our prediction that the ratio of below-ground/above-ground biomass decreases as temperature and rainfall increase. Furthermore, our findings suggest that the gradual increase in above-ground biomass with temperature and rainfall could be the main contributing factor to the decrease in the below-ground to above-ground biomass ratio (see Figure 7).
Temperature and moisture can have a significant impact on the optimal allocation of plant biomass [36,70,71]. An increase in temperature usually leads to a decrease in the ratio of below-ground/above-ground biomass [38,68,69]. This is because temperature is closely linked to photosynthetic production, as well as the growth and development of plants [72]. Within a certain range, an increase in temperature can enhance enzyme activity, increase carbohydrate synthesis, accelerate cell division and elongation, and promote the growth of rhizosphere microorganisms, thereby improving the ability of plants to absorb water and nutrients [66,73,74]. As a result, in order to compete for light, the above-ground biomass of plants will increase while the below-ground biomass will decrease with an increase in mean annual temperature. In colder regions, low temperatures can decrease enzyme activity, water viscosity, and membrane permeability, as well as limit the activity of roots and microorganisms [72,75,76]. This means that plants in these environments must find ways to maintain access to below-ground resources. One strategy they use is to increase the allocation of below-ground biomass. By doing so, they can ensure that they have enough resources to survive in the harsh conditions of low temperatures. This adaptation allows them to thrive and continue to play an important role in their ecosystem.
Rainfall is a vital element for plant growth and development. However, the impact of rainfall on biomass allocation is not linear. In fact, an increase in rainfall can decrease the proportion of below-ground and above-ground biomass [38,68,77]. This is because the moisture supply in the soil plays a crucial role in the availability of moisture and nutrients [78]. As moisture levels increase, the movement of soil moisture also increases, resulting in a higher flow of root water. Additionally, the elongation of soil particles and roots is enhanced, leading to better diffusion and absorption of soil nutrients [79]. Therefore, in areas with sufficient moisture, an adequate amount of soil moisture can have a positive impact on nutrient turnover and availability, ultimately resulting in a decrease in below-ground biomass allocation in plants [38,79]. In dry areas, plants have adapted to the scarcity of water over a long period of time, resulting in higher water use efficiency. This allows for more biomass to accumulate below the ground, aiding plants in obtaining more water and nutrients. As a result, there is an increase in both below-ground and above-ground biomass, as noted by studies conducted by Rasse et al., Wang et al., and Eziz et al. [70,80,81].
The ratio of below-ground/above-ground biomass showed a significant positive correlation with altitude and latitude (p < 0.05) (Figure 8). The ratio increased by an average of 1.01% for every 500 m increase in altitude and by an average of 2.17% for every 10° increase in latitude. This is because abiotic factors, such as temperature and moisture, exhibit significant spatial heterogeneity in altitude and latitude gradients [82,83]. As latitude or altitude increases, the available resources for plants, such as temperature and moisture, gradually decrease [84]. We found that the mean annual temperature and mean annual rainfall were significantly negatively correlated with altitude and latitude (p < 0.01). For every 500 m increase in altitude, the mean annual temperature decreased by 2.79 °C, and the mean annual rainfall decreased by 144.97 mm (Figure 8a,b). Similarly, for every 15° increase in latitude, the mean annual temperature decreased by 6.71 °C, and the mean annual rainfall decreased by 351.06 mm (Figure 2). These low temperatures and drought conditions hinder the movement of soil moisture, resulting in a slower rate of soil humus decomposition and a reduced ability for plants to uptake soil nutrients [84]. In order to maintain access to necessary water and nutrients, plants will increase their allocation of resources to below-ground biomass.
5. Conclusions
Our study revealed that the predicted above-ground biomass scale index by the WBE model was not 2.67, but rather closer to 2.33. Although the exponent of allometry varied universally, it did not show a significant correlation with climate factors such as temperature, rainfall, altitude, and latitude, nor with species (p > 0.05). However, it was more closely correlated with individual size (p < 0.01). Additionally, our findings showed that the proportion of above-ground biomass in tropical rainforest and subtropical evergreen rainforests was significantly higher compared to temperate and boreal forests (p < 0.05).
The proportion of trunk and branch biomass was significantly greater in the tropical rainforest than in the boreal forest (p < 0.05), while the proportion allocation of root and leaf biomass was significantly lower (p < 0.05). This indicates that the allocation of biomass is closely related to the abiotic environment. In fact, the ratio of below-ground/above-ground biomass was found to be significantly and negatively correlated with mean annual temperature and mean annual rainfall (p < 0.01), while it was significantly and positively correlated with altitude and latitude (p < 0.01). This highlights the importance of considering environmental factors when studying biomass allocation in different types of forests.
Supplementary Materials
The following supporting information can be downloaded at: https://www.mdpi.com/article/10.3390/f15060942/s1, Figure S1: Relationship between parameters a and b of different organ and mean annual temperature; Figure S2: Relationship between parameters a and b of different organ and mean annual rainfall; Figure S3: Relationship between parameters a and b of different organ and mean altitude; Figure S4: Relationship between parameters a and b of different organ and mean latitude; Table S1: Comparison of parameters b of different organs/parts; Table S2: Parameter b of biomass allometric model in different studies.
Author Contributions
Conceptualization, Z.-H.T.; methodology, Z.-H.T.; validation, Y.H. and Z.-H.T.; investigation, Y.H.; resources, Y.H.; data curation, Y.H.; writing—original draft preparation, Y.H.; writing—review and editing, Z.-H.T.; visualization, Y.H.; supervision, Z.-H.T. and Z.S. All authors have read and agreed to the published version of the manuscript.
Funding
This study was supported by Major Program for Basic Research Project of Yunnan Province (202101BC70002).
Data Availability Statement
The data are available from the corresponding author on reasonable request.
Conflicts of Interest
The authors declare no conflicts of interest.
References
- Kindermann, G.; Obersteiner, M.; Sohngen, B.; Sathaye, J.; Andrasko, J.; Rametsteiner, E.; Schlamadinger, B.; Wunder, S.; Beach, R. Global cost estimates of reducing carbon emissions through avoided deforestation. Proc. Natl. Acad. Sci. USA 2008, 105, 10302–10307. [Google Scholar] [CrossRef]
- Pan, Y.D.; Richard, A.B.; Fang, J.Y.; Houghton, R.; Kauppi, P.E.; Kurz, W.A.; Phillips, O.L.; Shvidenko, A.; Lewis, S.L.; Canadell, J.G.; et al. A large and persistent carbon sink in the world’s forests. Science 2008, 333, 988–993. [Google Scholar] [CrossRef] [PubMed]
- Huxley, J.S. Constant differential growth—Ratios and their significance. Nature 1924, 114, 895. [Google Scholar] [CrossRef]
- Huxley, J.S. Problems of relative growth. Ann. Entomol. Soc. Am. 1932, 25, 757. [Google Scholar]
- Rubner, M. Ueber den einfluss der körpergrösse aufstoff-und kraftwechsel. Z. Biol. 1883, 19, 535–562. [Google Scholar]
- Hemmingsen, A. Energy metabolism as related to body size and respiratory surfaces, and its evolution. Rep. Steno Mem. Hosp. Nord. Insul. Lab. 1962, 9, 7–110. [Google Scholar]
- Prothero, J. Scaling of energy metabolism in unicellular organisms: A re-analysis. Comp. Biochem. Phys. 1960, 83, 243–248. [Google Scholar] [CrossRef]
- Bennett, P.; Harvey, P. Active and resting metabolism in birds-allometry, phylogeny and ecology. J. Zool. 1987, 213, 327–363. [Google Scholar] [CrossRef]
- Heusner, A.A. Size and power in mammals. J. Exp. Biol. 1991, 160, 25–54. [Google Scholar] [CrossRef]
- Dodds, P.S.; Rothman, D.H.; Weitz, J.S. Re-examination of the “3/4-law” of metabolism. J. Theor. Biol. 2001, 209, 9–27. [Google Scholar] [CrossRef]
- Brody, S.; Procter, R.C. Growth and Development with Special Reference to Domestic Animals; Missouri Agricultural Experiment Station: Columbia, MO, USA, 1937. [Google Scholar]
- Kleiber, M. Body size and metabolic rate. Physiol. Rev. 1947, 27, 511–541. [Google Scholar] [CrossRef]
- Kleiber, M. Body size and metabolism. Hilgardia 1932, 6, 315–353. [Google Scholar] [CrossRef]
- Mordenti, J. Man versus beast: Pharmacokinetic scaling in mammals. J. Pharm. Sci. 1986, 75, 1028–1040. [Google Scholar] [CrossRef]
- Cunningham, J.J. A reanalysis of the factors influencing basal metabolic rate in normal adults. Am. J. Clin. Nutr. 1980, 33, 2372–2374. [Google Scholar] [CrossRef]
- Pike, R.L.; Brown, M.L. Nutrition: An Integrated Approach, 2nd, ed.; Willey Publisher: New York, NY, USA, 1975. [Google Scholar]
- Damuth, J. Population density and body size in mammals. Nature 1981, 290, 699–700. [Google Scholar] [CrossRef]
- Lindstedt, S.L.; Miller, B.J.; Buskirk, S.W. Home range, time, and body size in mammals. Ecology 1986, 67, 413–418. [Google Scholar] [CrossRef]
- Calder, W.A. Size, Function and Life History; Dover Publications: New York, NY, USA, 1996. [Google Scholar]
- Schulte, P.J.; Gibson, A.C.; Nobel, P.S. Xylem anatomy and hydraulic conductance of Psilotum nudum. Am. J. Bot. 1987, 74, 1438–1445. [Google Scholar] [CrossRef]
- West, G.B.; Enquist, B.J.; Brown, J.H. A general model for the origin of allometric scaling laws in biology. Science 1997, 276, 122–126. [Google Scholar] [CrossRef]
- West, G.B.; Brown, J.H.; Enquist, B.J. A general model for the structure and allometry of plant vascular systems. Nature 1999, 400, 664–667. [Google Scholar] [CrossRef]
- West, G.B.; Brown, J.H.; Enquist, B.J. The fourth dimension of life: Fractal geometry and allometric scaling of organisms. Science 1999, 284, 1677–1679. [Google Scholar] [CrossRef]
- West, G.B.; Brown, J.H.; Enquist, B.J. A general model for ontogenetic growth. Nature 2001, 413, 628–631. [Google Scholar] [CrossRef]
- Brown, J.H.; West, G.B.; Enquist, B.J. Scaling in Biology: Patterns and Processes, Causes and Consequences; Oxford University Press: Oxford, UK, 2000. [Google Scholar]
- Darveau, C.A.; Suarez, R.K.; Andrews, R.D.; Hochachka, P.W. Allometric cascade as a unifying principle of body mass effects on metabolism. Nature 2002, 417, 166–170. [Google Scholar] [CrossRef]
- Weibel, E.R. Physiology—The pitfalls of power laws. Nature 2002, 417, 131–132. [Google Scholar] [CrossRef]
- Niklas, K.J.; Enquist, B.J. Invariant scaling relationships for interspecific plant biomass production rates and body size. Proc. Natl. Acad. Sci. USA 2001, 98, 2922–2927. [Google Scholar] [CrossRef]
- Pilli, R.; Anfodillo, T.; Carrer, M. Towards a functional and simplified allometry for estimating forest biomass. For. Ecol. Manag. 2006, 237, 583–593. [Google Scholar] [CrossRef]
- Ter-Mikaelian, M.T.; Korzukhin, M.D. Biomass equations for sixty-five North American tree species. For. Ecol. Manag. 1997, 97, 1–24. [Google Scholar] [CrossRef]
- Wang, Z.X.; Huang, X.Z.; Li, F.B.; Chen, D.S.; Xu, X.N. Global patterns of allometric model parameters prediction. Sci. Rep. 2023, 13, 1550. [Google Scholar] [CrossRef]
- Poorter, H.; Niklas, K.J.; Reich, P.B.; Oleksyn, J.; Poot, P.; Mommer, L. Biomass allocation to leaves, stems and roots: Meta-analyses of interspecific variation and environmental control. New Phytol. 2012, 193, 30–50. [Google Scholar] [CrossRef]
- Weiner, J. Allocation, plasticity and allometry in plants. Perspect. Plant Ecol. 2004, 6, 207–215. [Google Scholar] [CrossRef]
- Bloom, A.J.; Chapin, F.S.; Mooney, H.A. Resource limitation in plants—An economic analogy. Annu. Rev. Ecol. Syst. 1985, 16, 363–392. [Google Scholar] [CrossRef]
- Reich, P.B. Root-shoot relationships: Optimality in acclimation and allocation or the ‘Emperor’s New Clothes? In Plant Roots: The Hidden Half; Waisel, Y., Eshel, A., Kafkafi, U., Eds.; Marcel Dekker: New York, NY, USA, 2002; pp. 205–220. [Google Scholar]
- Banin, L.; Feldpausch, T.R.; Phillips, O.L.; Baker, T.R.; Lloyd, J.; Affum-Baffoe, K.; Arets, E.J.M.M.; Berry, N.J.; Bradford, M.; Brienen, R.J.W.; et al. What controls forest architecture? Testing environmental, structural and floristic drivers. Glob. Ecol. Biogeogr. 2012, 21, 1179–1190. [Google Scholar] [CrossRef]
- Hagedorn, F.; Gavazov, K.; Alexander, J.M. Above- and belowground linkages shape responses of mountain vegetation to climate change. Science 2019, 365, 1119–1123. [Google Scholar] [CrossRef] [PubMed]
- Wieder, W.R.; Cleveland, C.C.; Smith, W.K.; Todd-Brown, K. Future productivity and carbon storage limited by terrestrial nutrient availability. Nat. Geosci. 2015, 8, 441–444. [Google Scholar] [CrossRef]
- Ogawa, H.; Yoda, K.; Ogino, K.; Kira, T. Comparative ecological studies on three main types of forest vegetation in Thailand II Plant biomass. Nat. Life Southeast Asia 1965, 4, 49–80. [Google Scholar]
- Brown, S. Estimating Biomass and Biomass Change of Tropical Forests: A Primer. Forestry 1997, 18, 23. [Google Scholar]
- Lima, R.A.F.D.; Batista, J.L.F.; Prado, P.I. Modeling tree diameter distributions in natural forests: An evaluation of 10 statistical models. For. Sci. 2015, 2, 320–327. [Google Scholar]
- Wang, M.; Rennolls, K. Tree diameter distribution modelling: Introducing the logit-logistic distribution. Can. J. For. Res. 2005, 35, 1305–1313. [Google Scholar] [CrossRef]
- McCulloh, K.A.; Sperry, J.S.; Abler, F.R. Water transport in plants obeys Murray′s law. Nature 2003, 421, 939–942. [Google Scholar] [CrossRef]
- Brouat, C.; McKey, D. Leaf-stem allometry, hollow stem, and the evolution of caulinary domatia in myrmecophytes. New Phytol. 2010, 151, 391–406. [Google Scholar] [CrossRef]
- Chen, X.; Li, B. Testing the allometric scaling relationships with seedlings of two species. Acta Oecol. 2003, 24, 125–129. [Google Scholar] [CrossRef]
- Li, H.; Han, X.; Wu, J. Variant scaling relationship for mass-density across tree-dominated communities. J. Integr. Plant Biol. 2006, 48, 268–277. [Google Scholar] [CrossRef]
- Zianis, D.; Radoglou, K. Comparison between empirical and theoretical biomass allometric models and statistical implications for stem volume predictions. Forestry 2006, 79, 477–487. [Google Scholar] [CrossRef][Green Version]
- Chen, X. Variations in patterns of internode and branch lengths for several bamboo species. Plant Biosyst. Int. J. Deal. Asp. Plant Biol. 2021, 155, 1088–1099. [Google Scholar] [CrossRef]
- Makarieva, A.M.; Gorshkov, V.G.; Li, B.L. A note on metabolic rate dependence on body size in plants and animals. J. Theor. Biol. 2003, 221, 301–307. [Google Scholar] [CrossRef] [PubMed]
- Chen, C.; Zhu, J. Manual of Tree Biomass for Main Species in North-Eastern China; China Forestry Publishing House: Beijing, China, 1989. [Google Scholar]
- Chroust, L. Above-ground biomass of young pine forests (Pinus sylvestris) and its determination. Commun. Instituti For. Cech. 1985, 14, 111–126. [Google Scholar]
- Chojnacky, D.C. Allometric scaling theory applied to FIA biomass estimation. In Proceedings of the Third Annual Forest Inventory and Analysis Symposium, Traverse City, MI, USA, 17–19 October 2001; North Central Research Station: St. Paul, MN, USA, 2002. [Google Scholar]
- Fournier, R.A.; Luther, J.E.; Guindon, L.; Lambert, M.C.; Piercey, D.; Hall, R.J. Mapping aboveground tree biomass at the stand level from inventory information: Test cases in Newfoundland and Quebec. Can. J. For. Res. 2003, 33, 1846–1863. [Google Scholar] [CrossRef]
- Zeng, W.; Tang, S. A new general allometric biomass model. Nat. Preced. 2011. [Google Scholar] [CrossRef]
- Mandelbrot, B.B. The fractal geometry of nature. Am. J. Phys. 1983, 51, 286. [Google Scholar] [CrossRef]
- Zianis, D.; Mencuccini, M. On simplifying allometric analyses of forest biomass. For. Ecol. Manag. 2004, 187, 311–332. [Google Scholar] [CrossRef]
- White, J.F.; Gould, S.J. Interpretation of the coefficient in the allometric equation. Am. Nat. 1965, 904, 5–18. [Google Scholar] [CrossRef]
- Niklas, K.J. Plant Allometry: The Scaling of Form and Process; The University of Chicago Press: Chicago, IL, USA; London, UK, 1994. [Google Scholar]
- Chambers, J.Q.; Santos, J.D.; Ribeiro, R.J.; Higuchi, N. Tree damage, allometric relationships, and above-ground net primary production in central Amazon forest. For. Ecol. Manag. 2001, 152, 73–84. [Google Scholar] [CrossRef]
- Niklas, K.J. A phyletic perspective on the allometry of plant biomass partitioning patterns and functionally equivalent organ-categories. New Phytol. 2006, 171, 27–40. [Google Scholar] [CrossRef]
- Návar, J.; Ríos-Saucedo, J.; Pérez-Verdín, G.; Rodríguez-Flores, F.D.J.; Domínguez-Calleros, P.A. Regional aboveground biomass equations for north american arid and semi-arid forests. J. Arid Environ. 2013, 97, 127–135. [Google Scholar] [CrossRef]
- Ketterings, Q.M.; Coe, R.; Noordwijk, M.V.; Ambagau, Y.; Palm, C.A. Reducing uncertainty in the use of allometric biomass equations for predicting above-ground tree biomass in mixed secondary forests. For. Ecol. Manag. 2001, 146, 199–209. [Google Scholar] [CrossRef]
- Russo, S.E.; Wiser, S.K.; Coomes, D.A. Growth-size scaling relationships of woody plant species differ from predictions of the Metabolic Ecology Model. Ecol. Lett. 2007, 10, 889–901. [Google Scholar] [CrossRef] [PubMed]
- Anfodillo, T.; Carraro, V.; Carrer, M.; Fior, C.; Rossi, S. Convergent tapering of xylem conduits in different woody species. New Phytol. 2006, 169, 279–290. [Google Scholar] [CrossRef] [PubMed]
- Lie, G.; Xue, L. Biomass allocation patterns in forests growing different climatic zones of China. Trees 2015, 30, 639–646. [Google Scholar] [CrossRef]
- Pan, Y.; Zhang, Z.; Zhang, M. Climate vs. nutrient control: A global analysis of driving environmental factors of wetland plant biomass allocation strategy. J. Clean. Prod. 2023, 406, 136983. [Google Scholar] [CrossRef]
- Li, C.; Zheng, Z.; Peng, Y.; Nie, X.; Yang, L.; Xiao, Y.; Zhou, G. Precipitation and nitrogen addition enhance biomass allocation to aboveground in an alpine steppe. Ecol. Evol. 2019, 9, 12193–12201. [Google Scholar] [CrossRef]
- Yan, Z.; Eziz, A.; Tian, D.; Li, X.; Hou, X.; Peng, H.; Han, W.; Guo, Y.; Fang, J. Biomass allocation in response to nitrogen and phosphorus availability: Insight from experimental manipulations of Arabidopsis thaliana. Front. Plant Sci. 2019, 10, 598. [Google Scholar] [CrossRef]
- Wang, J.; Yu, D.; Wang, Q. Growth, biomass allocation, and autofragmentation responses to root and shoot competition in Myriophyllum spicatum as a function of sediment nutrient supply. Aquat. Bot. 2008, 89, 357–364. [Google Scholar] [CrossRef]
- Feldpausch, T.R.; Banin, L.; Phillips, O.L.; Lloyd, J. Height-diameter allometry of tropical forest trees. Biogeosciences 2011, 8, 1081–1106. [Google Scholar] [CrossRef]
- Reich, P.B.; Luo, Y.; Bradford, J.B.; Poortere, H.; Perry, C.H.; Oleksyn, J. Temperature Drives Global Patterns in Forest Biomass Distribution in Leaves, Stems, and Roots. Proc. Natl. Acad. Sci. USA 2014, 111, 13721–13726. [Google Scholar] [CrossRef] [PubMed]
- Shipley, B.; Meziane, D. The balanced-growth hypothesis and the allometry of leaf and root biomass allocation. Funct. Ecol. 2002, 16, 326–331. [Google Scholar] [CrossRef]
- Wang, X.X.; Wang, R.; Gao, J. Precipitation and soil nutrients determine the spatial variability of grassland productivity at large scales in China. Front. Plant Sci. 2022, 13, 996313. [Google Scholar]
- Hobbie, S.E.; Schimel, J.P.; Trumbore, S.E.; Randerson, J. Controls over carbon storage and turnover in high-latitude soils. Glob. Chang. Biol. 2000, 6, 196–210. [Google Scholar] [CrossRef] [PubMed]
- Dybzinski, R.; Farrior, C.; Wolf, A.; Reich, P.B.; Pacala, S.W. Evolutionarily stable strategy carbon allocation to foliage, wood, and fine roots in trees competing for light and nitrogen: An analytically tractable, individual-based model and quantitative comparisons to data. Am. Nat. 2011, 177, 153–166. [Google Scholar] [CrossRef] [PubMed]
- Villar, R.; Veneklaas, E.J.; Jordano, P.; Lambers, H. Relative growth rate and biomass allocation in 20 Aegilops (Poaceae) species. New Phytol. 1998, 140, 425–437. [Google Scholar] [CrossRef]
- Huang, Y.; Zhao, X.; Zhou, D.; Wang, T.; Qin, L. Biomass allocation to vegetative and reproductive organs of Chenopodium acuminatum willd. under soil nutrient and water stress. Bangladesh J. Bot. 2013, 42, 113–121. [Google Scholar] [CrossRef]
- Enebe, M.C.; Babalola, O.O. The influence of plant growth-promoting rhizobacteria in plant tolerance to abiotic stress: A survival strategy. Appl. Microbiol. Biotechnol. 2018, 102, 7821–7835. [Google Scholar] [CrossRef]
- Rasse, D.P.; Rumpel, C.; Dignac, M.F. Is soil carbon mostly root carbon? Mechanisms for a specific stabilisation. Plant Soil 2005, 269, 341–356. [Google Scholar] [CrossRef]
- Eziz, A.; Yan, Z.; Tian, D.; Han, W.; Tang, Z.; Fang, J. Drought effect on plant biomass allocation: A meta-analysis. Ecol. Evol. 2017, 7, 11002–11010. [Google Scholar] [CrossRef] [PubMed]
- Prather, R.M.; Castillioni, K.; Welti, E.A.R.; Kaspari, M.; Souza, L. Abiotic factors and plant biomass, not plant diversity, strongly shape grassland arthropods under drought conditions. Ecology 2020, 101, e03033. [Google Scholar] [CrossRef] [PubMed]
- Du, C.; Gao, Y. Opposite patterns of soil organic and inorganic carbon along a climate gradient in the alpine steppe of northern Tibetan Plateau. Catena 2020, 186, 104366. [Google Scholar] [CrossRef]
- Ma, W.; Shi, P.; Li, W.; He, Y.; Zhang, X.; Shen, Z.; Chai, S. Changes in individual plant traits and biomass allocation in alpine meadow with elevation variation on the Qinghai-Tibetan Plateau. Sci. China Life Sci. 2010, 53, 1142–1151. [Google Scholar] [CrossRef]
- Davidson, S.J.; Strack, M.; Bourbonniere, R.A.; Waddington, J.M. Controls on soil carbon dioxide and methane fluxes from a peat swamp vary by hydrogeomorphic setting. Ecohydrology 2019, 12, e2162. [Google Scholar] [CrossRef]


Disclaimer/Publisher’s Note: The statements, opinions and data contained in all publications are solely those of the individual author(s) and contributor(s) and not of MDPI and/or the editor(s). MDPI and/or the editor(s) disclaim responsibility for any injury to people or property resulting from any ideas, methods, instructions or products referred to in the content. |
© 2024 by the authors. Licensee MDPI, Basel, Switzerland. This article is an open access article distributed under the terms and conditions of the Creative Commons Attribution (CC BY) license (https://creativecommons.org/licenses/by/4.0/).