Abstract
The effects of the changing frequency and severity of drought events in Central Europe may become a growing concern for its forests. In this study, we looked into how Hungary’s forests have been affected by the 2022 compound heatwave and drought, following an arid period from 2018 to 2021. We used our active intensive monitoring plots of the Forest Protection Measuring and Monitoring System (Level II in the ICP Forests) across the country between 2017 and 2022. We analyzed satellite images to support a survey of the large-scale drought utilizing moderate and high-resolution data. The health state of the forest calculated and mapped on the NDVI, ZNDVI, and NDWI indices showed damage and regeneration throughout the period studied. Overall, the forest stands observed tolerated the negative impacts of the drought (126–204 mm water deficit in 2022) based on our biomass data (the summer leaf loss was 14% in each monitoring plot). However, the classified Z-NDVI values of the Sentinel-2 satellite imagery for the period 2017–2022 showed a severe drought in 2022, which was followed by some improvement in 2023.
1. Introduction
Droughts could play a significant role in changing the forest environment in the future in Central Europe. Droughts can be understood as prolonged conditions that are significantly drier than usual, limiting precipitation, water, and moisture availability to potentially damaging extents (WMO and GWP, 2016; WMO, 2023 [1,2]). This complex phenomenon demonstrates itself over several spatial and time scales, usually with a slow onset, which gradually intensifies. The impacts can be as varied as the causes, with adverse effects on agriculture, forestry, food security, water use, industry, human and animal health, livelihood security, personal security, and access to education (WMO and GWP, 2016 [1]). In this study, from four general types, namely (1) meteorological, (2) agricultural, (3) hydrological, and (4) socioeconomic drought, we focus on the first and look also at its joint occurrence with heatwaves and how such a compound event affected Hungarian forests.
In this study, we look into how Hungary’s woods were affected by the effects of the 2022 compound heatwave and drought, which came after an arid period from 2018 to 2021. While we cannot provide a comprehensive literature review on the impacts of the drought here, we have listed findings that point to those especially connected with the 2018–2022 period in Central Europe and are relevant to the risk of similar damage to be expected in Hungary. The review aims to set out a framework for evaluating the outputs from the Hungarian forest monitoring programme analyzed in this paper. The paper’s discussion section will address site-specific problems from the literature.
By integrating satellite-based vegetation indices with machine learning from 2000 to 2020, Forzieri et al. (2022) [3] showed that temperate forests are among those experiencing declining resilience due to changes in the climate, which is attributed to increased water limitations. A significant drought and a major heatwave forming a compound event struck Central Europe and Hungary in 2022. The summertime temperatures broke records. The heatwave and the compounded drought resulted in extensive crop damage and water shortages; its return period was found to be 354 years in Northern Italy by Tripathy and Mishra (2023) [4]. As Cook et al. (2022) [5] found, exceptional droughts (megadroughts) may become substantially warmer in the future, intensifying the drought risks and severity all over Europe. Aalbers et al. (2023) [6] suggested that the likelihood of drought in Western and Central Europe may significantly increase, thereby reducing the time available to recover between the periods of drought and heat waves and increasing the frequency of compound events. Moravec et al. (2021) [7] noted the exceptional severity of a soil moisture drought when considering the legacy of the 2014–2018 multi-year period in Central Europe. Van der Woude et al. (2023) [8] reported that during the 2022 drought, a decrease in the net biospheric carbon uptake in the summer (56–62 TgC) was observed over the drought area. Rakovec et al. (2022) [9] analyzed the extreme weather of 2018. They concluded that future events projected across Europe may exhibit comparable intensities to that of the 2018–2020 event but have considerably longer durations than any of those observed during the last 250 years. Therefore, the impact of the changing frequency and severity of drought events in Central Europe may become a growing concern for its forests.
According to recent studies, drought events are occurring more frequently over shorter durations, even though their average duration is growing shorter. Since each drought timescale captures distinct components vital for various fields (including forestry), the significance of the drought timescale to the drought status assessment needs to be stressed. To deal with drought’s cumulative and delayed effects, Wei et al. (2023) [10] investigated the cumulative and time-lag effects of drought on vegetation from 2001 to 2020. At six months, woodland had the largest time-lag effect, while at other stages, woodland had a smaller time-lag effect than grassland. Stefanidis et al. (2023) [11] investigated the length and patterns of drought in a Mediterranean oak woodland between 1974 and 2020. Based on seasonal analysis, more serious incidents have been found in the last ten years. It is interesting that these tendencies became more prominent as the period lasted. These findings showed that it is necessary to conduct regional research on the cumulative and delayed impacts of drought on various types of terrestrial plants including forests.
A sizable portion of European woods are found in the Carpathians, where some of Hungary’s forests are also located. Forest ecosystems may be at risk from a reduction in water resources, the altered seasonality of runoff, and more extreme floods and droughts, all of which have been recently detected in the Western Carpathians (Keszeliová, et al., 2021) [12]. Based on a review of 251 papers covering the Western and Eastern Carpathians, Kholiavchuk et al. (2024) [13] concluded that such environmental changes have negatively impacted the vitality of forests in many locations, e.g., Slovakia’s Pannonian floodplain forest ecosystems, which are also degrading as a result of altered ecological and bioclimatic circumstances (Gášpár and Škrinár, 2021) [14]. Based on 365 papers assessing the effects of climate change on European forests from 1993 to 2022, Vacek et al. (2023) [15] reported the migration of tree species and more frequent and devastating large-scale forest disturbances. Based on a comprehensive global literature review, Seidl et al. (2017) [16] stated that warmer and drier conditions may favour drought disturbances, but changes in vegetation may also result in disturbances to the climate.
Additional harm to forests might also appear after droughts (the impact of a drought legacy). The ability of forest ecosystems to tolerate and recover from anthropogenic and natural disturbances determines their resilience (Forzieri et al., 2022) [3]. Even though 2021 was an average year in a few areas, significant damage was still noted, suggesting that the multi-year drought between 2018 and 2020 had a lasting legacy impact (Knutzen et al., 2023) [17].
Using a collection of high-temporal resolution dendrometer data from 21 species over 53 sites in Central and Atlantic Europe, it was determined that the 2018 European heatwave led to stem dehydration but not to consistent growth reductions in forests (Salomón et al., 2022) [18]. Thom et al. (2023) [19] examined the consequences of the exceptional drought between 2018 and 2020. They found that the tree growth in Bavaria fell by 41.3% during the drought (a statistically significant decrease for 13 out of 20 species). Senf et al. (2020) [20] examined the connection between the availability and mortality of water from 1987 to 2016. They found that excess forest mortality (i.e., canopy mortality exceeding the long-term mortality trends) is significantly related to drought across continental Europe. A study by Pretzsch et al. (2018) [21] for Norway spruce and European beech discussed the role of water stress in compromising the health of various tree species; they emphasized the link between prolonged droughts and increased tree mortality in areas that are also relevant to Central European forests.
From the tree ring collections located at 22 sites in pure and mixed stands of Scots pine and Norway spruce, including Austria and Slovakia, Aldea et al. (2022) [22] found that compared to Scots pine, Norway spruce exhibited greater susceptibility to summer dryness, reduced resistance of forest stands, and a more extended recovery period. They further noted that mixed forests offered both species more resistance to drought. However, the benefit diminished as the drought grew longer. Li et al. (2023) [23] looked at the greenness of vegetation via satellite in Central Europe and discovered that the resilience of forests to drought appeared to rely on height, e.g., shorter forests demonstrated less tolerance to drought than higher ones did. Beloiu et al. (2022) [24] found, as a result of combined in situ field measurements of saplings of beech, sessile oak, pedunculate oak, common hornbeam, silver birch, Norway spruce, Scots pine, and other deciduous trees with remote sensing during droughts (2018, 2019, and beyond 2020) in Northern Bavaria, that saplings had a remarkable ability to rebound and withstand droughts but a lessened ability to recover. Using tree-ring data from sessile and pedunculate oaks from 100 locations and 50 years from central Spain to northern Germany, Bose et al. (2021) [25] found that precipitation was more important to growth than temperature and that the influence of the current spring drought and the previous winter’s drought were substantial. In Slovakia, where the findings of Keszeliová, et al. (2022) [26] indicated that the rise in total catchment evapotranspiration that had been seen in recent decades would continue, Rybar et al. (2023) [27] investigated the ICP Forests Level I monitored the radial growth response of Fagus sylvatica, Picea abies, Abies alba, Quercus petraea, and Pinus sylvestris to the dry years in the West Carpathians. They found a significant and consistent decline in the growth, which they primarily attributed to drought with the elevation as a significant climate-relevant environmental predictor. Using an Italian dataset of 253 trees from 60 species between 1997 and 2020, Bussotti et al. (2021) [28] observed that severe defoliation primarily occurred in the years with a severe summer drought, while the mortality increased in the years following the drought as a result of the effect of the drought’s legacy.
Gazol and Camarero (2022) [29] studied the tree defoliation and mortality in Europe over two decades that were connected to compound events in the summer, 46% of which occurred across Europe in hot summers and dry years. They predicted an increase in drought mortality in Eastern European regions over the following decades. When investigating the greenness of forests in Europe’s temperate biome using NDVI on a 50 km scale in the summers of 2002–2022, Gordon et al. (2019) [30] showed that the hot summer in 2022 negatively affected 37% of the temperate forest regions. More than in any other summer, they discovered a decrease in the greenness of forests. In the temperate forests of Austria, Germany, and Switzerland in response to the 2018 drought, Schuldt et al. (2020) [31] observed drought stress as expressed by the potential low foliar water, leaf discolouration, and premature shedding, and the drought-induced tree mortality due to the drought-legacy effects in 2019. They called for a pan-European ground-based monitoring network supported by remote sensing. Thonfeld et al. (2022) [32] used dense Sentinel-2 and Landsat-8 time-series data combined with a disturbance index to report a canopy cover loss of 501,000 ha for Germany for the drought years 2018–2021. However, significant regional differences were also acknowledged.
Ognjenović et al. (2022) [33] focused on the effect of current and previous year climate conditions when studying the crown vitality indicators of European beech forests in Croatia related to defoliation and changes due to defoliation. They showed an increasing trend of defoliation during the study period from 1996 to 2017. When combined, air temperatures and precipitation clearly affected the changes in defoliation. The notion that losses in Serbia’s forests were caused by drought and its aftermath is supported by the observations from 2004 to 2018 made by Češljar et al. (2022) [34]. The highest forest decline rate was observed in the last period when comparing 2004–2008, 2009–2013, and 2014–2018, with no statistically significant difference between coniferous and broadleaved tree species. Hereş et al. (2021) [35] stated that the tree mortality events in the Romanian Carpathians peaked in 2012 and affected conifer species such as the silver fir, black pine, and Scots pine. They discovered that when there was a significant drought, black pine and Scots pine species died off and could not adequately regenerate.
In summary, it has become clear that the Central European forests suffered damage from droughts that preceded 2022, especially those of 2018–2022. Szentes (2023) [36] and Horváth and Breuer (2023) [37] also reported the effects of a severe drought in Hungary. The exact effects of drought on Central European forests can vary, depending on various factors such as the severity and duration of drought events, local ecological conditions, the forest management practices in place, and many other discriminating factors. Due to the regional and local differences, there is still much to learn about the dynamics and spatial distribution of the disturbances in response to these climatic extremes, especially when looking at large-scale patterns of effects interactions and feedback. The evaluations of the ongoing experimental research and monitoring are essential for a comprehensive understanding of this region’s complex interactions between climate change and forest ecosystems.
Based on the observations from the Hungarian forest monitoring sites from the period 2018–2022, the following objectives were determined for this paper:
- To describe the eco-physiological and spatial aspects of the multi-year drought legacy and the compound effect of 2022 on forest ecosystems.
- To synthesize the current results of in situ field measurements in forest stands and the satellite remote sensing of forest canopies.
- Describe the timing and duration of the different responses between species and their composition.
In our approach, we combined the local deposition measurements and the remote sensing method. According to our knowledge, very few similar studies have been published (Alekseev and Chernikhovskii, 2021) [38]. In addition, our sample areas are also unique because the monitoring plots were located in the Pannonian Biogeographic Region, which is a meeting edge between the Central European deciduous forest zone and the continental forest-steppe region. Furthermore the Pannonian region (Hungary) is influenced by the Mediterranean, Atlantic, and continental climates (Varga 1995, Fekete et al., 2014) [39,40].
Our analysis aimed at contributing to a comprehensive explanation of the harm caused by drought to local forest functions. This explanation is essential for trying to comprehend how forests and vegetation–climate feedback will react to more frequent, severe, and persistent damage in future droughts.
2. Materials and Methods
2.1. Monitoring Plots
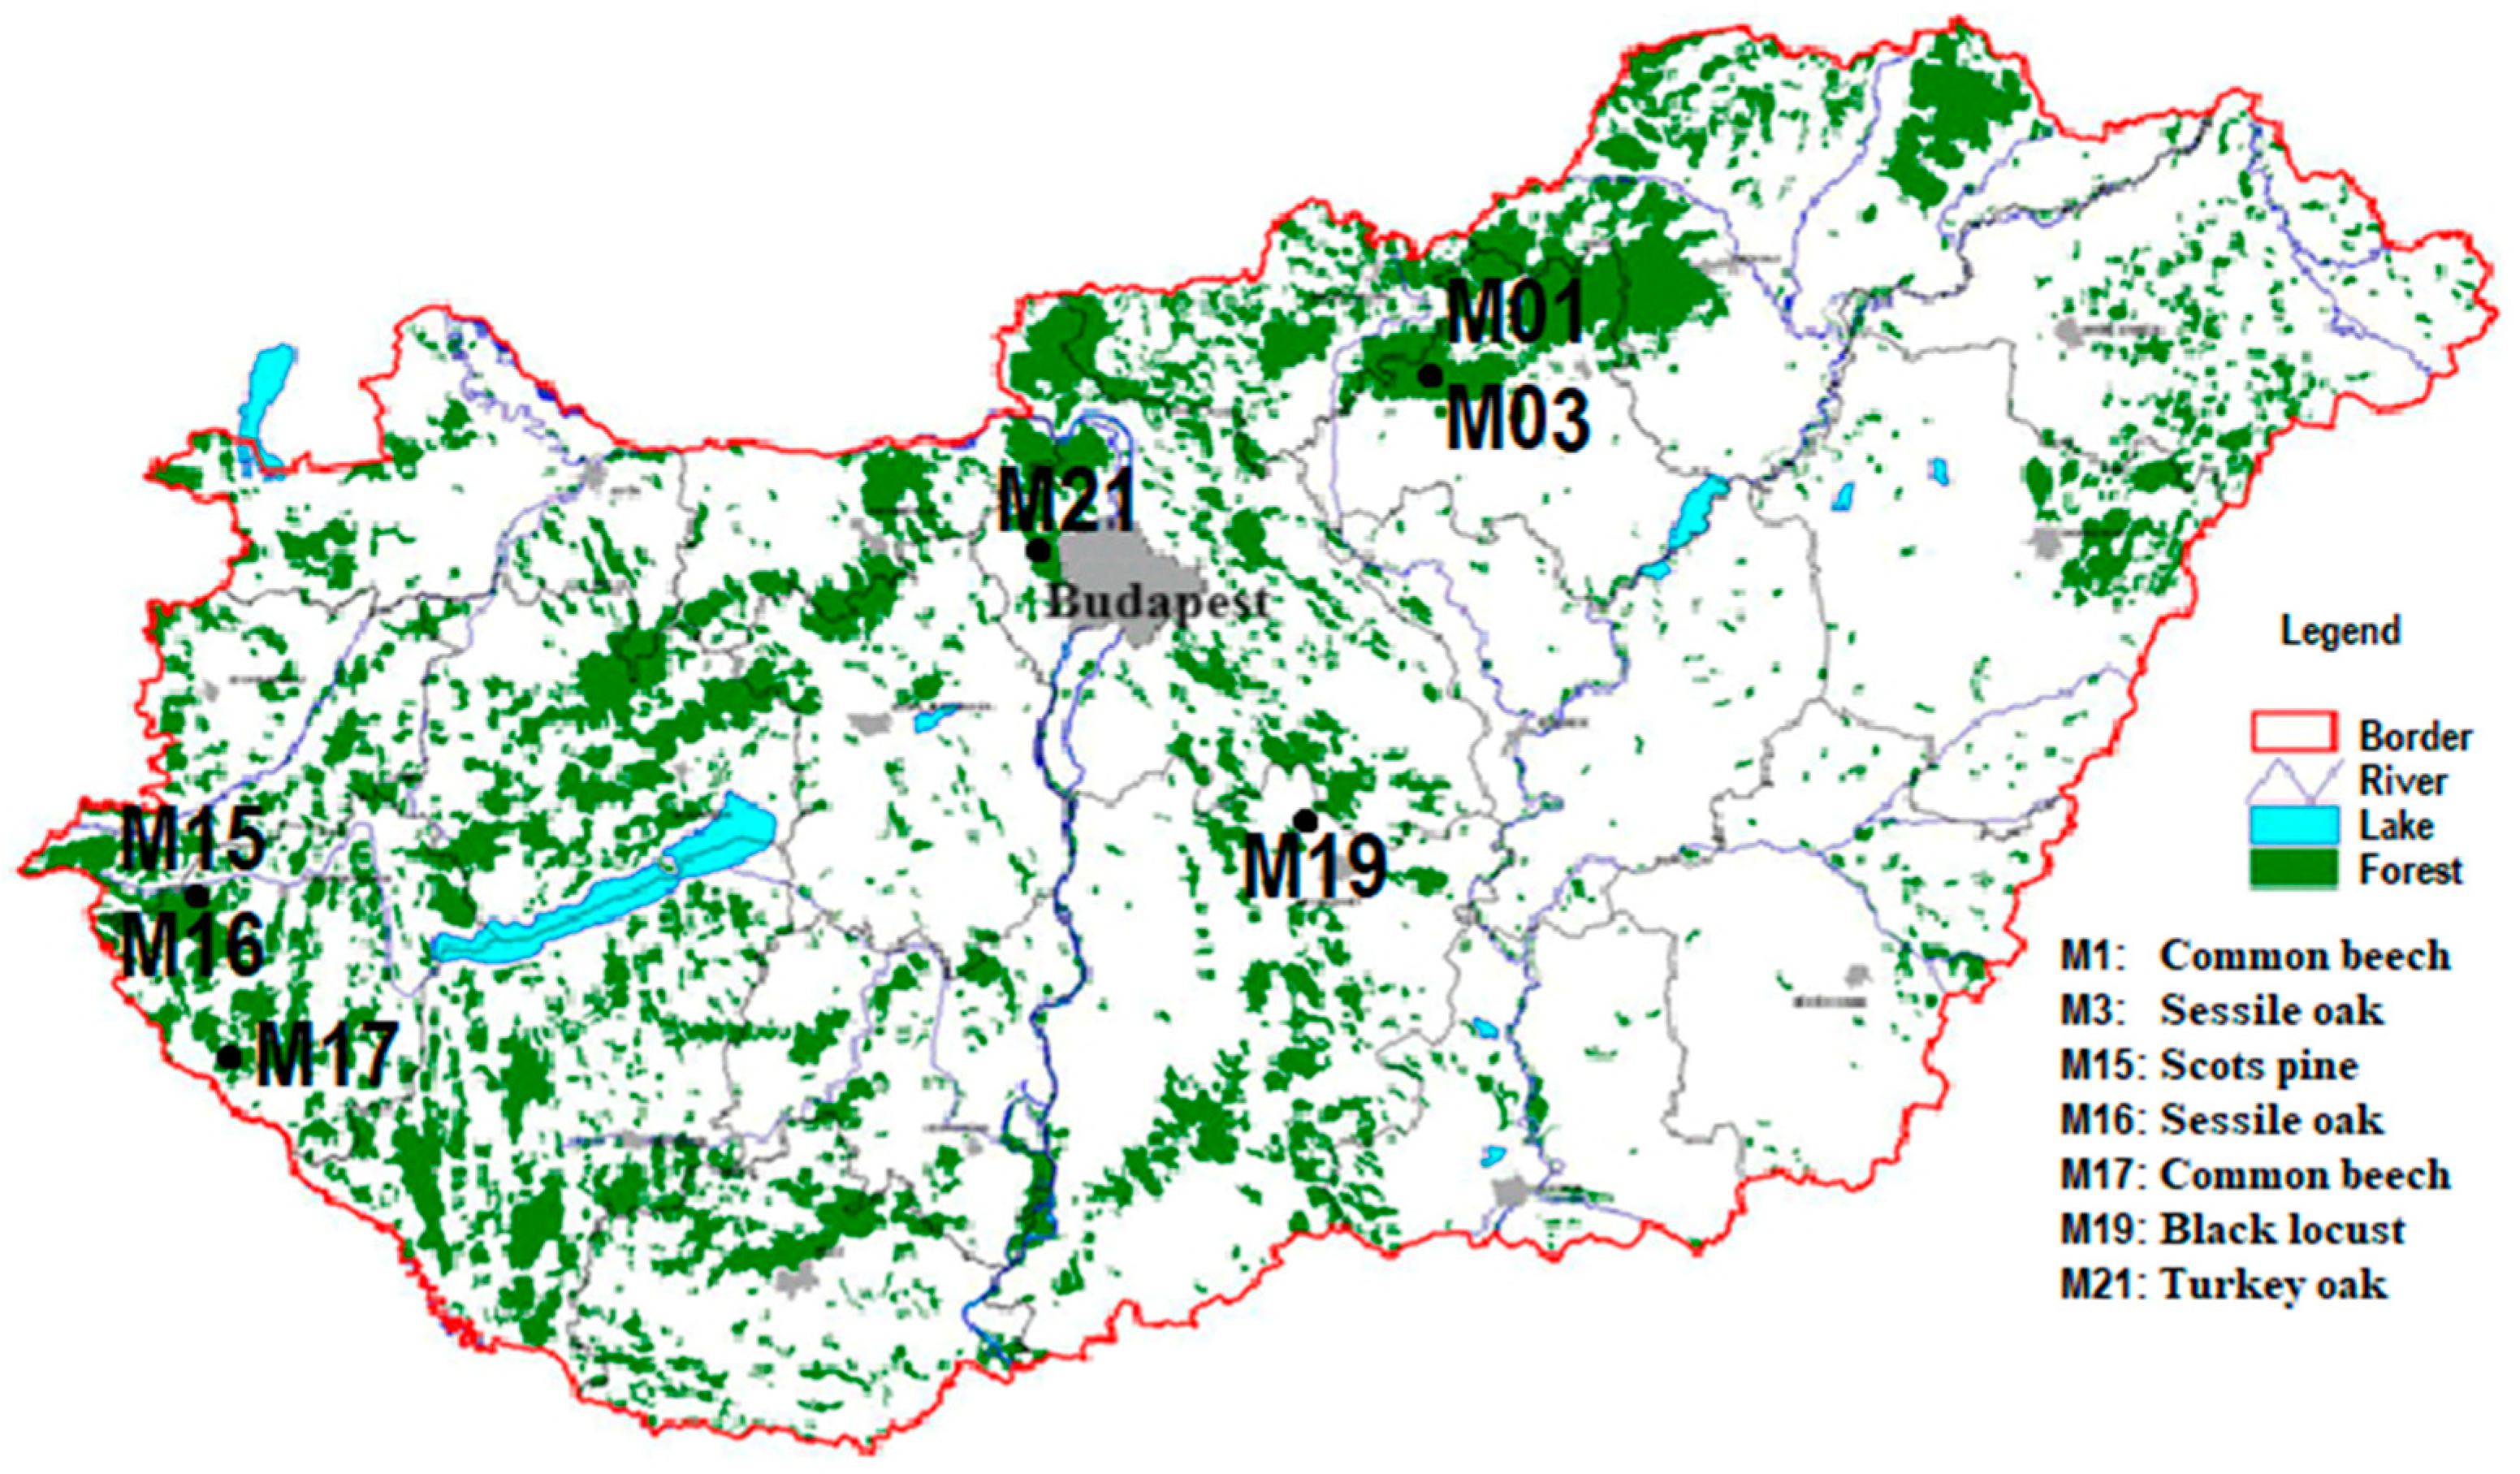
The Forest Protection Measuring and Monitoring System is one of the oldest monitoring systems in Hungary, which has cooperated with the ICP Forest since 1996. During our study work, we used our active intensive monitoring plots of the Forest Protection Measuring and Monitoring System (Level II in ICP Forests) across the country between 2017 and 2022 (Figure 1).
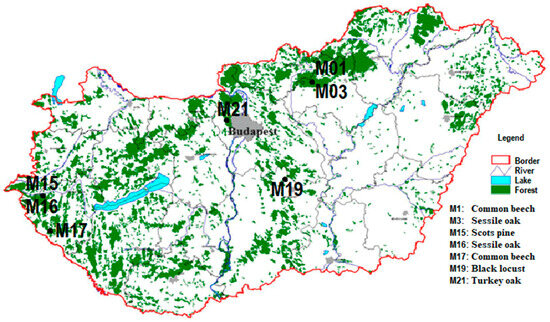
Figure 1.
Location of the monitoring plots.
We collected data from seven forest sites that differed regarding the age, composition, and planting technology for the trees. There are two aged common beech (Fagus sylvatica) forest stands in the North Central Mountains and in the southwestern region of Hungary. Furthermore, we also observed two sessile oak (Quercus petraea) forest stands near the beech stand in the North Central Mountains and in the western part of Hungary. The black locust (Robinia pseudoacacia) stand is a 43-year-old coppice forest in the middle of the country. The Scots pine (Pinus sylvestris) monitoring site is near the second sessile oak sample area. The last site was the turkey oak (Quercus cerris) stand, which is near Budapest (the Buda mountains). There were seven open-field areas (meadows in the forests) as the control point near to each forest site. The type of soil at the three stands investigated is different in each region, i.e., from sand with a low or moderate amount of humus (aridic arenosol) to loam with a low amount of clay (cutanic luvisol). A description of the sample areas was provided by our database of previous surveys. The parameters of the forest stands were confirmed by our local measurements. In addition, the soil data consisted of field and laboratory tests. The Leaf Area Index (LAI) value was determined via litterfall measurements. The LAI value of the Scots pine stand was also determined from the Sentinel-2 autumn image (10 × 10 m) using thematic land processing, which is the biophysical processor of the Sentinel Application 9.0, but it was not reliable (3.3 m2/m2) for a comparison, so we used our data (Table 1). The monitoring plots were located on sites without an additional water supply. The forest stands could not reach the groundwater level. The size of each forest site was 50 × 50 m. The sample areas selected were good representations of Hungarian forest stands. The proportion of these tree species was 57% in the whole national woodland area in 2022 based on the database of the National Land Centre (nfk.gov.hu accessed on 13 March 2024) [41].

Table 1.
The main information about the monitoring plots (* 2020–2022 in the case of the M21 turkey oak stand).
2.2. Sampling Monitoring Methods
All the methods applied complied with the ICP Forest manual (https://www.nfk.gov.hu/EMMRE_kiadvanyok__jelentesek__prognozis_fuzetek_news_536 accessed on 20 February 2024) [42]. Our HWI weather stations (manufactured by HWI Electronics Ltd.) on open field areas measured the following meteorological parameters: precipitation (determined by weighing), temperature, relative humidity, global radiation at a 2 m height, and wind speed and direction at 10 m. The aggregate data were logged in every 10 min. Hellmann-type rain gauges were also installed on every open field plot. The precipitation was measured by observers every week. For determining the deposition, precipitation was measured and sampled using 4 funnels (diameter: 20 cm). For the winter precipitation, we also used five buckets (diameter: 30 cm).
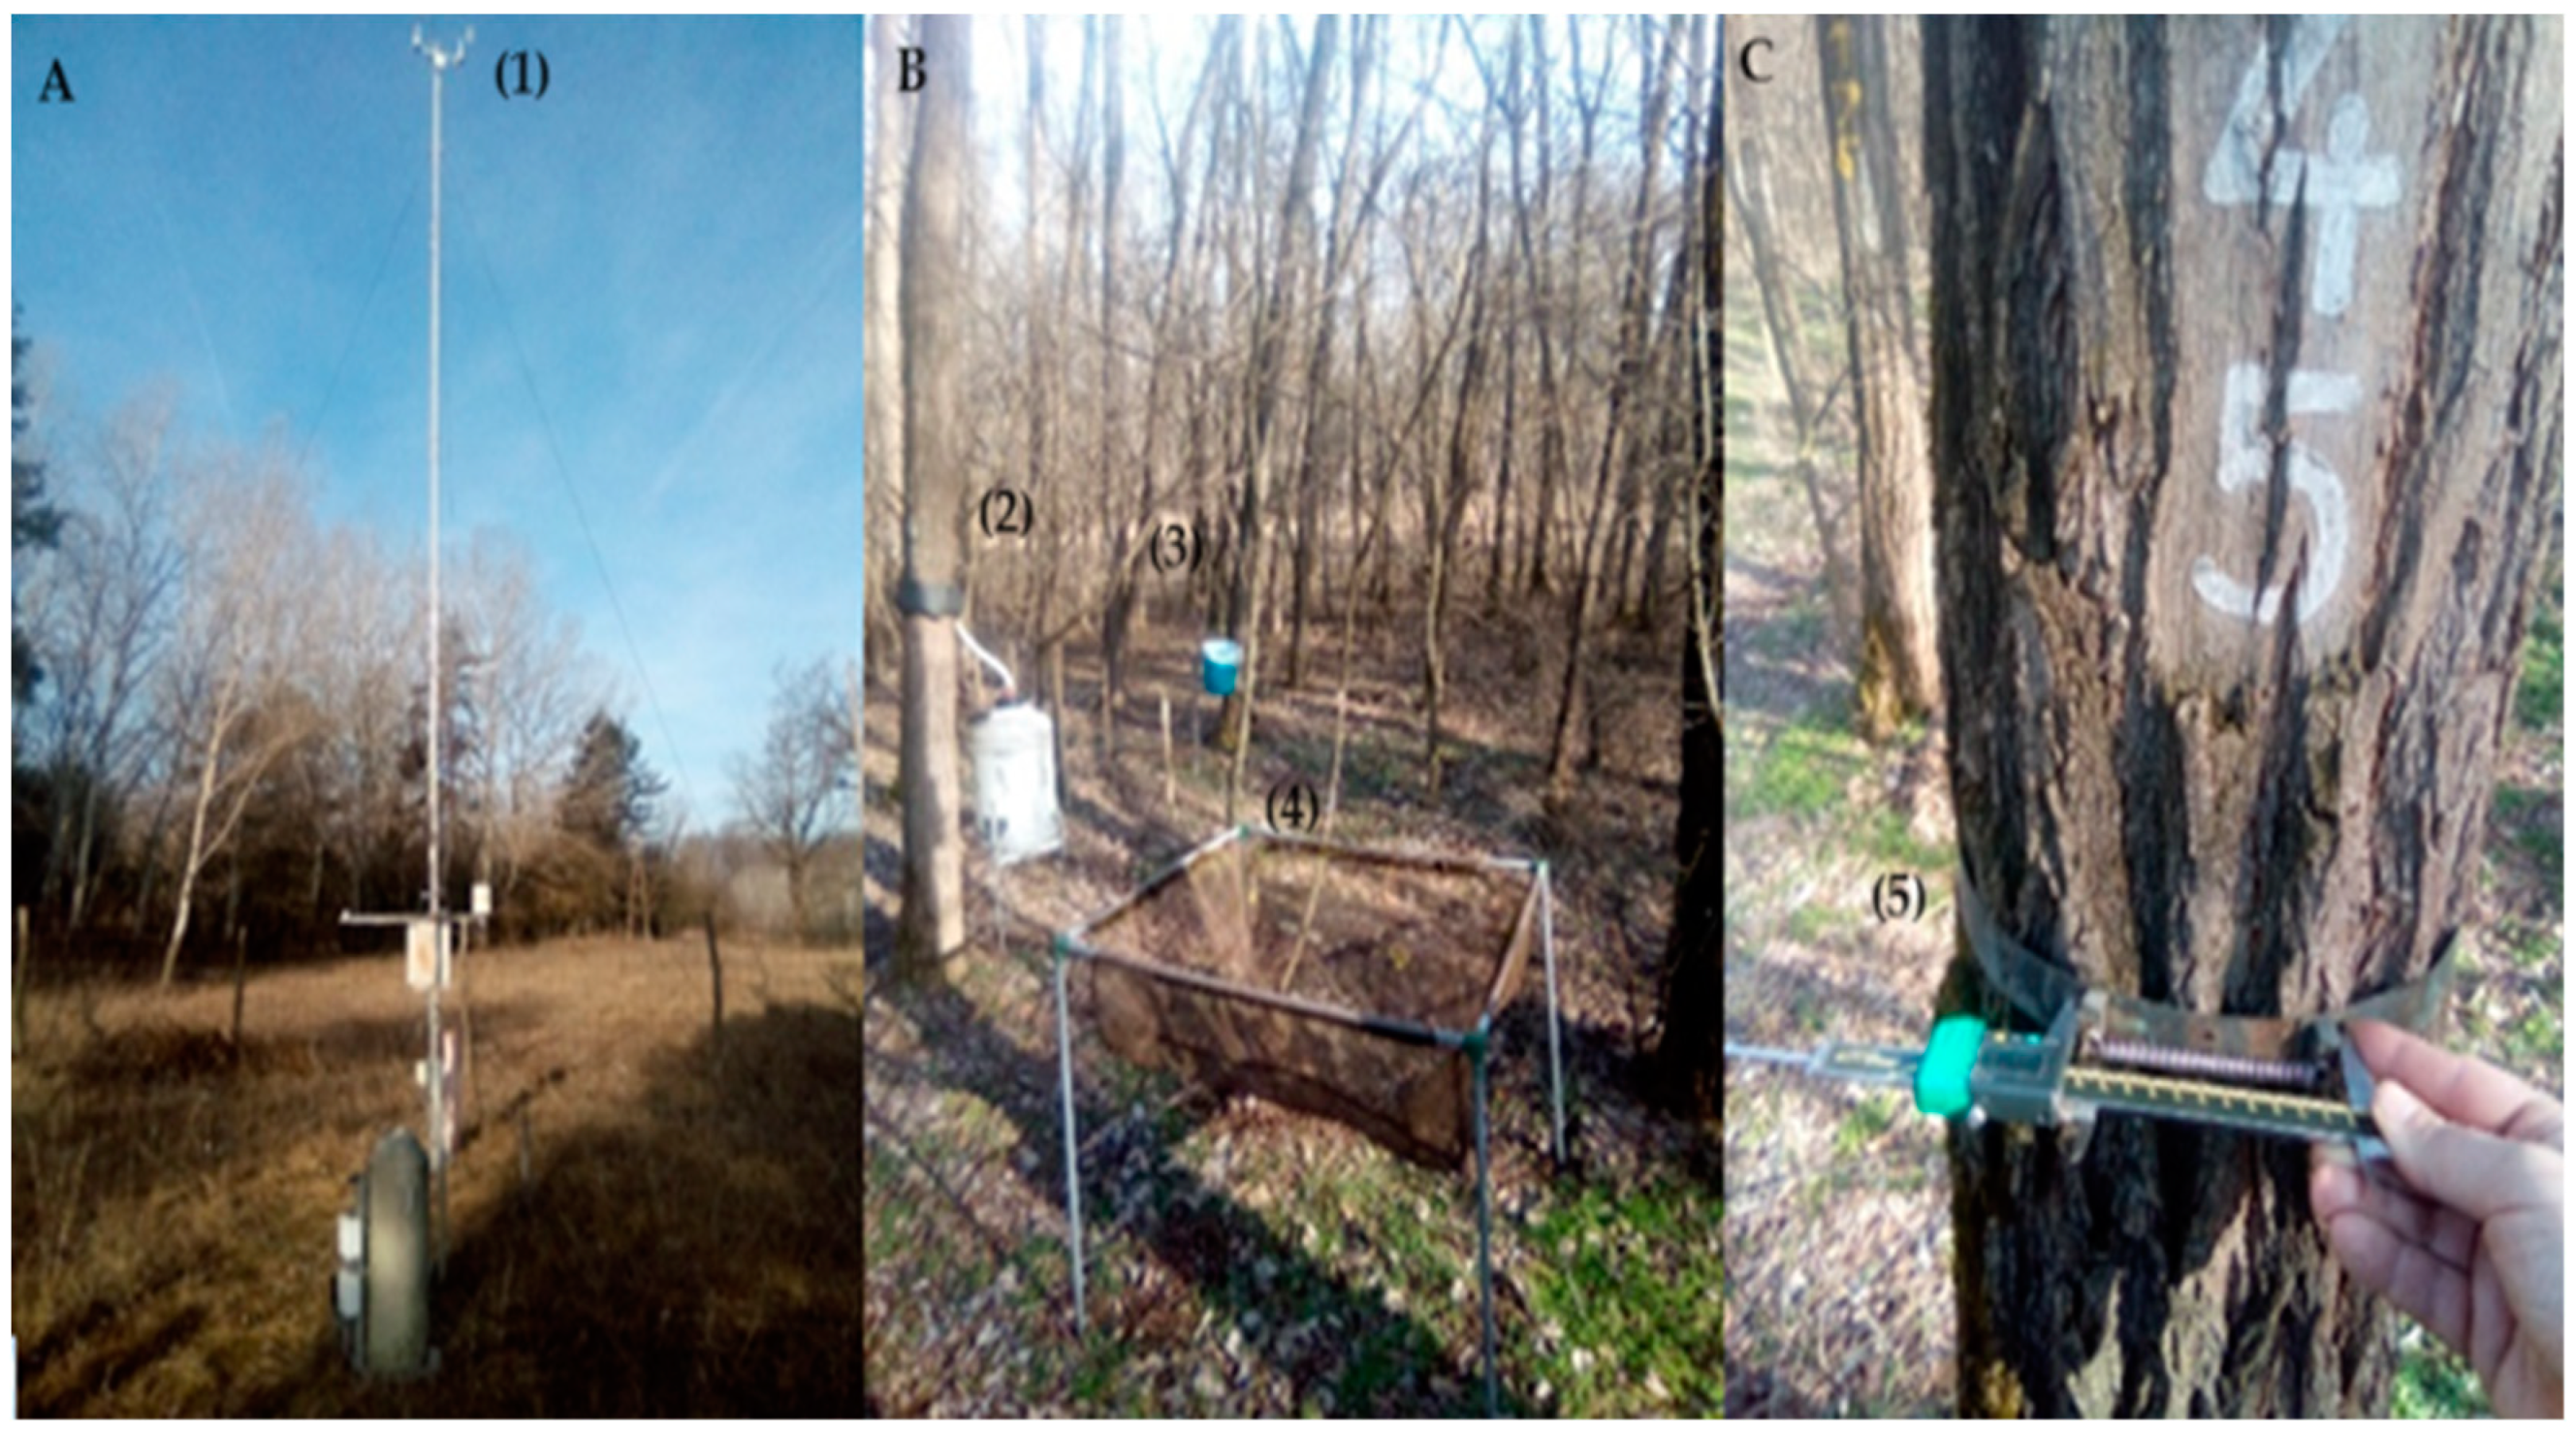
The throughfall in the stands was measured using 12–16 funnels, which were set up in a regular system, and using five buckets. The stemflow was measured on 4–7 trees, depending on the species using collars and barrels. Some of them, mainly the beech stands, were equipped with a water meter. Stemflow trees were selected with regard to their diameter distribution, while the stemflow volume in mm was calculated by taking the basal areas into account (Figure 2).

Figure 2.
Measuring devices in the monitoring plots: (A): (1) weather station, (B): (2) stemflow measurements, (3) throughfall measuring bucket, (4) litterfall trap, (C): (5) measuring of girth band.
The litterfall was collected monthly using five to six 1 × 1 m quadrate traps. The litterfall was sorted into different fractions in the laboratory: leaves of the main and mixed tree species, branches, barks, flowers, seeds, etc. The weight was measured after sorting. We also measured the growth of the trees every week. At least 15 girth bands were installed in each forest site regarding the diameter distribution of the trees (Figure 2).
2.3. Walter–Lieth Climate Diagram
It was deemed advisable to illustrate the relationship between the temperature and precipitation based on the relationships of the Walter–Lieth climate diagram (Walter and Lieth 1960) [43], even for shorter periods. The advantage of the diagram is the estimation of the water supply (humid and drought periods) compared to the commonly used temperature–precipitation diagrams. The diagram was based on the monthly temperature and precipitation. In the case of the turkey oak (M21) monitoring site, the monthly temperature and precipitation data of the Hungarian Meteorological Service were added between 1 January 2017 and 31 May 2019. The climate diagrams were created using a slightly modified version of the diagwl function from the climatol R package version 4.0.0 (Guijarro 2023) [44].
2.4. Forest Aridity Index (FAI)
The forest aridity index (FAI) method uses the average temperature of the critical months (July, August), which is divided by the total precipitation of the main growth period (May, June, July, August); the precipitation of July is given twice, and the quotient calculated is multiplied by 100. This method uses different vegetation types as the climate classes for Hungarian woodlands. The driest category is the forest-steppe type (FAI index min. 7.26) and the most humid category is the beech type (FAI index max. 4.75) (Führer 2018) [45].
2.5. Calculation of the Evapotranspiration and Transpiration
We used the MODIS M16 LT algorithm to calculate the actual evapotranspiration (ET). The M16 LT algorithm applied the total daily ET, which is the sum of the evaporation from the wet canopy surface, the transpiration from the dry canopy surface, and the evaporation from the soil surface (Mu et al., 2013) [46].
To calculate the actual transpiration for each sample area, the actual evapotranspiration extracted from MODIS was reduced by our annual canopy interception values between 2018 and 2022. There was a technical issue with the 2017 monthly data; a good quality of that data was not available due to download problems.
2.6. Remote Sensing
We analyzed satellite maps to support a survey of the large-scale drought utilizing moderate and high-resolution data. The drought was detectable on maps made by the Hungarian Remote Sensing-based Forest Monitoring System (“TEMRE” in Hungarian, Somogyi et al., 2018) [47]. This system is based on a moderate resolution (250 × 250 m) of MODIS satellite image series, which showed the standardized NDVI (Z NDVI), which dropped after the negative effects in the health of the forest as well as the photosynthetic activity in connection therewith. The negative effect could be due to abiotic (like drought) or biotic (insect damage) factors or a series of damage as well, when these factors are combined.
To describe the health state of the forest, we calculated the standardized version of the Normalized Vegetation Index (1 & 2), which is based on the long-term mean (23 years for MODIS and 7 years for Sentinel-2) and its standard deviation compared to a normal, healthy state. The negative values of the Z NDVI refer to forest disturbances or damage, while the positive ones allude to a healthy state or regeneration.
The NDVI (1) is calculated as (Rouse et al., 1974) [48]:
where NIR is the near-infrared, and RED is the surface reflectance in the red coupling channel. The health of a forest is evaluated on an NDVI scale from −1 to 1, where low values indicate water, a vegetation-free area, or low photosynthetic activity, while high values indicate healthy vegetation.
NDVI = (NIR − RED)/(NIR + RED),
However, the NDVI values show the state at a certain time point, while deviations from the average conditions are shown more precisely, which is why we utilized the standardized version of the NDVI, the NDVI Z (2), which was calculated using the formula below (Peters et al., 2002) [49]:
where the NDVI is the value measured in a year; the NDVI mean is the multi-year average (2017–2022); and the NDVIstd is the standard deviation for the same period. The negative values of the Z NDVI refer to damage and the positive ones to regeneration.
NDVI Z= (NDVI − NDVI_mean)/NDVI_std
Besides wall-to-wall maps, we utilized ESA Sentinel-2 imagery (ESA, 2024) [50] as well for monitoring where the damage was more visible at a 10 × 10 m spatial and 2–5 days temporal resolution. The processing was carried out using the Google Earth Engine (Gorelick et al., 2017) [51]. We calculated the Z NDVI as well from Sentinel-2 and reclassified it according to the below based on the majority:
- severe damage: −2 > Z NDVI;
- damage: −2 < Z NDVI < −1;
- moderate: −1 < Z NDVI < 0;
- good: 0 < Z NDVI < 1;
- excellent condition: 1 < Z NDVI.
Classes with positive values, such as a good or excellent state, might refer to regeneration and strong regeneration.
We also calculated the Normalized Differenced Water Index (NDWI) (3) from Sentinel imagery, according to Gao (1996) [52]:
where NIR (near-infrared) is band 8, and SWIR (short-wave infrared) is band 12. The high NDWI values correspond to high vegetation water content and cover, while the low index values correspond to low ones; during the drought periods, the NDWI decreases. The range of the NDWI is similar to that of the NDVI, where -1 refers to the driest and +1 to the wettest state. The NDWI values were classified into five classes. Severe damage was under a 0.4 NDWI value, while 0.5 was damage, 0.6 moderate damage, 0.7 a good health state, and 0.8< was an excellent state. Having the same classes for all the monitoring sites made it possible to compare their health status.
NDWI = NIR − SWIR/NIR + SWIR,
3. Results
3.1. Precipitation and Temperature
In 2022, the amount of yearly precipitation was 8% lower than the average yearly precipitation between 2017 and 2021. The biggest negative difference occurred in the cases of the common beech (M01), sessile oak (M03: 26% = 204.0 mm), and black locust (M19: 21% = 125.8 mm) in a comparison of the yearly precipitation in 2022 and the previous five years. Quite low precipitation in the eastern part of Hungary was detected. The lowest yearly precipitation of 471.5 mm was in the black locust forest stand (M19, central Hungary). However, western Hungary was less affected by drought: the yearly precipitation was 776.6 mm on the Scots pine (M15) and sessile oak (M16) sites. The highest yearly precipitation was measured in the southwestern part of the country around a common beech forest site (M17) (804.3 mm).
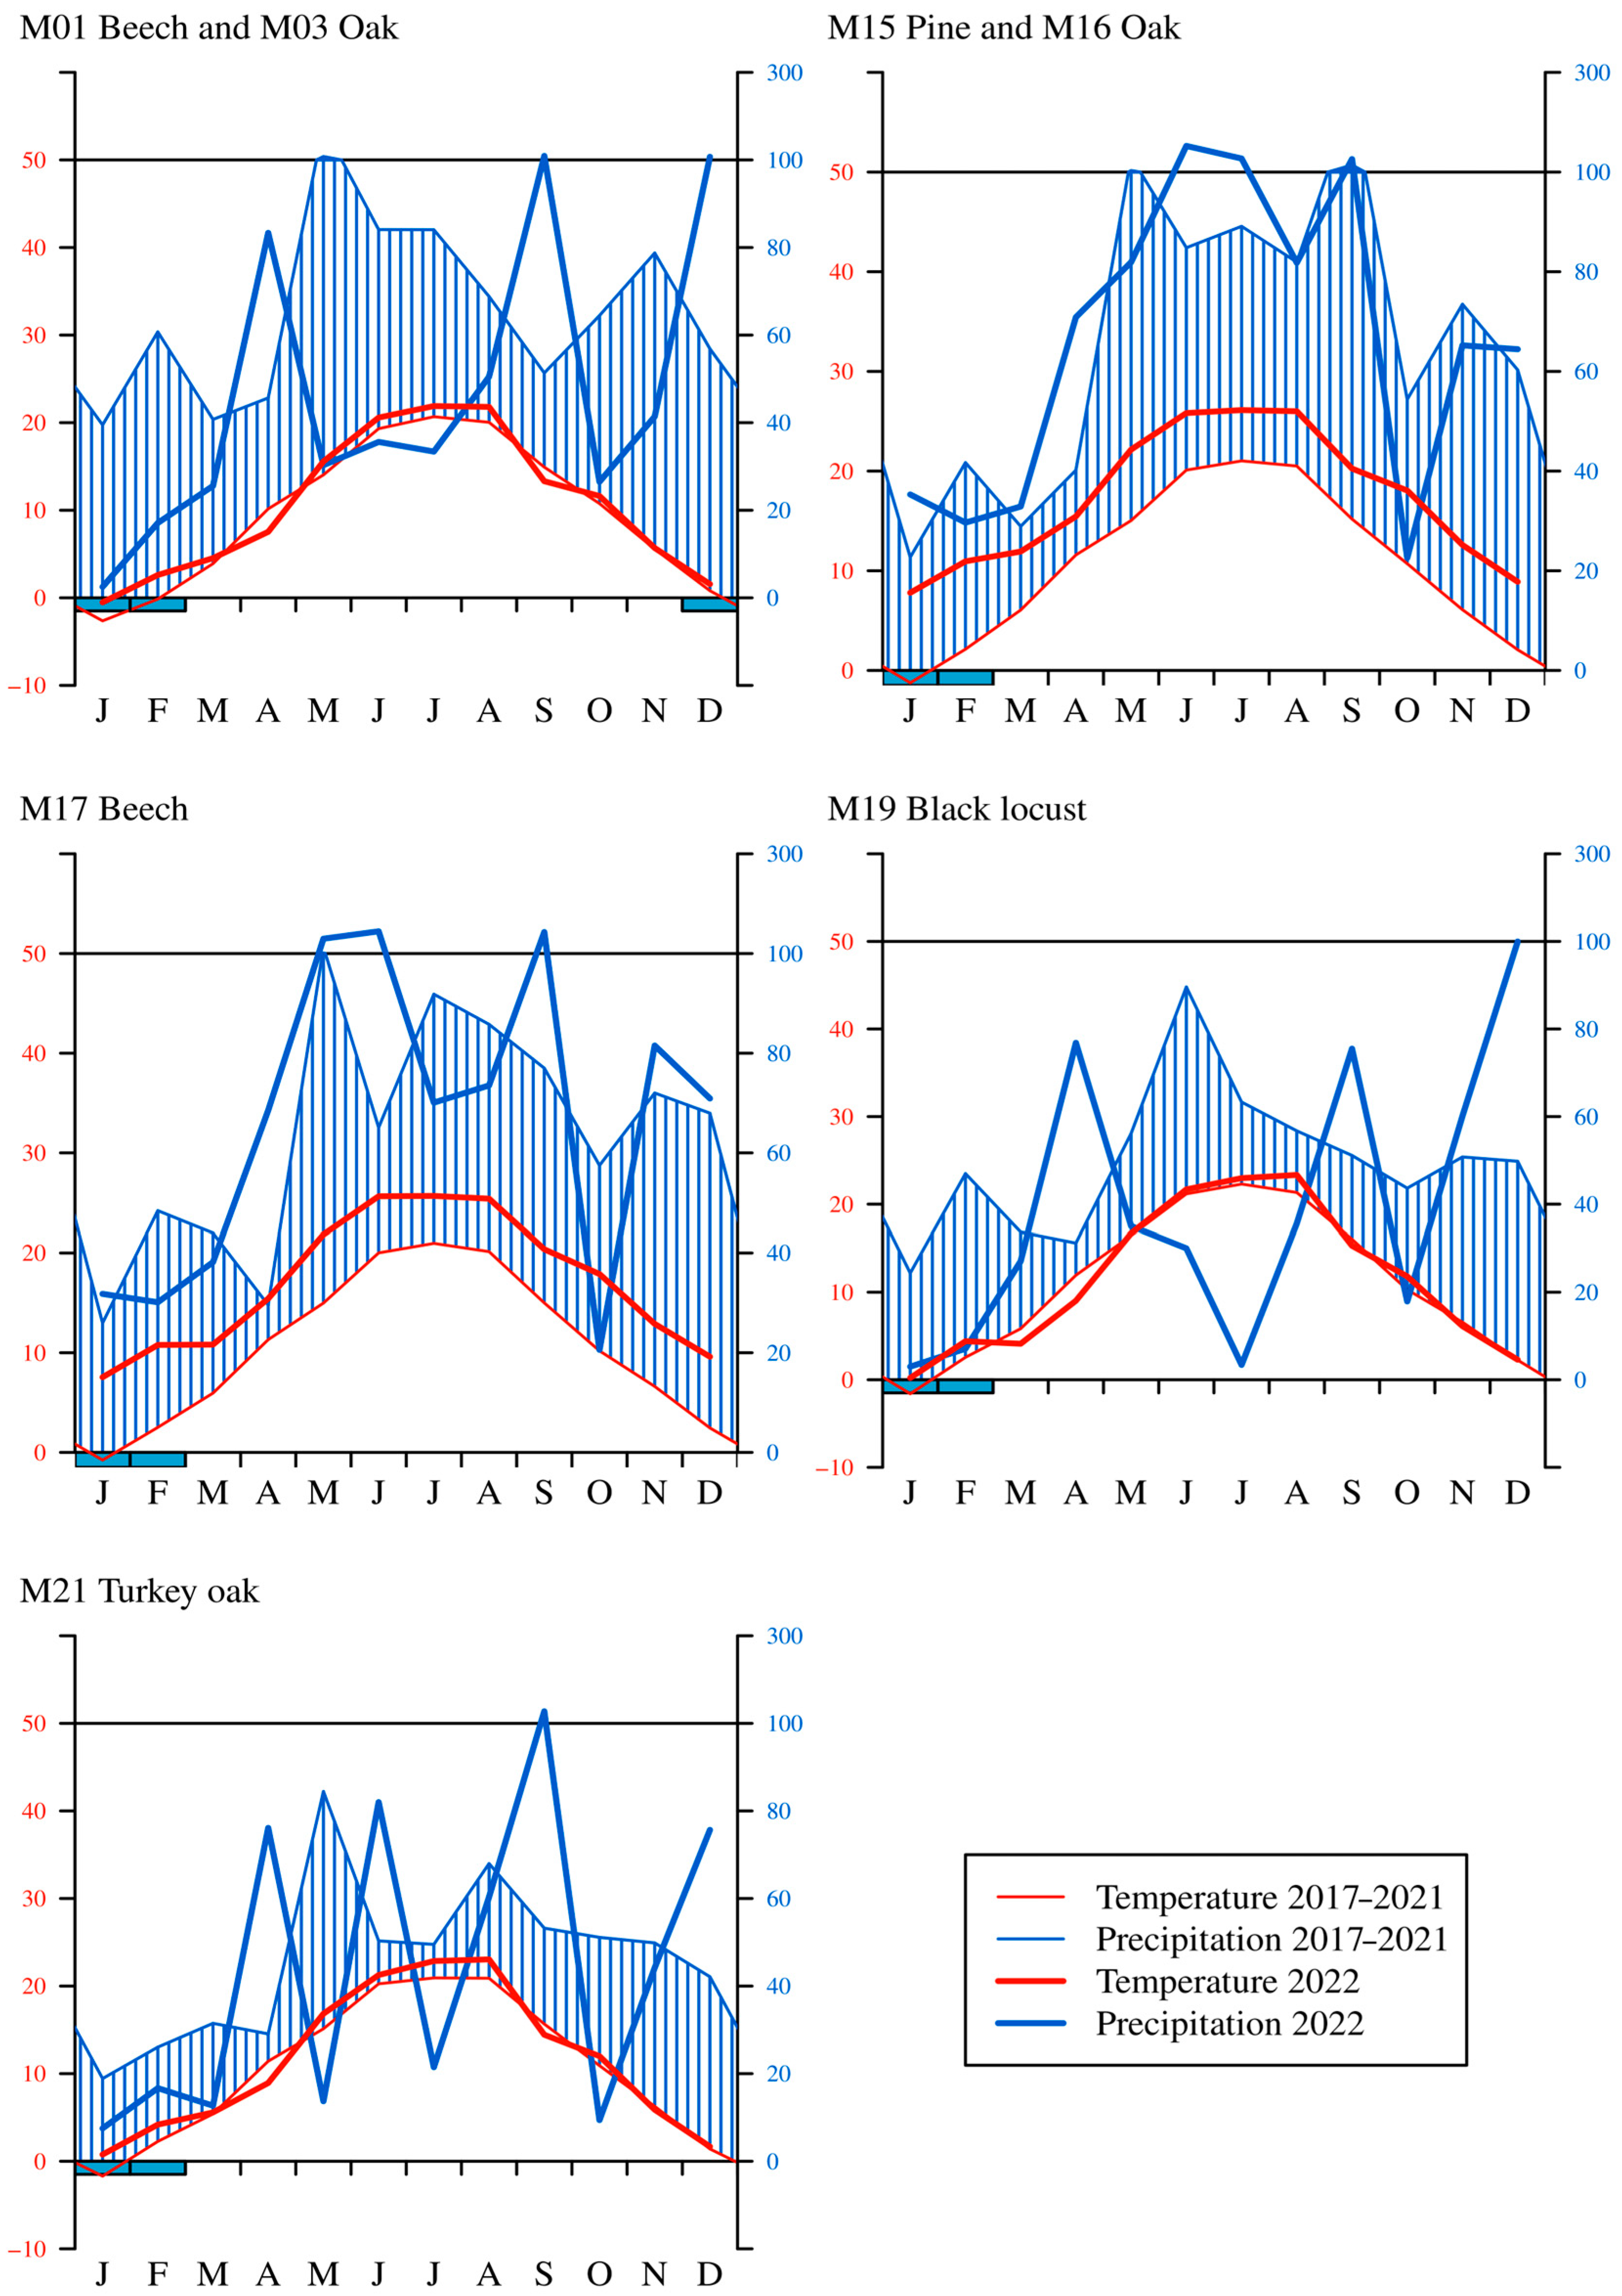
When examining the monthly precipitation amounts, a slight decrease between 2017 and 2022 could be seen in the case of the common beech (M01), sessile oak (M03), and black locust (M19) sites. From 15 June to 15 August 2022, the precipitation was low (by an average of 27.8 mm) on the greater part of Hungary, which affected the central, eastern, and northern regions (M01, M03, M19, M21). The temporal distribution of precipitation was also unequal; it was extremely low in the first three months of 2022. The average precipitation during the dormant season was only 48.5 mm. The precipitation in autumn was also low (27.1 mm) in the western sample areas (M15, M16, M17) (Figure 3).
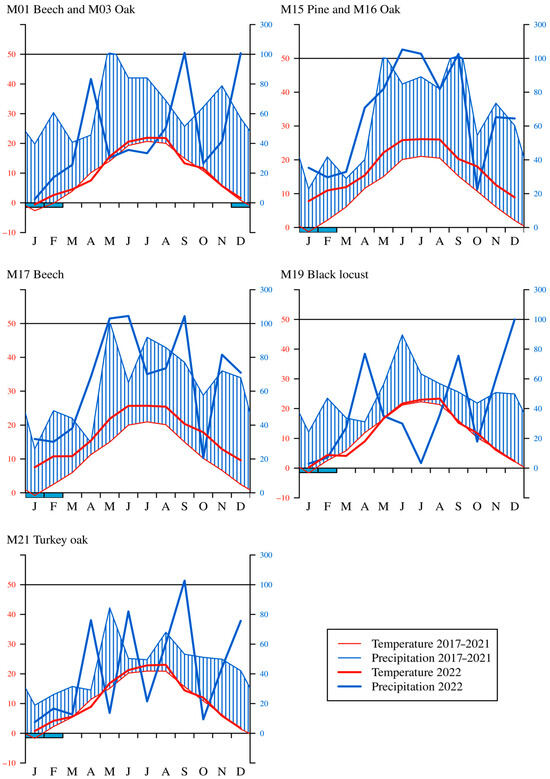
Figure 3.
Walter diagrams in each sample area between 2017 and 2022 (the thick line is the year 2022; the thin line is the average between 2017 and 2021).
The average temperature in 2022 showed an increase according to the temperature data of our meteorological stations compared to the previous five years (2017–2021). The number of heat days (Tmax ≥ 30 °C) and the number of hot days (Tmax ≥ 35 °C) were also high (62 heat days, 14 hot days on the Great Hungarian Plain). The regional monthly temperature increased in 2022 over the average of 2017–2021. The yearly temperature in 2022 was over the average of 2017–2021 in every sample area. The dry period was typical in the first part of the year (January–April) due to higher temperatures and a lack of precipitation in 2022. The highest temperature was usually measured in the black locust forest stand (M19) in 2022. The annual average temperature of 2022 was well over the yearly average temperature of 2017–2021 by 1.3 °C in the common beech (M01) and sessile oak (M03) stands, by 1.9 °C in the black locust (M19) and by 2.6 °C in the turkey oak (M21) sampling areas. Compared to the urban database of the Hungarian Meteorological Service, the sample areas registered an averaged 1.2 °C (the difference between the urban and woody data: a 0.6–1.9 °C) lower temperature, which refers to the temperature-tempering effect of the forest stands in each monitoring plot.
Examining the correlations of the Walter–Lieth climate diagram, we can see the arid periods, which were observed several times; these periods manifested high temperatures without any precipitation (Figure 3). The temperature in 2022 was above the average of 2017–2021 for each sample area. Drought was detected in the months of May, June, and July in 2022 at the common beech (M01), sessile oak (M03), and black locust (M19) monitoring sites. In the case of the turkey oak (M21) sample area, drought was observed in April, July, and October in 2022. A prolonged and severe drought was observed in the black locust stand (M19), which is located on the Great Hungarian Plains. The three sample areas in the western part of Hungary, i.e., the Scots pine (M15), sessile oak (M16), and common beech (M17) stands were less affected by the drought in 2022. Super-humid periods (precipitation above 100 mm) occurred in the mountain and hilly sample areas (common beech (M01), sessile oak (M03), Scots pine (M015), sessile oak (M16), common beech (M17), and turkey oak (M21) stands) due to the large amount of precipitation.
3.2. Forest Aridity Index (FAI)
Regarding the forestry aridity index, we encountered interesting differences in several cases in 2022. In the case of the common beech (M01), sessile oak (M03), black locust (M19), and turkey oak (M21) stands, the FAI value was very high (forest-steppe climate in 2022) due to less summer precipitation and higher average temperatures. The values of 2022 differed significantly from the FAI values between 2017 and 2021 (beech and oak climates). The FAI values of 2022 did not detect any drought in the sample areas in the western part of the country (M15 Scots pine, M16 sessile oak, M17 common beech forest stands). The FAI values clearly showed a severe drought in the sample areas listed above in 2022 (Table 2). In the future, the forestry aridity index will be an important parameter for careful characterizations of the climate of each woody sample area.
Table 2.
Forest aridity index values 2017–2022.
3.3. Interception and Stemflow
The average value of the canopy interception was 33.3% in the common beech sites (M01, M17), while this value was 19.1% in the sessile oak sites (M03, M16) in 2022. The value of the interception without any stemflow was measured at 21.1% at the Scots pine site (M15), for which the average interception (26.2%) between 2017 and 2021 was less. At the black locust site (M19), the interception was higher than the average of the previous five years because there was a lot microprecipitation in 2022, which only affected the infiltration of the canopy (Table 3).
Table 3.
Interception and stemflow values in the sample areas.
The value of the stemflow in the common beech stands (M01, M17) in 2022 was similar to the previous average values (2017–2021), while in the other wood stocks (M03, M19, M21), it was barely measurable or negligible according to the previous measurements and the published results (Table 2). The stemflow value was lower in the sessile and turkey oak stands (M03, M21) because the bark of the trees is thick, rough, and absorbent. This finding was also true for the black locust forest stand (M19). On the other hand, this value was much higher in the common beech stands (M01, M17), as the bark of the tree is smooth and drains water.
3.4. Measuring the Litterfall and Tree Growth
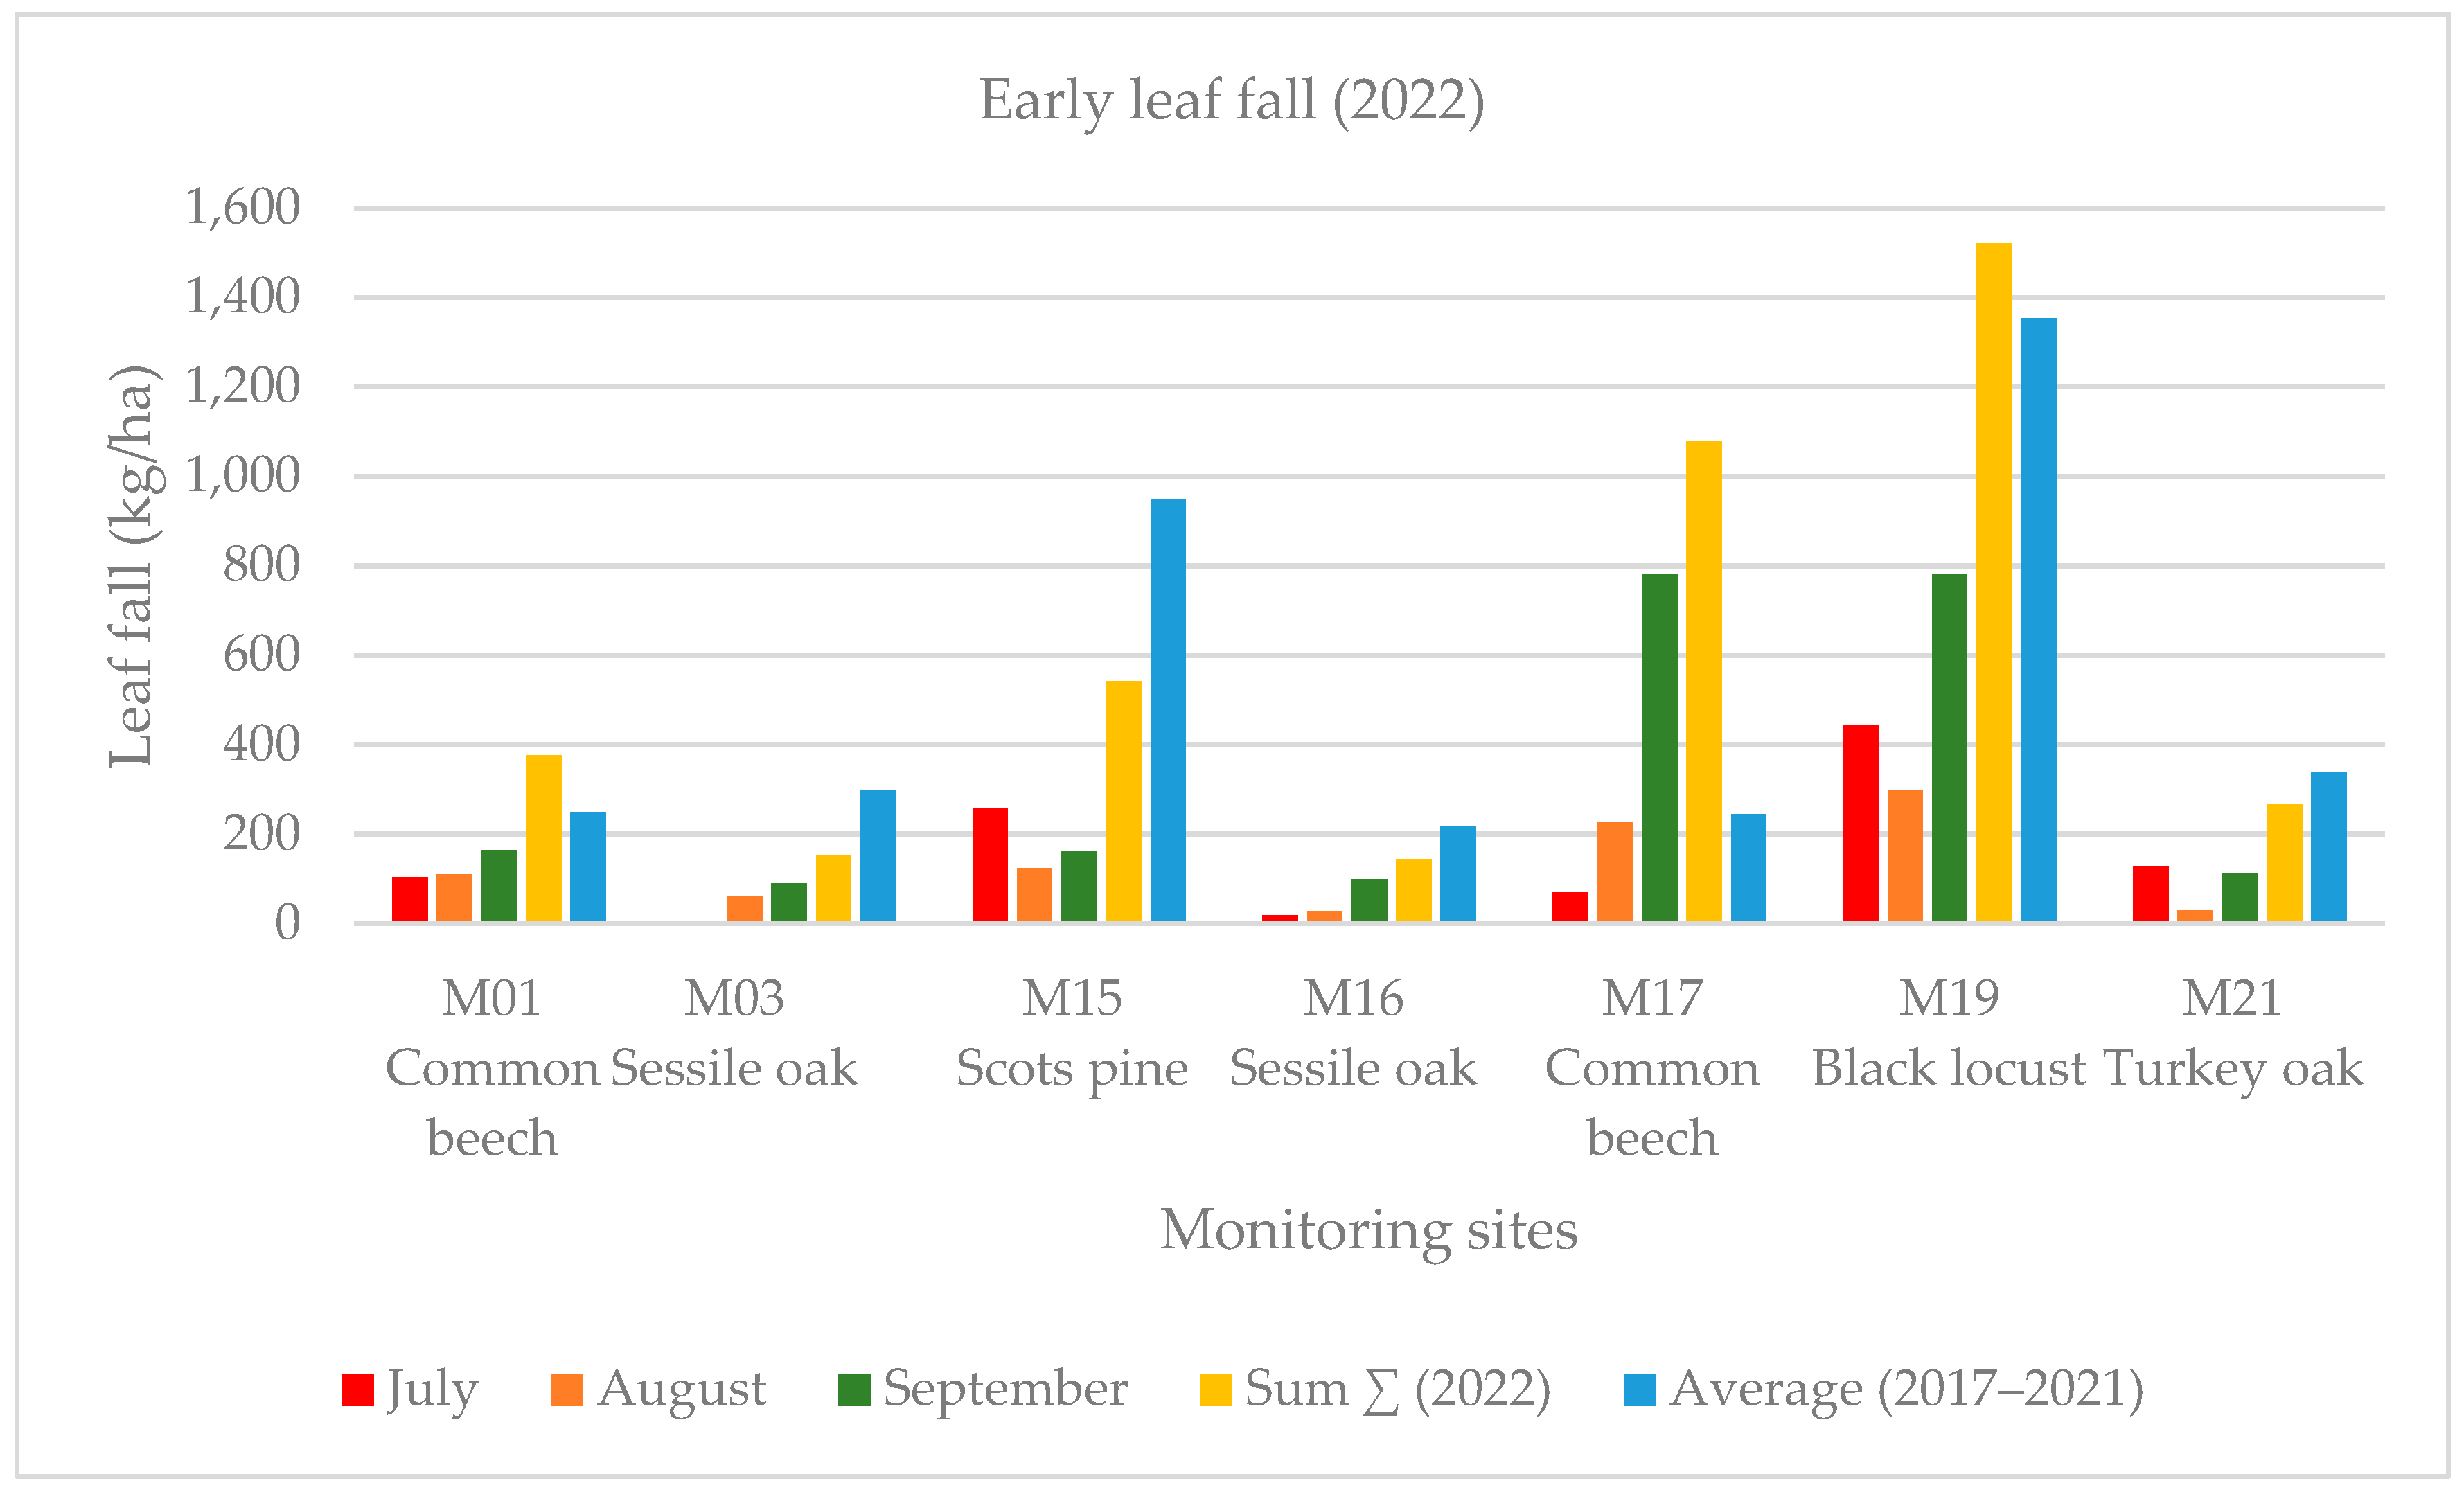
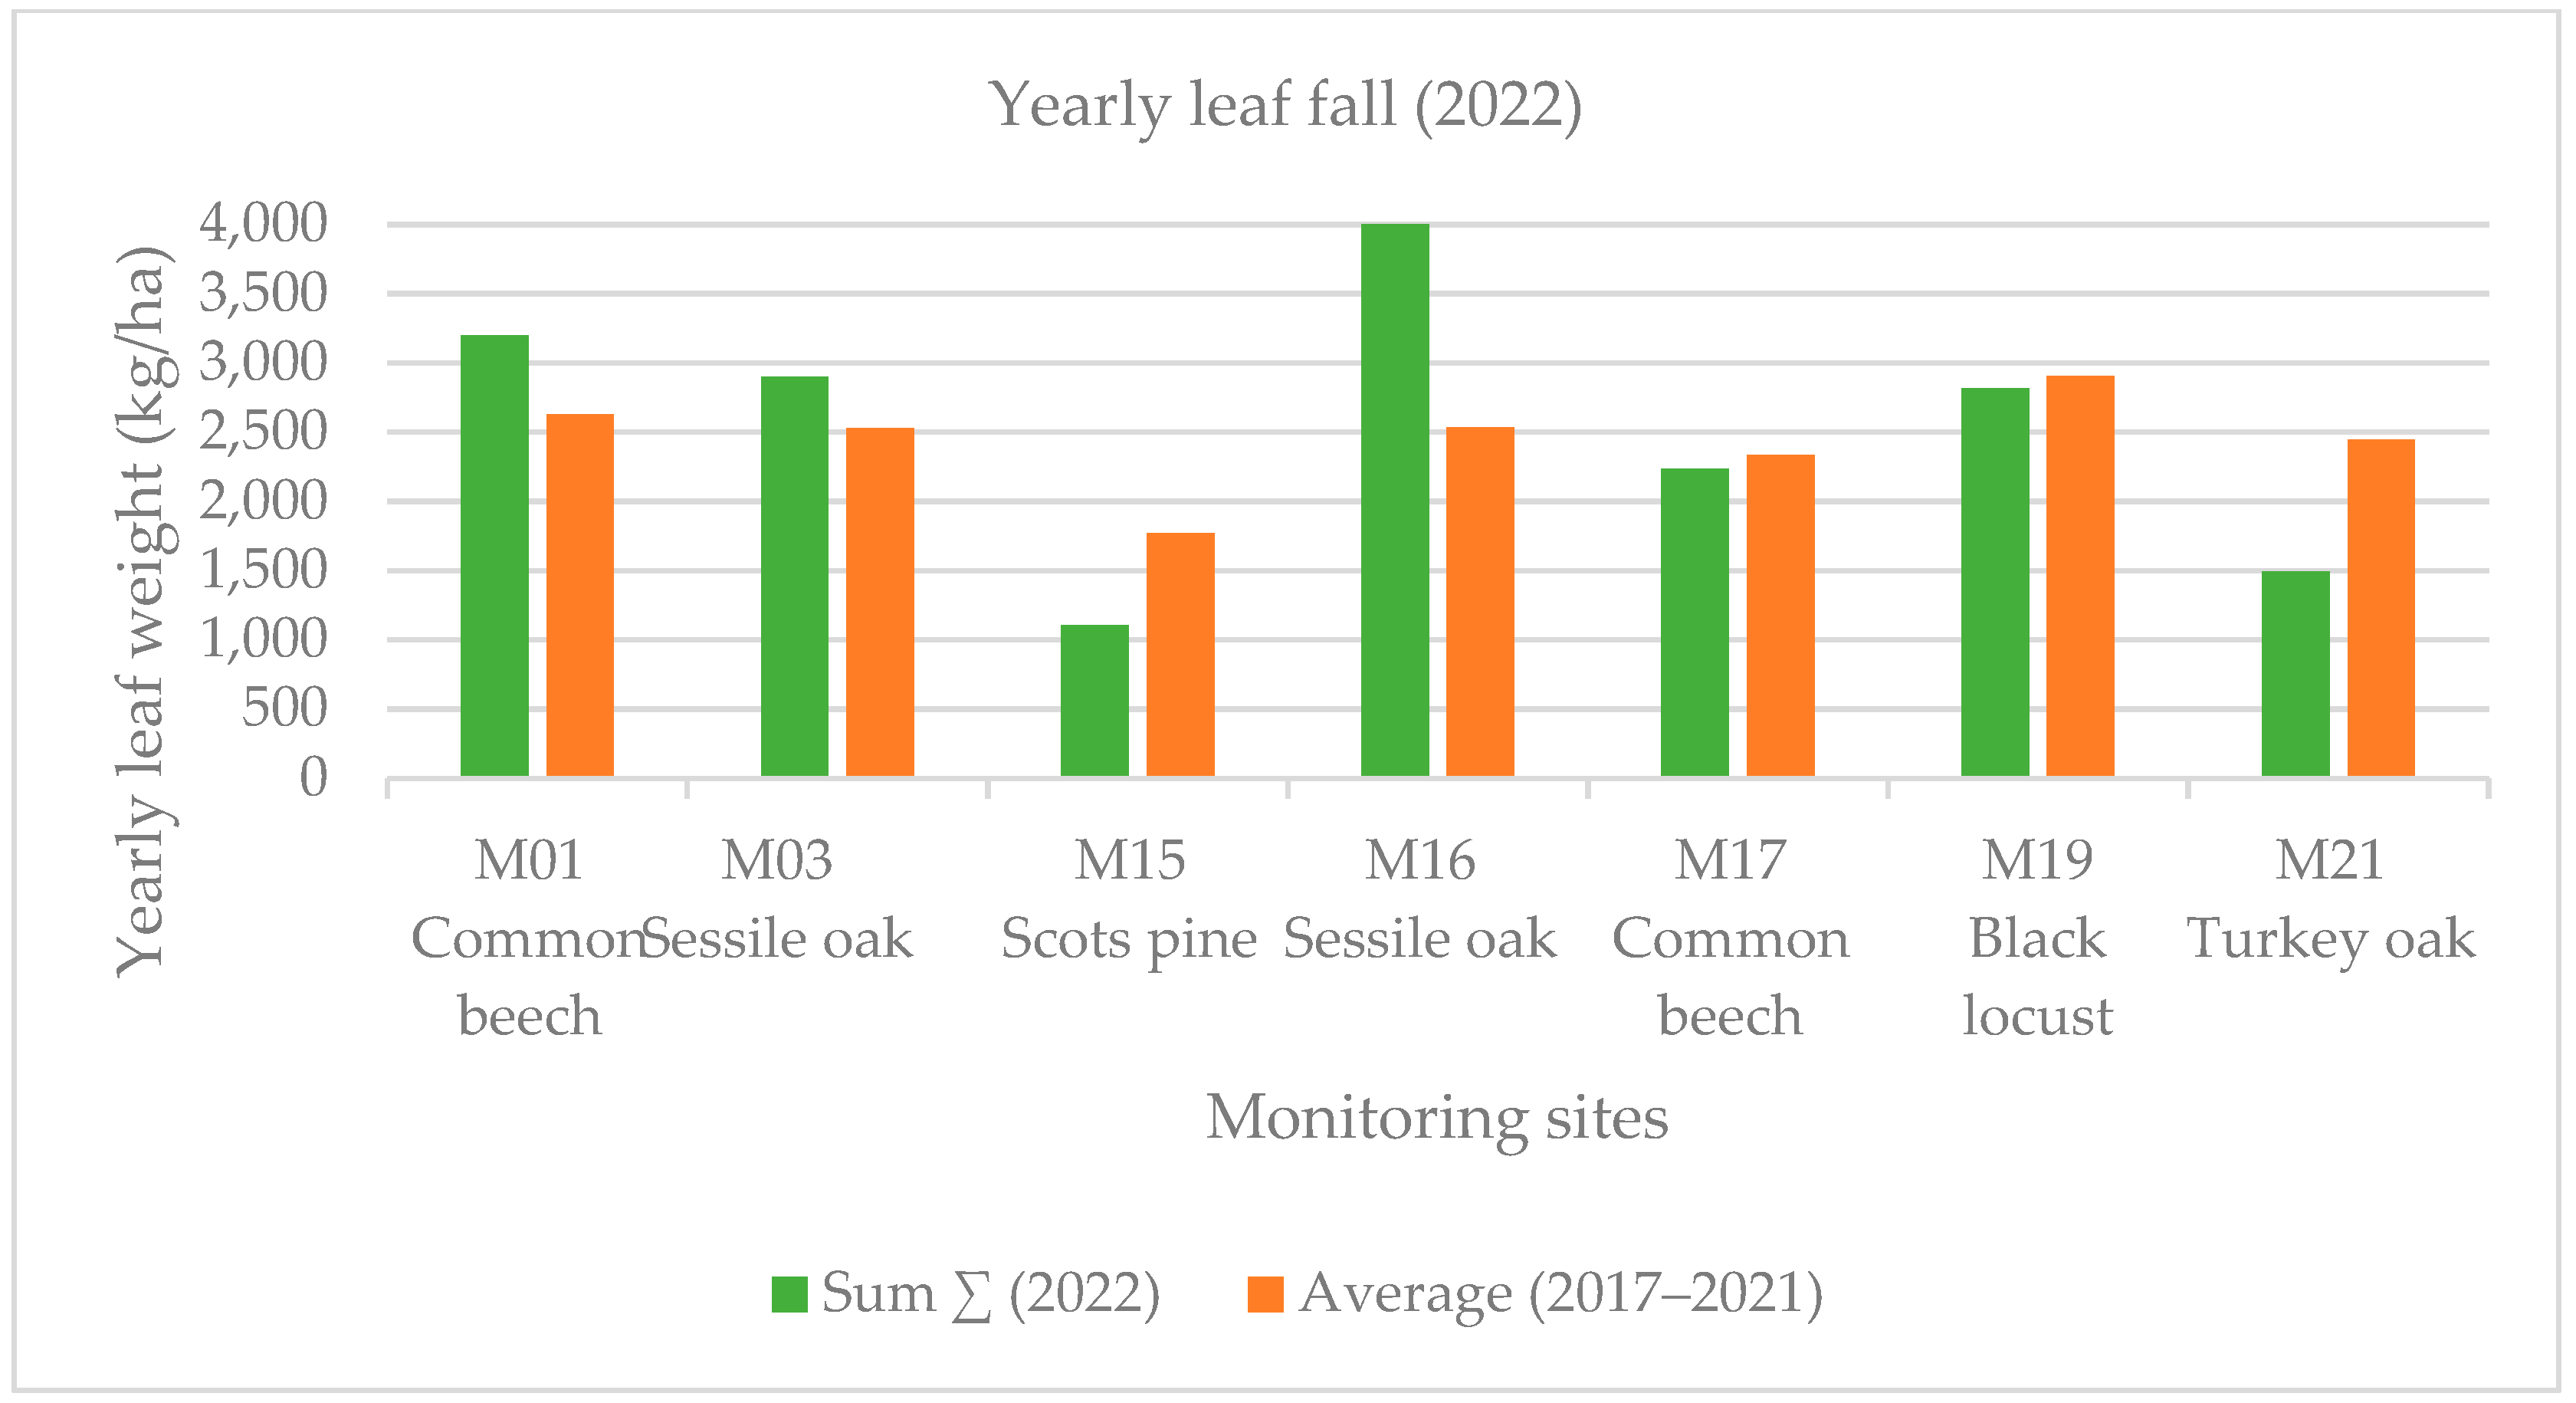
Early leaf loss was well established in the black locust forest stand (M19) in July 2022. This forest showed the harmful effects of the severe drought in the Sandridge region. In this case, early leaf loss was related to high summer temperature values. Early leaf loss in July was a small fraction (1%–4% in deciduous forest stands) of the annual biomass at each monitoring point except for the previously mentioned black locust forest stand (M19), where this value was much higher (13% among the deciduous forest stands) in July 2022. The yearly averaged leaf weight was less than that of the five-year average (2017–2022) with 21% at the four monitoring points (M15, M17, M19, M21). The summer leaf loss (July and August) was 14% at our monitoring sites, and the early leaf fall was 13% in September, 2022 (Figure 4 and Figure 5).
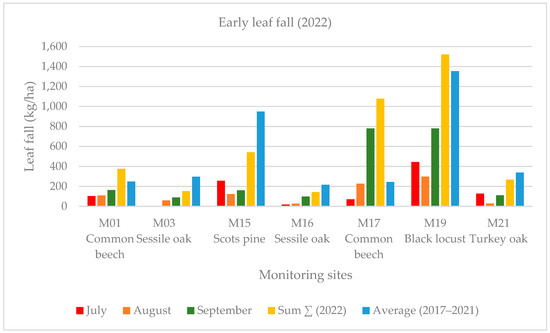
Figure 4.
Monthly early leaf fall (July, August, September) in the monitoring sites in 2022.
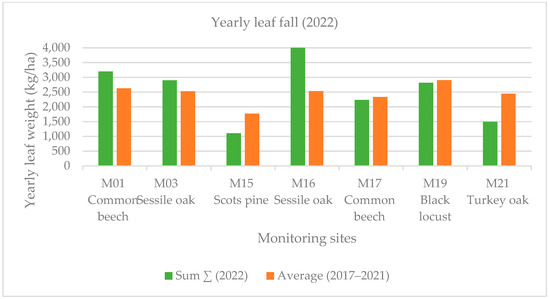
Figure 5.
Yearly leaf fall in the monitored sites during 2017–2022.
The annual growth of the common beech (M01, M17), sessile oak (M03, M16) and black locust (M19) forest stands was less than in previous years, but the growth of the Scots pine (M15) and turkey oak (M21) was more than the average of the previous years (2017–2021). The growth in girth was 35% less on average in the five sample areas in 2022 than the average of the previous years (2017–2021). The biggest difference was measured at the common beech forest stand (M17) at 61%, which was 46% at the other common beech wood stock (M01) and 43% at the black locust monitoring site (M19) compared to the previous five years (Figure 6).
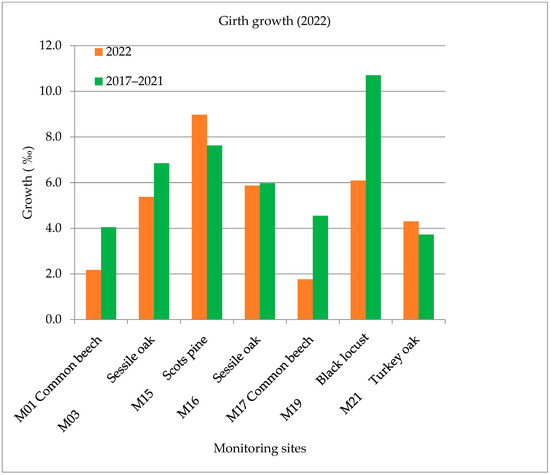
Figure 6.
Growth in girth values in 2022.
Interestingly enough, the common beech wood stock (M17), which is located in the western part of the country, showed the greatest decrease in the growth of the diameter (61% less than the average growth) in 2022. According to the health report in 2022 of the Forest Research Institute, an average leaf loss of 24.1% was registered, which was clearly caused by the dry, droughty weather conditions.
The Scots pine (M15) and sessile oak (M16) forest stands near the Austrian border produced various growth rates, which are also supported by our meteorological data. The Scots pine (M15) produced 18% less growth compared to the average between 2017 and 2021. The turkey oak forest stand (M21, which is located near Budapest) produced 15% growth in 2022. The Scots pine (M15) and turkey oak forest stands (M21) produced a good growth value despite the drought in 2022.
3.5. Evapotranspiration and Transpiration
The actual evapotranspiration (AET) is a significant component of the water balance in forests, which is why we focused on it. While applying the M16 LT algorithm to the actual evapotranspiration (AET) calculated, we used our local interception values on the reduced evapotranspiration to calculate the annual transpiration values in the years between 2017 and 2022. The highest AET value was determined at the common beech forest stand (M17: 615 mm), which was related to the high average temperatures in 2022. The black locust (M19) wood stock showed the lowest evapotranspiration (AET) values in 2022, because there was not enough water available for evaporation and transpiration. The value of the AET in 2022 was lower by 11% than the average of 2017–2021 for all the areas sampled (Figure 7). The difference was more than 10% compared to the reference years (2018–2021) in the monitoring areas (M01: common beech, M17: common beech, M19: black locust, M21: turkey oak), which were mostly affected by the drought in 2022.
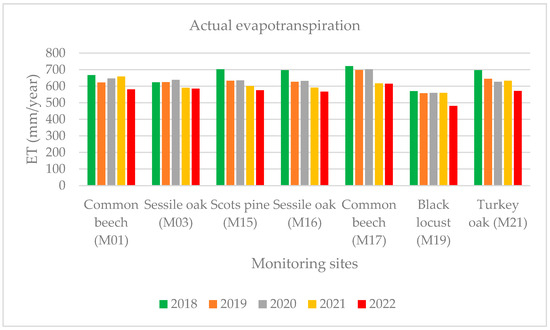
Figure 7.
Yearly actual evapotranspiration during 2018–2022.
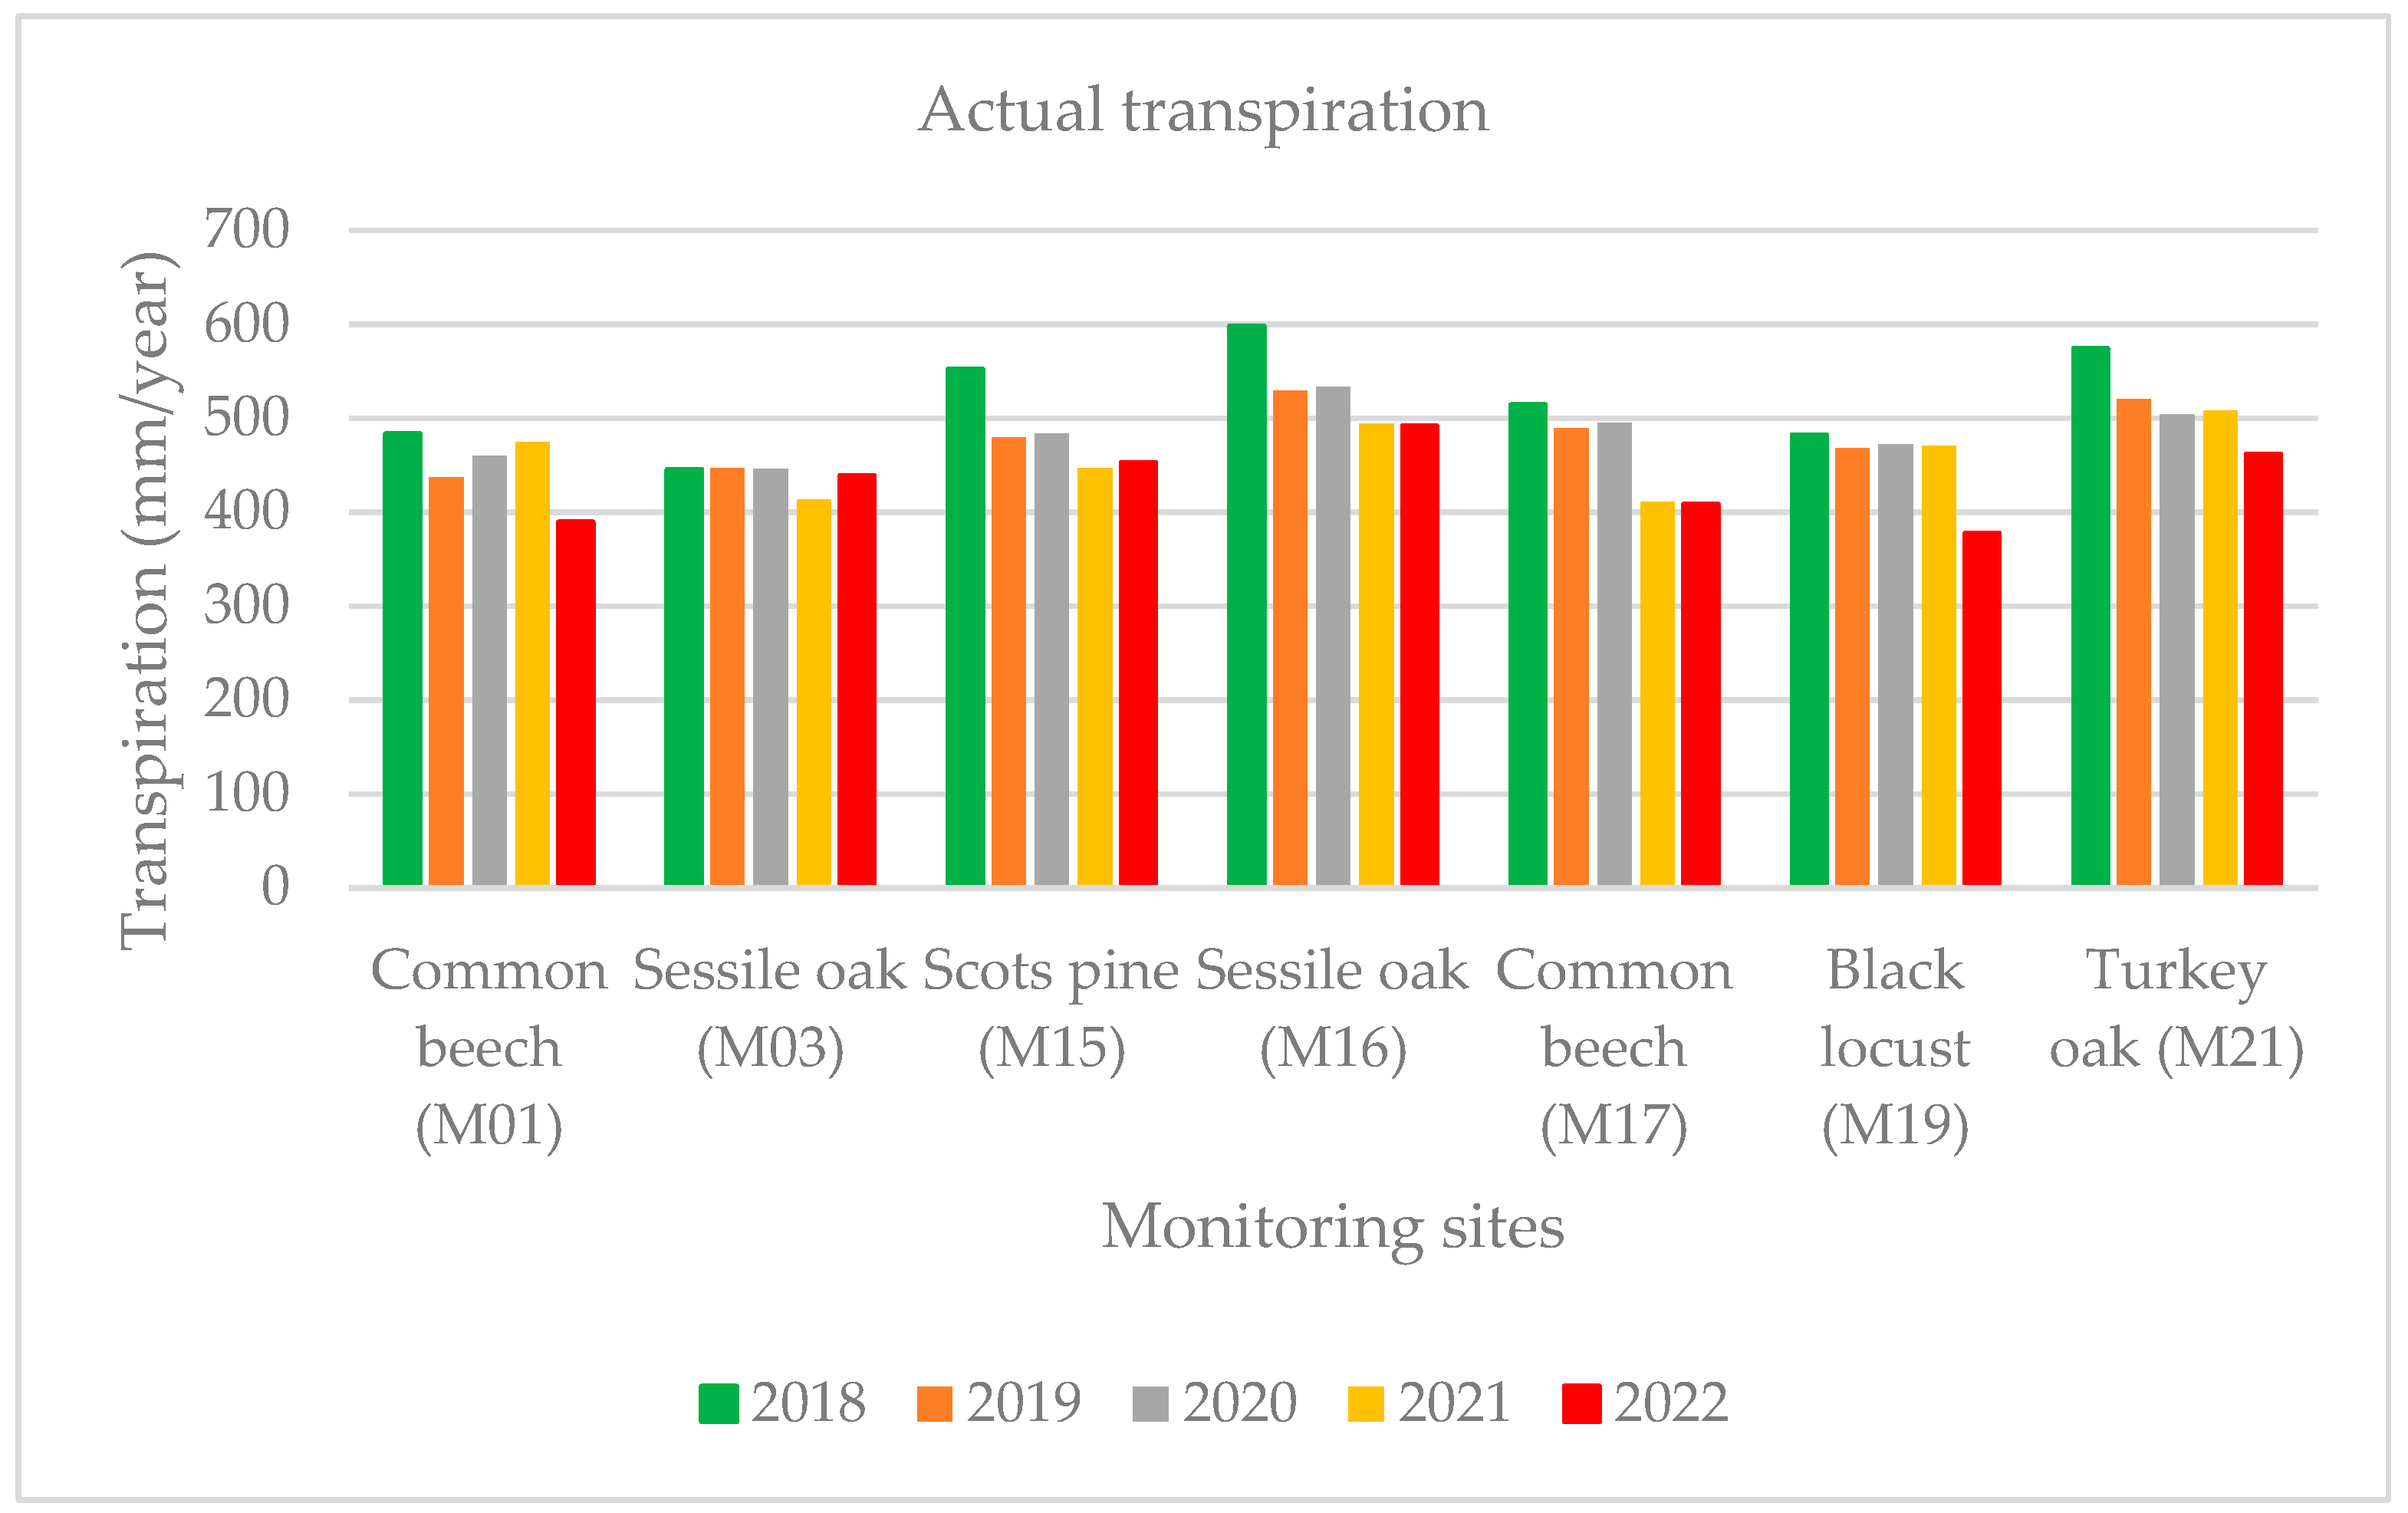
As expected, the lowest yearly actual transpiration (AT) value (378 mm) was determined at the black locust stand (M19) in the Great Hungarian Plain with the highest at the sessile oak forest stand (M16: 492 mm) in 2022. The transpiration in 2022 was also lower than the average of 2017–2021 for all the sample areas because of the drought (Figure 8). The values of the evapotranspiration and transpiration were significantly affected by the changes in the yearly temperature and precipitation conditions.

Figure 8.
Yearly actual transpiration between 2018–2021 and 2022.
The ET values discussed above were found to fall within the range of values specified for the corresponding tree species in Hungary (based on the comparison data of the evapotranspiration maps validated for Hungary and published by Csáki, 2020) [60].
3.6. Remote Sensing
Based on the MODIS satellite imagery of the Hungarian Satellite-based Forest Monitoring System, the results show how the forest stands reacted to the extreme drought of 2022 on a national and a local scale, which was supplemented by our meteorological data and our depositional ground measurements. The calculated forest health status mapped on the NDVI, Z NDVI, and NDWI indices showed damage and regeneration throughout the period studied. MODIS-based Z NDVI maps for 2022 showed the negative effects of the drought in 2022 (Figure 9, Table 4).
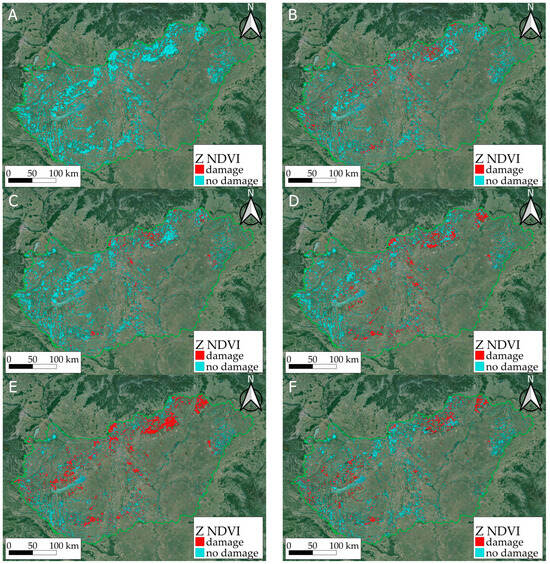
Figure 9.
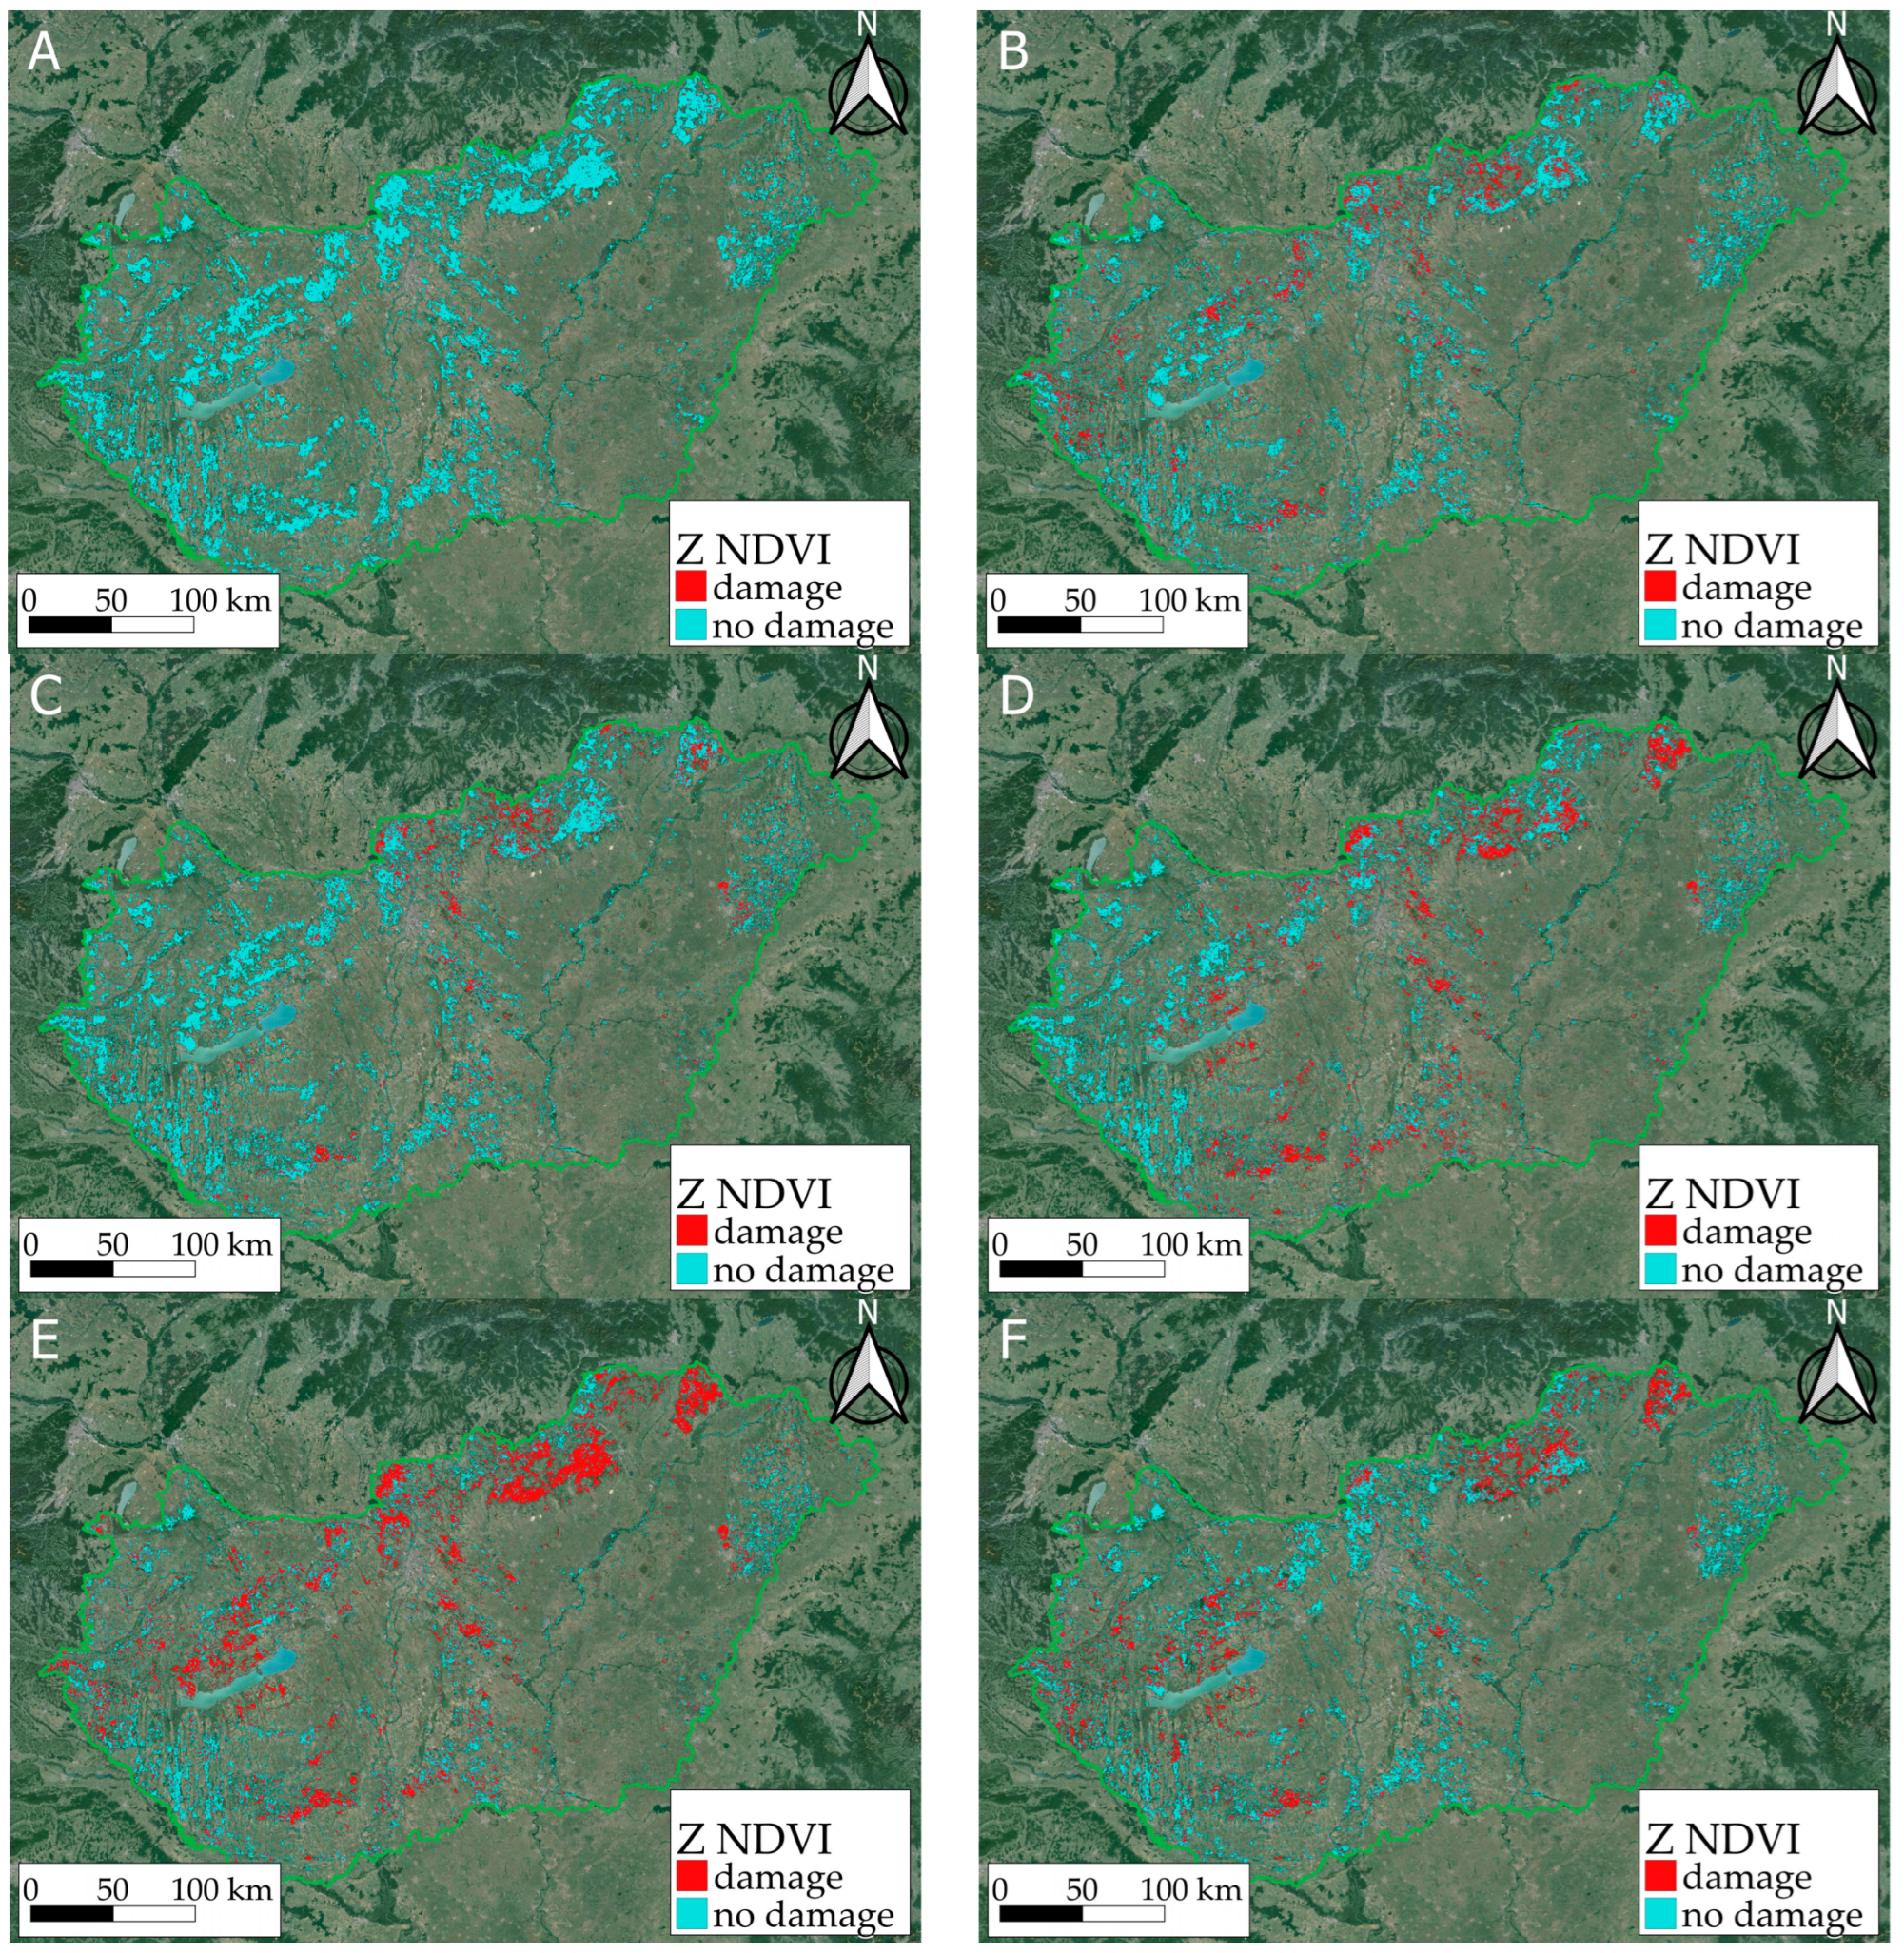
Impact of the drought in 2022 in the first (A), and second half of June (B), the first (C) and second half of July (D), the first (E) and second half of August (F) on the classified Z NDVI maps. Damaged forest areas are shown in red, while areas with little or no damage are shown in blue.
Table 4.
Statistics of the remotely sensed damage in the forests for the period June to September in 2022 on the MODIS imagery.
The figure shows the differences between the Z NDVI values, where the positive values (improvement, recovery) are in green, and the negative values (deterioration) are in yellow, orange, and red, respectively, according to the severity of the damage. This map shows that almost the entire region had been affected by the drought to some extent, but the North Central Mountains, the Mecsek Mountains (southern mountains), and the Duna–Tisza plain (the central region) were affected to a very significant extent. However, there was some improvement by September, presumably due to the rainfall after the summer.
In addition to the moderate-resolution dataset, we also carried out high-resolution, ESA Sentinel-2 satellite-based imagery analyses using Google Earth Engine cloud computing. Here, we can see the changes in the health status within the forest stands due to the 10 × 10 m spatial resolution. Figure 10 shows the seven monitoring sites, where the difference between the sites can be seen. We analyzed the effects of the drought in 2022 at each site based on the water content of the canopy, as measured by the NDWI. The NDWI values of the growing seasons differ significantly due to the drought; the different tree species also reacted differently to the drought conditions. The turkey oak was the most severely affected by the lack of precipitation at site M21 with 80% of the site’s pixels in the moderately damaged healthy class. The black locust also suffered from drought at site M19, where around 20% was moderately and 5% more severely damaged. The sessile oak and common beech also showed 5%–10% damage. Depending on the intensity of the potential forest damage, the more severely damaged forest stands are marked in red and orange, while the less damaged ones are marked in yellow and the healthy ones in green (Figure 10).
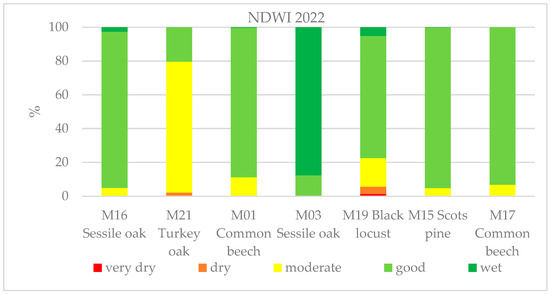
Figure 10.
NDWI chart derived from satellite imagery of 2022 showing the water content of the canopy at the seven sites monitored. Due to the severe drought, the photosynthetic activity of the forest stands and the water content decreased, which can be seen in the form of forest status classification.
We observed a significant drop in the photosynthetic activity as an indicator of forest damage, where the Z NDVI values were below −1 (see the red pixels in Figure 9). According to our estimations, the area of potentially damaged forests grew from 2% to 36% between June and August 2022 (Table 2), which affected 735.000 ha. The estimation is based on a number of at least 75% forest-covered pixels compared to the total forested area (2 million ha), where a pixel is 6.25 ha large, which is similar to an average forest compartment size in Hungary. We marked the damaged pixels on the maps in red (Z NDVI < −1) and the least or undamaged ones in blue (Z NDVI > −1). The analysis covered the period from June until September with six maps based on 16-day periods.
The reclassified Z NDVI values of the Sentinel-2 mosaics for 2017–2022 showed results similar to those in Figure 9 for 2022, namely that 2022 stood out negatively due to drought. The shifts in the Z NDVI classes show their deterioration in 2020, 2021, and especially 2022 (Table 5). The difference between 2021 and 2022 is most significant, where the Z NDVI class in a good condition with 68% was replaced by the severe damage class with almost the same percentage of 67%. The impact of the drought is therefore clearly evident.
Table 5.
Statistics of the remotely sensed damage in the forests for the period 2017–2022 on the Sentinel-2 imagery, as expressed in percentages [%].
4. Discussion
Various authors have reported drought-induced forest mortality from many parts of the world (Carnicer, 2010; Allen et al., 2009; 2010) [61,62,63], although we lack the knowledge to define this as a global trend (Hartman et al., 2022) [64] or to connect the phenomena directly to global climate change (Fensham, 2019) [65]. The extreme dry weather of 2022 also caused a similar phenomenon in Hungary. The parameters and effects of this process were examined at seven monitoring points across the country.
The drought did not affect the sample areas equally. The yearly precipitation was much less; therefore, it showed a significant deficit (126–204 mm) in 2022 compared to the previous five years at the common beech (M01), sessile oak (M03), and black locust (M19) sample areas. The negative effects of the drought were also visible in the southwestern part of the country (M17 common beech). The drought was less typical and had no clearly detectable negative effects at the Scots pine (M15) and sessile oak (M16) forest stands in 2022. It had the greatest negative effect on the black locust forest stand (M19) in the Sand Ridge region in the Great Plain, where the lack of water was already typical in the past and is even increasing nowadays (Szabó et al., 2022) [66].
We compared our dataset to the database of the Hungarian Meteorological Service, and our results of the woody sample areas showed an average of 1.2 °C lower temperature values, which demonstrate the temperature-tempering effect of the forest stands in each of the monitored plots.
The forestry drought index (FAI) also clearly indicated that the year 2022 was extraordinary. The FAI values showed that drying had already started in previous years, but actually peaked in 2022.
The canopy interception values were lower in almost all the sampling sites compared to the values of Führer 1984, 1992, 1994; Járó 1980, Koloszár 1981; Kucsara 1998 and Szabó 1979 [53,54,55,56,57,58,59]. The consistently lower interception value cannot be explained by the early defoliation but can be explained by the lower canopy closure, the poor quality of the trunks, the distribution of the branches, and the location of each tree. A comparison with previously published values was also difficult due to the diverse forest stand structures and the different age and measurement methodology.
The defoliation in July is a small fraction of the annual biomass mass at each monitoring point except for the previously mentioned black locust forest stand (M19), where the leaf loss was much higher in 2022. The yearly average leaf weight was less by 21% than the five-year average at most of the monitored points. The summer leaf loss (July and August) was also significant in our monitoring sites in 2022. According to the ICP forest report, there was extensive moderate as well as severe crown damage (mean defoliation: 41%) for all the species in 2022 (Nagy and Szalók 2023) [67]. Based on the National Land Centre report, there was a large (61%–99%) amount of leaf loss in the common beech sample areas in Zala county in 2022, but the crown damage was only 24.1% in the common beech (M17) sample area, which was clearly caused by the dry, droughty weather conditions according to the health report of the Forest Research Institute. Overall, the forest stands observed tolerated the negative effects of the drought well based on our biomass data. The Scots pine (M15) and turkey oak forest stands (M21) produced good girth growth values, despite the drought in 2022.
In the case of the evapotranspiration and transpiration values, there was not enough water available for the forest stands most observed. The evapotranspiration values were significantly less (average 12%) compared to the previous years (the ET was 20% less at the M19 black locust stand). The lower values could be explained by the dry weather conditions and the lack of water in 2022. The forest stands responded to the lack of water through early leaf loss and by slowing down their girth growth at the five sites monitored.
According to the National Land Centre database, 48% of the damage was in the form of drought damage at the Hungarian forest stands in 2022 (nfk.gov.hu accessed on 13 March 2024) [41]. Based on the reports of the forestry companies, there was 78% damage in the form of abiotic damage in 2022 (Hirka 2024) [68]. Based on the health report of the Forest Research Institute, the damage from the drought in the black locust sample area (M19) has been continuous since 2017. This is in line with the conclusions of Jia et al. (2022) [69]. The effect of the drought was already detectable at a different rate in the other monitored plots; thus, the harmful effect of the dry periods had already appeared earlier at our forest stands. The three sample areas of the Scots pine (M15), sessile oak (M16), and turkey oak (M21) were barely affected by drought damage according to the forest health report in the previous five years.
The forest stands observed tolerated the negative effects of the drought well. Compared to the National Land Centre database, our survey detected much less drought damage. This could be explained by the difference in the age, the health status, and tree stand structure (Sousa-Silva et al., 2018, Zhang et al., 2016) [70,71], and the geographical location of our monitoring sites could have had an effect as well.
However, the classified Z NDVI values of the Sentinel−2 satellite imagery for the period 2017–2023 showed severe drought in 2022, which was followed by an improvement in 2023. While in 2022, the severe damage class contained 67% of the pixels, in 2023, 48% of the pixels were already in the moderate class due to more precipitation; thus, strong regeneration has started but has not yet been completed. It is important to note that a subsequent drought could have severe consequences on a longer timescale (Berdanier and Clark, 2015) [72]; thus, the monitoring should be continued in future years in order to study the effects of changes from droughts and wetter periods.
It is important to note that the Terra satellite carrying the MODIS sensor has been in descending orbit since 2020, when the constellation exit took place and is now nearing the end of its operation (USGS, 2022a accessed on 4 April 2024) [73]. Therefore, Terra should be replaced with other satellites with similar parameters like Sentinel-3, which is suitable for forest monitoring. For instance, the American ForWarn III (USGS, 2022b accessed on 4 April 2024) [74] and the Hungarian TEMRE (2024) [47] systems have already been utilizing this new data source since 2016.
5. Conclusions
The climate forecasts are not very encouraging for Hungary’s future forest stands. Half of the forest-steppe climate category up to now (more than 10% of the country’s territory) may be even hotter and drier (steppe climate) than today. Changes in climatic and weather conditions may double the number of dry and extremely dry periods by 2021–2050, which can increase the risk of the mortality of sensitive tree species (Gálos and Führer 2018). That is why it is important to plant drought-resistant and drought-tolerant tree species suitable for the growing area. The destruction of the common ash (Fraxinus excelsior) on the Bakony mountain has been significant in the last two years according to the health report of the Forest Research Institute. The common ash is the first tree species that may be a regional victim of climate change. The temperature increases and precipitation stagnation or decreases (126–204 mm water deficit in 2022) must be taken into account when creating afforestation plans. Monocultures are always exposed to pests and climate change. Creating mixed forest stands that are more resistant to climatic extremes is important as is the use of drought-tolerant species in afforestation, e.g., the turkey oak (Quercus cerris).
It is important to connect and validate the evaluation of remotely sensed data with local measurements (meteorological measurements, biomass measurements) and determine the required amount of water for our forest stands. In the future, the Forest Protection Measuring and Monitoring System will be even more important in assessing and mitigating the effects of climate change. It is necessary to expand the network to increase representation by including other species, e.g., pedunculated oak (Quercus robur).
Author Contributions
Conceptualization: B.B., Z.G. and J.S.; Methodology: B.B., Z.G., T.M. and M.M.; Software: P.K. and T.M.; Writing: B.B., Z.G., T.M., J.S. and A.S.; Visualization: B.B., T.M. and P.K.; Supervision: B.B., J.S. and B.H.; Project Administration: B.B.; Funding Acquisition: B.B. All authors have read and agreed to the published version of the manuscript.
Funding
This article was made in the frame of the project TKP2021-NKTA-43 which has been implemented with the support provided by the Ministry of Innovation and Technology of Hungary (successor: Ministry of Culture and Innovation of Hungary) from the National Research, Development and Innovation Fund, financed under the TKP2021-NKTA funding scheme. This following joint project also supported the preparation of the paper “Microscale influence on runoff”, supported by the National Research, Development, and Innovation Office (OTKA project grant number SNN143972). This study was also supported by the grants from the Slovak Research and Development Agency (project APVV No. 19-0340) and the VEGA grant agency of the Ministry of Education, Research of the Slovak Republic VEGA No. 1/0782/21.
Data Availability Statement
The data presented in this study are available on request from the corresponding author due to privacy reasons.
Acknowledgments
Thank you for the data from the Forest Protection Measuring and Monitoring System, National Land Centre and Meteorological Service.
Conflicts of Interest
The authors declare no conflicts of interests.
References
- Svoboda, M.; Fuchs, B.A. Handbook of Drought Indicators and Indices; World Meteorological Organization (WMO) and Global Water Partnership (GWP), Integrated Drought Management Programme (IDMP), Integrated Drought Management Tools and Guidelines; Series 2; WMO: Geneva, Switzerland, 2016; pp. 3–44. [Google Scholar]
- World Meteorological Organization (WMO). Guidelines on the Definition and Characterization of Extreme Weather and Climate Events; WMO: Geneva, Switzerland, 2023; pp. 2–16. [Google Scholar]
- Forzieri, G.; Dakos, V.; McDowell, N.G.; Ramdane, A.; Cescatti, A. Emerging signals of declining forest resilience under climate change. Nature 2022, 608, 534–539. [Google Scholar] [CrossRef] [PubMed]
- Tripathy, K.P.; Mishra, A.K. How Unusual Is the 2022 European Compound Drought and Heatwave Event? Geophys. Res. Lett. 2023, 50, e2023GL105453. [Google Scholar] [CrossRef]
- Cook, B.I.; Smerdon, J.E.; Cook, E.R.; Williams, A.P.; Anchukaitis, K.J.; Mankin, J.S.; Allen, K.; Andreu-Hayles, L.; Ault, T.R.; Belmecheri, S. Megadroughts in the Common Era and the Anthropocene. Nat. Rev. Earth Environ. 2022, 3, 741–757. [Google Scholar] [CrossRef]
- Aalbers, E.E.; van Meijgaard, E.; Lenderink, G.; de Vries, H.; van den Hurk, B.J.J.M. The 2018 west-central European drought projected in a warmer climate: How much drier can it get? Nat. Hazards Earth Syst. Sci. 2023, 23, 1921–1946. [Google Scholar] [CrossRef]
- Moravec, V.; Markonis, Y.; Rakovec, O.; Svoboda, M.; Trnka, M.; Kumar, R.; Hanel, M. Europe under multi-year droughts: How severe was the 2014–2018 drought period? Environ. Res. Lett. 2021, 16, 34062. [Google Scholar] [CrossRef]
- van der Woude, A.M.; Peters, W.; Joetzjer, E.; Lafont, S.; Koren, G.; Ciais, P.; Ramonet, M.; Xu, Y.; Bastos, A.; Botía, S. Temperature extremes of 2022 reduced carbon uptake by forests in Europe. Nat. Commun. 2023, 14, 6218. [Google Scholar] [CrossRef] [PubMed]
- Rakovec, O.; Samaniego, L.; Hari, V.; Markonis, Y.; Moravec, V.; Thober, S.; Hanel, M.; Kumar, R. The 2018–2020 Multi-Year Drought Sets a New Benchmark in Europe. Earth’s Future 2022, 10, e2021EF002394. [Google Scholar] [CrossRef]
- Stefanidis, S.; Rossiou, D.; Proutsos, N. Drought Severity and Trends in a Mediterranean Oak Forest. Hydrology 2023, 10, 167. [Google Scholar] [CrossRef]
- Wei, W.; Liu, T.; Zhou, L.; Wang, J.; Yan, P.; Xie, B.; Zhou, J. Drought-Related Spatiotemporal Cumulative and Time-Lag Effects on Terrestrial Vegetation across China. Remote Sens. 2023, 15, 4362. [Google Scholar] [CrossRef]
- Keszeliová, A.; Hlavčová, K.; Danáčová, M.; Danáčová, Z.; Szolgay, J. Detection of Changes in the Hydrological Balance in Seven River Basins Along the Western Carpathians in Slovakia. Slovak J. Civ. Eng. 2021, 29, 49–60. [Google Scholar] [CrossRef]
- Kholiavchuk, D.; Gurgiser, W.; Mayr, S. Carpathian Forests: Past and Recent Developments. Forests 2024, 15, 65. [Google Scholar] [CrossRef]
- Gáspár, V.; Škrinár, A. The Impact of Climate Change and Regulation of the Water Regime on the Morphological Structure of the Floodplain Forests in Petržalka, Slovakia. Slovak J. Civ. Eng. 2023, 31, 52–57. [Google Scholar] [CrossRef]
- Vacek, Z.; Vacek, S.; Cukor, J. European forests under global climate change: Review of tree growth processes, crises and management strategies. J. Environ. Manag. 2023, 332, 117353. [Google Scholar] [CrossRef] [PubMed]
- Seidl, R.; Thom, D.; Kautz, M.; Martin-Benito, D.; Peltoniemi, M.; Vacchiano, G.; Wild, J.; Ascoli, D.; Petr, M.; Honkaniemi, J. Forest disturbances under climate change. Nat. Clim. Chang. 2017, 7, 395–402. [Google Scholar] [CrossRef] [PubMed]
- Knutzen, F.; Averbeck, P.; Barrasso, C.; Bouwer, L.M.; Gardiner, B.; Grünzweig, J.M.; Hänel, S.; Haustein, K.; Johannessen, M.R.; Kollet, S. Impacts and damages of the European multi-year drought and heat event 2018–2022 on forests, a review. Egusphere 2023, 2023, 1–56. [Google Scholar] [CrossRef]
- Salomón, R.L.; Peters, R.L.; Zweifel, R.; Sass-Klaassen, U.G.W.; Stegehuis, A.I.; Smiljanic, M.; Poyatos, R.; Babst, F.; Cienciala, E.; Fonti, P. The 2018 European heatwave led to stem dehydration but not to consistent growth reductions in forests. Nat. Commun. 2022, 13, 28. [Google Scholar] [CrossRef]
- Thom, D.; Buras, A.; Heym, M.; Klemmt, H.-J.; Wauer, A. Varying growth response of Central European tree species to the extraordinary drought period of 2018–2020. Agric. For. Meteorol. 2023, 338, 109506. [Google Scholar] [CrossRef]
- Senf, C.; Buras, A.; Zang, C.S.; Rammig, A.; Seidl, R. Excess forest mortality is consistently linked to drought across Europe. Nat. Commun. 2020, 11, 6200. [Google Scholar] [CrossRef]
- Pretzsch, H.; Schütze, G.; Biber, P. Drought can favour the growth of small in relation to tall trees in mature stands of Norway spruce and European beech. For. Ecosyst. 2018, 5, 20. [Google Scholar] [CrossRef]
- Aldea, J.; Ruiz-Peinado, R.; Del Río, M.; Pretzsch, H.; Heym, M.; Brazaitis, G.; Jansons, A.; Metslaid, M.; Barbeito, I.; Bielak, K. Timing and duration of drought modulate tree growth response in pure and mixed stands of Scots pine and Norway spruce. J. Ecol. 2022, 110, 2673–2683. [Google Scholar] [CrossRef]
- Li, T.; Guo, L.; He, B.; Liu, L.; Yuan, W.; Chen, X.; Hao, X.; Liu, X.; Zheng, H.; Zheng, H. The Forest Resistance to Droughts Differentiated by Tree Height in Central Europe. JGR Biogeosciences 2023, 128, e2021JG006668. [Google Scholar] [CrossRef]
- Beloiu, M.; Stahlmann, R.; Beierkuhnlein, C. Drought impacts in forest canopy and deciduous tree saplings in Central European forests. For. Ecol. Manag. 2022, 509, 120075. [Google Scholar] [CrossRef]
- Bose, A.K.; Scherrer, D.; Camarero, J.J.; Ziche, D.; Babst, F.; Bigler, C.; Bolte, A.; Dorado-Liñán, I.; Etzold, S.; Fonti, P. Climate sensitivity and drought seasonality determine post-drought growth recovery of Quercus petraea and Quercus robur in Europe. Sci. Total Environ. 2021, 784, 147222. [Google Scholar] [CrossRef]
- Keszeliová, A.; Výleta, R.; Danáčová, M.; Hlavčová, K.; Sleziak, P.; Gribovszki, Z.; Szolgay, J. Detection of Changes in Evapotranspiration on a Catchment Scale Under Changing Climate Conditions in Selected River Basins of Slovakia. Slovak J. Civ. Eng. 2022, 30, 55–63. [Google Scholar] [CrossRef]
- Rybar, J.; Sitková, Z.; Marcis, P.; Pavlenda, P.; Pajtík, J. Declining Radial Growth in Major Western Carpathian Tree Species: Insights from Three Decades of Temperate Forest Monitoring. Plants 2023, 12, 4081. [Google Scholar] [CrossRef] [PubMed]
- Bussotti, F.; Papitto, G.; Di Martino, D.; Cocciufa, C.; Cindolo, C.; Cenni, E.; Bettini, D.; Iacopetti, G.; Pollastrini, M. Defoliation, Recovery and Increasing Mortality in Italian Forests: Levels, Patterns and Possible Consequences for Forest Multifunctionality. Forests 2021, 12, 1476. [Google Scholar] [CrossRef]
- Gazol, A.; Camarero, J.J. Compound climate events increase tree drought mortality across European forests. Sci. Total Environ. 2022, 816, 151604. [Google Scholar] [CrossRef]
- Gordon, D.A.R.; Coenders-Gerrits, M.; Sellers, B.A.; Sadeghi, S.M.M.; van Stan, J.T., II. Rainfall interception and redistribution by a common North American understory and pasture forb, Eupatorium capillifolium (Lam. dogfennel). Hydrol. Earth Syst. Sci. Discuss. 2019, 2019, 1–22. [Google Scholar] [CrossRef]
- Schuldt, B.; Buras, A.; Arend, M.; Vitasse, Y.; Beierkuhnlein, C.; Damm, A.; Gharun, M.; Grams, T.E.; Hauck, M.; Hajek, P. A first assessment of the impact of the extreme 2018 summer drought on Central European forests. Basic Appl. Ecol. 2020, 45, 86–103. [Google Scholar] [CrossRef]
- Thonfeld, F.; Gessner, U.; Holzwarth, S.; Kriese, J.; Da Ponte, E.; Huth, J.; Kuenzer, C. A First Assessment of Canopy Cover Loss in Germany’s Forests after the 2018–2020 Drought Years. Remote Sens. 2022, 14, 562. [Google Scholar] [CrossRef]
- Ognjenović, M.; Seletković, I.; Potočić, N.; Marušić, M.; Tadić, M.P.; Jonard, M.; Rautio, P.; Timmermann, V.; Lovreškov, L.; Ugarković, D. Defoliation Change of European Beech (Fagus sylvatica L.) Depends on Previous Year Drought. Plants 2022, 11, 730. [Google Scholar] [CrossRef] [PubMed]
- Češljar, G.; Jovanović, F.; Brašanac-Bosanac, L.; Đorđević, I.; Mitrović, S.; Eremija, S.; Ćirković-Mitrović, T.; Lučić, A. Impact of an Extremely Dry Period on Tree Defoliation and Tree Mortality in Serbia. Plants 2022, 11, 1286. [Google Scholar] [CrossRef] [PubMed]
- Hereş, A.-M.; Petritan, I.C.; Bigler, C.; Curtu, A.L.; Petrea, Ş.; Petritan, A.M.; Polanco-Martínez, J.M.; Rigling, A.; Curiel Yuste, J. Legacies of past forest management determine current responses to severe drought events of conifer species in the Romanian Carpathians. Sci. Total Environ. 2021, 751, 141851. [Google Scholar] [CrossRef] [PubMed]
- Szentes, O. Szárazság Magyarországon 2022-ben és a múltban (Drought in Hungary in 2022 and the past). Légkör 2023, 68, 9–19. [Google Scholar] [CrossRef]
- Horváth, Á.; Breuer, H. A víz körforgalma a légkörben és a 2022-es rendkívüli aszáy meteorológiai háttere (Water circulation in the atmosphere and drought in 2022). Légkör 2023, 68, 2–8. [Google Scholar] [CrossRef]
- Alekseev, A.; Chernikhovskii, D. Assessment of the health status of tree stands based on Sentinel-2B remote sensing materials and the short-wave vegetation index SWVI. IOP Conf. Ser. Earth Environ. Sci. 2021, 876, 012003. [Google Scholar] [CrossRef]
- Varga, Z. Geographical patterns of biodiversity in the Palearctic and in the Carpathian Basin. Acta Zool. Acad. Sci. Hung. 1995, 41, 71–92. [Google Scholar]
- Fekete, G.; Molnár, Z.; Magyari, E.; Somodi, I.; Varga, Z. A new framework for understanding Pannonian vegetation patterns: Regularities, deviations and uniqueness. Community Ecol. 2014, 15, 12–26. [Google Scholar] [CrossRef]
- The database of the National Land Centre. Available online: https://Nfk.gov.hu (accessed on 13 March 2024).
- Available online: https://www.nfk.gov.hu/EMMRE_kiadvanyok__jelentesek__prognozis_fuzetek_news_536 (accessed on 20 February 2024).
- Walter, H.; Lieth, H. Klimadiagramm-Weltatlas; Fisher: Jena, Germany, 1960. [Google Scholar]
- Guijarro, J.A.; Climate Tools (Series Homogenization and Derived Products). R Package Version 4.0.0. 2023. Available online: https://CRAN.R-project.org/package=climatol (accessed on 13 March 2024).
- Führer, E. A klímaértékelés erdészeti vonatkozásai. Erdészettudományi Közlemények 2018, 8, 27–42. [Google Scholar] [CrossRef]
- Mu, Q.; Maosheng, Z.; Running, S.W. MODIS Global Terrestrial Evapotranspiration (ET) Product (NASA MOD16A2/A3). In Algorithm Theoretical Basis Document (Collection 5); University of Montana: Missoula, MT, USA, 2013. [Google Scholar]
- Somogyi, Z.; Koltay, A.; Molnár, T.; Móricz, N. Forest health monitoring system in Hungary based on MODIS products. In Az elmélet és a Gyakorlat Találkozása a Térinformatikában IX: Theory Meets Practice in GIS; Debreceni Egyetem, I.X., Ed.; Térinformatika Konferencia és Szakkiállítás. Szerk. Molnár Vanda Éva: Debrecen, Hungary, 2018; ISBN 978-963-318-723-4. [Google Scholar]
- Rouse, J.W.; Haas, R.H.; Schell, J.A.; Deering, D.W. Monitoring Vegetation Systems in the Great Plains with ERTS. In Proceedings of the Third ERTS-1 Symposium, Washington, DC, USA, 10–14 December 1973; NASA: Washington, DC, USA, 1974; Volume 351, pp. 309–317. [Google Scholar]
- Peters, A.J.; Walter-Shea, E.A.; Andrés Viña, L.J.; Hayes, M.; Svoboda, M.D. Drought monitoring with NDVI-based standardized vegetation index. Photogramm. Eng. Remote Sens. 2002, 68, 72–75. [Google Scholar]
- European Space Agency (ESA). Sentinel-2 Overview. Available online: https://sentinel.esa.int/web/sentinel/missions/sentinel-2 (accessed on 4 April 2024).
- Gorelick, N.; Hancher, M.; Dixon, M.; Ilyushchenko, S.; Thau, D.; Moore, R. Google Earth Engine: Planetary-scale geospatial analysis for everyone. Remote Sens. Environ. 2017, 202, 18–27. [Google Scholar] [CrossRef]
- Gao, B. NDWI—A normalized difference water index for remote sensing of vegetation liquid water from space. Remote Sens. Environ. 1996, 58, 257–266. [Google Scholar] [CrossRef]
- Járó, Z. Intercepció a gödöllöi kultúrerdei ökoszisztémában. Erdészeti Kut. 1980, 73, 7–17. [Google Scholar]
- Führer, E. A Csapadék Megoszlása és az Intercepció Különböző Hazai Erdõtársulásokban. Doctoral Dissertation, Doktori értekezés, Sopron, Hungary, 1984. [Google Scholar]
- Führer, E. Intercepció meghatározása bükk, kocsánytalan tölgy és lucfenyő erdőben. Vízügyi Közlemények 1992, 3, 281–294. [Google Scholar]
- Führer, E. Csapadékmérések bükkös-, kocsánytalantölgyes és lucfenyves ökoszisztémában. Erdészeti Kut. 1994, 84, 11–35. [Google Scholar]
- Koloszár, J. Természetes erdei ökoszisztémák és a csapadék. In Erdő és víz. VEAB Kiadvány; EFE: Sopron, Hungary, 1981; pp. 75–88. [Google Scholar]
- Kucsara, M. Az erdő csapadékviszonyainak vizsgálata. Vízügyi Közlemények 1998, 3, 456–475. [Google Scholar]
- Szabó, M. Egy Cseres-Tölgyes Erdő (“Sikfőkut Project”) víz- és ásványi Anyag Forgalma. Doctoral Dissertation, Kandidátusi értekezés, Budapest, Hungary, 1979. [Google Scholar]
- Csáki, P. A Klímaváltozás Hatása a Vízkészletekre a Felszínborítás Figyelembevételével. Doctoral Dissertation, SOE, Sopron, Hungary, 2020; p. 122. [Google Scholar]
- Carnicer, J.; Coll, M.; Ninyerola, M.; Pons, X.; Sánchez, G.; Peñuelas, J. Widespread Crown Condition Decline, Food Web Disruption, and Amplified Tree Mortality with Increased Climate Change-Type Drought. Proc. Natl. Acad. Sci. USA 2011, 108, 1474–1478. [Google Scholar] [CrossRef] [PubMed]
- Allen, C.D. Climate-Induced Forest Dieback: An Escalating Global Phenomenon? Unasylva 2009, 60, 43–49. [Google Scholar]
- Allen, C.D.; Macalady, A.K.; Chenchouni, H.; Bachelet, D.; McDowell, N.; Vennetier, M.; Kitzberger, T.; Rigling, A.; Breshears, D.D.; Hogg (Ted), E.H. A Global Overview of Drought and Heat-Induced Tree Mortality Reveals Emerging Climate Change Risks for Forests. For. Ecol. Manag. 2010, 259, 660–684. [Google Scholar] [CrossRef]
- Hartmann, H.; Bastos, A.; Das, A.J.; Esquivel-Muelbert, A.; Hammond, W.M.; Martínez-Vilalta, J.; McDowell, N.G.; Powers, J.S.; Pugh, T.A.M.; Ruthrof, K.X. Climate Change Risks to Global Forest Health: Emergence of Unexpected Events of Elevated Tree Mortality Worldwide. Annu. Rev. Plant Biol. 2022, 73, 673–702. [Google Scholar] [CrossRef]
- Fensham, R.J.; Laffineur, B.; Allen, C.D. To What Extent Is Drought-Induced Tree Mortality a Natural Phenomenon? Glob. Ecol. Biogeogr. 2019, 28, 365–373. [Google Scholar] [CrossRef]
- Szabó, A.; Gribovszki, Z.; Kalicz, P.; Szolgay, J.; Bolla, B. The soil moisture regime and groundwater recharge in aged forests in the Sand Ridge region of Hungary after a decline in the groundwater level: An experimental case study. J. Hydrol. Hydromech. 2022, 70, 308–320. [Google Scholar] [CrossRef]
- Nagy, K.; Szalóki, A. Forest Condition in Europe: The 2023 Assessment. In ICP Forests Technical Report under the UNECE Convention on Long-range Transboundary Air Pollution (Air Convention); Michel, A., Kirchner, T., Prescher, A.-K., Schwärzel, K., Eds.; Thünen Institute: Eberswalde, Hungary, 2023. [Google Scholar] [CrossRef]
- Hirka, A.; Koltay, A.; Csóka, G. Magyarországi erdőkárok 2022-ben. Erdészeti Lapok 2024, 159, 3. [Google Scholar]
- Jia, H.; Guan, C.; Zhang, J.; He, C.; Yin, C.; Meng, P. Drought Effects on Tree Growth, Water Use Efficiency, Vulnerability and Canopy Health of Quercus Variabilis-Robinia Pseudoacacia Mixed Plantation. Front. Plant Sci. 2022, 13, 1018405. [Google Scholar] [CrossRef] [PubMed]
- Sousa-Silva, R.; Verheyen, K.; Ponette, Q.; Bay, E.; Sioen, G.; Titeux, H.; Van de Peer, T.; Van Meerbeek, K.; Muys, B. Tree Diversity Mitigates Defoliation after a Drought-Induced Tipping Point. Glob. Change Biol. 2018, 24, 4304–4315. [Google Scholar] [CrossRef] [PubMed]
- Zhang, Q.; Shao, M.; Jia, X.; Wei, X. Relationship of Climatic and Forest Factors to Drought- and Heat-Induced Tree Mortality. PLoS ONE 2017, 12, e0169770. [Google Scholar] [CrossRef]
- Berdanier, A.B.; Clarck, J.S. Multiyear Drought-induced Morbidity Preceding Tree Death in Southeastern U.S. Forests—Berdanier—2016—Ecological Applications—Wiley Online Library. Ecol. Appl. 2016, 26, 17–23. [Google Scholar] [CrossRef]
- USGS. Terra Constellation Exit & Data Outage. 2022. Available online: https://lpdaac.usgs.gov/news/terra-constellation-exit-data-outage-october-10-19-2022 (accessed on 29 April 2024).
- USGS. ForWarn III in ArcGIS Online. 2022. Available online: https://forwarn.forestthreats.org/news/1109 (accessed on 29 April 2024).


Disclaimer/Publisher’s Note: The statements, opinions and data contained in all publications are solely those of the individual author(s) and contributor(s) and not of MDPI and/or the editor(s). MDPI and/or the editor(s) disclaim responsibility for any injury to people or property resulting from any ideas, methods, instructions or products referred to in the content. |
© 2024 by the authors. Licensee MDPI, Basel, Switzerland. This article is an open access article distributed under the terms and conditions of the Creative Commons Attribution (CC BY) license (https://creativecommons.org/licenses/by/4.0/).