Article

Vertical Distribution of Mites (Acari) in a “Miniature Forest” of Sphagnum Mosses in a Forest Bog in Western Norway

by
Anna Seniczak
1,*,
Juan Carlos Iturrondobeitia
2 and
Stanisław Seniczak
3
1
Faculty of Applied Ecology, Agricultural Sciences and Biotechnology, Inland Norway University of Applied Sciences, 2318 Elverum, Norway
2
Department of Zoology and Cellular Animal Biology, University of the Basque Country, 48940 Leioa, Spain
3
Department of Evolutionary Biology, Faculty of Biological Sciences, Kazimierz Wielki University, Bydgoszcz, 85-093 Bydgoszcz, Poland
*
Author to whom correspondence should be addressed.
Forests 2024, 15(6), 957; https://doi.org/10.3390/f15060957
Submission received: 5 March 2024 / Revised: 10 May 2024 / Accepted: 28 May 2024 / Published: 30 May 2024
(This article belongs to the Section Forest Biodiversity)

Abstract

:
The Sphagnum habitat is a ”miniature forest” to the mites, of which the layers offer different microenvironmental conditions. We studied the vertical distribution of the Oribatida, Mesostigmata, and Prostigmata groups in four layers (0–5 cm, 5–10 cm, 10–15 cm, and 15–20 cm) of a forest bog on Neshalvøya, Norway, to improve the knowledge of the ecology of these mites. The sampled bog was grazed by farm animals; thus, another aim was to investigate the vertical distribution of the oribatid species, which are intermediate hosts of tapeworms. The selected study site is known for its valuable yet increasingly endangered nature, so our aim was also to contribute to the knowledge on its diversity. We collected Sphagnum samples in four replicates and extracted them in the laboratory in modified Berlese funnels. In total, 16.880 mites were studied, including 16.384 Oribatida, 466 Mesostigmata, and 30 Prostigmata. The total abundance of mites, the Oribatida and Mesostigmata groups, was the highest in the upper layer of Sphagnum and decreased with depth, while the abundance of the Prostigmata did not follow any pattern. Among the Oribatida, at deeper layers, significant declines in abundance were observed in adults, but not in juveniles. Most oribatid species, e.g., Nothrus pratensis, preferred the upper layer of Sphagnum, whereas some preferred deeper layers. For example, Suctobelbella acutidens and Carabodes femoralis preferred the 5–10 cm layer, Quadroppia maritalis the 10–15 cm layer, and Ceratozetes gracilis and Eulohmannia ribagai preferred the deepest layer of Sphagnum. Adults and juveniles of the same species showed a preference for the same layer. In total, 62 species of the Oribatida were recorded, including 11 species that are known to be intermediate hosts of tapeworms. Most of them occurred in the upper layer of Sphagnum. Over 20% of the species were found exclusively in deeper layers, so sampling these layers is important for a better evaluation of the mites’ diversity. Studying the vertical distribution of the mites in bogs helps us to understand their ecology, including their role as intermediate hosts of tapeworms, as well as their diversity.

Graphical Abstract

1. Introduction

Mites (Acari), especially the suborder Oribatida, constitute the most abundant and diverse group of arthropods in peatlands, including bogs [1]. Their densities may reach up to 300,000 ind. m−2 [2], and a total of 410 oribatid species are known in the Holarctic peatlands [3]. On the regional scale, the highest diversity of the Oribatida, 126 species, has been reported from peatlands in the Swiss Jura [4], while the highest overall diversity of mites has been found in Western Norway (154 species, including 96 Oribatida, 33 Mesostigmata, and 24 Trombidiformes) [5,6]. These examples show that the mites constitute a crucial component of peatlands [2].
The vertical distribution of the mites in the soil is relatively well known in forests [7,8,9,10,11], grasslands [12,13,14,15], and agricultural fields [16,17], but little attention has been paid to peatlands in this respect. As shown in forests, changes in the abundance of soil fauna can strongly contribute to the altered vertical distribution of the soil organic carbon and its long-term storage [11]. Sphagnum-dominated peatlands are exceptional for many reasons, also because they consist of growing Sphagnum mosses and their dead decomposing parts, which form peat. The slow decay of Sphagnum is of key importance to peatlands, making waterlogging and carbon sequestration possible [18]. One of the factors affecting decomposition processes in peatlands is the biotic decomposer communities, including the abundant mites [2].
Borcard [1] described the peatland habitat as a “miniature forest”, where the green Sphagnum tops form a “roof ” corresponding to the forest canopy. Sphagnum stalks resemble tree trunks with branches, and the brown decomposing layer is similar to the forest floor. He sampled three layers of bogs in the Swiss Jura (0–3.5 cm, 3.5–7 cm, and 7–13 cm); however, because approximately 90% of the Oribatida inhabited the upper two layers and all species found in the deepest layer occurred in larger numbers closer to the surface, he focused on the two higher strata only. Of the 38 more abundant oribatid species, the majority preferred the upper layer, 7 preferred the deeper layer, and 5 occurred in both layers [1]. The vertical distribution of the adult Oribatida in peatlands was also investigated, based on single samples, in Poland [19] and Norway [20]. The vertical distribution of the Oribatida may vary depending on the season, time of day [21], Sphagnum thickness, and water content [22,23,24].
The aims of this study were (1) to contribute to the knowledge on the vertical distribution of the main mite groups (Oribatida, Mesostigmata, and Prostigmata) in bogs, also including the juvenile forms, which may be important for the results [6,25]; (2) to investigate the vertical distribution of the oribatid species, which are intermediate hosts of tapeworms [26,27] that may pose a risk to farm animals (cattle and sheep) grazing on the studied bog; (3) contribute to the knowledge of the biological diversity of Neshalvøya due to its valuable yet endangered nature [28,29].

2. Material and Methods

2.1. Study Area

The study site is located on Neshalvøya, Kvam municipality, Vestland province, Norway (Figure 1) (60.154° N 5.930° E, 35 m asl). The climate in the area is characterized by high annual precipitation (2300 mm) [30], low mean annual temperature (7.2 °C), mild winters (mean temperature of the coldest month is −2 °C), and cold summers (mean temperature of the warmest month is 12.5 °C) [31]. In the year of study (2008), according to the weather station closest to the study site (Omastranda, located ca. 7 km from Neshalvøya), the mean annual temperature was lower (5.2 °C) and the annual precipitation was higher (3198 mm) when compared to the data from longer periods. The temperature that year varied between −13.9 °C (25 March) and 28.5 °C (29 July). The mean temperature of the coldest month (March) was −1.4 °C, and that of the warmest month (July) was 15.3 °C. At the time of sampling, i.e., 28 May 2008, ca. 13 o’clock, the temperature was 18.7 °C (https://www.yr.no/, accessed 8 February 2024).
The bedrock of the peninsula consists mainly of phyllite, a type of foliated metamorphic rock with large elements of greenstone, as well as amphibolite, and some metasandstone which occurs in the upper region of Neshalvøya. Other types of rock include gneiss, found in the hills, and some olivine [28].
The peninsula has an area of 2.7 km2 and is covered by forests, with some cultivation fields and cultural pastures. The peninsula is dominated by coniferous trees, mostly pine (Pinus sylvetris L.), and this tree dominated at the sampling site (Figure 2). Some spruce [Picea abies (L.) H.Karst] occurs close to the national highway. In addition, there is a great variety of broadleaf trees and bushes, mostly elm (Ulmus glabra Huds.), ash (Fraxinus exelsior L.), lime (Tillia cordata Mill.), oak (Quercus sp.), hazel (Corylus avellana L.), birch (Betula pendula Roth), black alder [Alnus glutinosa (L.) Gaertn.], gray alder [A. incana (L.) Moench], and rowan (Sorbus aucuparia L.). Bogs cover a considerable area of the forest [28] and are grazed by farm animals (cattle and sheep). Neshalvøya drew special attention from scientists, including biologists, because of its valuable cultural landscape and nature, which have been endangered by the plans to build a shipyard [28,29].

2.2. Sampling and Identification

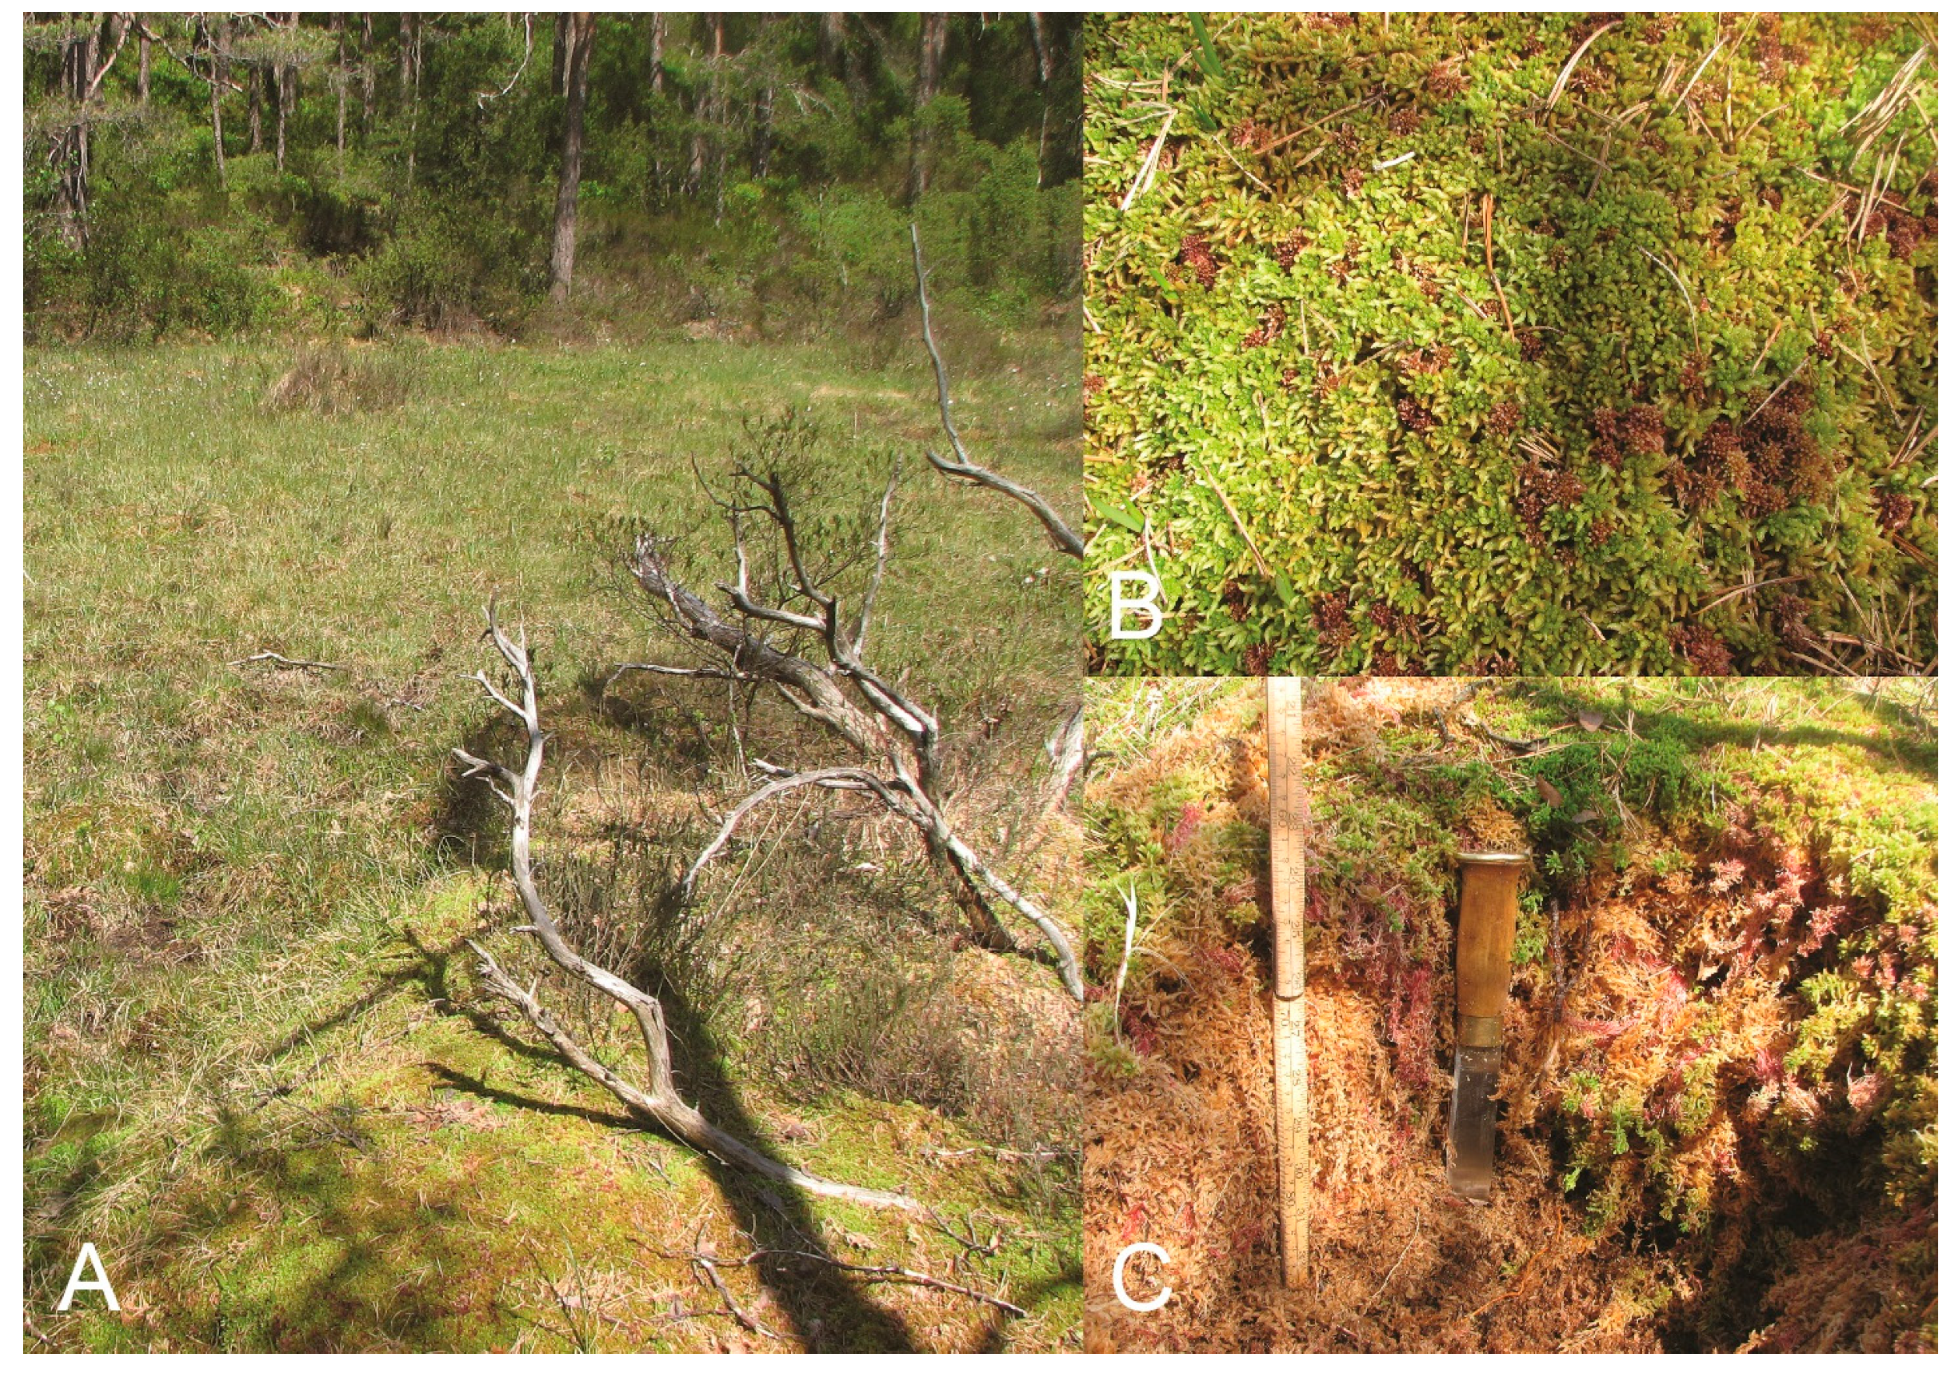
Samples of Sphagnum mosses were collected by Torstein Solhøy and Anna Seniczak on 28 May 2008 from the forest bog on Neshalvøya (Figure 1). Samples were taken at four randomly selected sites, at four depths (0–5 cm, 5–10 cm, 10–15 cm, and 15–20 cm), each measuring an area of 10 cm × 20 cm (Figure 2). The samples were transported in separate plastic bags within four hours to the laboratory of the University of Bergen for extraction.
Mites were extracted using self-made Berlese funnels where height-adjustable lamps were used to allow a gradual increase in the temperature above the samples, from ca. 24 °C to 37 °C. The extraction lasted 14 days. The mite groups (Oribatida, Mesostigmata, and Prostigmata) were counted under a stereomicroscope, including both adults and juveniles. The Oribatida were further determined to species or genus level using the key for adults [32] and other publications to identify the juvenile instars [33,34,35,36,37,38,39,40,41,42,43,44,45,46,47,48,49,50]. Nomenclature follows Subías [51,52] and partly Weigmann [32]. The species list in Table 1 is presented in alphabetical order. Full names of species are given in Table 1, while in figures, abbreviations are used. Measurements of adults are based on Weigmann (2006) [32], or on the examined specimens. The samples are deposited at the University Museum of Bergen, Norway (ZMUB).

2.3. Statistical Analyses

Mite communities were characterized by the abundance (A), while the Oribatida community was additionally characterized by the number of species (S) and the Shannon (Hs) index. We calculated the community body size (CBS) index [53] based on the abundance of the adult Oribatida per sample and body size (mean length in µm) of the species. Statistical differences between the abundance of species in four layers were calculated. First, the equality of variance was tested with the Levene test, and normality of the distribution was tested with the Kolmogorov–Smirnov test. As the assumptions of variance analysis were not met, non-parametric tests were employed. Kruskal–Wallis ANOVA by Ranks was utilized to test for significant differences between the means [54]. The significance level for all analyses was accepted at α = 0.05. These calculations were carried out with STATISTICA 12.5 software.
Multivariate analyses were performed using CANOCO 5.15 software (Microcomputer Power, Ithaca, NY, USA) [55,56]. Dependent variables (quantitative continuous) were abundances of oribatid species (juveniles and adults), the total abundance of Oribatida juveniles and adults, the total abundance of all Oribatida, the abundance of the adult Oribatida divided into two size groups (<500 µm and ≥500 µm), the abundance of the Mesostigmata, the abundance of the Prostigmata, and the total abundance of Acari. These data were log-transformed, log (x + 1) [57], considering the down-weighting of rare species. Independent variables (factors) were the depths of 0–5 cm, 5–10 cm, 10–15 cm, and 15–20 cm, labeled 5, 10, 15, and 20, respectively. First, we checked with univariate analyses if there was a relationship between the number of the juvenile Oribatida, adult Oribatida, all Oribatida, number of the Mesostigmata, number of the Prostigmata, number of the Acari, and depth of samples. Furthermore, multivariate analysis was used to test if the variation in the community of the juvenile Oribatida, adult Oribatida, and all Oribatida was significantly explained by the depth of samples.

3. Results

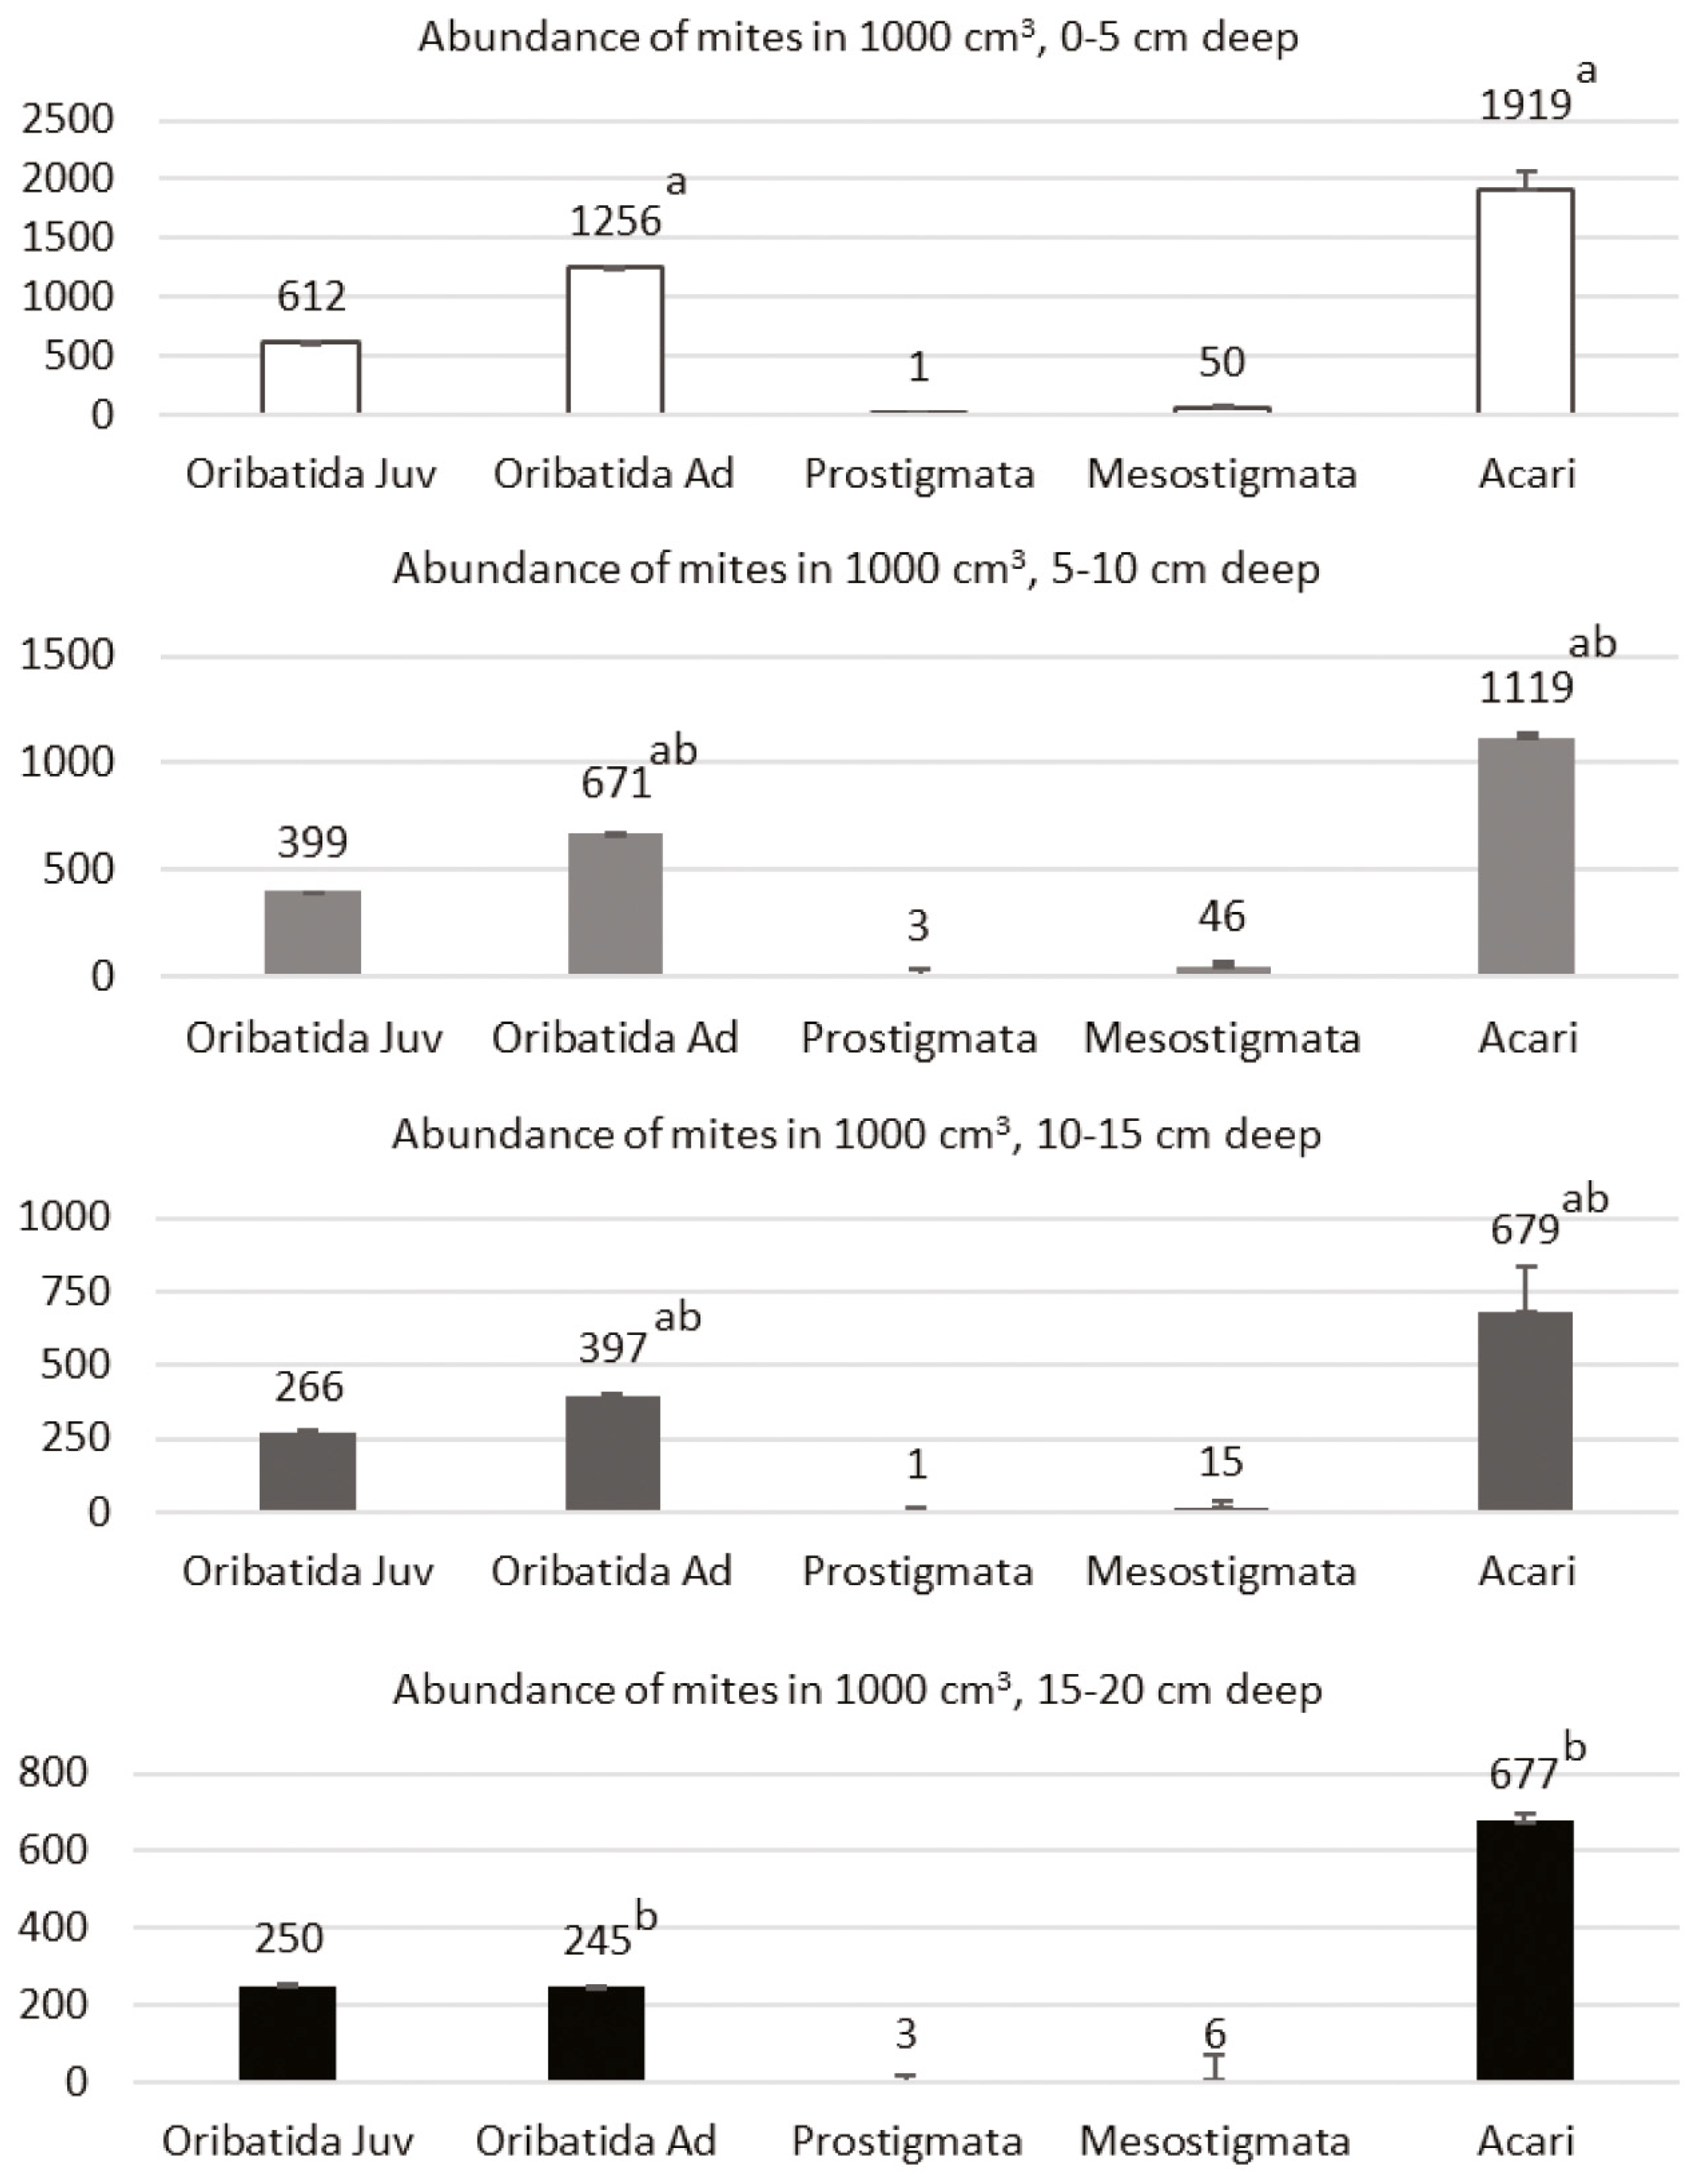
In total, 16.880 mites, including 16.384 Oribatida, 466 Mesostigmata, and 30 Prostigmata, were extracted from the samples. The total abundance of mites, the Oribatida and Mesostigmata, was the highest in the upper layer of Sphagnum (0–5 cm) and decreased with depth (Figure 3). In the deepest layer sampled (15–20 cm), the total abundance of the mites and of the Oribatida made up only ca. one-fourth of the abundances in the upper layer.
Within the Oribatida, the abundance of adults was significantly affected by depth (permutation test: both on the first axis and all axes, pseudo-F = 17.4, p = 0.002, df = 3). The sample depth explained 76.67% of the variability of this group (adjusted explained variation). In contrast, the variability of the abundance of juveniles in relation to depth was not significant (permutation test: both on the first axis and all axes, pseudo-F = 2.7, p = 0.092, df = 3), and explained only 24.88% of the variability of this group. As a result of this, the participation of juveniles in the age structure increased with depth. In the upper layer (0–5 cm), the juvenile Oribatida made up 32% of the age structure, while in the three deeper layers (5–10 cm, 10–15 cm, and 15–20 cm), their participation increased to 37%, 40%, and 50%, respectively (Figure 3).
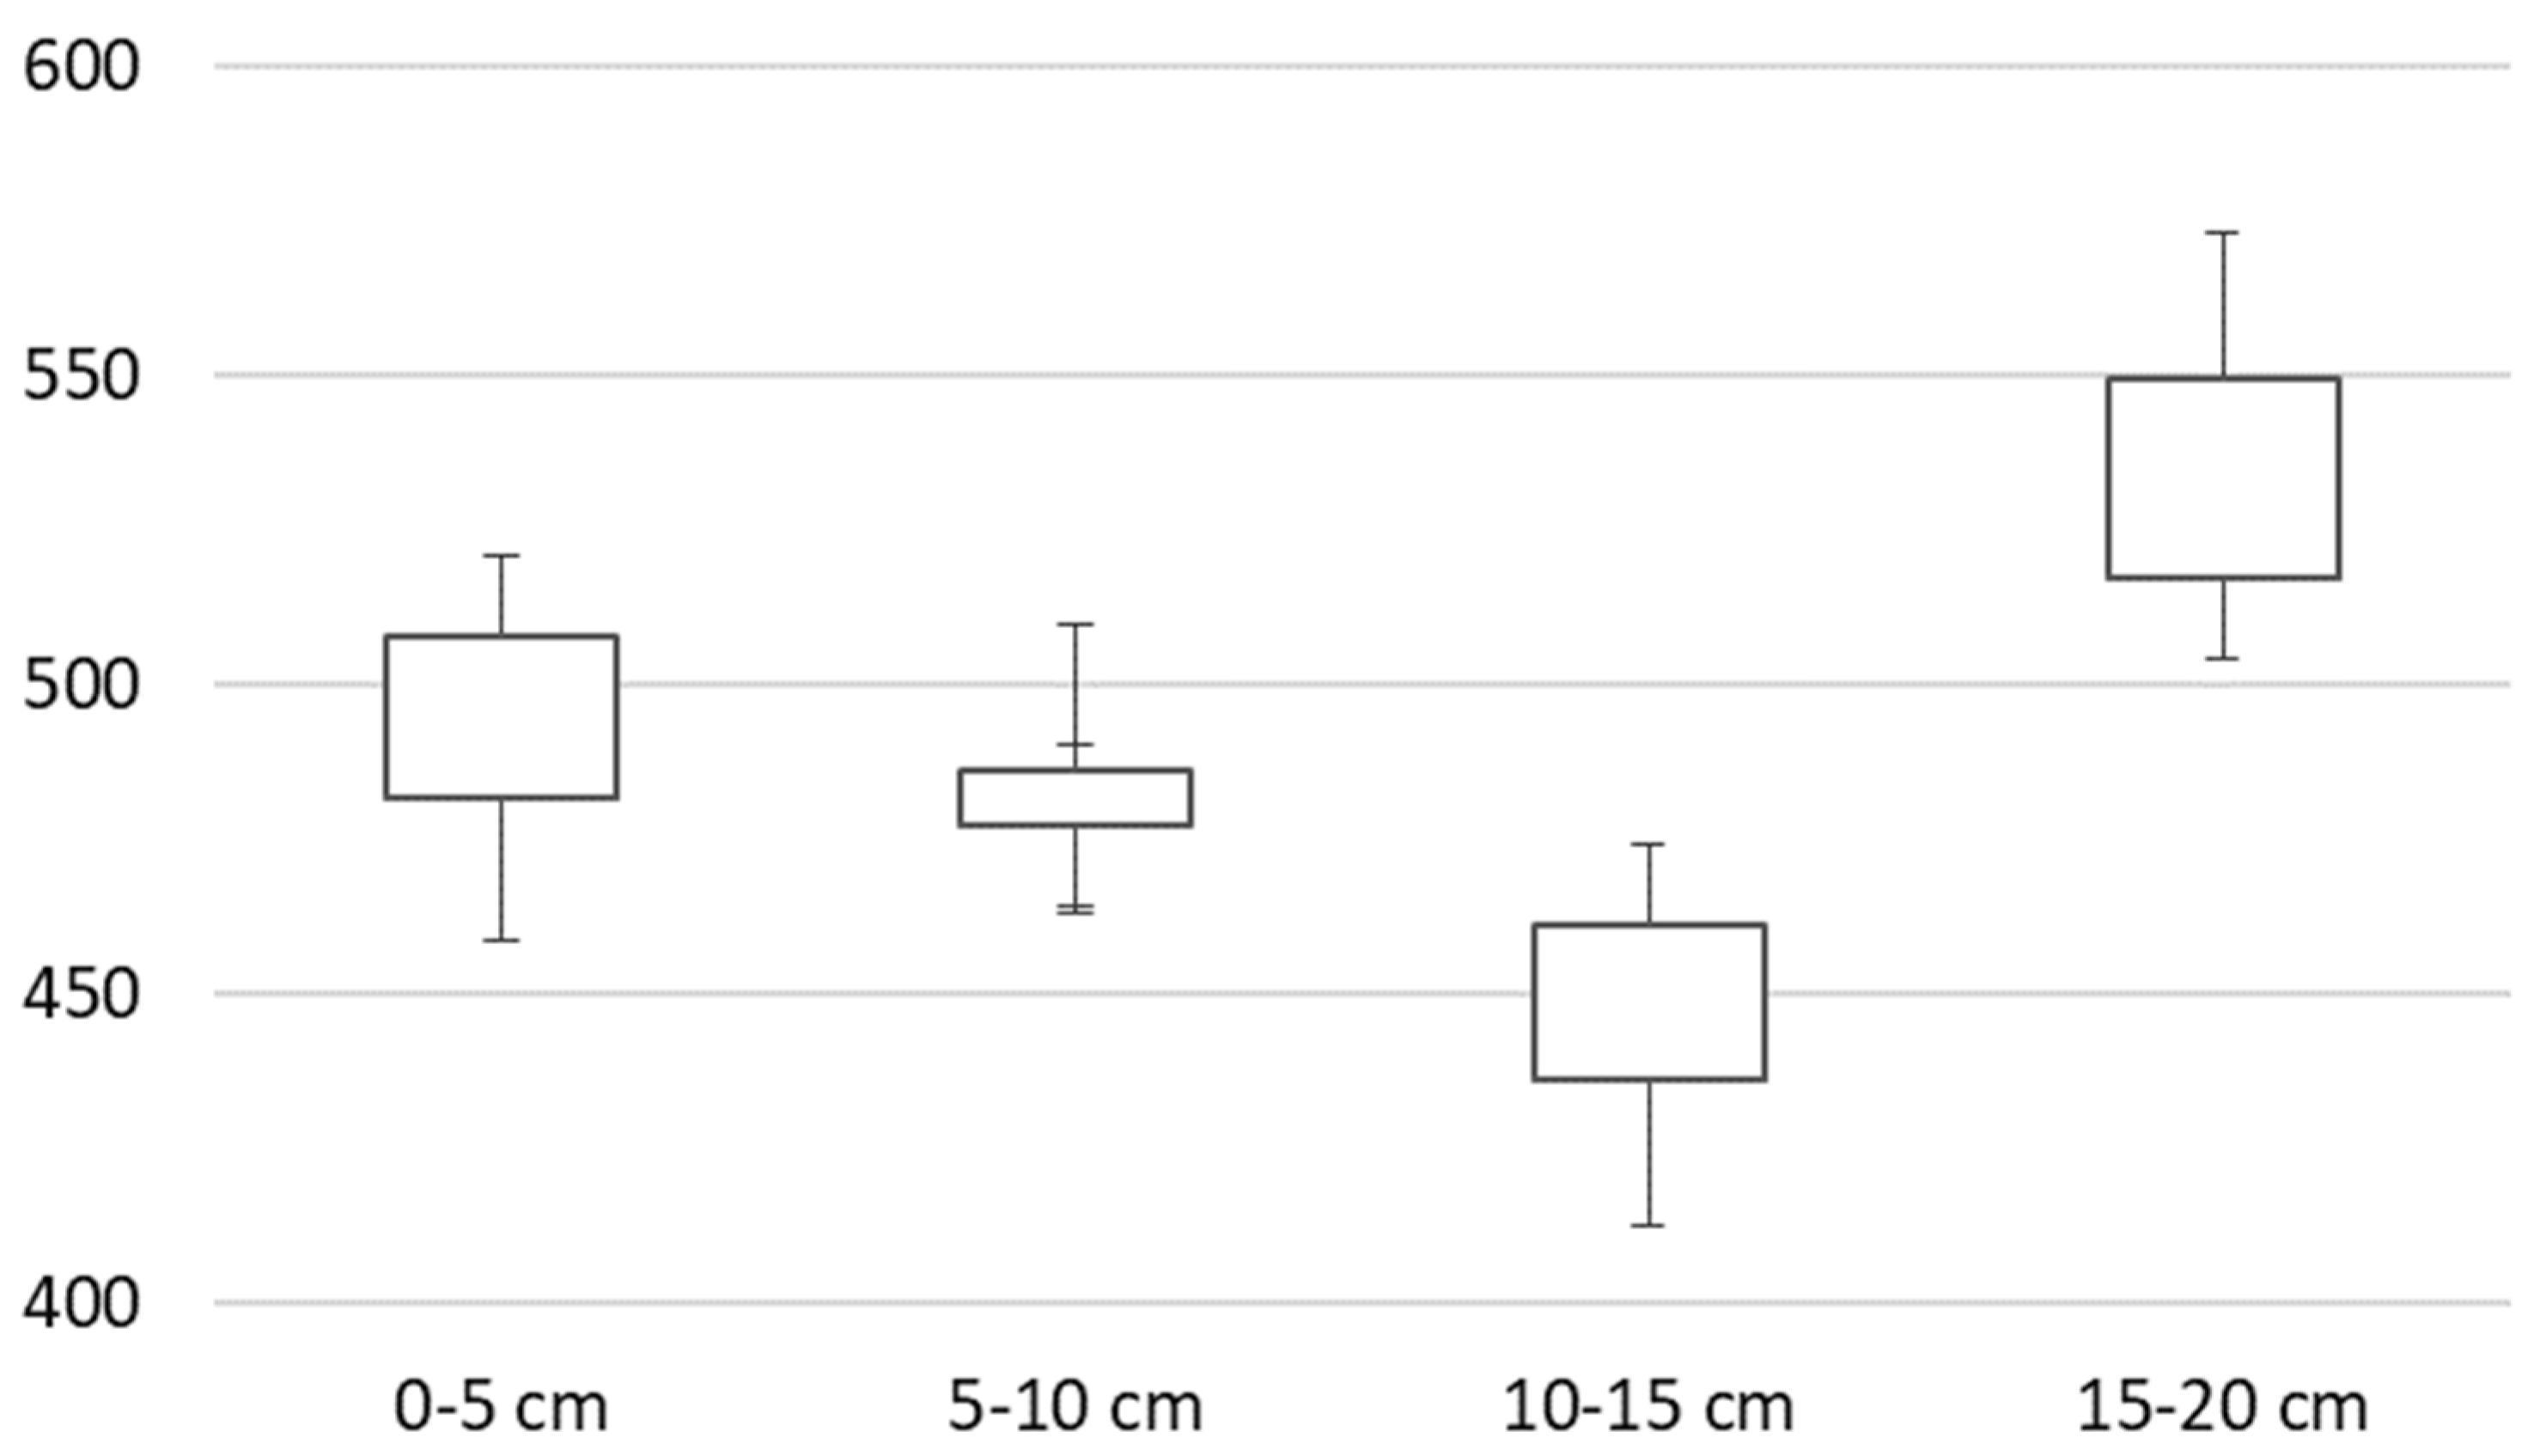
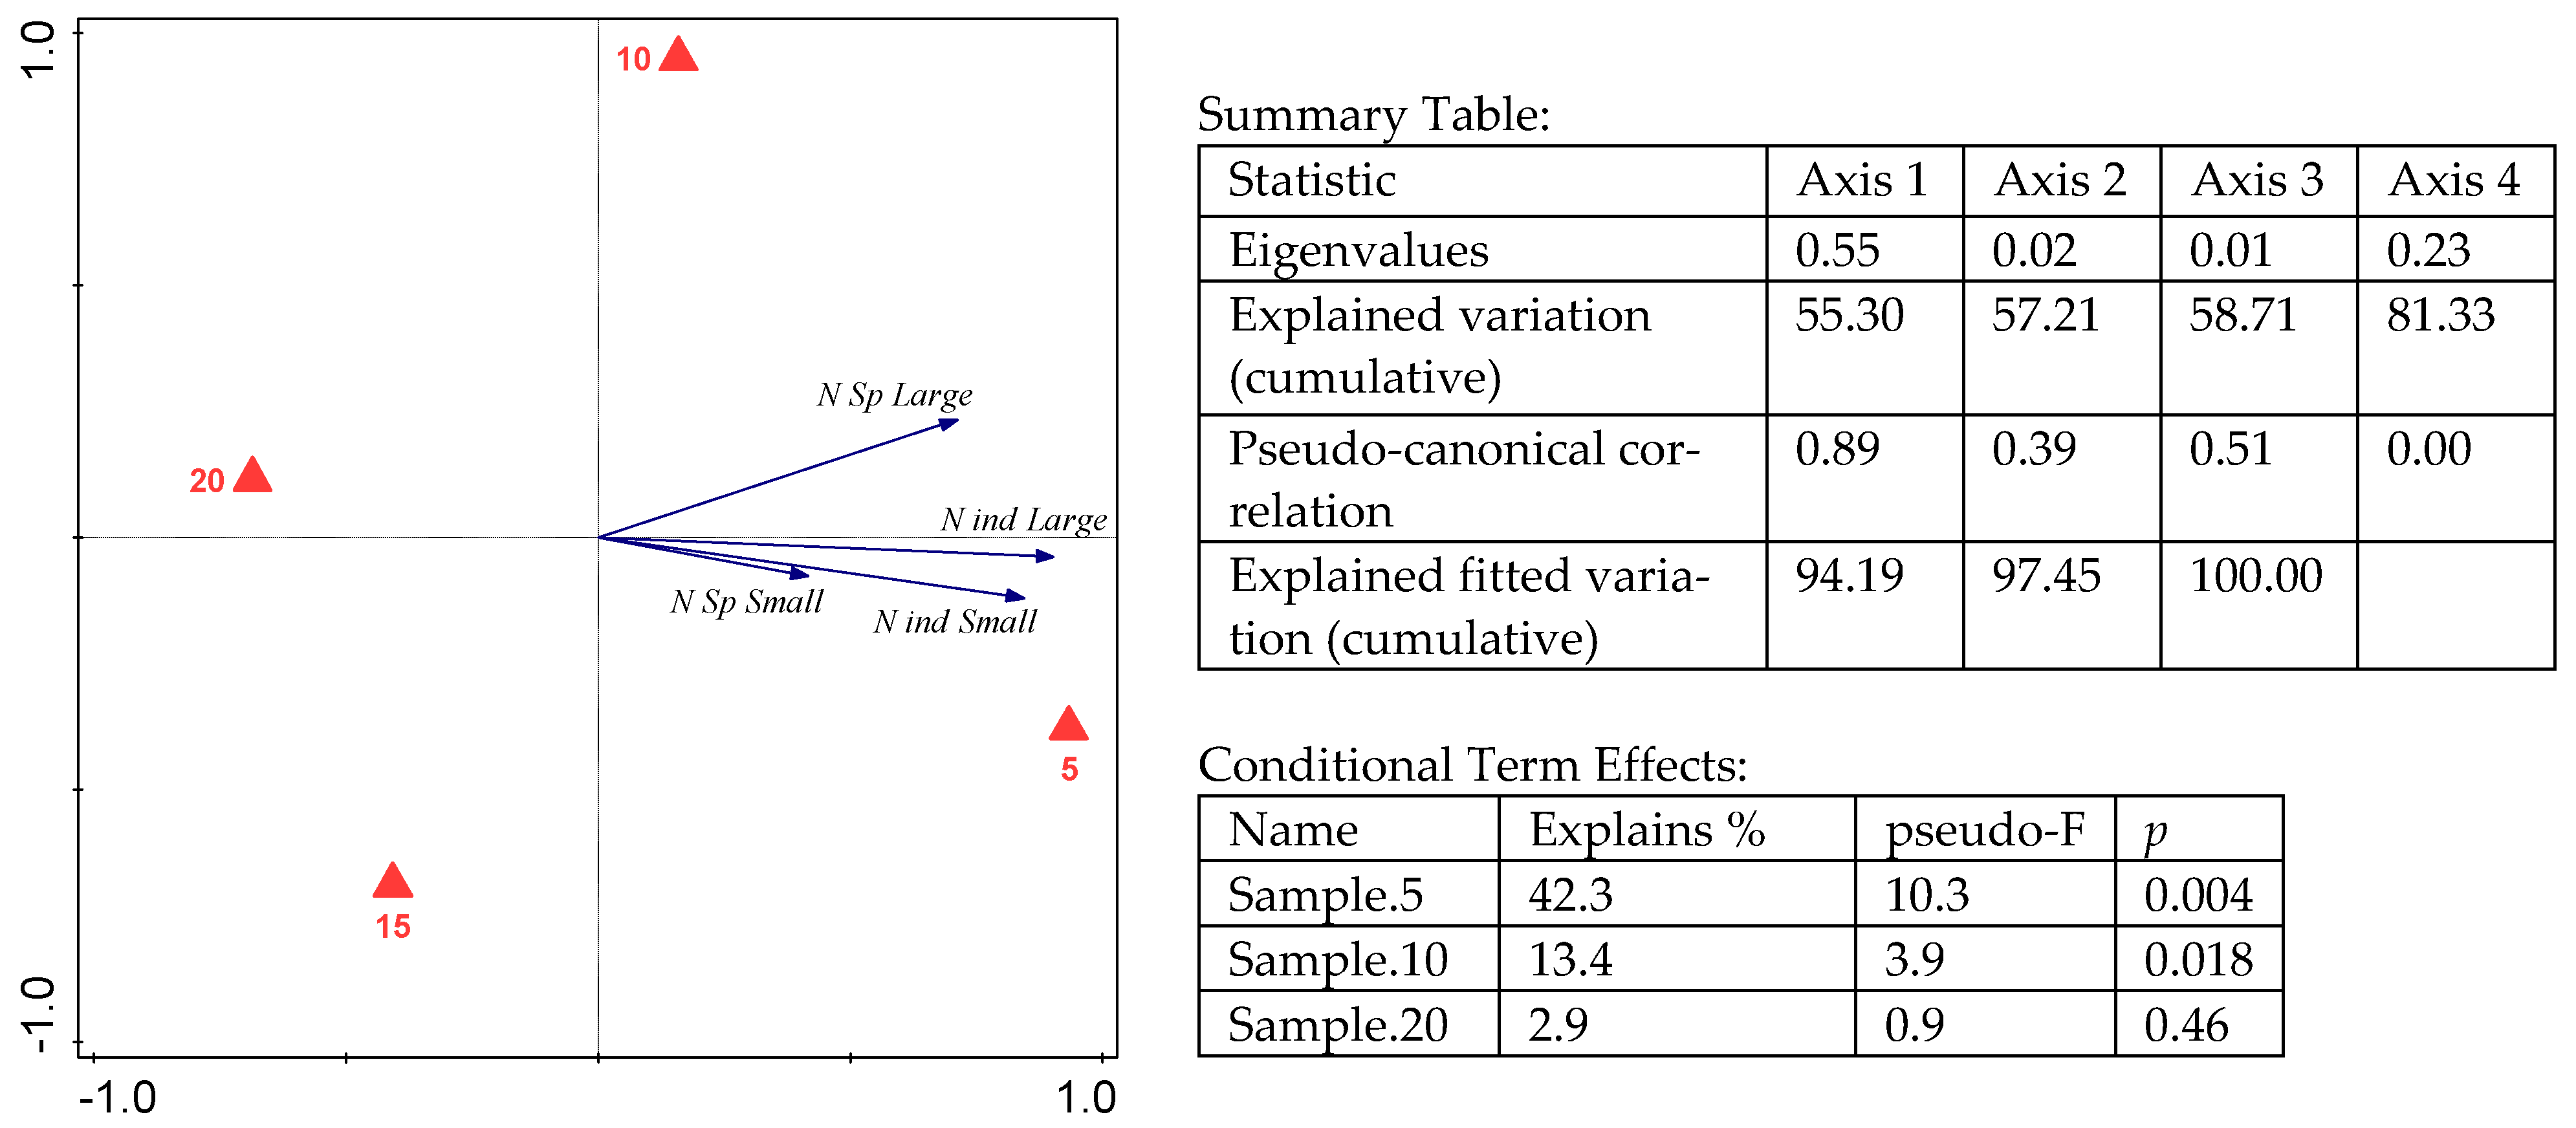
The CBS index decreased with depth, except for the deepest layer, where it was the highest (Figure 4). When the adult Oribatida were divided into two size groups (smaller or larger than 500 µm), the abundance of both groups decreased with depth (Figure 5). For example, in the upper layer, the abundance of the larger and smaller Oribatida was 689 (±150) and 567 (±182) specimens per 1000 cm3, and in the deepest layer, it was 143 (±52) and 102 (±50) specimens per 1000 cm3, respectively. In particular, the variability of the abundance of the large oribatids was explained by depth (adjusted explained variation 81.65%, permutation test on all axes: pseudo-F = 23.3, p = 0.002, df = 3), and the same was true for the small ones (adjusted explained variation: 67.26%, permutation test on all axes: pseudo-F = 11.3, p = 0.002, df = 3). The number of larger oribatid species was significant in relation to depth (adjusted explained variation: 45.80%, permutation test on all axes: pseudo-F = 5.2, p = 0.028, df = 3), while the number of smaller species was not significant (adjusted explained variation: 0.00%, permutation test on all axes: pseudo-F = 0.9, p = 0.532, df = 3). The important layers were 0–5 cm and 5–10 cm, which explained 42.3% and 13.4% of the variability of the whole community of the adult Oribatida, respectively, even if some species preferred deeper layers.
The abundance of the Mesostigmata was reduced even more with depth, and in the deepest layer, it made up 12% of the abundance from the uppermost layer (Figure 3). According to the Redundancy Analysis (RDA), the variability of the abundance of the Mesostigmata was not significant in relation to depth (but was close to significant; permutation test: both on the first axis and all axes, pseudo-F = 3.7, p = 0.054, df = 3). Only the abundance of the Prostigmata did not follow any pattern in relation to the sample depth and was insignificant (Figure 3).
In total, 62 species of the Oribatida were recorded in this study (Table 1). The largest number of species was noted in the uppermost layer (48), and it decreased with depth to 35 species in the deepest layer. The Shannon species diversity index was also the lowest in the deepest layer.
Across all layers, the most numerous species was Nanhermannia coronata Berlese, 1913; it made up 40–55% of all Oribatida (Table 1). In the uppermost layer, the second most abundant was Tectocepheus velatus (Michael, 1880), which comprised 15% of the Oribatida. In two other layers (5–10 cm and 15–20 cm), the second most abundant was Oppiella nova (Oudemans, 1902), with 9% participation in both layers, and in the deepest layer, the second most abundant was Quadroppia maritalis Lions, 1982 (17%).
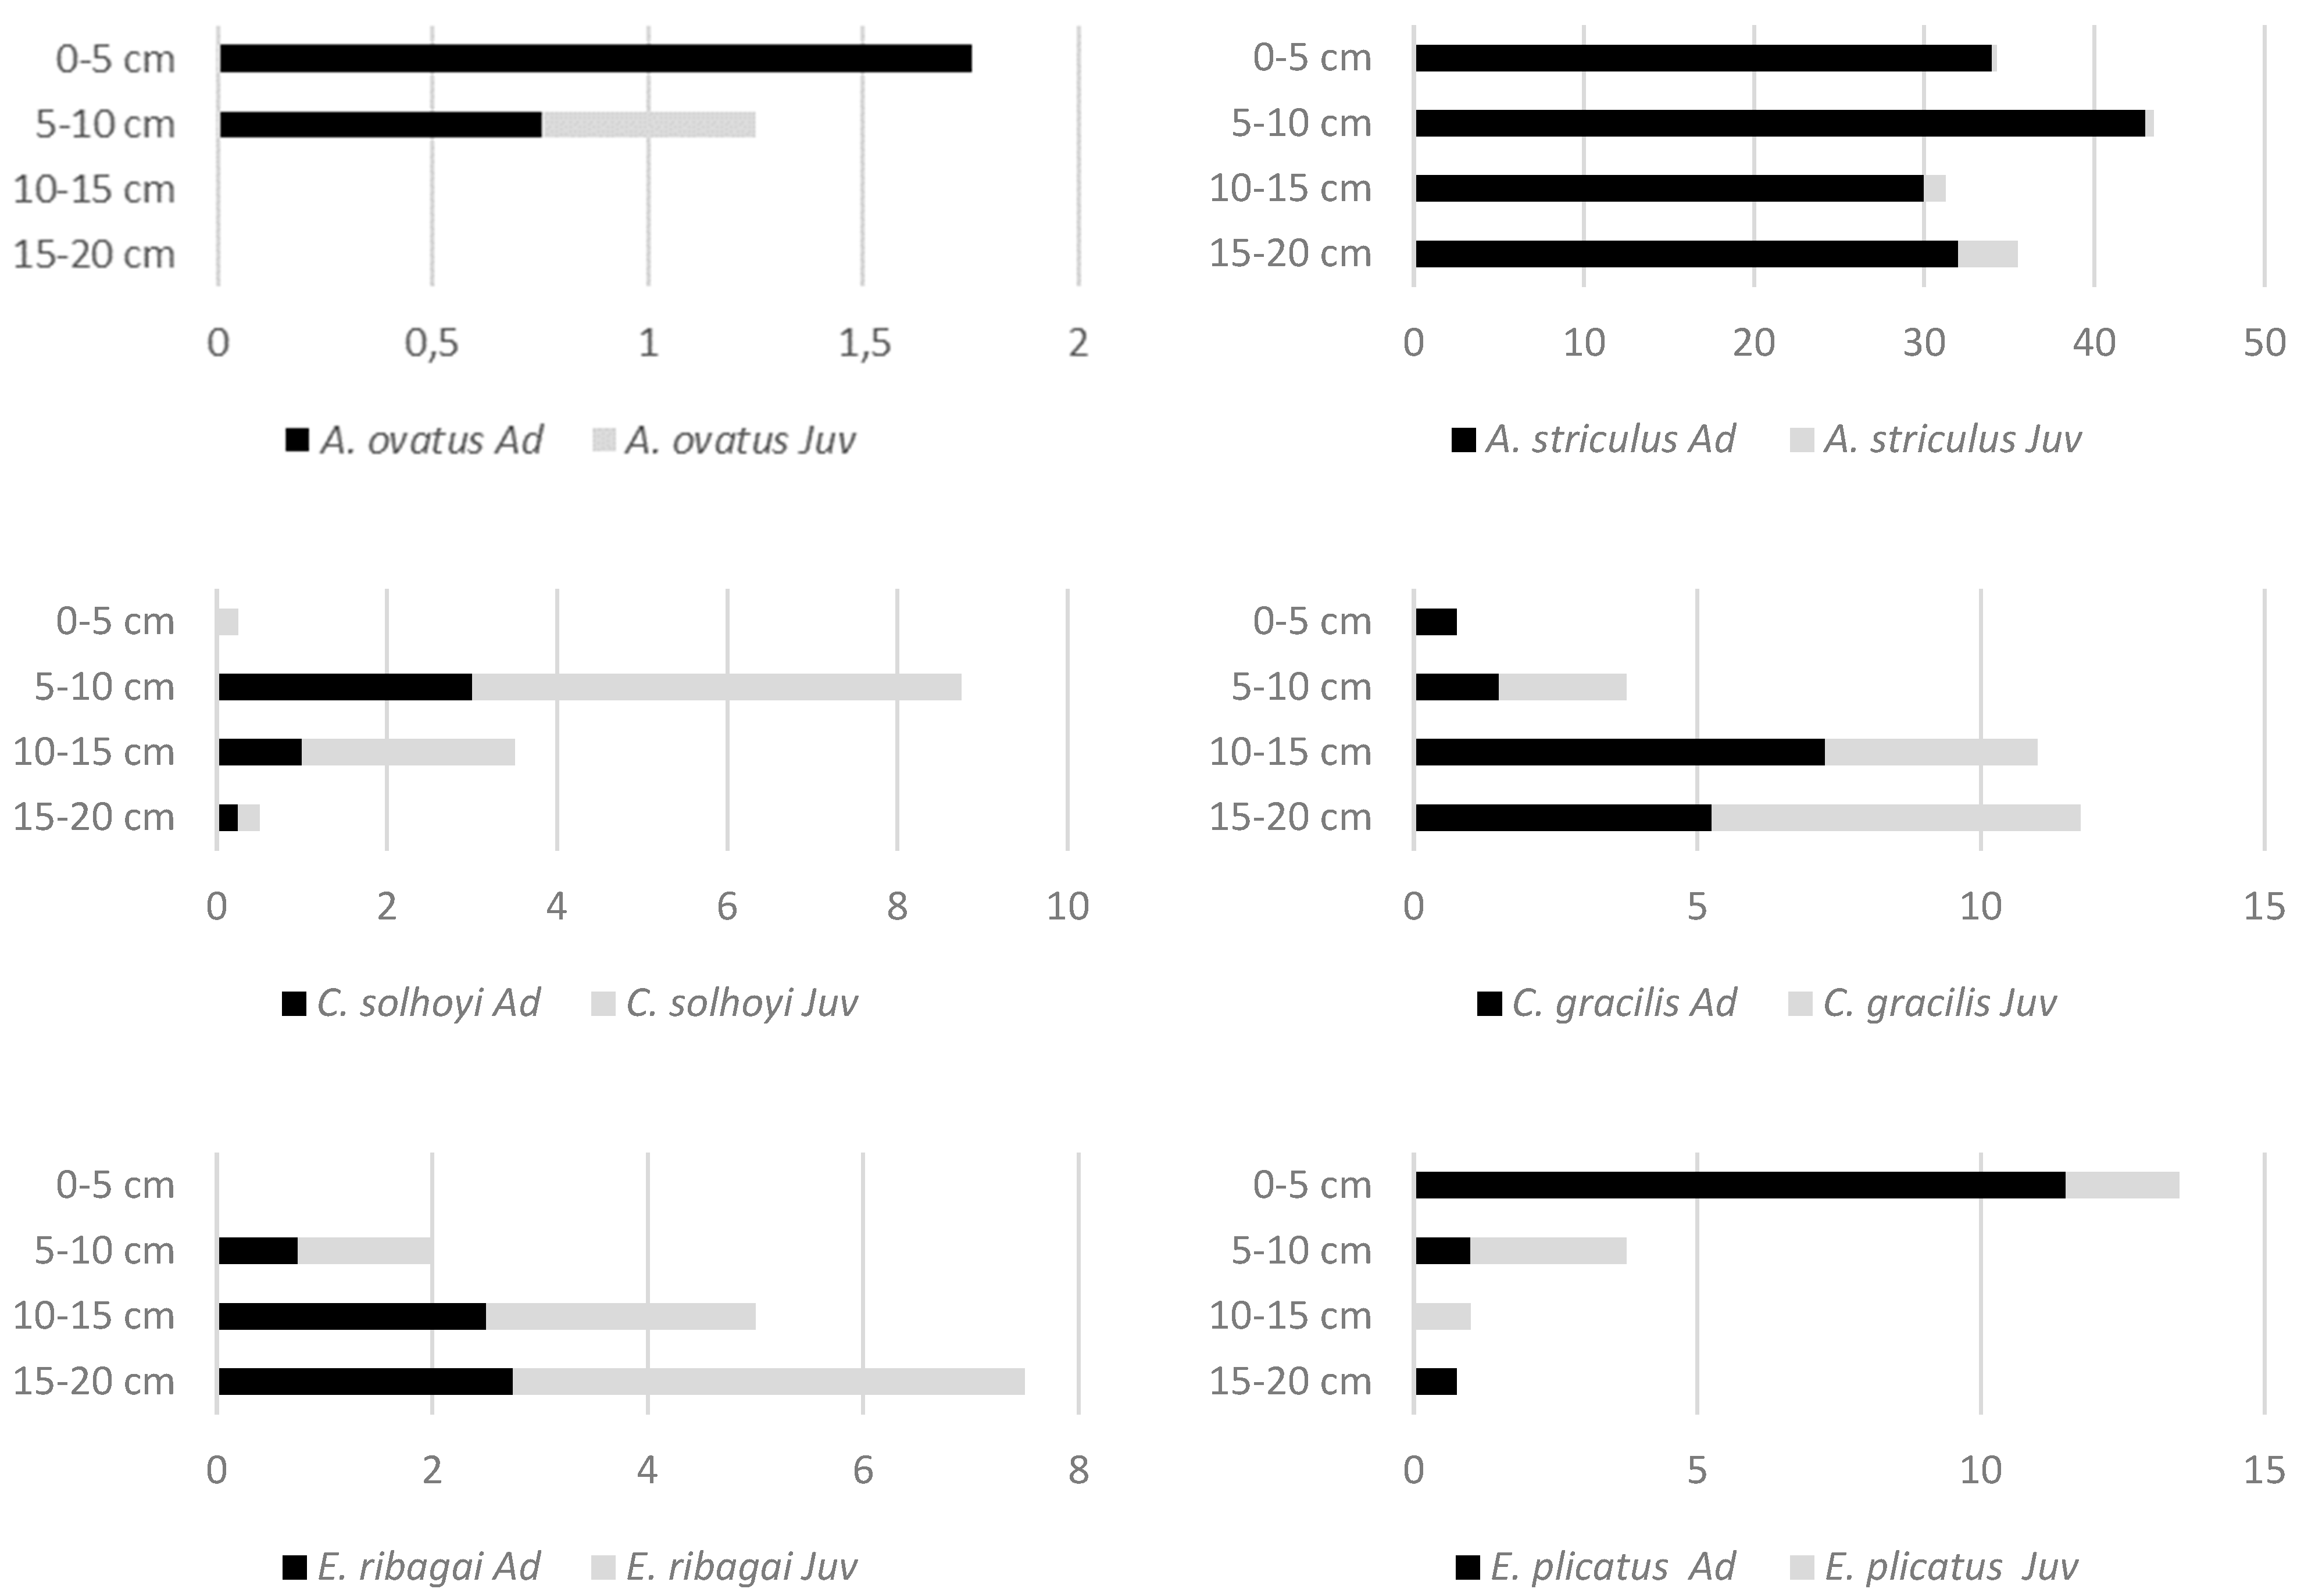
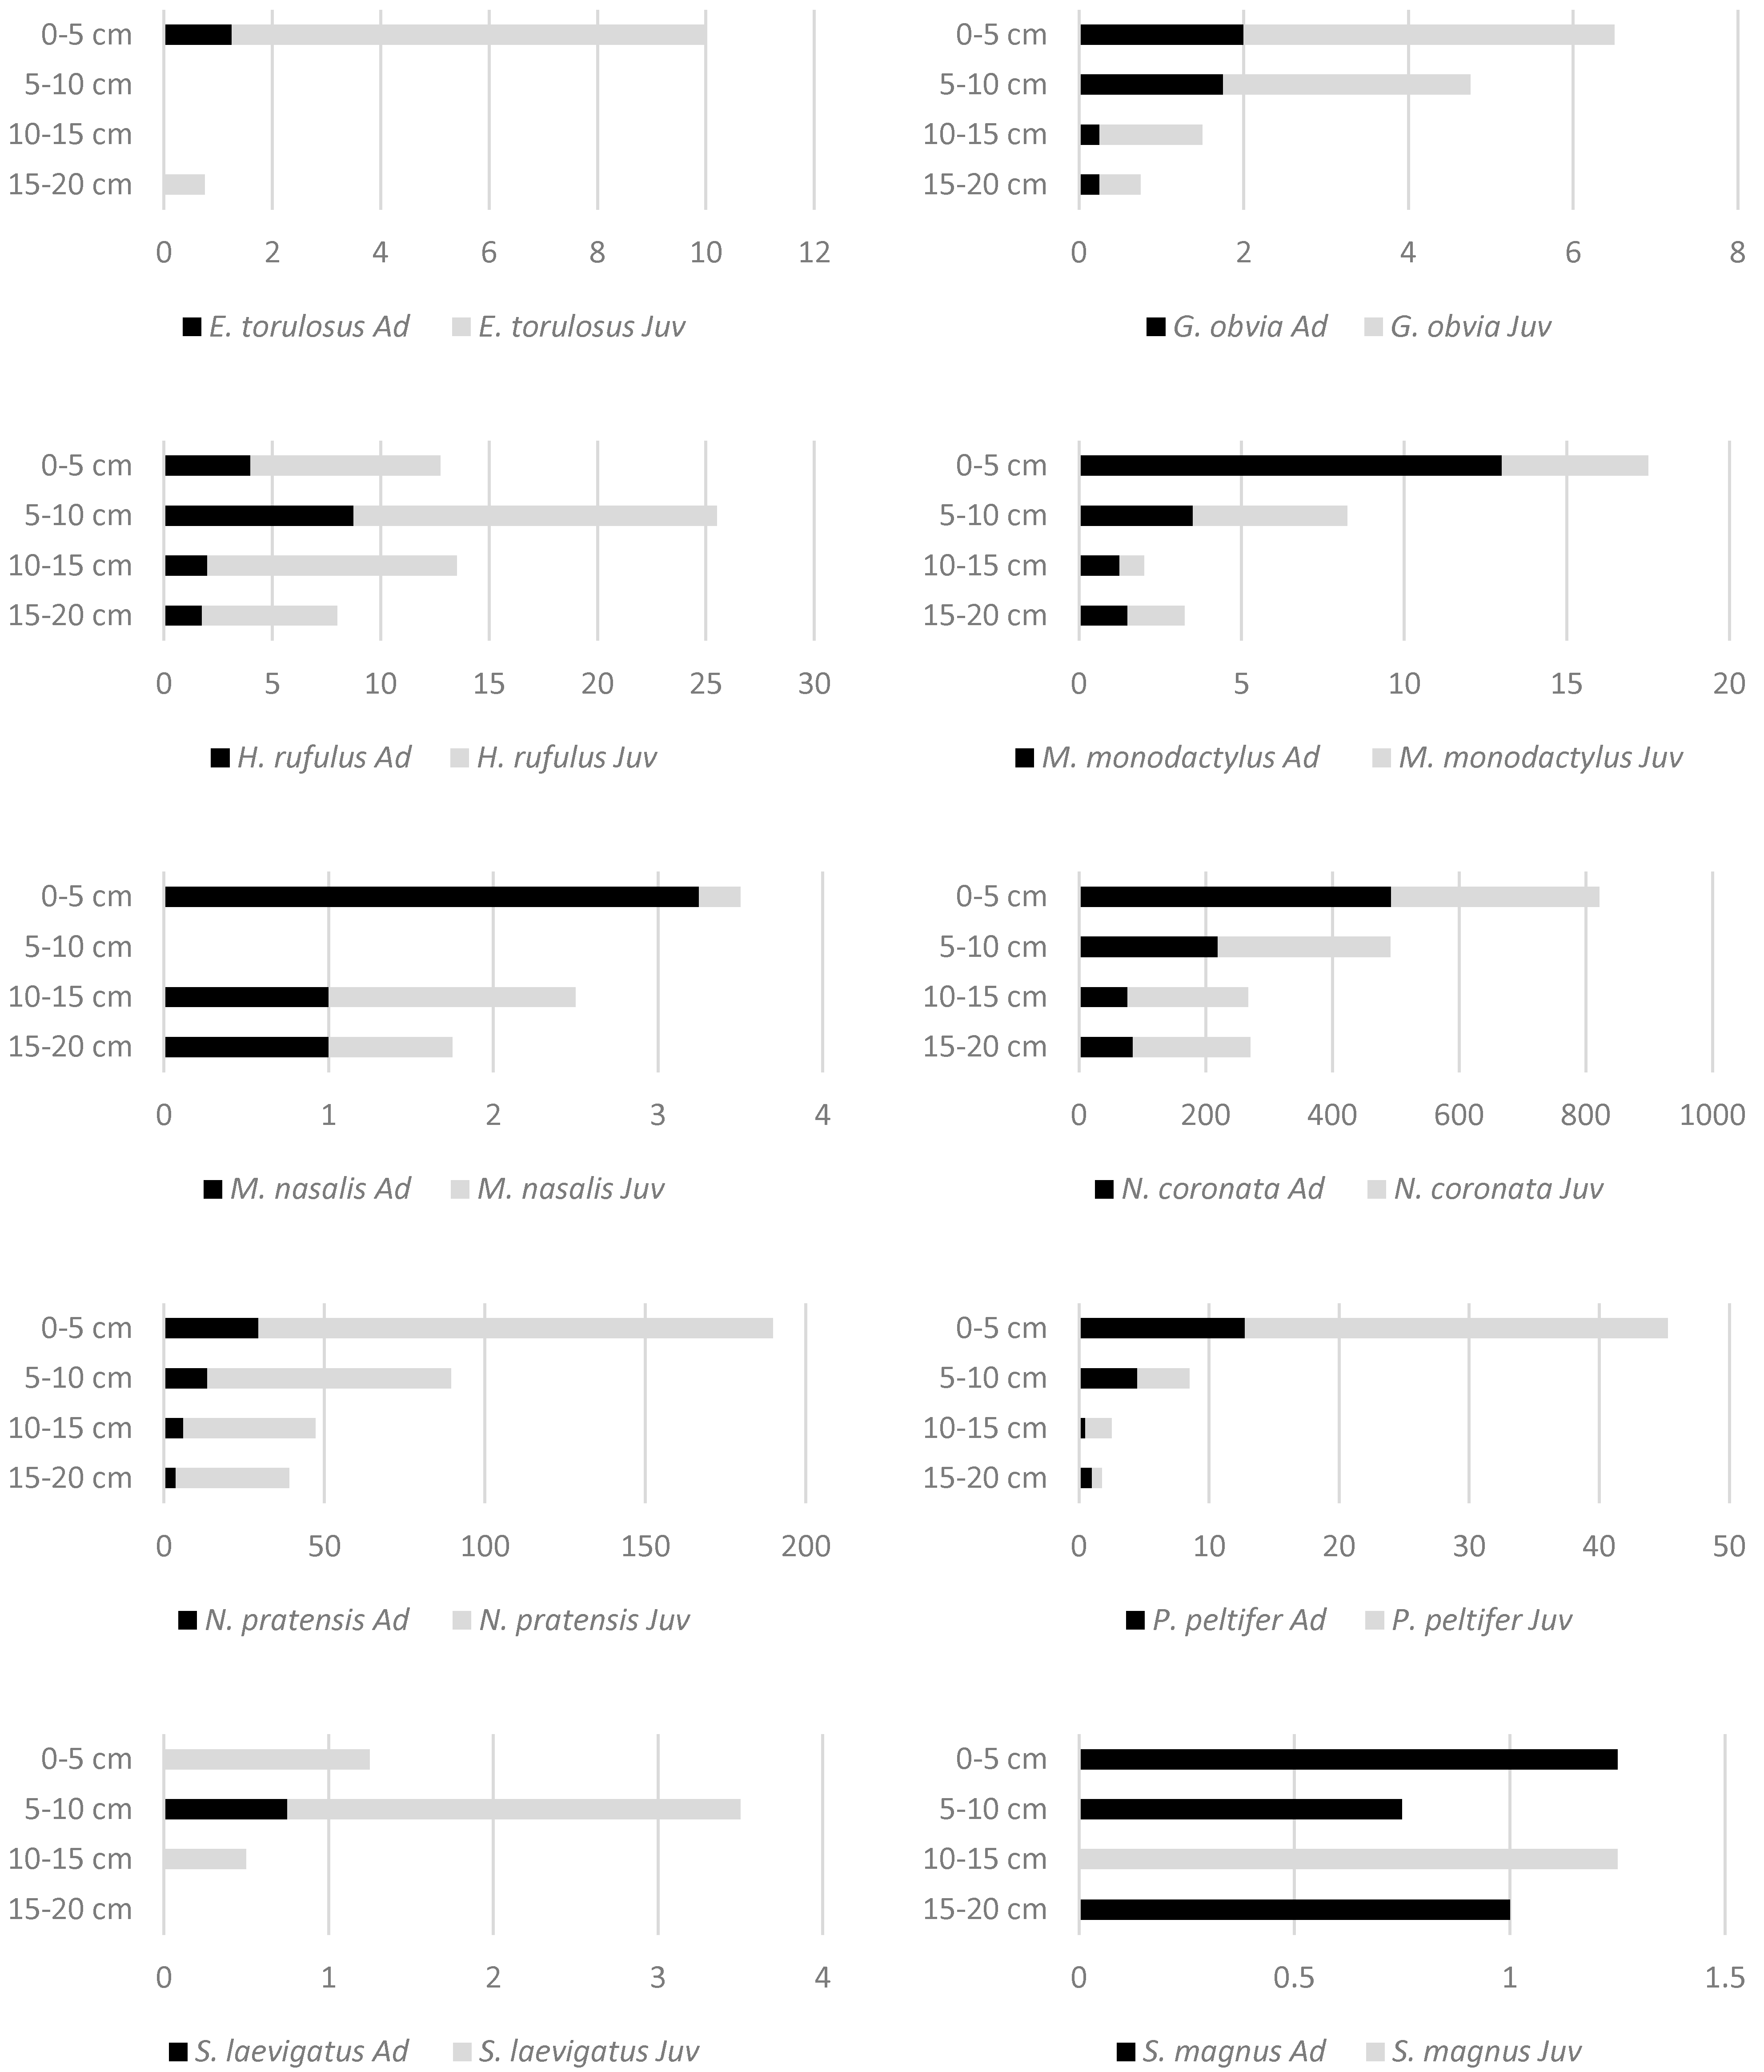
Twenty-three oribatid species were found across the entire depth gradient studied. Most of them decreased their abundance with depth, as was the case with Eupelops plicatus (C.L. Koch, 1835), Nothrus pratensis Sellnick, 1928, Oppiella nova, and Tectocepheus velatus (Table 1). In other species, however, the abundance increased significantly with the sample depth [Ceratozetes gracilis (Michael, 1884), Eulohmannia ribagai (Berlese, 1910)]. Quadroppia maritalis was most abundant at the depth of 10–15 cm. Some species had similar abundance in all studied layers [e.g., Atropacarus striculus (C.L. Koch, 1835), Rhysotritia ardua (C.L. Koch, 1841), and Steganacarus magnus (Nicolet, 1855)].
According to the RDA (Figure 6), the variability of the oribatid community (adults + juveniles) was significantly affected by the sample depth (permutation test: on the first axis, pseudo-F = 1.8, p = 0.002, and on all axes, pseudo-F = 2.8, p = 0.004, df = 3) that explained 26.82% of the variability of this group. Most species preferred the upper layer of Sphagnum. Only Suctobelbella acutidens (Forsslund, 1941) and Carabodes femoralis (Nicolet, 1855) preferred the deeper layer (5–10 cm). Quadroppia maritalis showed preference towards the 10–15 cm layer, while Eulohmannia ribagai and Ceratozetes gracilis preferred the deepest layer. In populations of several species, the juveniles dominated in the age structure (Figure 7). Both adults and juveniles of the same species showed a preference for the same layer (Figure 6).
Most oribatid species, which are known as intermediate hosts of tapeworms (Table 1), except Ceratozetes gracilis, were found to be the most abundant in the uppermost layer [Adoristes ovatus (C.L. Koch, 1839), Carabodes spp., Galumna obvia (Berlese, 1914), Oppiella nova, Platynothrus peltifer (C.L. Koch, 1839)], so they can potentially transmit parasites onto other animals, including those grazing in the forest bog.

4. Discussion

In the bog on Neshalvøya, the abundance of mites and the Oribatida was significantly higher in the upper Sphagnum layer and decreased with depth, which is consistent with the results from some other bogs [1,19] and other types of soil [8,16,58,59,60,61]. Our results differ, however, from earlier findings in Norway, where the adult Oribatida were most abundant in the deeper layer (5–10 cm) [20]. These differences can be explained by different seasons of sampling; we collected samples in late spring (28 May, at 18.7 °C) while in another study [20], samples were collected during winter (11 March, temperature not given). Based on the available temperature data from the nearest weather station (Fivelsdal) that refer to the later period (1995–2023), the mean temperature on 11 March ranged from −3.8 °C to 9.2 °C (https://www.yr.no/, accessed on 8 February 2024); therefore, it was evidently lower than in our study. The vertical distribution of Oribatida in raised bogs is strongly influenced by the season [19,21]. In spring, most mites (60–90%) accumulate in the surface layer (5–7 cm), 30% are found in lower parts of Sphagnum, and only 10% feed in the peat soil below. In autumn, most Oribatida (50–80%) migrate down to the Sphagnum hummocks, below the depth of 7 cm, while the percentage of mites in peat remains low (3.5%) [19]. In contrast, in bog microhabitats with a high water table, the seasonal migration of Oribatida is less pronounced, and many mites also stay in the upper layer in winter, because waterlogged and anaerobic conditions in the deeper layers are unsuitable for their overwintering [19,21,22,23].
The results concerning the Mesostigmata and Prostigmata are similar to those obtained in other habitats, e.g., in grassland, where the abundance of the Mesostigmata was the highest in the upper layer and decreased with depth, while the abundance of the Prostigmata was similar across all soil layers [13]. Many Mesostigmata species are hemiedaphic (i.e., living partly within the soil and partly on the surface). Changes in the vertical distribution of prostigmatid mites were observed after the drainage of a forest bog [23]; hence, this group seems to be sensitive to water conditions.
The analyses of the Oribatida at the species level revealed their different preferences towards the vertical layers of Sphagnum, similar to earlier observations [1]. One of the species that occurred abundantly in the upper layer and significantly decreased its abundance with depth was Nothrus pratensis. For comparison, throughout winter, this species was found solely in the middle layer of Sphagnum [20]. Nothrus pratensis was considered a thermophilous species, which quickly migrates vertically, even in response to diurnal changes in the temperature [21]. It is a primary decomposer, i.e., it feeds mainly off litter material [62], and as demonstrated with the stable isotopes, the specimens collected from different layers of Sphagnum use the same food sources [63]. So, it is rather the temperature than food that affects the vertical distribution of N. pratensis in peatlands.
Also, Hypochthonius rufulus C.L. Koch, 1835, is considered thermophilous [21] and it was more abundant in the upper layer of bogs in Switzerland [1]. In our study, no significant differences in the abundance of this species were observed, but in the deepest layer, its abundance made only ca. 60% or less of that in the higher layers, while in winter, it was found only in the middle layer of the Sphagnum [20]. The trophic status of Hypochthonius rufulus is unclear. Its gut content included springtails, mites [64], and bacteria mixed with finer, unidentified organic fragments [65], while carbohydrase activity suggested that it is omnivorous [66], and stable isotope results indicated that it has a narrow trophic range [63].
The significant decrease in the abundance of Eupelops plicatus with depth can be explained by its feeding preferences. It is considered a primary decomposer of litter, similar to Nothrus. pratensis [67]. The vertical distribution of Oppiella nova and Tectocepheus velatus is difficult to explain, since both species are eurytopic [32] and show wide tolerance to many ecological factors, e.g., humidity [23,68]. Oppiella nova is fungivorous [69], and Tectocepheus velatus has wide feeding preferences.
Nanhermannia coronata was the most abundant species in this study and occurred in all Sphagnum layers, confirming the results from other studies [1,20]. This species occurs abundantly in bogs and has wide preferences for bog microhabitats, e.g., hummocks, lawns, and hollows [42]. In two bogs in Trøndelag (Norway), the adults dominated in the age structure at the end of June (making up on average 65% of populations of this species), larvae made up 4%, protonymphs 10%, deutonymphs 12%, and tritonymphs 10%. Also, in the present study, the adults dominated in the surface layer, but in the deeper layers, the juveniles were more abundant than adults.
Quadroppia maritalis was found only in adult form, and juveniles of the entire family Quadroppiidae remain unknown [48,49]. Despite this species being considered rare [70], it was abundant in our study (in total, 739 specimens were found) and occurred across all layers. It clearly preferred the depth of 10–15 cm, where 62% of the specimens were found. Little is known about the ecology of Q. maritalis. It is considered praticolous and silvicolous [70,71], and has also been found in the upper layer (0–5 cm) of bogs [72,73], but in lower quantities. It was also found in low abundances in post-smelting areas, heavily contaminated with heavy metals [74], and in the soil under Silene acaulis cushions in high alpine Sweden [75]. This species is possibly more common but occurs in deeper soil layers, which were omitted in sampling.
Some species, like Ceratozetes gracilis and Eulohmannia ribagai, preferred the deepest layer of Sphagnum. Concerning Ceratozetes gracilis, similar results were obtained in aspen woodland soil, where this species showed a significantly positive correlation with the depth of organic matter and was predominant in the fermentation and humus organic horizons [76]. Ceratozetes gracilis is panphytophagous, i.e., it feeds on dead plant material and living microflora [38]. The results of Eulohmannia ribagai are consistent with Solhøy [20], who found this species confined to the lower layer of the bog. Eulohmannia ribagai inhabits fine humus, usually beneath the forest litter and epigeic mosses [77]. Its narrow and well-articulated body is a perfect match to move inside small pore spaces. The species feeds on litter-derived particles and associated bacterial films, which explains why it lives in moist microhabitats [77], like deeper layers of the forest bog on Neshalvøya.
Similarly, the vertical distribution of the aquatic Oribatida, e.g., Limnozetes ciliatus (Schrank, 1803), is strongly affected by the water conditions [23], not by the temperature, due to being eurythermic [21]. In our study, aquatic species [Limnozetes ciliatus, Hydrozetes lacustris (Michael, 1882), Tyrphonothrus foveolatus (Willmann, 1931), T. maior (Berlese, 1910)] were not abundant, and most occurred only in the deepest layer of the bog. Only Limnozetes rugosus (Sellnick, 1923) occurred both in the upper and bottom layers. In contrast, Lehmitz and Maraun [63] found both, Limnozetes ciliatus and Tyrphonothrus maior in different layers of Sphagnum, which was probably caused by more moist conditions in the bogs they studied.
Among the Oribatida, a significant decline in the abundance was observed only in adults, but not in juveniles. Earlier studies in peatlands showed that the inclusion of the juvenile Sarcoptiformes, to which the Oribatida belong, had less impact on the results than in the case of the Mesostigmata and the Trombidiformes [6]. The different stages of the same species were located at the same depths in most cases, similar to observations in the Swiss Jura [1].
In mineral soils with humus and litter, larger Oribatida are usually more abundant on the surface than the small ones [16,78,79], which was also observed in peatlands sampled to a depth of 7 cm [1]. In our study, the CBS index generally decreased with depth, confirming the latter results [1], and only in the deepest layer (15–20 cm) was it higher. This was because of the abundant occurrence of Nanhermannia coronata in this layer. The species has a body length of 480–570 µm; however, it has a narrow, cylindrical body, with a mere width of 228–260 µm [42], so it can easily migrate to deeper layers of Sphagnum bogs. Nanhermannia coronata belongs to secondary decomposers, i.e., predominantly feeding on fungi, and partly on litter [80], so it can use different food resources at different depths.
In the current study, we found eleven species of Oribatida that are listed as intermediate hosts of tapeworms [26], and most of them occurred in the upper layer. The most abundant was Oppiella nova, which is known as an intermediate host of Moniezia spp. that infest sheep and cattle. Another abundant species was Platynothrus peltifer, which is an intermediate host of four tapeworm species that are parasites of horses, sheep, cattle, and voles. The most frequent oribatid species that acts as an intermediate host of tapeworms (14 species of anoplocephalids were found in this mite) is Scheloribates laevigatus (C.L. Koch, 1835) [28], which was also found in our study but was not abundant.
In this study, fourteen oribatid species (i.e., over 20% of the total) were absent from the upper layer but were present in the deeper layers. Similarly, sampling during different seasons in peatlands contributes to the evaluation of their diversity [69], as does the inclusion of different developmental instars [6,25].

5. Conclusions

In the upper layer, the mites were the most abundant and most diverse. Most oribatid species that are known as intermediate hosts of tapeworms occurred in the upper layer creating potential risk to farm animals grazing on the studied bog. However, some Oribatida species were found only at deeper layers. Sampling these layers contributes considerably to the evaluation of the species diversity, andshould be considered in studying the biological diversity of naturally valuable areas, like the Neshalvøya peninsula studied herein.

Author Contributions

Conceptualization, A.S., S.S. and J.C.I.; methodology, A.S., J.C.I. and S.S.; visualization, A.S. and J.C.I.; writing—original draft preparation, A.S., J.C.I. and S.S.; writing—review and editing, A.S., J.C.I. and S.S. All authors have read and agreed to the published version of the manuscript.

Funding

This research received no external funding.

Data Availability Statement

Data are available at DataverseNO open archive https://doi.org/10.18710/WKO9QR (assessed on 4 March 2024).

Acknowledgments

We dedicate this paper to our friend, the late Torstein Solhøy (University of Bergen, Bergen, Norway), who was very dedicated to studying the nature of Neshalvøya (Kvam, Vestland, Norway); he planned this sampling and participated in the fieldwork. We are grateful to the anonymous reviewers for their helpful comments, and to Marek Ścibior (University of Warsaw, Poland) for proofreading of this manuscript.

Conflicts of Interest

The authors declare no conflict of interest.

References

  1. Barreto, C.; Lindo, Z. Drivers of decomposition and the detrital invertebrate community differ across a hummock-hollow microtopology in Boreal peatlands. Écoscience 2018, 25, 39–48. [Google Scholar] [CrossRef]
  2. Borcard, D. Les Oribates des tourbières du Jura suisse (Acari, Oribatei). Ecologie I. Quelques aspects de la communauté d’Oribates des sphaignes de la tourbière du Cachot. Rev. Suisse Zool. 1991, 98, 303–317. [Google Scholar] [CrossRef]
  3. Mumladze, L.; Murvanidze, M.; Behan-Pelletier, V. Compositional patterns in Holarctic peat bog inhabiting oribatid mite (Acari: Oribatida) communities. Pedobiologia 2013, 56, 41–48. [Google Scholar] [CrossRef]
  4. Borcard, D. Les Oribates des tourbières du Jura suisse (Acari, Oribatei). Ecologie IV. Distribution verticale. Rev. Suisse Zool. 1993, 100, 175–185. [Google Scholar]
  5. Seniczak, A.; Seniczak, S.; Iturrondobeitia, J.C.; Solhøy, T.; Flatberg, K.I. Diverse Sphagnum mosses support rich moss mite communities (Acari, Oribatida) in mires of Western Norway. Wetlands 2020, 40, 1339–1351. [Google Scholar] [CrossRef]
  6. Seniczak, A.; Seniczak, S.; Iturrondobeitia, J.C.; Marciniak, M.; Kaczmarek, S.; Mąkol, J.; Kaźmierski, A.; Zawal, A.; Schwarzfeld, M.D.; Flatberg, K.I. Inclusion of juvenile stages improves diversity assessment and adds to our understanding of mite ecology—A case study from mires in Norway. Ecol. Evol. 2022, 12, e9530. [Google Scholar] [CrossRef]
  7. Holt, J.A. The vertical distribution of cryptostigmatic mites, soil organic matter and macroporosity in three North Queensland rainforest soils. Pedobiologia 1981, 22, 202–209. [Google Scholar] [CrossRef]
  8. Anderson, J.M. Observations on the vertical distribution of Oribatei (Acarina) in two woodland soils. Ann. Zool. Ecol. Anim. Suppl. 1971, 127, 257–272. [Google Scholar]
  9. Luxton, M. Studies on the oribatid mites of a Danish beech wood soil. V. Vertical distribution. Pedobiologia 1981, 21, 365–386. [Google Scholar] [CrossRef]
  10. Karasawa, S.; Hijii, N. Vertical stratification of oribatid (Acari: Oribatida) communities in relation to their morphological and life-history traits and tree structures in a subtropical forest in Japan. Ecol. Res. 2008, 23, 57–69. [Google Scholar] [CrossRef]
  11. Guidi, C.; Frey, B.; Brunner, I.; Meusburger, K.; Vogel, M.E.; Chen, X.; Stucky, T.; Gwiazdowicz, D.J.; Skubała, P.; Bose, A.K.; et al. Soil fauna drives vertical redistribution of soil organic carbon in a long-term irrigated dry pine forest. Glob. Chang. Biol. 2022, 28, 3145–3160. [Google Scholar] [CrossRef]
  12. Wood, T.G. Acari and Collembola of moorland soils from Yorkshire, England. II. Vertical distribution in four grassland soils. Oikos 1967, 18, 137–140. [Google Scholar] [CrossRef]
  13. Curry, J.P. Seasonal and vertical distribution of the arthropod fauna of an old grassland soil. Sci. Proc. R. Dublin Soc. Ser. B 1971, 3, 49–71. [Google Scholar]
  14. Whelan, J. Seasonal fluctuations and vertical distribution of the acarine fauna of three grassland sites. Pedobiologia 1985, 28, 191–201. [Google Scholar]
  15. Önen, Ö.; Koç, K. Seasonal and vertical distribution of Acarina fauna of grassland. Çankaya Univ. J. Sci. Eng. 2011, 8, 277–289. [Google Scholar]
  16. Price, D.W.; Benham, G.S., Jr. Vertical distribution of soil-inhabiting microarthropods in an agricultural habitat in California. Environ. Entomol. 1977, 6, 575–580. [Google Scholar] [CrossRef]
  17. Setälä, H.; Aarnio, T. Vertical stratification and trophic interactions among organisms of a soil decomposer food web—A field experiment using 15N as a tool. Eur. J. Soil Biol. 2002, 38, 29–34. [Google Scholar] [CrossRef]
  18. Bengtsson, F.; Granath, G.; Rydin, H. Photosynthesis, growth, and decay traits in Sphagnum—A multispecies comparison. Ecol. Evol. 2016, 6, 3325–3341. [Google Scholar] [CrossRef]
  19. Rajski, A. Studium ekologczno-faunistyczne nad mechowcami (Acari-Oribatei) w kilku zespołach roślinnych. I. Ekologia. Poznańskie Tow. Przyj. Nauk Poznań 1961, 25, 123–287. [Google Scholar]
  20. Solhøy, T. Oribatids (Acari) from an oligotrophic bog in western Norway. Fauna Nor. 1979, 26B, 91–94. [Google Scholar]
  21. Popp, E. Semiaquatile Lebensräume (Bülten) in Hoch- und Niedermooren. (2. Teil: Die Milbenfauna). Int. Rev. Gesamten Hydrobiol. 1962, 47, 533–579. [Google Scholar] [CrossRef]
  22. Kuriki, G. Vertical distribution of oribatid mites in Akaiyachi Moor, Northeast Japan. Edaphologia 1998, 60, 11–16. [Google Scholar]
  23. Markkula, I. Vertical distribution of soil animals in a virgin and drained raised bog. SUO 1981, 32, 126–129. [Google Scholar]
  24. Price, D.W. Vertical distribution of small arthropods in a California pine forest soil. Ann. Entomol. Soc. Am. 1975, 68, 174–180. [Google Scholar] [CrossRef]
  25. Caterino, M.S.; Recuero, E. Overcoming life stage-centric biases illuminates arthropod diversity, systematics and biology. Syst. Entomol. 2024. online version of record. [Google Scholar] [CrossRef]
  26. Denegri, G.M. Review of oribatid mites as intermediate hosts of tapeworms of the Anoplocephalidae. Exp. Appl. Acarol. 1993, 17, 567–580. [Google Scholar] [CrossRef]
  27. Mullen, G.R.; Oconnor, B.M. Chapter 26—Mites (Acari). In Medical and Veterinary Entomology, 3rd ed.; Mullen, G.R., Durden, L.A., Eds.; Academic Press: Cambridge, MA, USA, 2019; pp. 533–602. [Google Scholar]
  28. Evjen, K.; Hareland, A.; Kirkemo, M.; Grjotheim, I.; Jørgensen, Å.M. Neshalvøya. Prosjekt 5—LAA 234 Områdeanalyse Kvam. 2006. Available online: https://herland.net/amund/pdf_filer/analyse2.pdf (accessed on 4 March 2024).
  29. Overvoll, O. Industriområde for skipsverft i Hansvågen, Kvam herad: Konsekvensutgreiing for biologisk mangfald og naturressursar. Rådgivende Biol. 2007, 34, 1017. [Google Scholar]
  30. Førland, E.J. Precipitation normals, normal period 1961–1990. Det Nor. Meterologiske Inst. Klima 1993, 39, 1–63. [Google Scholar]
  31. Aune, B. Air temperature normals, normalperiod 1961–1990. Det Nor. Meteorol. Inst. Klima 1993, 2, 1–63. [Google Scholar]
  32. Weigmann, G. Hornmilben (Oribatida). Die Tierwelt Deutschlands; Goecke. & Evers: Keltern, Germany, 2006; Volume 76, p. 520. [Google Scholar]
  33. Grandjean, F. Étude sur le développement des Oribates. Bull. Société Zool. Fr. 1933, 58, 30–61. [Google Scholar]
  34. Chistyakov, M.P. Biology and postembryonic development of Oppia nova (Oudem., 1902) (Oribatei), being a dominating species on turbaries from Gorky region. In Proceedings of the Fourth Scientific Conference of Zoologists, Boston, MA, USA, 29 December 1969; Gorky State Pedagogical Institute: Gorky, Russia, 1970; Volume 114, pp. 51–64. [Google Scholar]
  35. Subbotina, I.A. On the biology of Scheloribates laevigatus (C.L. Koch, 1836)—An armored mite of the family Scheloribatidae. Sci. Notes Gorky State Pedagog. Inst. 1967, 66, 33–50. [Google Scholar]
  36. Sitnikova, L.G. Postembryonic development of the mite Eupelops torulosus (C.L. Koch, 1839) (Oribatei, Pelopidae). Parazitol. Sb. 1978, 28, 53–72. [Google Scholar]
  37. Webb, N.R. Observations on Steganacarus magnus: Differences between the instars. Acarologia 1979, 20, 138–146. [Google Scholar] [PubMed]
  38. Behan-Pelletier, V.M. Ceratozetes (Acari: Ceratozetidae) of Canada and Alaska. Can. Entomol. 1984, 116, 1449–1517. [Google Scholar] [CrossRef]
  39. Seniczak, S.; Klimek, A. The morphology of juvenile stages of moss mites of the family Camisiidae (Acari: Oribatida). Part I. Zool. Anz. 1990, 225, 71–86. [Google Scholar]
  40. Norton, R.A.; Behan-Pelletier, V.M.; Wang, H.-F. The aquatic oribatid mite genus Mucronothrus in Canada and the western U.S.A. (Acari: Trhypochthoniidae). Can. J. Zool. 1996, 74, 926–949. [Google Scholar] [CrossRef]
  41. Seniczak, S.; Seniczak, A. Morphology of three species of Crotonioidea Thorel, 1876 (Acari: Oribatida), and relations between some genera. Zool. Anz. 2009, 248, 195–211. [Google Scholar] [CrossRef]
  42. Seniczak, S.; Seniczak, A. Morphological ontogeny and ecology of a common peatland mite, Nanhermannia coronata (Acari, Oribatida, Nanhermanniidae). Animals 2023, 13, 3590. [Google Scholar] [CrossRef] [PubMed]
  43. Seniczak, S.; Żelazna, E. The morphology of juvenile stages of moss mites of the family Nothridae (Acari: Oribatida). II. Zool. Anz. 1992, 229, 149–162. [Google Scholar]
  44. Seniczak, S.; Norton, R.A.; Seniczak, A. Morphology of Eniochthonius minutissimus (Berlese, 1904) and Hypochthonius rufulus C. L. Koch, 1835 (Acari: Oribatida: Hypochthonioidea). Ann. Zool. 2009, 59, 373–386. [Google Scholar] [CrossRef]
  45. Seniczak, A.; Seniczak, S.; Kaczmarek, S. Morphology, distribution and ecology of Eupelops curtipilus and Eupelops plicatus (Acari, Oribatida, Phenopelopidae). Int. J. Acarol. 2015, 41, 77–95. [Google Scholar] [CrossRef]
  46. Seniczak, A.; Seniczak, S.; Kaczmarek, S.; Chachaj, B. Morphological ontogeny and ecology of Adoristes ovatus (Acari: Oribatida: Liacaridae), with comments on Adoristes Hull. Syst. Appl. Acarol. 2017, 22, 2038–2056. [Google Scholar] [CrossRef]
  47. Pfingstl, T.; Krisper, G. No difference in the juveniles of two Tectocepheus species (Acari: Oribatida, Tectocepheidae). Acarologia 2011, 51, 199–218. [Google Scholar] [CrossRef]
  48. Norton, R.A.; Ermilov, S.G. Catalogue and historical overview of juvenile instars of oribatid mites (Acari: Oribatida). Zootaxa 2014, 3833, 1–132. [Google Scholar] [CrossRef]
  49. Norton, R.A.; Ermilov, S.G. Catalogue of juvenile instars of oribatid mites (Acari: Oribatida)—The next decade (2014–2023). Zootaxa 2024, 5419, 451–494. [Google Scholar] [CrossRef]
  50. Ermilov, S.G.; Tolstikov, A.V.; Weigmann, G. Morphology of adult and juvenile instars of Galumna obvia (Acari, Oribatida, Galumnidae), with discussion of its taxonomic status. ZooKeys 2013, 357, 11–28. [Google Scholar] [CrossRef] [PubMed]
  51. Subías, L.S. Listado sistemático, sinonímico y biogeográfico de los Ácaros Oribátidos (Acariformes, Oribatida) del mundo (1748–2002). Graellsia 2004, 60, 3–305. [Google Scholar] [CrossRef]
  52. Subías, L.S. Listado sistematico, sinonimico y biogeografico de los acaros oribatidos (Acariformes, Oribatida) del mundo (except fosiles). Monogr. Electrón. SEA 2022, 12, 1–538. [Google Scholar]
  53. Brückner, A.; Heethoff, M.; Norton, R.A.; Wehner, K. Body size structure of oribatid mite communities in different microhabitats. Int. J. Acarol. 2018, 44, 367–373. [Google Scholar] [CrossRef]
  54. Stanisz, A. Easy Course of Statistic Using Statistica PL and Medicine Examples, 1. In Basic Statistic; StatSoft Polska: Kraków, Poland, 2006; p. 532. [Google Scholar]
  55. Braak, C.J.F.T. CANOCO—A FORTRAN Program for Canonical Community Ordination by (Partial) (Detrended) (Canonical) Correspondence Analysis, Principle Component Analysis and Redundancy Analysis; TNO Inst: Wageningen, The Netherlands, 1988. [Google Scholar]
  56. Braak, C.J.F.T.; Jongman, R.H.G.; Tongeren, O.F.R.V. Data Analysis in Community and Landscape Ecology; Cambridge University Press: Cambridge, UK, 1995. [Google Scholar]
  57. Łomnicki, A. Wprowadzenie do Statystyki dla Przyrodników; Wydawnictwo Naukowe PWN: Warsaw, Poland, 2024; p. 282. [Google Scholar]
  58. Lebrun, P. Ecologie et biocenotique de quelques peuplements d’arthropodes edaphiques. Mémoires Musée R. D’histoire Nat. Belg. 1971, 165, 1–203. [Google Scholar]
  59. Perdue, J.C.; Crossley, D.A. Vertical distribution of soil mites (Acari) in conventional and no-tillage agricultural systems. Biol. Fertil. Soils 1990, 9, 135–138. [Google Scholar] [CrossRef]
  60. Revelo Tobar, H.; Estrada-Venegas, E.; Equihua-Martínez, A.; Valdez-Carrasco, J. Oribatid mites in agricultural and natural soils: A case study of vertical distribution. Entomol. Commun. 2022, 4, ec04015. [Google Scholar] [CrossRef]
  61. Urhan, R.; Katilmis, Y.; Kahveci, A.Ö. Vertical distribution of soil mites (Acari) on Dalaman (Mugla Prov.—Turkey). Munis Entomol. Zool. 2008, 3, 333–341. [Google Scholar]
  62. Pollierer, M.M.; Dyckmans, J.; Scheu, S.; Haubert, D. Carbon flux through fungi and bacteria into the forest soil animal food web as indicated by compound-specific 13C fatty acid analysis. Funct. Ecol. 2012, 26, 978–990. [Google Scholar] [CrossRef]
  63. Lehmitz, R.; Maraun, M. Small-scale spatial heterogeneity of stable isotopes signatures (d15N, d13C) in Sphagnum sp. transfers to all trophic levels in oribatid mites. Soil Biol. Biochem. 2016, 100, 242–251. [Google Scholar] [CrossRef]
  64. Behan-Pelletier, V.; Hill, S. Feeding habits of sixteen species of Oribatei (Acari) from an acid peat bog, Glenamoy, Ireland. Rev. D’ecologie Biol. Sol. 1983, 20, 221–267. [Google Scholar]
  65. Smrž, J. Internal anatomy of Hypochthonius rufulus (Acari, Oribatida). J. Morphol. Zool. 1989, 200, 215–230. [Google Scholar] [CrossRef] [PubMed]
  66. Siepel, H.; Ruiter-Dijkman, E.M.D. Feeding guilds of oribatid mites based on their carbohydrase activities. Soil Biol. Biochem. 1993, 25, 1491–1497. [Google Scholar] [CrossRef]
  67. Eissfeller, V.; Beyer, F.; Valtanen, K.; Hertel, D.; Maraun, M.; Polle, A.; Scheu, S. Incorporation of plant carbon and microbial nitrogen into the rhizosphere food web of beech and ash. Soil Biol. Biochem. 2013, 62, 76–81. [Google Scholar] [CrossRef]
  68. Seniczak, A.; Seniczak, S.; Maraun, M.; Graczyk, R.; Mistrzak, M. Oribatid mite species numbers increase, densities decline and parthenogenetic species suffer during bog degradation. Exp. Appl. Acarol. 2016, 68, 409–428. [Google Scholar] [CrossRef]
  69. Hartenstein, R. Soil Oribatei. 1. Feeding specificity among forest soil Oribatei (Acarina). Ann. Entomol. Soc. Am. 1962, 55, 202–206. [Google Scholar] [CrossRef]
  70. Schatz, H.; Bruckner, A. Hornmilben (Acari: Oribatida) aus dem Wildnisgebiet Dürrenstein und dem Urwald Rothwald (Österreich). Silva Fera 2021, 8, 42–62. [Google Scholar]
  71. Corral-Hernández, E.; Iturrondobeitia, J.C. Effects of cattle and industries on oribatid mite communities of grassland soil in the Basque Country (Spain). Int. J. Acarol. 2012, 38, 217–229. [Google Scholar] [CrossRef]
  72. Seniczak, A.; Seniczak, S.; Graczyk, R.; Waldon-Rudzionek, B.; Nowicka, A.; Pacek, S. Seasonal dynamics of oribatid mites (Acari, Oribatida) in a bog in Poland. Wetlands 2019, 39, 853–864. [Google Scholar] [CrossRef]
  73. Seniczak, A.; Seniczak, S.; Iturrondobeitia, J.C.; Gwiazdowicz, D.J.; Waldon-Rudzionek, B.; Flatberg, K.I.; Bolger, T. Mites (Oribatida and Mesostigmata) and vegetation as complementary bioindicators in peatlands. Sci. Total Environ. 2022, 851, 158335. [Google Scholar] [CrossRef] [PubMed]
  74. Skubała, P.; Rola, K.; Osyczka, P. Oribatid communities and heavy metal bioaccumulation in selected species associated with lichens in a heavily contaminated habitat. Environ. Sci. Pollut. Res. Int. 2016, 23, 8861–8871. [Google Scholar] [CrossRef] [PubMed]
  75. Ľuptáčik, P.; Čuchta, P.; Jakšová, P.; Miklisová, D.; Kováč, Ľ.; Alatalo, J.M. Cushion plants act as facilitators for soil microarthropods in high alpine Sweden. Biodivers. Conserv. 2021, 30, 3243–3264. [Google Scholar] [CrossRef]
  76. Mitchell, M.J. Vertical and horizontal distribution of oribatid mites (Acari: Cryptostigmata) in an aspen woodland soil. Ecology 1978, 59, 516–525. [Google Scholar] [CrossRef]
  77. Norton, R.A.; Ermilov, S.G. Paedomorphosis and sexuality in Eulohmanniidae (Acari, Oribatida): Surprising diversity in a relictual family of oribatid mites. Acarologia 2022, 62, 989–1069. [Google Scholar] [CrossRef]
  78. Salt, G.; Hollick, F.S.; Raw, F.; Brian, M.V. The arthropod population of pasture soil. J. Anim. Ecol. 1948, 17, 139–150. [Google Scholar] [CrossRef]
  79. Evans, G.O.; Macfarlane, D.; Sheals, J.G. The Terrestrial Acari of the British Isles: An Introduction to Their Morphology, Biology and Classification. Trustess of the British Museum: London, UK, 1968. [Google Scholar]
  80. Schneider, K.; Migge, S.; Norton, R.A.; Scheu, S.; Langel, R.; Reineking, A.; Maraun, M. Trophic niche differentiation in soil microarthropods (Oribatida, Acari): Evidence from stable isotope ratios (15N/14N). Soil Biol. Biochem. 2004, 36, 1769–1774. [Google Scholar] [CrossRef]
Figure 1. Location of the study site (red point) on Neshalvøya, modified from Google Maps.
Forests 15 00957 g001
Figure 2. Study site on Neshalvøya; (A)—view at the forest bog, (B)—Sphagnum moss sampled, (C)—sampling of vertical Sphagnum layers.
Forests 15 00957 g002
Figure 3. Abundance of mites (in 1000 cm3) in different layers of Sphagnum moss; mean—bars and values above bars; standard deviation—whiskers; Ad—adult; Juv—juvenile; ab—different letters indicate significant differences between the means.
Forests 15 00957 g003
Figure 4. Community body size of adult Oribatida in different layers of Sphagnum moss.
Forests 15 00957 g004
Figure 5. Results of Redundancy Analysis (RDA) of the variability of the number of specimens and species of adult Oribatida smaller than 500 µm (NindSmall, NSpSmall) and larger than 500 µm (NindLarge, NSpLarge) in relation to the layers (marked with red triangles): 5—0–5 cm, 10—5–10 cm, 15—10–15 cm, 20—15–20 cm.
Forests 15 00957 g005
Figure 6. Results of Redundancy Analysis (RDA) of the variability of the best fitted species of Oribatida to the layers (marked with red triangles): 5—0–5 cm; 10—5–10 cm; 15—10–15 cm; 20—15–20 cm; Ad—adult; Juv—juvenile; abbreviations of species names are in Table 1.
Forests 15 00957 g006
Figure 7. Mean abundance (in 1000 cm3) of Oribatida species which were represented in samples by both adults and juveniles, in different layers of Sphagnum.
Forests 15 00957 g007aForests 15 00957 g007bForests 15 00957 g007c
Table 1. Mean abundance in 1000 cm3 (± standard deviation); number of species (S) and Shannon (Hs) index of Oribatida in vertical layers of Sphagnum; species with significant differences in abundance are marked in bold; ab—different letters indicate significant differences between the means; RDA refers to best fitted species; length values are average values of the length of adults; *—indicates intermediate hosts of tapeworms after Denegri (1993) [26].
SpeciesAbbreviation for RDA Length (µm)0–5 cm5–10 cm10–15 cm15–20 cm
Adoristes ovatus (C.L. Koch, 1839) *AdrOvt5901.75 (±1.71)1.25 (±1.89)0.000.00
Achipteria coleoptrata (Linnaeus, 1758) * 5900.25 (±0.50)0.000.000.00
Atropacarus striculus (C.L. Koch, 1835) 69534.25 (±14.29)43.50 (±3.79)31.25 (±9.98)35.50 (±6.24)
Banksinoma lanceolata (Michael, 1885) 3300.75 (±0.96)0.000.000.00
Camisia solhoyi Colloff, 1993 8400.25 (±0.50)8.75 (±11.81)3.50 (±2.65)0.50 (±1.00)
Carabodes femoralis (Nicolet, 1855) * CarFem6580.75 (±0.96)2.00 (±1.15)0.50 (±1.00)0.00
Carabodes labyrinthicus (Michael, 1879) *CarLab5053.00 (±1.15)0.75 (±0.96)0.50 (±0.58)1.00 (±2.00)
Carabodes reticulatus Berlese, 1913 * 7550.25 (±0.50)0.000.000.00
Carabodes rugosior Berlese, 1916 * 5850.75 (±1.50)0.25 (±0.50)0.000.00
Ceratoppia sexpilosa (L. Koch, 1879) 7000.50 (±0.58)0.000.75 (±0.50)0.25 (±0.50)
Ceratozetes sp. 3400.000.000.25 (±0.50)0.00
Ceratozetes gracilis (Michael, 1884) *CerGrc5450.75 a (±0.96)3.75 ab (±2.75)11.00 ab (±4.08)11.75 b (±5.68)
Chamobates borealis (Trägårdh 1902) 3700.000.000.000.25 (±0.50)
Chamobates pusillus (Berlese 1895) 4201.00 (±1.41)0.000.000.00
Cultroribula bicultrata (Berlese, 1905) 2380.25 (±0.50)0.75 (±0.96)0.25 (±0.50)0.00
Dameobelba minutissima (Sellnick, 1929) 2600.000.000.50 (±1.00)0.75 (±0.96)
Eniochthonius minutissimus (Berlese, 1904) 3750.50 (±0.58)0.000.50 (±0.58)0.00
Eulohmannia ribagai (Berlese, 1910)EulRib6650.00 a2.00 ab (±1.63)5.00 ab (±1.41)7.50 b (±5.07)
Eupelops plicatus (C.L. Koch, 1835)EupPlc59013.50 a (±5.45)3.75 ab (±3.30)1.00 ab (±1.41)0.75 b (±1.50)
Eupelops torulosus (C.L. Koch, 1839)EupTor69010.00 (±14.17)0.000.000.75 (±1.50)
Galumna obvia (Berlese, 1914) * 7756.50 (±6.03)4.75 (±5.62)1.50 (±1.29)0.75 (±1.50)
Hemileius initialis (Berlese, 1908) 5000.25 (±0.50)0.000.000.00
Hoplophthiracarus illinoisensis (Ewing 1909) 55084.00 (±100.68)28.25 (±33.23)7.75 (±10.01)1.50 (±2.38)
Hydrozetes lacustris (Michael, 1882) 4800.000.000.000.25 (±0.50)
Hypochthonius rufulus C.L. Koch, 1835 67512.75 (±10.37)25.50 (±24.85)13.50 (±16.66)8.00 (±6.68)
Lagenobates lagenulus (Berlese, 1904) 3000.000.000.000.25 (±0.50)
Liebstadia humerata Sellnick, 1928 3450.25 (±0.50)0.25 (±0.50)0.000.00
Limnozetes ciliatus (Schrank, 1803) 3000.000.000.000.50 (±1.00)
Limnozetes rugosus (Sellnick, 1923) 3580.25 (±0.50)0.000.000.25 (±0.50)
Liochthonius alpestris (Forsslund, 1958) 19038.75 (±35.42)26.50 (±22.49)5.00 (±8.12)0.75 (±0.96)
Liochthonius neglectus Moritz, 1976 1940.50 (±1.00)0.000.001.50 (±1.91)
Liochthonius sp. 1820.50 (±1.00)0.25 (±0.50)0.000.00
Liochthonius strenzkei Forsslund, 1963 1854.25 (±7.85)12.50 (±25.00)1.50 (±3.00)0.25 (±0.50)
Malaconothrus monodactylus (Michael, 1888) MalMon41517.50 (±11.47)8.25 (±9.54)2.00 (±2.71)3.25 (±3.77)
Mortizoppia translamellata (Willmann, 1923) 29550.00 (±37.73)59.50 (±57.23)24.25 (±29.83)10.25 (±16.17)
Mucronothrus nasalis (Willmann, 1929) 6903.50 (±6.35)0.002.50 (±3.00)1.75 (±1.71)
Nanhermannia coronata Berlese, 1913 NanCor525821.25 (±310.76)491.75 (±275.73)267.00 (±175.38)270.75(±73.71)
Nothrus pratensis Sellnick, 1928NotPrt850189.75 a (±60.67)89.50 ab (±20.87)47.25 b (±34.06)39.00 b (±25.60)
Nothrus silvestris Nicolet, 1855 7600.25 (±0.50)0.25 (±0.50)0.000.00
Odontocepheus elongatus (Michael, 1879) 6550.000.50 (±0.58)0.50 (±0.58)0.00
Oppiella nova (Oudemanns, 1902) *OppNov270200.00 a (±82.25)99.00 ab (±14.31)70.50 ab (±35.05)46.00 b (±37.73)
Rhinoppia subpectinata (Oudemans, 1900) 3330.75 (±0.96)8.25 (±11.32)4.75 (±8.22)1.25 (±1.89)
Paleacarus hystricinus Trägårdh, 1932 3000.000.75 (±1.50)0.000.00
Phthiracarus boresetosus Jacot, 1930 7030.25 (±0.50)0.25 (±0.50)0.000.00
Phthiracarus clavatus Parry, 1979 9650.25 (±0.50)0.25 (±0.50)0.002.00 (±4.00)
Phthiracarus italicus (Oudemans, 1900) 8950.000.000.25 (±0.50)0.00
Platynothrus peltifer (C.L. Koch, 1839) * PltPel87545.25 (±48.46)8.50 (±11.93)2.50 (±2.52)1.75 (±2.36)
Quadroppia maritalis Lions, 1982QuaMar1900.25 a (±0.50)50.50 ab (±45.21)115.25 b (±114.60)18.75 ab (±8.26)
Rhysotritia ardua (C.L. Koch, 1841) 8183.25 (±4.57)1.50 (±2.38)3.00 (±3.56)2.75 (±3.20)
Rhysotritia duplicata Grandjean, 1953) 8760.25 (±0.50)0.50 (±1.00)0.000.00
Scheloribates laevigatus (C.L. Koch, 1835) * 5951.25 (±2.50)3.50 (±4.36)0.50 (±1.00)0.00
Steganacarus magnus (Nicolet, 1855) 13801.25 (±1.89)0.75 (±0.50)1.25 (±2.50)1.00 (±0.82)
Suctobelbella acutidens (Forsslund, 1941) SucAct2080.008.50 (±7.94)0.000.00
Suctobelbella arcana Moritz, 1970 20347.50 (±33.36)25.50 (±20.07)7.50 (±6.45)5.00 (±4.24)
Suctobelbella falcata (Forsslund, 1941) 2400.50 (±1.00)0.001.50 (±2.38)0.00
Suctobelbella forsslundi (Strenzke, 1950) 2080.003.50 (±4.12)0.25 (±0.50)2.00 (±2.31)
Suctobelbella latirostris (Strenzke, 1950) 2450.25 (±0.50)0.000.000.00
Suctobelbella longirostris (Forsslund, 1941) 3001.50 (±1.73)7.25 (±8.38)13.25 (±12.71)5.25 (±6.40)
Tectocepheus velatus (Michael, 1880)TecVel300266.50 a (±211.42)37.50 ab (±29.03)13.50 ab (±9.26)10.50 b (±11.03)
Tyrphonothrus foveolatus (Willmann, 1931) 4100.000.001.00 (±2.00)0.25 (±0.50)
Tyrphonothrus maior (Berlese, 1910) 5680.000.000.000.25 (±0.50)
Malaconothrus vietsi (Willmann, 1925) 3350.25 (±0.50)0.000.000.00
S 48383735
Hs 1.9662.1492.1161.768
Disclaimer/Publisher’s Note: The statements, opinions and data contained in all publications are solely those of the individual author(s) and contributor(s) and not of MDPI and/or the editor(s). MDPI and/or the editor(s) disclaim responsibility for any injury to people or property resulting from any ideas, methods, instructions or products referred to in the content.