Abstract
We aimed to clarify the nutrient allocation strategies of Cunninghamia lanceolata (CL) and Schima superba (SS) and their differences in N uptake and utilization under acidic stress and heterogeneous allocation of N. One-year-old seedlings of CL and SS were cultured in sands with three pH levels (pH rate 4.5, 5.5, and 6.5) and five different N form ratios (NH4+-N to NO3−-N ratios 10:0, 7:3, 5:5, 3:7, and 0:10) in the greenhouse. The C, N, and P contents and C:N:P stoichiometry in leaves, total biomass, and NH4+-N and NO3−-N contents in the cultivation substrate were analyzed after 160 days. At the pH rate of 4.5, the N contents of CL and SS significantly decreased. However, the N contents of SS increased at the pH rate of 5.5. At the pH rate of 5.5, the N content of CL and SS increased under the cultivation substrate, with ratios of 10:0 and 7:3, and 3:7 and 0:10, respectively. The N content of CL was significantly positively correlated with its P content. The C:P ratios of CL and SS were significantly positively correlated with their C:N ratios and N:P ratios. Under the same treatment, the differences in C:N:P stoichiometry were more significant between CL and SS at the pH rate of 5.5. The NH4+-N content of the cultivation substrate in CL and SS was higher than the NO3−-N content. At the ratio of 7:3, the C:N stoichiometric ratio of CL and C:N:P stoichiometric ratio of SS were negatively correlated with total biomass. At the pH rate of 5.5, cultivation environments with high NH4+-N and NO3−-N amount respectively increased the N content of CL and SS. The CL is susceptible to N limitation, and SS is susceptible to N and P limitation.
1. Introduction
In contemporary agroforestry practices, the overreliance on nitrogen (N) and acidic fertilizers has exacerbated the pervasive issue of soil acidification within subtropical regions [1,2]. Numerous studies have substantiated the premise that soil acidification precipitates a decrease in soil fertility, thereby exerting deleterious effects on the physiological processes governing plant growth and development [3]. Furthermore, soil pH variations and N heterogeneity influence not only morphological alterations but also the efficiency and accessibility of N, thereby crucially impacting the capacity of plants to uptake and assimilate N [4]. N is indispensable for various aspects of plant physiology, including growth, development, metabolism, and environmental adaptation [5]. Within the plant system, plants take up and assimilate two principal forms of N, namely, ammonium N (NH4+-N) and nitrate N (NO3−-N), which are distinct in terms of their absorption and utilization [6]. Microorganisms and environmental factors play pivotal roles in the transformation of various N forms, whereas the uptake and assimilation of N are influenced by both genetic factors within plants and soil pH [7]. Consequently, plant physiologists and those studying N nutrient utilization have devoted considerable attention to investigating the scientific and rational application of N and its formulated fertilizers, aiming to effectively enhance soil N utilization efficiency and foster plant growth and development [8,9]. Thus, simulating diverse soil pH levels and ratios of NH4+-N to NO3−-N in cultivation environments can provide a theoretical basis for discerning the optimal soil pH and N nutrient conditions conducive to plant growth, and this method can be used to investigate plant nutrient utilization efficiency.
Plant ecological chemometrics involves studying the chemical elements integral to ecological processes, with a specific focus on the stoichiometry of these elements within plant organs and their intricate relationships with environmental factors and ecosystem functionalities [10]. For instance, the addition of N typically enhances soil N availability, consequently elevating the N content and altering the N:phosphorus (P) ratio within plant organs [11]. Among the elemental constituents, carbon (C), N, and P stand out as pivotal components of ecosystem dynamics [12]. Their contents and stoichiometric ratios have garnered considerable research attention due to their fundamental roles [13,14]. C:N and C:P ratios serve as indicators of a plant’s capacity for C acquisition [15], growth dynamics [16], and N and P assimilation efficiency [11], and the N:P ratio signifies the nutrient limitation status of an ecosystem. Elevated C:P and N:P ratios commonly suggest potential P limitations for plants [17]. Additionally, a low C:N ratio typically favors plants with rapid growth rates, as N serves as a vital constituent in protein synthesis and is crucial for growth. Indicators such as low C:P ratios, high C:N ratios, and low N:P ratios often imply potential N limitation for plants [18]. Leaves, which are the primary organs for photosynthesis and nutrient processing in plants, exhibit greater metabolic activity and nutrient demand than roots and stems, rendering them particularly responsive to alterations in soil nutrient availability [19]. Recent research endeavors have explored the repercussions of varying soil pH levels or ratios of NH4+-N to NO3−-N on plant stoichiometry [20,21]. However, some questions remain unanswered about the impact of soil acidification and heterogeneous N distribution on nutrient uptake efficiency in plants. For example, how do forest trees adapt to acidic cultivation environments?
Cunninghamia lanceolata (CL) is the predominant silvicultural species in the subtropical region of China. Nevertheless, the prevalent use of continuous multigenerational and uniform planting methods has led to a decline in soil fertility, a decrease in forest yield, and compromised ecological functionality, thus significantly impeding sustainable management and development. To address these concerns, hybridization between Schima superba (SS) and CL has been undertaken to establish mixed conifer–broadleaf forest stands. Both CL and SS are important timber species in the southern region. However, owing to their genetic and physiological disparities, they exhibit distinct responses to soil nutrient elements, particularly in terms of soil N morphology and content [22].
At present, the research on these two tree species predominantly focuses on their growth or physiological characteristics in varied pH environments or under differing NH4+-N to NO3−-N ratios [23]. Nevertheless, there is a dearth of reported studies investigating the discrepancies in the C:N:P stoichiometry of the two tree species across environments featuring divergent soil pH and NH4+-N to NO3−-N ratios. Thus, in this study we explored discrepancies in C:N:P stoichiometry within the leaves of a primary subtropical conifer specie (CL) and a broadleaf tree specie (SS) under different pH levels and NH4+-N to NO3−-N ratios in the cultivation substrate. We aimed to elucidate discrepancies in the responses of the two tree species to environments characterized by weak acid stress and heterogeneous N distributions in the soil. Additionally, we sought to provide a scientific rationale for the selection of optimal soil pH and N conditions for the cultivation of CL and SS seedlings while also contributing to a foundational understanding of the management of N nutrients in seedlings of these two tree species.
2. Materials and Methods
2.1. Experimental Materials
The study was conducted in the experimental greenhouse of Fujian Agriculture and Forestry University (119°24′ E, 26°08′ N 50 m altitude). The greenhouse has excellent light transmission and aeration. We utilized one-year-old live CL and SS seedlings obtained from Wuyi State Forestry in Zhangping as test materials for this study. The average seedling height of CL was 23.50 ± 3.1 cm, with an average ground diameter of 4.45 ± 0.51 mm. The average seedling height of SS was 16.65 ± 2.07 cm, with an average ground diameter of 2.93 ± 0.44 mm. The seedlings were planted by removing the substrate bag and washing the roots with distilled water. Then, the plants were planted in washed river sand pots with dimensions of 26 cm × 28 cm (inner diameter × height). All pots were equipped with water leakage ports at the bottom. During the seedling restoration period, the water and nutrients in each potted plant were uniformly managed, and the plants were allowed to rest for 20 days. The experiment was carried out in the experimental greenhouse of Fujian Agriculture and Forestry University in mid-April 2021. After 160 days of experimental treatment with different pH and N form ratios, various samples were collected in October 2021.
2.2. Experimental Design
We examined the pH of the sand cultivation substrate at three different levels: pH 4.5, pH 5.5, and pH 6.5. The pots were filled with approximately 2.3 kg of washed river sand. The pH of the cultivation substrate was adjusted by adding varying amounts of H2SO4 solution at equal concentrations (2 mol L−1). The pH was measured using a soil pH meter (Intelligent Digital pH Special Speed Tester, model ZD-18) 0.5 h later. The pH of the cultivation substrate was then adjusted in the same manner until the desired pH value was reached, as specified in the experimental design. Simultaneously, we used five different ratios of NH4+-N and NO3−N, supplied as 10:0, 7:3, 5:5, 3:7, and 0:10. NH4+-N was supplied as (NH4)2SO4, whereas NO3−-N was supplied as NaNO3. The nutrient solution for each treatment had the same concentrations of macronutrients (Hoagland formula) and micronutrients (Amon formula), except for the varying concentration ratios of NH4+-N and NO3−-N. The nutrient solution’s total N concentration was set at 2 mmol L−1, and the pH was adjusted to approximately 5.8 using HCl and NaOH. Additionally, 7 μmol L−1 C2H4N4 was added to prevent NH4+ nitrification [24]. To ensure concentrations of Na+ in the nutrient solution of each treatment, adjustments were made with NaCl, given that NaNO3 was used as the NO3−-N source in this experiment, which could affect the concentration of Na+.
The experimental design comprised 15 treatments with 6 replicates per treatment, totaling 180 test seedlings (90 each for CL and SS). The seedlings received 50 mL of nutrient solution every 8 days and 50–100 mL of water every 2 to 3 days. The pH of the cultivation substrate was measured every 5 days using a pH meter. If the pH deviated from the threshold value set for each treatment, H2SO4 solution was added to adjust the pH to the threshold value of the experimental design.
2.3. Plant Harvesting and Data Collection
All the seedlings were harvested after 160 days of cultivation. The plants were separated into three parts: roots, stems, and leaves. The samples were oven-dried at 105 °C for half an hour to deactivate the enzymes, and then at 65 °C to a constant weight. The total biomass of the plants (TB, g tree−1) was the sum of the root, stem, and leaf biomass in each treatment.
The leaf samples of the dried plants were ground into a fine powder using a grinder. The resulting powder was then sieved through a fine sieve with a pore size of 0.149 mm. The sieved samples were stored in self-sealing bags for the determination of nutrient contents, specifically C, N, and P. C and N were analyzed using an Elementar Vario Macro Cube, a fully automated elemental analyzer (Germany). P was analyzed using an inductively coupled plasma emission spectrometer, the PE OPTIMA 8000 (USA).
For each treatment, the optical density (OD) values of the NH4+-N and NO3−-N (mg kg−1) in the cultivation substrate were determined by the auto-discrete chemical analyzer.
2.4. Data Analysis
All data were processed and analyzed using Excel 2019 (Microsoft Office, Washington, Redmond, WA, USA). Statistical analyses were conducted using SPSS 25.0 for Windows (SPSS Inc., Chicago, IL, USA). A one-way ANOVA test was conducted to evaluate the effect of substrate pH or N form ratio on the C:N:P stoichiometry of the two tree species, NH4+-N content, and NO3−-N content in the cultivation substrate. A two-way ANOVA test was performed on the effects of cultivation substrate pH and N form ratio on the C:N:P stoichiometry of leaves. Independent sample t tests were used to analyze differences between two species in the same treatment. Pearson correlation analysis was used to examine the relationships between the C:N:P stoichiometry in the leaves of both species. A linear fit was used to analyze the TB and C:N:P ratio of the two species. Plots were created using Origin 2021 (Origin Lab, Northampton, MA, USA).
3. Results
3.1. Effects of Cultivation Substrate pH and N Form Ratio on the C, N, and P Contents in Leaves of CL and SS Seedlings
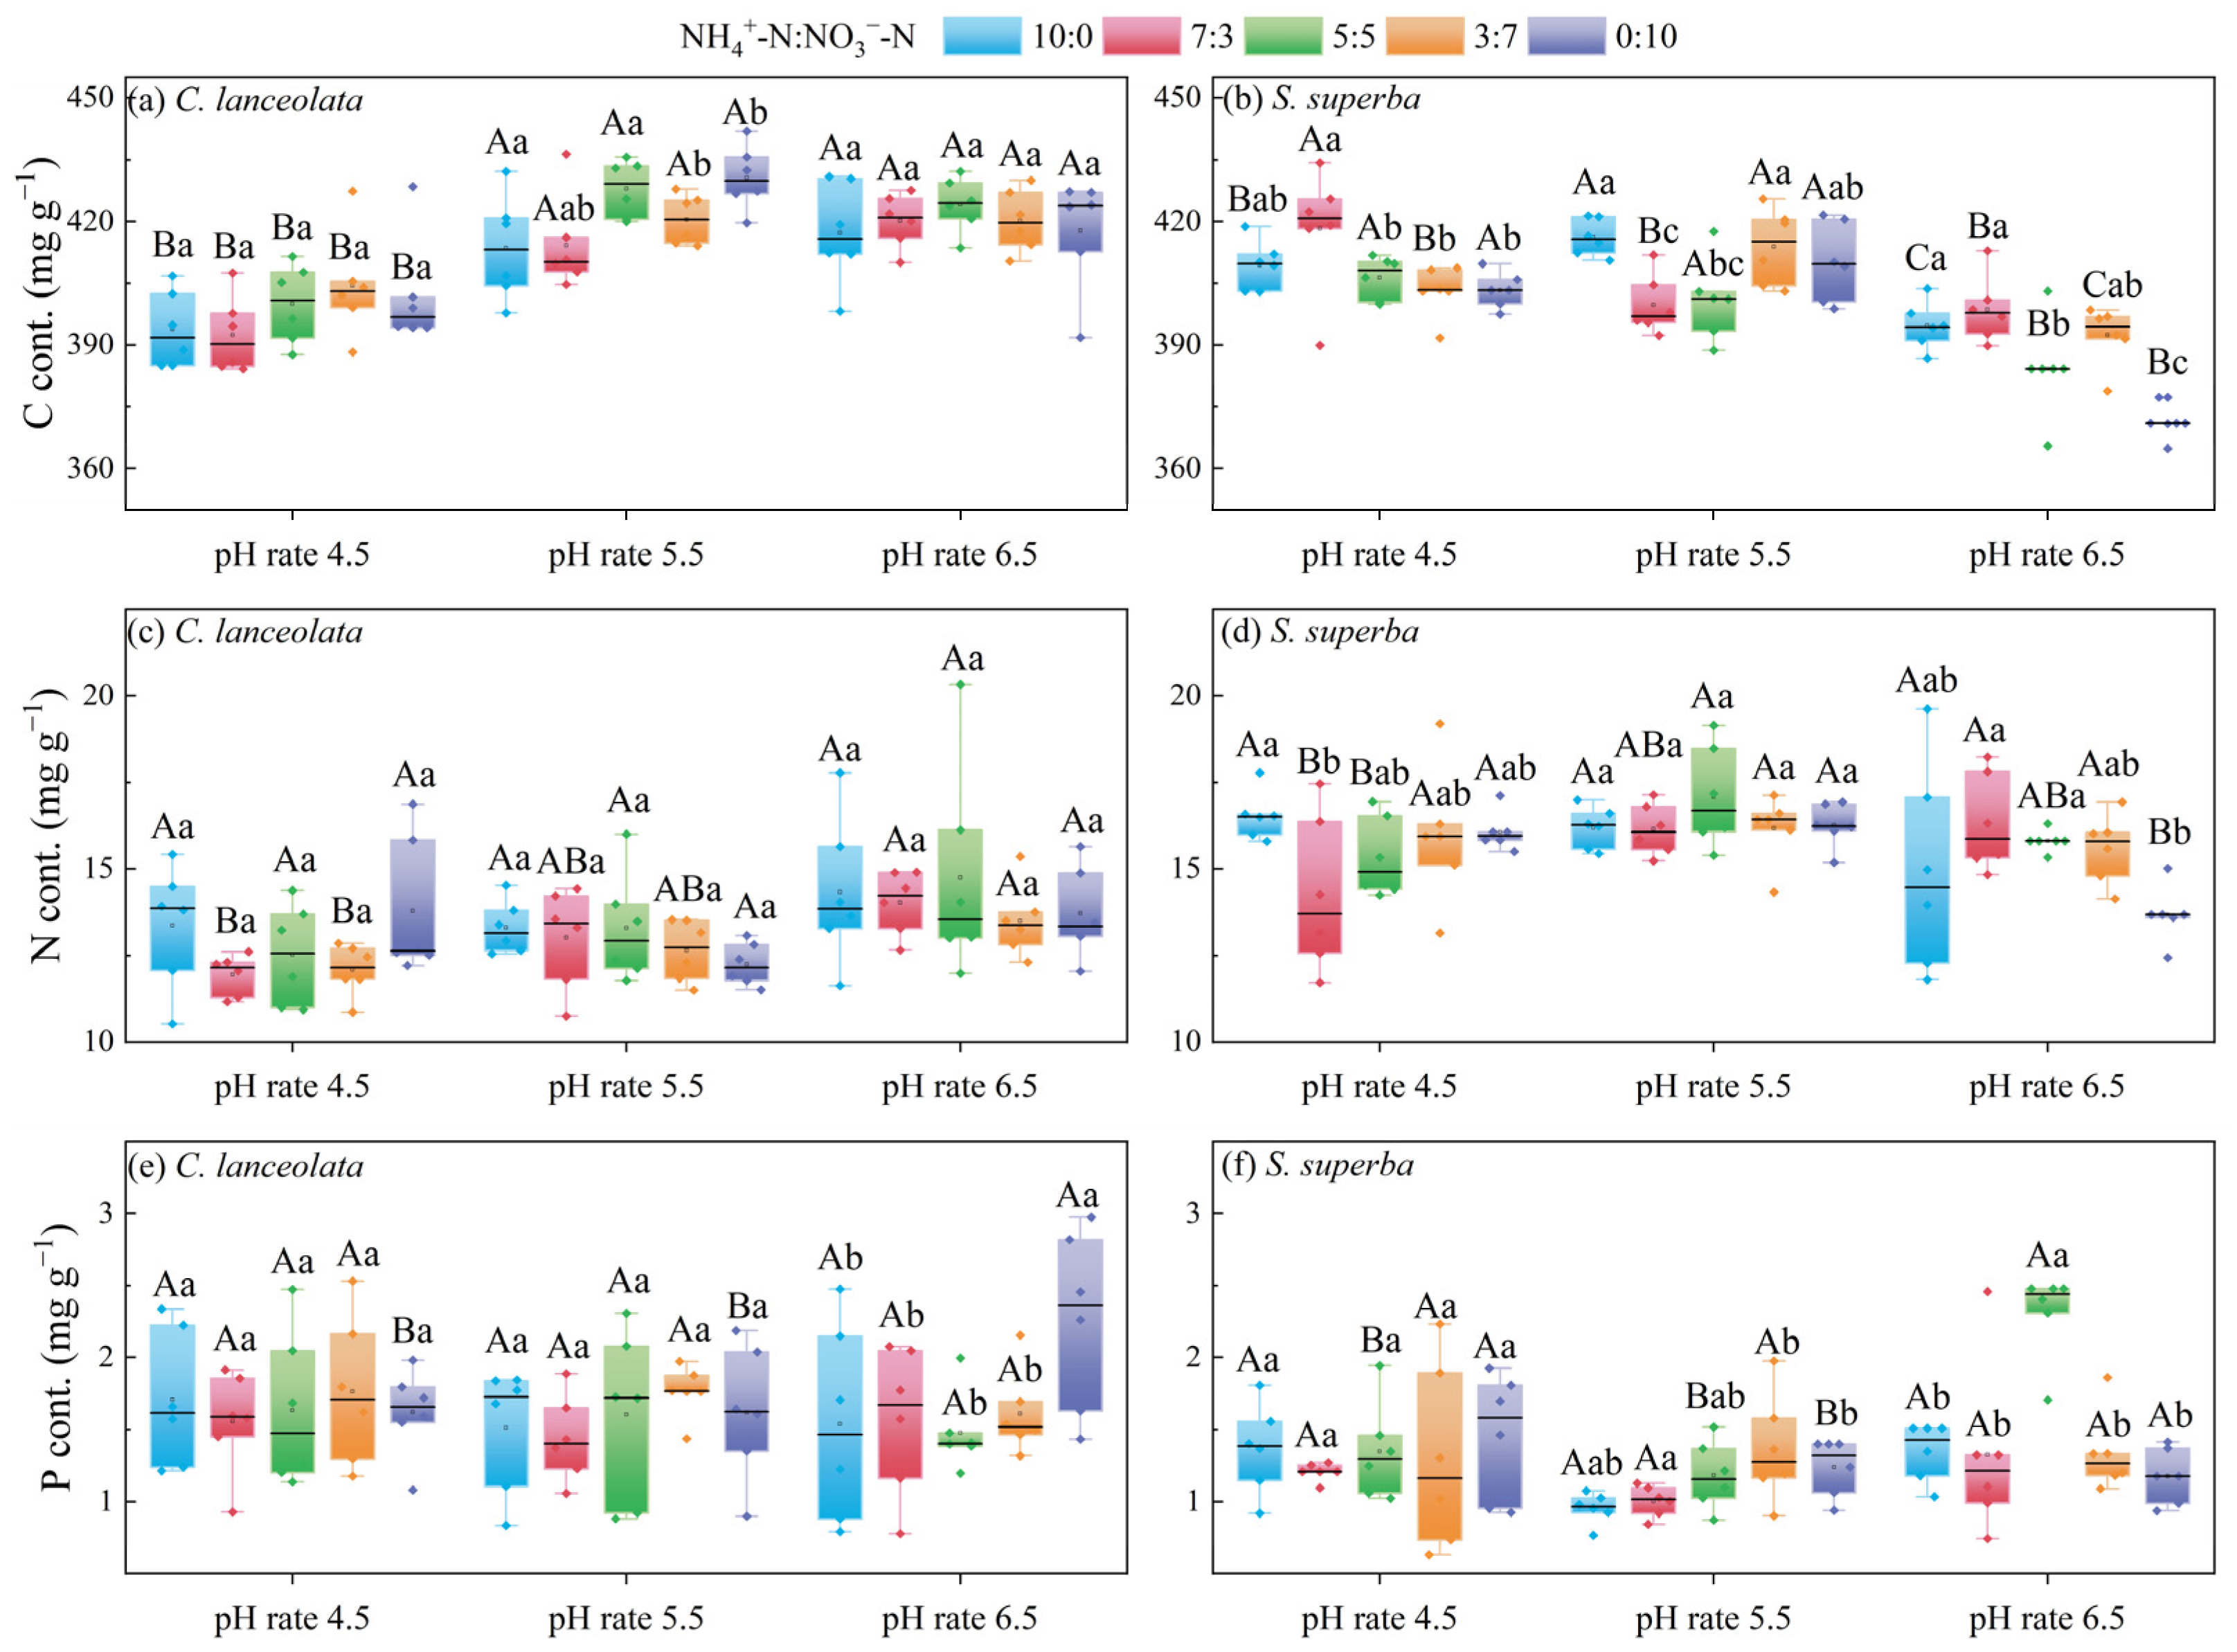
Table 1 shows that the pH of the cultivation substrate had a significant effect on the C and N contents of CL (p < 0.01), as well as on the C, N, and P contents of SS. The N form ratio of the cultivation substrate significantly affected the C content of CL (p < 0.05) and had a highly significant effect on the C and P contents of SS. The pH and N form ratio of the cultivation substrate did not interact with the C, N, or P content in CL. However, there was a significant interaction effect on the C, N, and P contents in SS.

Table 1.
Two-way ANOVA of the effects of cultivation substrate pH and N form ratio on the C, N, and P contents in leaves of CL and SS.
For the CL, the treatment with pH 4.5 exhibited significantly lower C contents than those of the other two pH levels (Figure 1a). For the ratio of 7:3 and 3:7, the N content was significantly different at the three pH levels (Figure 1c). For the ratio of 0:10, the P content was significantly different at the three pH levels and the N form ratios. Under the pH 6.5, the P content of ratio 0:10 was significantly higher than that of other ratios (Figure 1e).
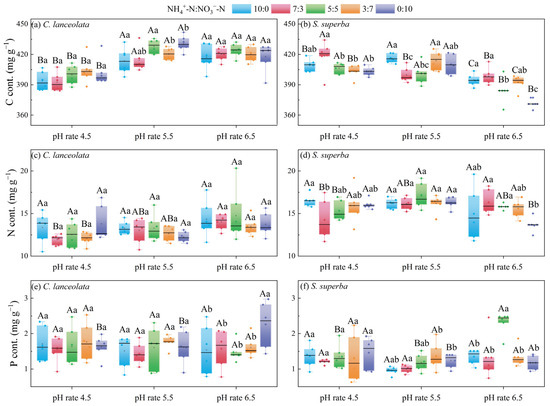
Figure 1.
Effects of cultivation substrate pH and N form ratio on the C, N, and P contents in leaves of CL and SS. Different uppercase letters indicate significant differences among different pH levels under the same N form ratio, while lowercase letters indicate significant differences among treatments under different N form ratios at the same pH level (p < 0.05).
For the SS, the C content was significantly lower at pH 6.5 than at the other two pH levels (Figure 1b). The N content was significantly different among ratios at pH 4.5 and 6.5 (Figure 1d). For the ratio of 5:5 and 0:10, there were significant differences in the P content among the three pH levels (Figure 1f).
3.2. Effects of Cultivation Substrate pH and N Form Ratio on the C:N:P Stoichiometry in Leaves of CL and SS Seedlings
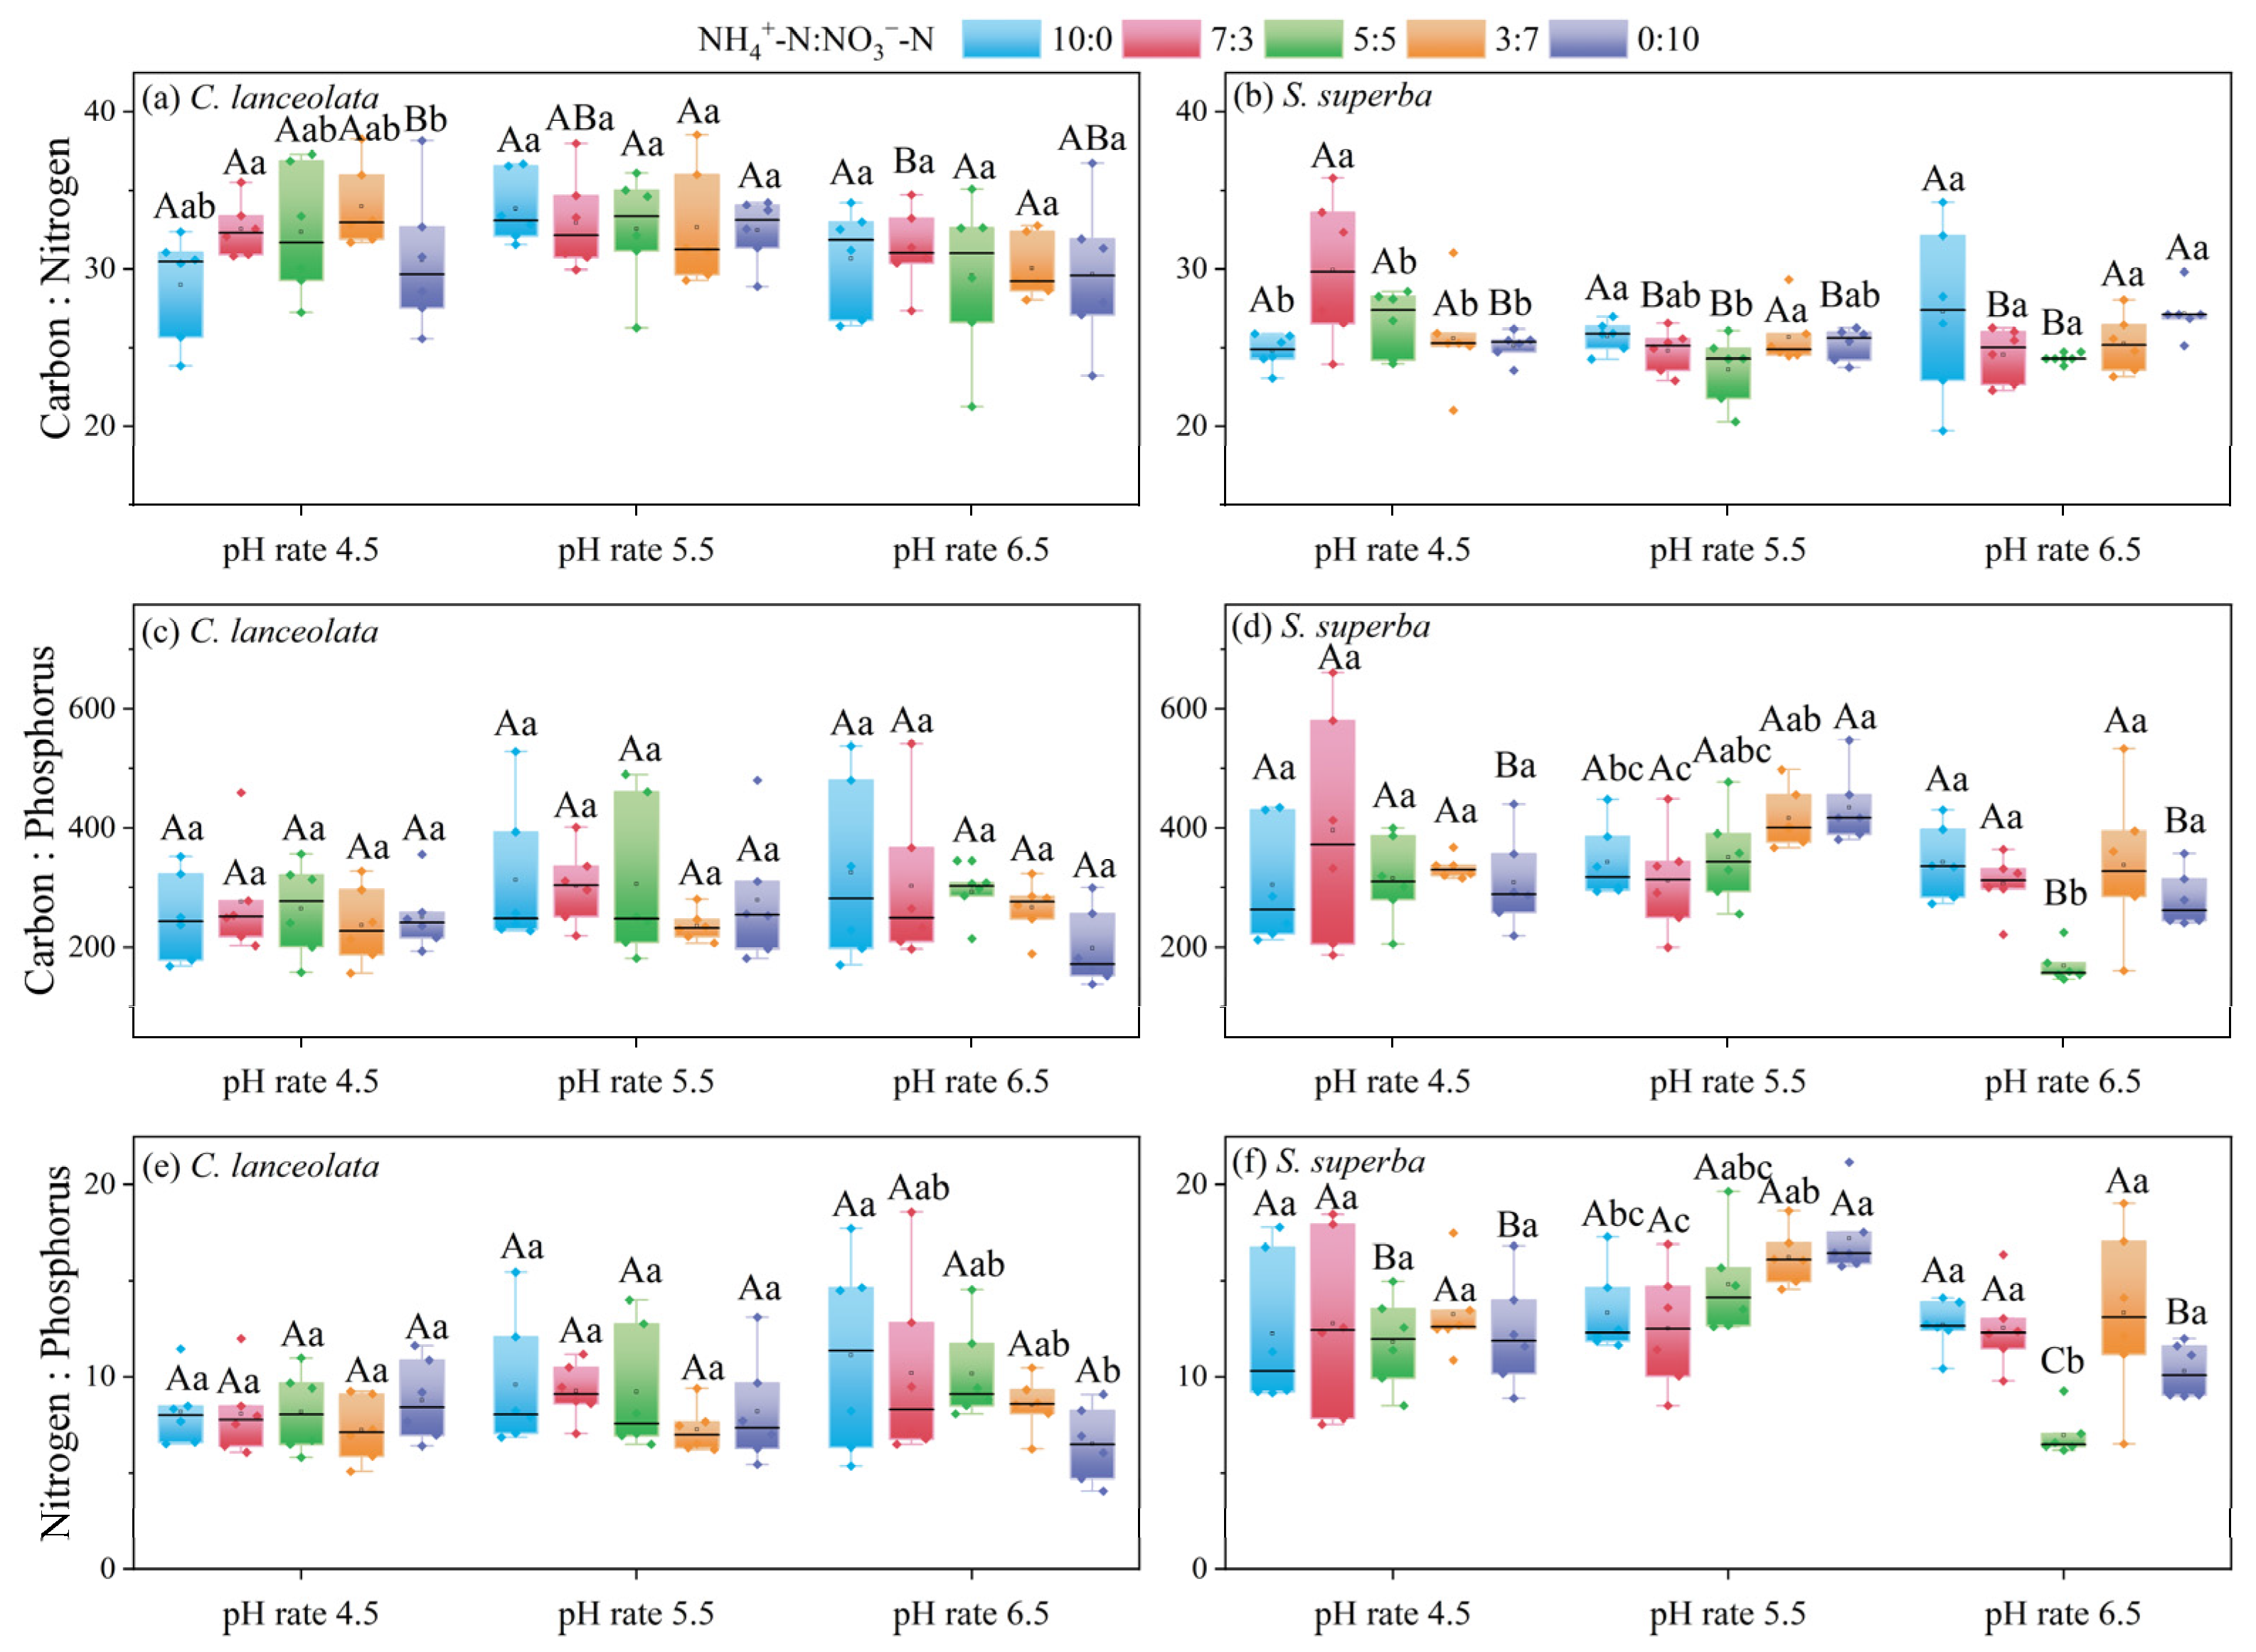
Table 2 shows that the pH of the cultivation substrate had a significant effect on the C:N ratio of CL (p < 0.05), and a highly significant effect on the C:P ratio and N:P ratio of SS (p < 0.01). The N form ratio had a significant effect on the N:P ratio of SS. The C:N:P stoichiometry of CL was not affected by the interaction between pH and N form ratio, but both factors had significant effects on the C:N:P stoichiometry of SS.
Table 2.
Two-way ANOVA of the effects of the cultivation substrate pH and N form ratio on the C:N:P stoichiometry in leaves of CL and SS.
For the CL, there were significant differences in the C:N ratio among N form ratios at pH 4.5 (Figure 2a). There was a general decrease in the C:P ratio and N:P ratio with increasing NO3−-N amount and decreasing NH4+-N amount at pH 6.5. Additionally, there was no significant difference in the C:P ratio and N:P ratio among the different N forms at pH 4.5 and 5.5 (Figure 2c,e).
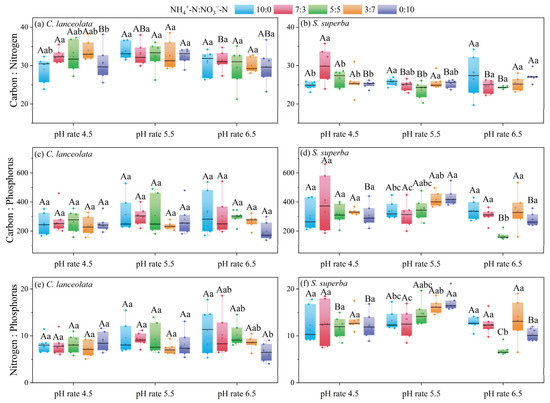
Figure 2.
Effects of the cultivation substrate pH and N form ratio on the C:N:P stoichiometric ratios in leaves of CL and SS. Different uppercase letters indicate significant differences between different pH levels under the same N form ratio, while lowercase letters indicate significant differences between treatments under different N form ratios at the same pH level (p < 0.05).
3.3. Differences in C, N, and P Content between CL and SS Leaves under the Same Cultivation Substrate pH and N form Ratio
The differences in C, N, and P content were more significant between CL and SS at pH 5.5 than at pH 4.5 and pH 6.5. There were significant differences in C content between CL and SS at pH 4.5 for the ratio of 3:7. Additionally, there was a significant difference in the C content at pH 5.5 for ratios of 10:0, 7:3, and 5:5. Finally, at pH 6.5, there was significant difference in the C content at the ratios of 7:3, 5:5, 3:7, and 0:10.
The N content differed significantly between CL and SS at pH 4.5 for ratios of 10:0, 5:5, 3:7, and 0:10. Significant differences were found for all five ratios at pH 5.5. Highly significant differences were also found for the ratios of 7:3 and 3:7 at pH 6.5.
There were significant differences in P content between CL and SS at pH 4.5 for the ratio of 3:7. There were significant differences at pH 5.5 for ratios of 3:7 and 0:10. There were significant differences at pH 6.5 for ratios of 5:5 and 0:10 (Table 3).
Table 3.
The C, N, and P content in leaves of CL and SS under the same cultivation substrate pH and N form ratio.
3.4. Differences in C:N:P Stoichiometry between CL and SS Leaves under the Same Cultivation Substrate pH and N Form Ratio
The C:N ratio did significantly differ between CL and SS for the ratios of 10:0, 5:5, 3:7, and 0:10 at pH 4.5, and all five ratios showed highly significant differences between CL and SS at pH 5.5. The ratio of 7:3, 5:5, and 3:7 were significantly different at pH 6.5.
A ratio of 3:7 at pH 4.5 resulted in significant differences in the C:P ratio between CL and SS. At pH 5.5, the 3:7 ratio was significantly different from the 0:10 ratio. At pH 6.5, the ratio of 5:5 was significantly different from the 0:10 ratio.
The N:P ratios between CL and SS were significantly different for all five ratios at pH 5.5. At pH 4.5 and pH 6.5, the ratios of 5:5, 3:7, and 0:10 were significantly different (Table 4).
Table 4.
The difference in C:N:P stoichiometry in leaves of CL and SS under the same cultivation substrate pH and N form ratio.
3.5. The Correlation among the C, N, and P Content and the Stoichiometry in Leaves of CL and SS
C content of CL and SS were significantly positively correlated with C:P ratio and N:P ratio (p < 0.01). For the CL, N:P ratio was correlated with C:P ratio, N content, and C content and was positively correlated with C:P ratio and C content (p < 0.01). For the SS, the N content was significantly positively correlated with the P content (p < 0.05), and the N:P ratio was significantly positively correlated with the C content and C:P ratio (p < 0.01) (Figure 3a,b).
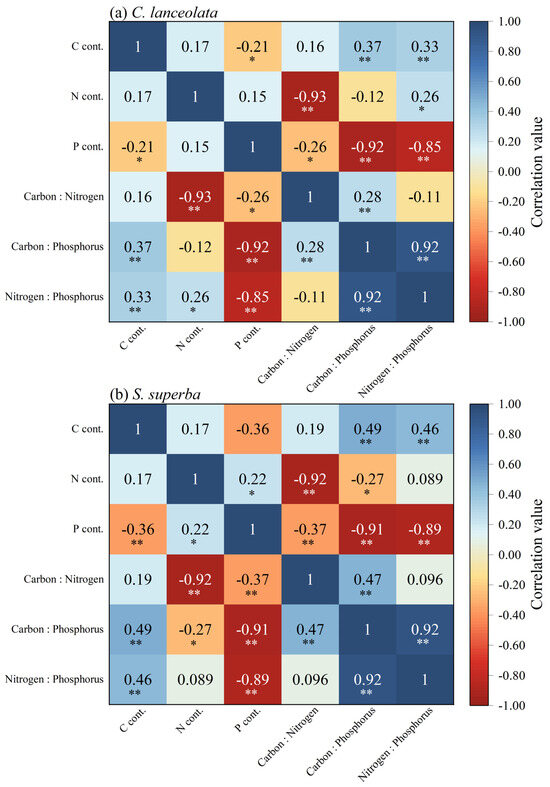
Figure 3.
The correlation among C, N, and P content and C:N:P stoichiometric ratios in leaves of CL and SS. Blue represents positive correlation and red represents negative correlation. The darker the color, the more important the correlation. *, p < 0.05; **, p < 0.01.
3.6. Response of Biomass of CL and SS to C:N:P Stoichiometric Ratios in Leaves
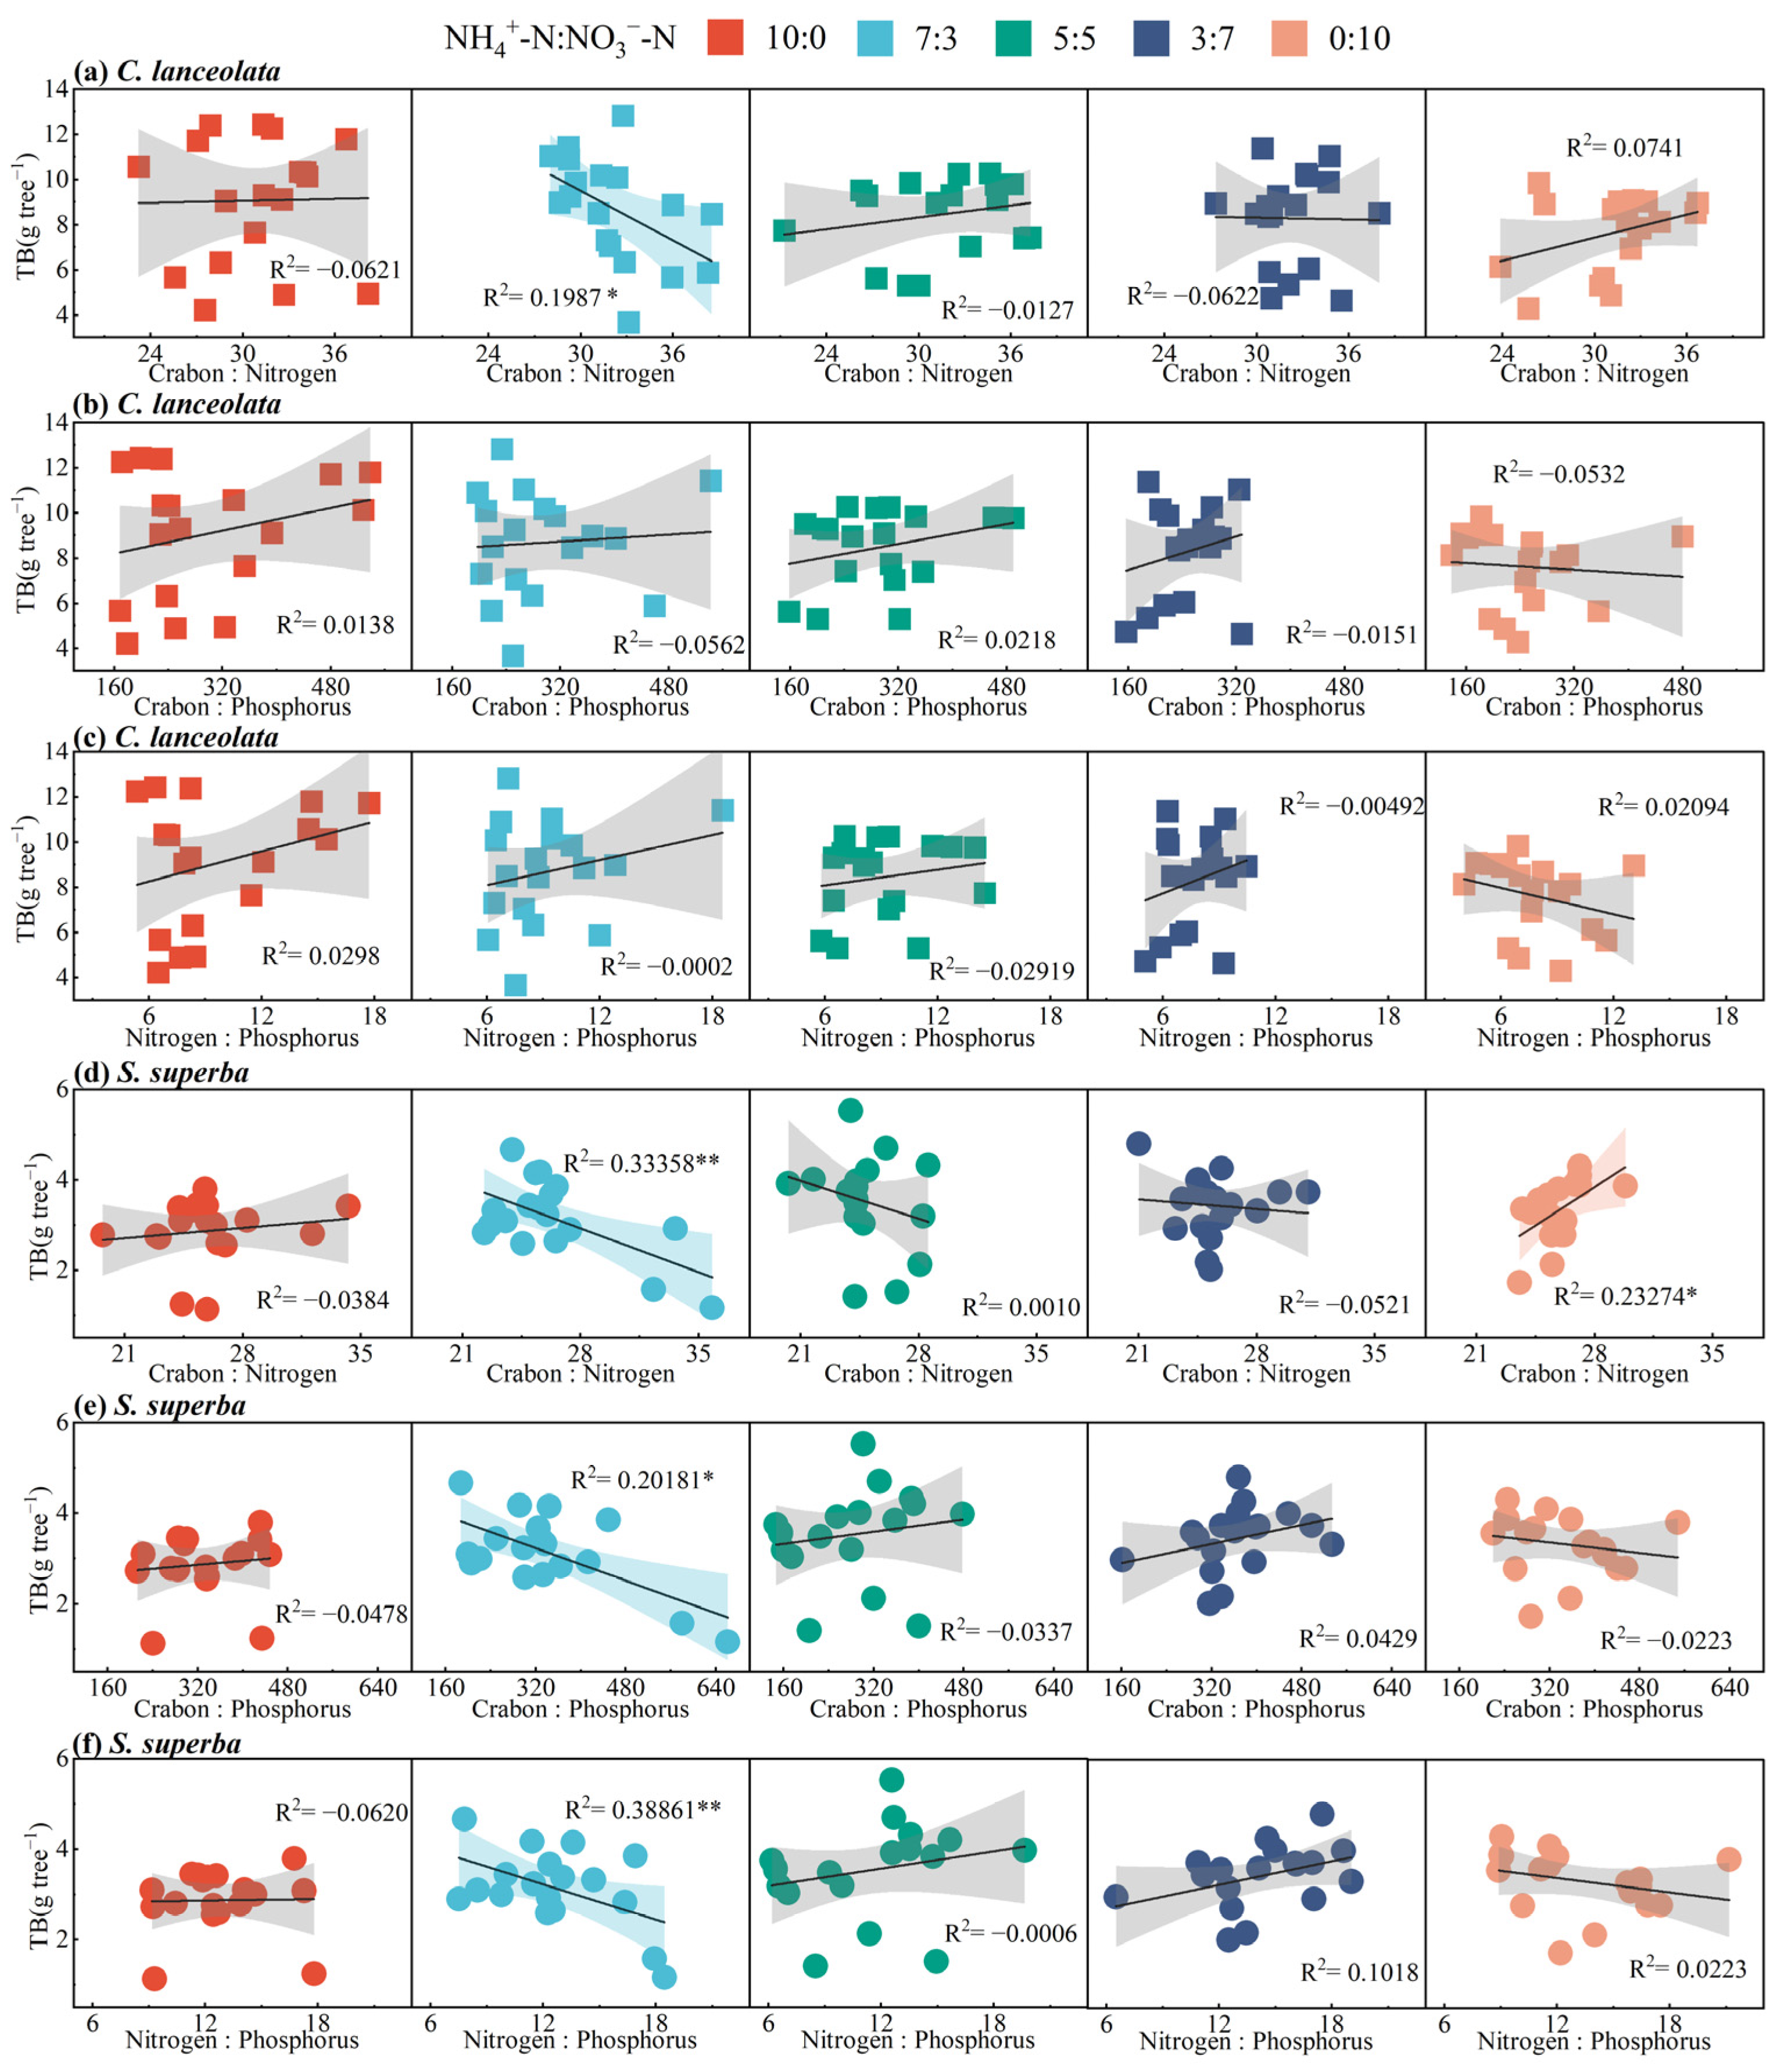
The total biomass (TB) of SS fit their C:N:P stoichiometric ratios better than CL. At the ratio of 7:3, the TB was negatively correlated with the C:N stoichiometric ratio of CL and the C:N:P stoichiometric ratios of SS (Figure 4a,d–f). However, the TB was positively correlated with C:N stoichiometric ratio at the ratio of 0:10 (Figure 4d). There was no significant fitting relationship between TB and the C:P and N:P stoichiometric ratios of CL (Figure 4b,c).
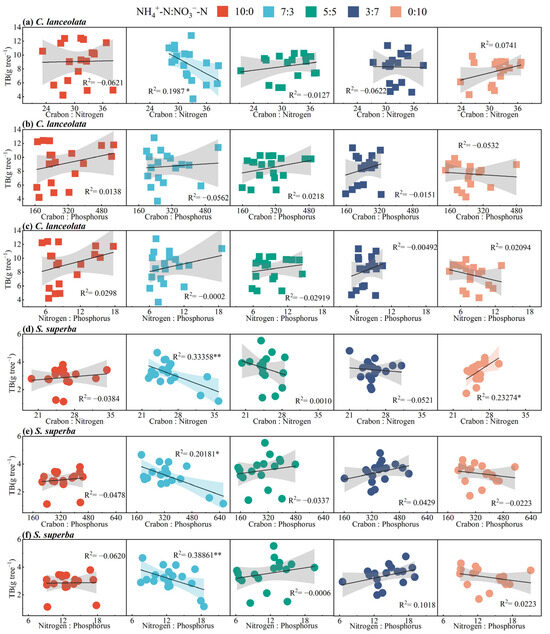
Figure 4.
Relationships of C:N:P stoichiometric ratios in leaves with total biomass of CL and SS under the different ammonium-to-nitrate nitrogen ratios. Total biomass of seedlings is expressed by TB. *, p < 0.05; **, p < 0.01.
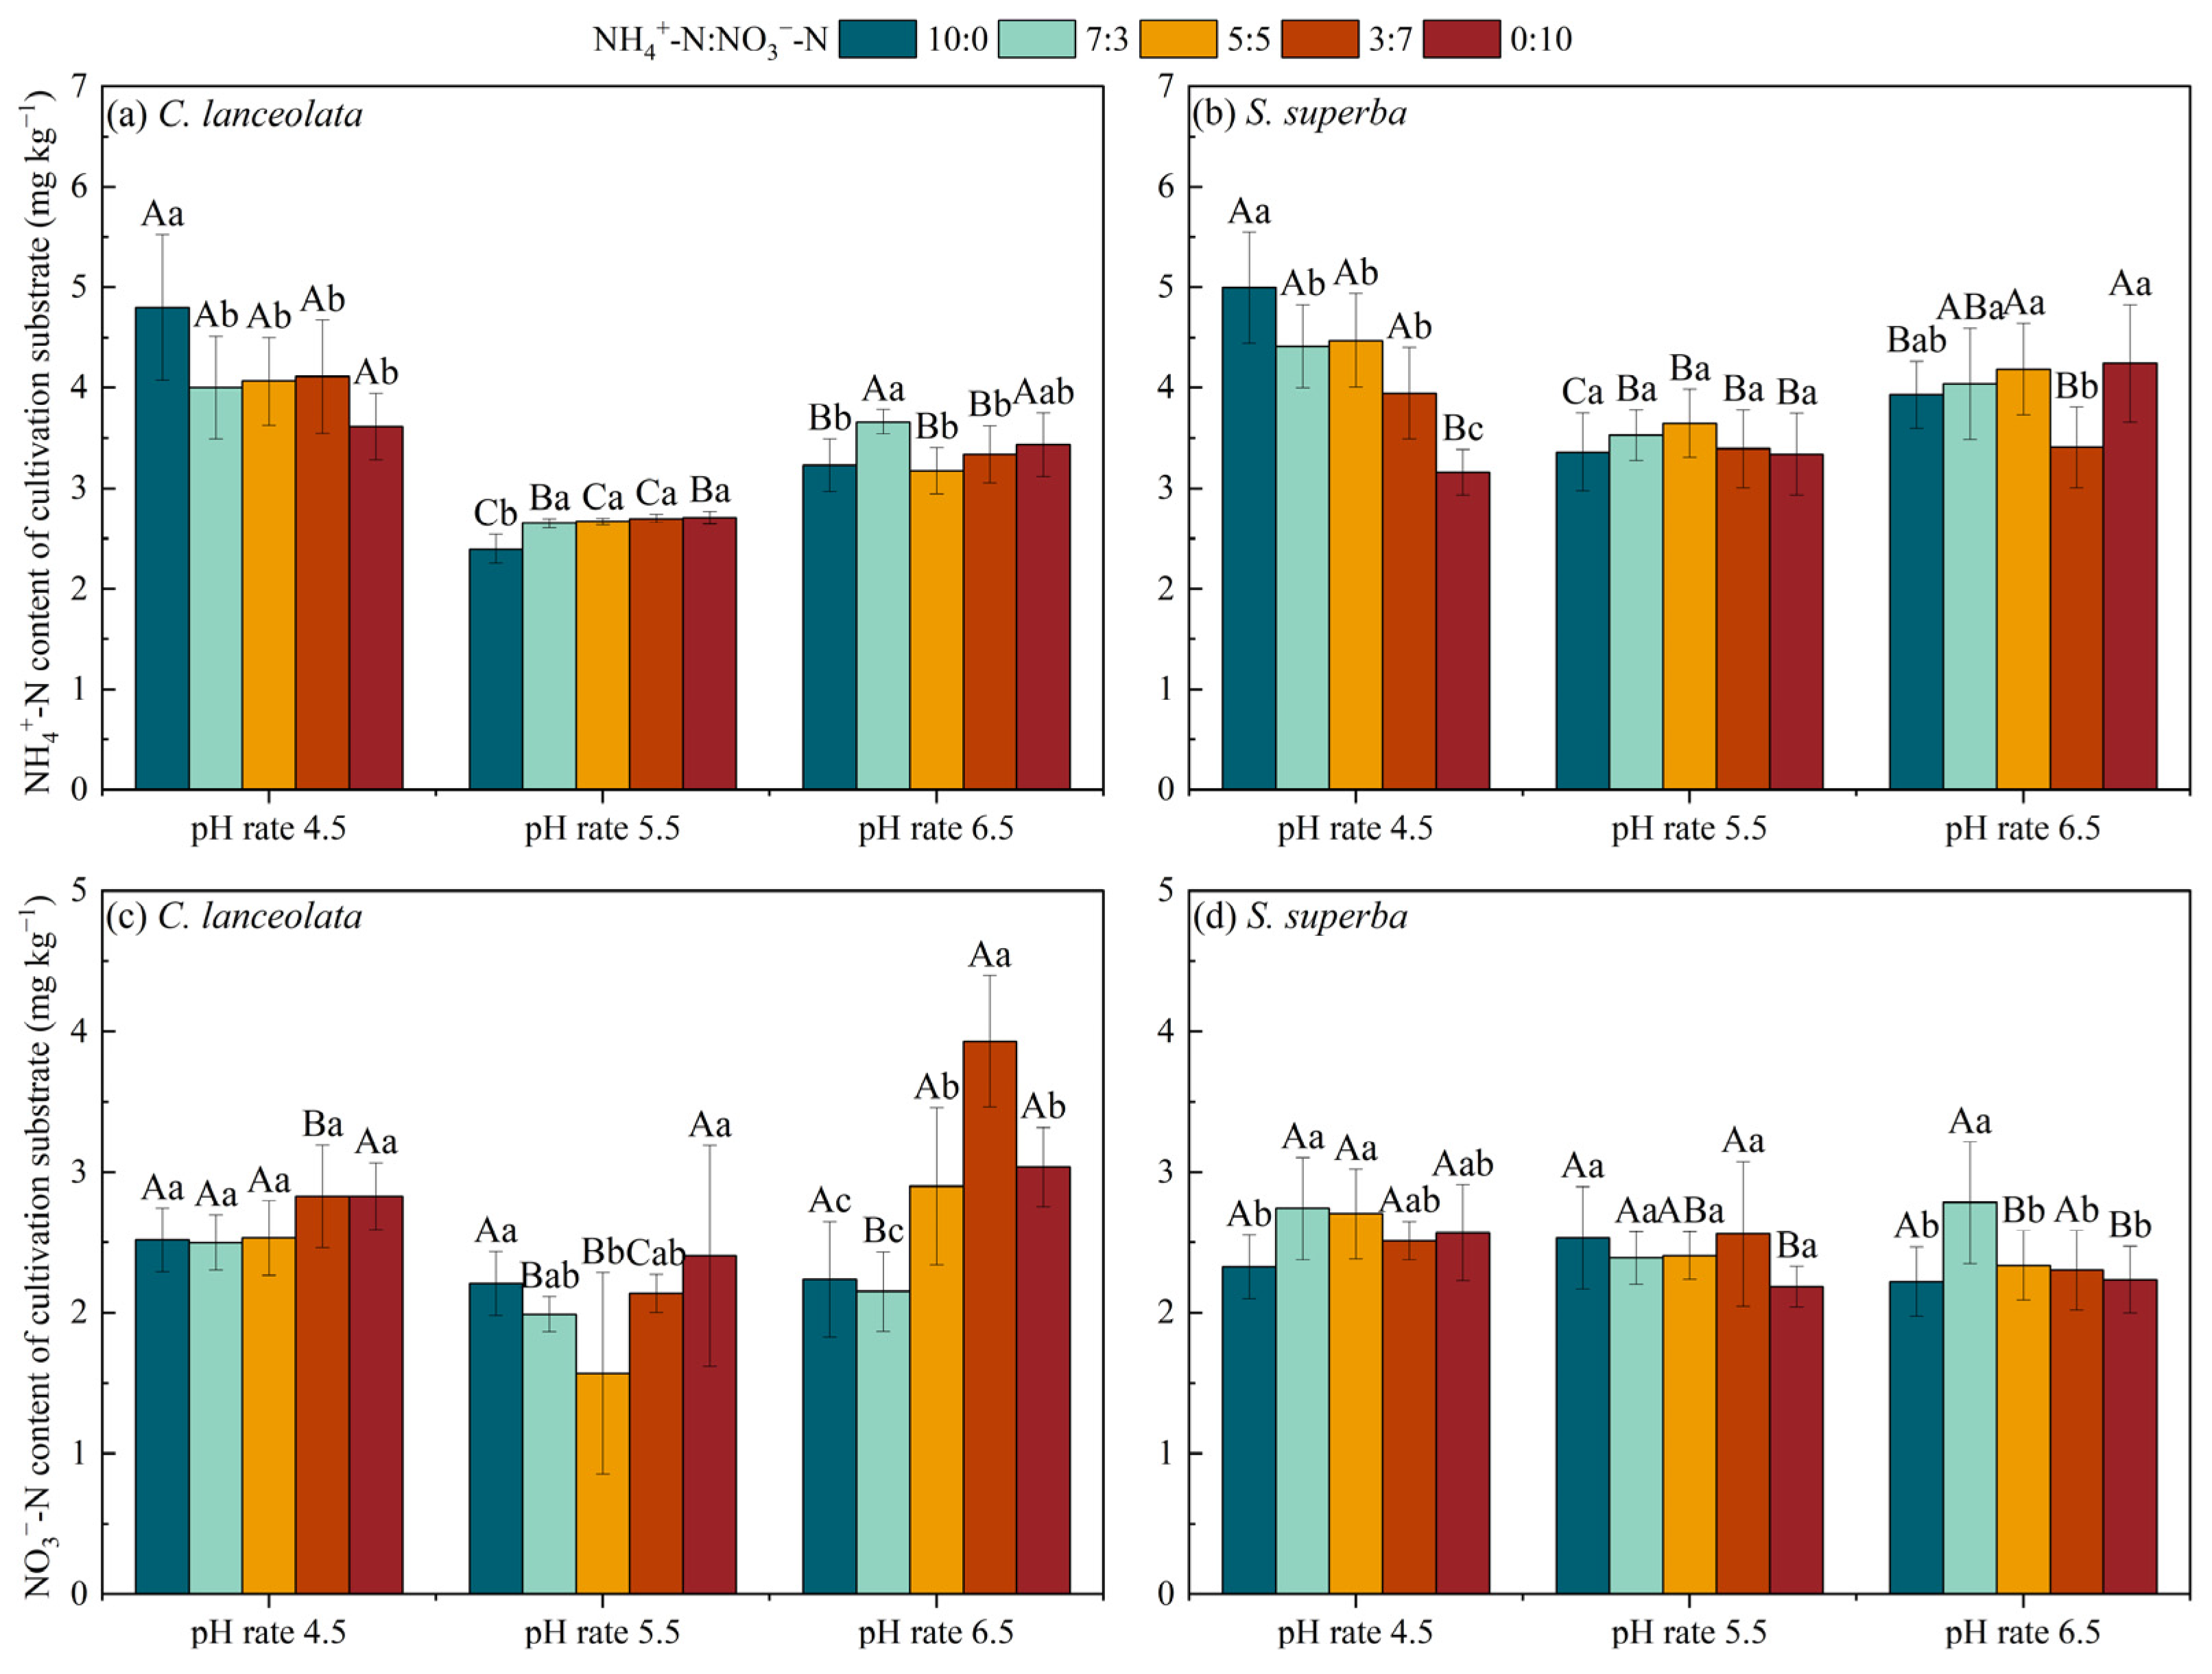
3.7. Effects of pH and N Form Ratio on the NH4+-N and NO3−-N Contents of Cultivation Substrate
For the CL, the NH4+-N content and NO3−-N content in the cultivation substrate at pH 5.5 were lower than at the pH 4.5 and pH 6.5 under the five N form ratios. Except for the ratio of 10:0, there was no significant difference of NH4+-N content in the remaining four N form ratios at pH 4.5. For the ratio of 5:5, the NO3−-N content in the cultivation substrate was significantly lower than the remaining four N form ratios at pH 5.5, while, under pH 6.5, the 3:7 ratio was significantly higher than the remaining four N form ratios (Figure 5a,c).
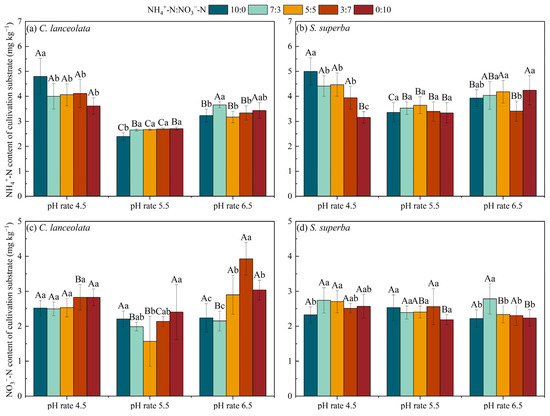
Figure 5.
Effects of pH and N form ratio on the NH4+-N and NO3−-N contents of cultivation substrate. Different uppercase letters indicate significant differences between different pH levels under the same N form ratio, while lowercase letters indicate significant differences between treatments under different N form ratios at the same pH level (p < 0.05).
For the SS, except for the ratio of 0:10, the NH4+-N content in the cultivation substrate at pH 4.5 for the remaining four N form ratios was significantly higher than at the pH 5.5 and pH 6.5. Under pH 6.5, the NO3−-N content in the cultivation substrate for the ratio of 7:3 was significantly higher than the remaining four N form ratios (Figure 5b,d).
4. Discussion
4.1. Effects of pH Levels and N Form Ratios of Cultivation Substrate on the C, N, and P Content in Leaves of CL and SS
The stoichiometric characteristics of plants are not solely determined by genetic factors but are also intricately linked to environmental variables, particularly the amount of N in the soil, which plays a pivotal role in C:N:P stoichiometry within plants [25]. Previous studies have demonstrated significant variations in biomass and C:N:P stoichiometry among different oak species under adverse conditions, with Quercus macrocarpa adjusting its nutrient allocation strategies to enhance nutrient utilization efficiency in response to adverse conditions [26]. Our investigation revealed that the pH of the cultivation substrate had notable effects on C, N, and P contents in CL and SS. Specifically, at pH 4.5 and pH 6.5, the C content of CL and SS, respectively, significantly decreased. Such discrepancies in the physiological responses of the two tree species to cultivation substrate pH account for this phenomenon. Firstly, from Figure 5, it is evident that at pH 4.5, the NH4+-N content in the cultivation substrate is higher than NO3−-N for CL. The limited availability of NO3−-N for absorption and utilization by CL may lead to restricted N metabolism, affecting protein synthesis and leaf growth. Consequently, this could result in a significant reduction in the C content of CL. Furthermore, CL appears to be more susceptible to acidic environments, where elevated H+ concentrations impede nutrient uptake by the root system, thereby affecting nutrient assimilation and translocation within the plant and consequently leading to reduced C content. This observation aligns with findings from several studies, all of which have highlighted their sensitivity to acidic conditions [27,28]. In contrast, SS exhibits the opposite stoichiometric characteristics [25].
The study revealed the N content of CL is higher at pH 6.5., potentially indicating the influence of pH on the effectiveness of N utilization within the cultivation substrate. Under neutral to alkaline conditions, plants tend to preferentially take up NH4+, and Figure 5 indicates that CL has a higher content of NH4+-N than NO3−-N in the cultivation substrate at pH 5.5, thereby increasing the availability of N species within the cultivation substrate at elevated pH levels. Notably, the experimental results demonstrated that, compared with pH 4.5 and pH 6.5, pH 5.5 resulted in a greater N content and accumulation within SS. Plants exhibit diverse preferences for N uptake and utilization. The applied nutrients play a pivotal role in determining the uptake, utilization, and subsequent growth of plants. Yang et al. [29] reported that the N and P contents of Machilus pauhoi kaneh seedlings are highest for the NH4+-N to NO3−-N ratio of 5:5 compared to other N form ratios. Ye et al. [30] revealed a significant difference in the C:N:P stoichiometry within the leaves and fine roots of Phyllostachys violascens, which was notably influenced by the NH4+-N to NO3−-N ratio. In particular, ratios of 1:1 and 1:2 emerged as optimal configurations conducive to the growth and nutrient accumulation of Phyllostachys violascens. This study revealed that, under pH 4.5 and 5.5, treatments characterized by elevated NH4+-N led to increased N and P content in CL, whereas treatments featuring high NO3−-N resulted in elevated N content in SS. Figure 5 shows a higher proportion of NH4+-N in the cultivation substrate. Thus, the root system of CL can more fully absorb and utilize NH4+-N [31,32], leading to an increase in the N content within the leaves. In contrast to CL, there is a higher proportion of NO3−-N, leading to an increase in the N content of SS.
4.2. Effects of pH Levels and N Form Ratios of Cultivation Substrate on the C:N:P Stoichiometric Ratios in Leaves of CL and SS Seedlings
Several studies have demonstrated the significance of the C:N ratio and C:P ratio in plant leaves as indicators of plant nutrient utilization efficiency. Additionally, the N:P ratio can indicate the nutrients that potentially limit plant growth. At pH 6.5, the C:N ratio of CL was lower than at pH 4.5 and 5.5, whereas the C:N ratio of SS was lowest at pH 5.5. Additionally, the C:P ratio of SS was lower at pH 6.5 than at the other two pH levels. Within a defined range, pH 5.5 and pH 6.5 in the cultivation substrate were found to enhance the accumulation of N and P of two tree species.
Furthermore, the experimental results showed that the C:N ratio of CL ranged from 27.61 to 35.03, whereas that of SS ranged from 22.74 to 31.82. Notably, all C:N ratios of CL exceeded those of SS under the same treatment. The global average C:N ratio for plants is 23.8 [33]. This discrepancy implies that CL more efficiently utilizes C resources than does SS, suggesting its superior competitiveness within a given environment. Furthermore, plants with elevated C:N ratios may demonstrate increased resilience to nutrient-deficient environments, indicating that CL is drought tolerant. Based on the N:P threshold theory, plants with N:P < 14 are considered N-limited, whereas those with N:P > 16 are considered P-limited. When 14 ≤ N:P ≤ 16, plants may be limited by both N and P or may lack both nutrients [19,34]. This study indicated that the growth of CL is limited by N, and SS is limited by N and P. Cultivation environments at pH 6.5 and pH 5.5 were able to partially alleviate the N limitation of CL and SS.
Additionally, at pH 5.5, the high NH4+-N and the high NO3−-N amounts in the cultivation substrate, respectively, contributed to a decrease in the C:N ratio, along with an increase in the C:P ratio and N:P ratio in CL and SS. The utilization of different N forms could influence the allocation of C within plants, potentially leading to an augmented utilization of C for the synthesis of organic N compounds during growth [35,36]. Consequently, this could induce a decrease in the C:N ratio of two tree species. Simultaneously, there is an interaction between the absorption and utilization of N and P [37]. Under high NH4+-N levels, the abundant availability of N may stimulate the uptake and utilization of P by CL, resulting in an increase in the N:P ratio. Conversely, the lower C:N ratio observed in SS could be attributed to the provision of high NO3−-N levels, which allowed for a more efficient allocation of N resources for growth.
4.3. Differences in C:N:P Stoichiometry between CL and SS Leaves
The variability in the C:N ratio across different plant species and growth stages reflects their unique growth strategies. Some plants employ a high C:N ratio strategy to thrive in nutrient-scarce environments, whereas others use a low C:N ratio strategy to thrive in nutrient-rich environments. Overall, the C:N ratio of CL is higher than that of SS. This suggests that CL may face limitations in N acquisition, prompting the adoption of a high C:N ratio adaptive strategy to sustain its growth and metabolic processes.
Secondly, the C:P ratio serves as an indicator of P limitation within plants. Plants with low C:P ratios typically demonstrate enhanced P acquisition efficiency, potentially conferring a competitive advantage in P-rich environments. Significant differences in the C:P ratios were noted between CL and SS at high NO3−-N amounts, indicating distinct responses to this treatment.
Moreover, the N:P ratio is utilized to determine whether a plant is limited by N or P availability [38]. Significant differences in the N:P ratio between CL and SS were observed at pH 5.5. Under high NO3−-N levels, substantial differences in the N:P ratio were evident between the two tree species. Additionally, across the entirety of the experimental treatments, the N:P ratio of CL was greater than that of SS in 14 out of 15 distinct treatments, indicating potential generalized N limitation in CL. In contrast, SS may experience P limitation.
4.4. The Correlation among C, N, and P Content and C:N:P Stoichiometric Ratios in Leaves of CL and SS
The chemical composition of plant leaves is intricately regulated by the interrelationships among various nutrient elements. The significant positive correlation between N and P content in SS underscores the synergistic nature of N and P uptake, which is attributed to the substantial utilization of ATP for protein synthesis. Additionally, the C:N:P ratios of CL and SS showed a strong correlation, indicating a complex synergistic relationship between the two species. However, a more comprehensive understanding necessitates further investigation into the stoichiometric characteristics of their roots and stems.
4.5. Response of Growth in CL and SS to the C:N:P Stoichiometry
At the ratio of 7:3, the C:N ratio of CL is negatively correlated with TB. This indicates that CL has more difficulty effectively utilizing nitrogen, thereby limiting TB. At the ratio of 7:3, The C:N:P stoichiometric ratio of SS is negatively correlated with TB, which precisely confirms the previously established conclusion that SS is limited by N and P. At the 0:10 ratio, the C:N ratio of SS is positively correlated with TB. The ample supply of NO3−-N likely meets the demand of SS, promoting N assimilation and protein synthesis, thereby enhancing the TB of SS.
5. Conclusions
The C:N:P stoichiometry in the leaves of CL and SS seedlings varied significantly depending on the pH and N ratio in the cultivation substrate. Under acidic conditions at pH 4.5, the N content of CL and SS significantly decreased. However, when cultivated in a substrate at pH 5.5, the N content of SS increased. Similarly, at a pH of 5.5, cultivation environments with high NH4+-N increased the N content of CL, whereas environments with high NO3−-N increased the N content of SS. Moreover, the analysis of the C:N:P ratio, total biomass, and cultivation indicated that during the cultivation of CL and SS, CL was susceptible to N nutrient limitation, whereas SS was susceptible to N and P nutrient limitation.
Author Contributions
Conceptualization, C.C.; methodology and formal analysis, C.C. and J.Y.; investigation, L.W., H.L., and Y.W.; data curation, C.C.; writing—original draft preparation, C.C.; writing—review and editing, J.Y. and L.W.; validation and visualization, J.Y. and H.L.; supervision, X.Y.; funding acquisition, X.Y. All authors have read and agreed to the published version of the manuscript.
Funding
This research was funded by the Research Visiting and Studying in Haixia Institute of Sciences and Technology of FAFU (KFXH23033).
Data Availability Statement
No new data were created or analyzed in this study. Data sharing is not applicable to this article.
Acknowledgments
We thank the numerous students and lab staff from the College of Forestry, Fujian Agriculture and Forestry University, for their assistance in the laboratory.
Conflicts of Interest
The authors declare no conflicts of interest.
References
- Wu, C. Effects of Fertilization on Soil Acidification in Upland and Paddy Soils. Master’s Thesis, Nanjing Forestry University, Nanjing, China, 2022. [Google Scholar] [CrossRef]
- Krasilnikov, P.; Taboada, M.; Amanullah. Fertilizer use, soil health and agricultural sustainability. Agriculture 2022, 12, 462. [Google Scholar] [CrossRef]
- Suh, J.; Yoo, D.; Lee, H.; Nam, C.; Kim, S. Effects of soil reaction (pH) of culture soil on the growth of Sedum kamtschaticum in pot cultivation. Korean J. Plant Resour. 2006, 19, 515–516. [Google Scholar]
- Zhu, L.; Zhao, Y.; Zhang, W.; Zhou, H.; Chen, X.; Li, Y.; Wei, D.; Wei, Z. Roles of bacterial community in the transformation of organic nitrogen toward enhanced bioavailability during composting with different wastes. Bioresour. Technol. 2019, 285, 121326. [Google Scholar] [CrossRef]
- Zhao, P.; Sun, G.; Peng, S. Ecophysiological research on nitrogen nutrition of plant. Ecol. Sci. 1998, 17, 39–44. [Google Scholar]
- Zhang, Y.; Li, Y. The ecophysiological response of the vegetation to the different nutrient nitrogen habitats. For. Sci. Technol. Inf. 2014, 46, 1–6. [Google Scholar] [CrossRef]
- Yan, X.; Lin, Z.; Hu, W.; Huo, Y.; Li, Z.; Ma, X. A review of nitrogen uptake preference of trees and its formation mechanism. World For. Res. 2020, 33, 25–30. [Google Scholar] [CrossRef]
- Dong, L.; Li, Y.; Li, P.; Liu, Y.; Ma, F.; Hao, X.; Guo, L. Growth response of wheat and maize to different nitrogen supply forms under the enrichment of atmospheric CO2 concentrations. Agronomy 2023, 13, 485. [Google Scholar] [CrossRef]
- Weston, A.; Dodgson, J.; Marks, D.; Wilkinson, S. Novel, high-yielding lettuce phenotype generated by urea amine nitrogen nutrition displays contrasting traits to those of nitrate- or ammonium-fertilized plants. J. Plant Nutr. 2023, 46, 2104–2119. [Google Scholar] [CrossRef]
- Zhang, C.; Zeng, F.; Zeng, Z.; Du, H.; Zhang, L.; Su, L.; Lu, M.; Zhang, H. Carbon, nitrogen and phosphorus stoichiometry and its influencing factors in Karst primary forest. Forests 2022, 13, 1990. [Google Scholar] [CrossRef]
- Tian, D.; Yan, Z.; Fang, J. Review on characteristics and main hypotheses of plant ecological stoichiometry. Chin. J. Plant Ecol. 2021, 45, 682–713. [Google Scholar] [CrossRef]
- Costa, M.; De Mello Prado, R.; Palaretti, L.; De Souza Junior, J. The effect of abiotic stresses on plant C:N:P homeostasis and their mitigation by silicon. Crop J. 2024, 12, 340–353. [Google Scholar] [CrossRef]
- Zhang, Z.; Yang, G.; Lv, X.; Hu, R.; Huang, L. Research progresses in ecological stoichiometry of C, N and P in desert ecosystems. J. Desert Res. 2022, 42, 48–56. [Google Scholar]
- Wang, C.; Yang, C.; Song, C.; Wang, W. Root-soil ecological stoichiometric characteristics of alpine grassland in the source area of three rivers. Grassl. Turf 2022, 42, 8–20. [Google Scholar] [CrossRef]
- Liu, W.; Su, J.; Li, S.; Zhang, Z.; Li, Z. Stoichiometry study of C, N and P in plant and soil at different successional stages of monsoon evergreen broad-leaved forest in Puer, Yunnan province. Acta Ecol. Sin. 2010, 30, 6581–6590. [Google Scholar]
- Tu, J.; Li, Z.; Sun, J.; Zhao, X. Sapling stem stoichiometry of dominant species in three types of tropical forests in southern Yunnan. For. Res. 2022, 35, 146–155. [Google Scholar] [CrossRef]
- Elser, J.; Bracken, M.; Cleland, E.; Gruner, D.; Harpole, W.; Hillebrand, H.; Ngai, J.; Seabloom, E.; Shurin, J.; Smith, J. Global analysis of nitrogen and phosphorus limitation of primary producers in freshwater, marine and terrestrial ecosystems. Ecol. Lett. 2007, 10, 1135–1142. [Google Scholar] [CrossRef]
- Sterner, R.; Elser, J.; Vitousek, P. Ecological Stoichiometry: The Biology of Elements from Molecules to the Biosphere; Princeton University Press: Princeton, NJ, USA, 2002. [Google Scholar] [CrossRef]
- Niklas, K.; Owens, T.; Reich, P.; Cobb, E. Nitrogen/phosphorus leaf stoichiometry and the scaling of plant growth. Ecol. Lett. 2005, 8, 636–642. [Google Scholar] [CrossRef]
- Zhang, J.; Liu, Z.; Yan, C.; Wang, Y.; Liu, K.; Shi, X.; Yuan, Z. Effects of soil pH on soil carbon, nitrogen, and phosphorus ecological stoichiometry in three types of steppe. Acta Prataculturae Sin. 2021, 30, 69–81. [Google Scholar]
- Yu, S.; Li, F.; Hu, D.; Guo, X.; Li, K.; Qiu, L. Nutrient accumulation and stoichiometric characteristics of Camellia oleifera seedlings under different nitrogen levels. J. Cent. South Univ. For. Technol. 2023, 43, 1–9. [Google Scholar] [CrossRef]
- Yan, X.; Hu, W.; Ma, Y.; Huo, Y.; Wang, T.; Ma, X. Nitrogen uptake preference of Cunninghamia lanceolata, Pinus massoniana, and Schima superba under heterogeneous nitrogen supply environment and their root foraging strategies. Sci. Silvae Sin. 2020, 56, 1–11. [Google Scholar]
- Wang, L.; Liang, H.; Wang, Y.; Quan, X.; Li, X.; Yan, X. Effects of different nitrogen forms and ratios on photosynthetic characteristics and growth in Cunninghamia lanceolata and Schima superba seedlings. J. Sichuan Agric. Univ. 2023, 41, 217–224. [Google Scholar] [CrossRef]
- Yan, X.; Ma, X. Responses of root morphology and seedling growth in three tree species to heterogeneous supplies of ammonium and nitrate. For. Ecol. Manag. 2021, 479, 118538. [Google Scholar] [CrossRef]
- Guo, Z.; Chen, S.; Yang, Q.; Li, Y. Responses of N and P stoichiometry on mulching management in the stand of Phyllostachys praecox. Acta Ecol. Sin. 2012, 32, 6361–6368. [Google Scholar] [CrossRef]
- He, W.; Shi, X.; Wang, Y.; Luo, M.; Lu, M. Stoichiometric characteristics of oak seedlings in response to tailings pond environment. Chin. J. Ecol. 2024, 43, 1025–1035. [Google Scholar]
- Tang, H. Effect of soil acidification on Chinese pine growth. Chin. J. Appl. Environ. Biol. 2001, 7, 20–23. [Google Scholar] [CrossRef]
- Zhou, S.; Zhang, M.; Chen, S.; Xu, W.; Zhu, L.; Gong, S.; He, X.; Wang, P. Acid resistance of Masson pine (Pinus massoniana Lamb.) families and their root morphology and physiological response to simulated acid deposition. Sci. Rep. 2020, 10, 22066. [Google Scholar] [CrossRef]
- Yang, T.; Zhong, Q.; Li, B.; Cheng, D.; Xu, C.; Zhou, Y.; Zhang, X.; Zhou, Z. Effects of short-term combined application of ammonium nitrogen and nitrate nitrogen on the growth and leaf traits of Machilus pauhoi seedlings. Chin. J. Appl. Ecol. 2022, 33, 25–32. [Google Scholar] [CrossRef]
- Ye, L.; Chen, S. Effects of nitrate and ammonia supply ratio on the C, N and P stoichiometric characteristics of Phyllostachys violascens. J. Plant Nutr. Fertil. 2016, 22, 1672–1678. [Google Scholar]
- Li, C.; Li, Q.; Xu, X.; Ouyang, H. Nitrogen acquisition strategies of Cunninghamia lanceolata at different ages. Acta Ecol. Sin. 2016, 36, 2620–2625. [Google Scholar] [CrossRef]
- Chen, Y. Uptaking Preference of Main Subtropical Afforestation tree Species for Nitrogen Forms and Its Regulatory Factors. Master’s Thesis, Fujian Normal University, Fujian, China, 2018. [Google Scholar]
- Han, W.; Fang, J.; Guo, D.; Zhang, Y. Leaf nitrogen and phosphorus stoichiometry across 753 terrestrial plant species in China. New Phytol. 2005, 168, 377–385. [Google Scholar] [CrossRef]
- Tessier, J.; Raynal, D. Use of nitrogen to phosphorus ratios in plant tissue as an indicator of nutrient limitation and nitrogen saturation. J. Appl. Ecol. 2003, 40, 523–534. [Google Scholar] [CrossRef]
- Bloom, A.; Sukrapanna, S.; Warner, R. Root respiration associated with ammonium and nitrate absorption and assimilation by barley. Plant Physiol. 1992, 99, 1294–1301. [Google Scholar] [CrossRef] [PubMed]
- Britto, D.; Kronzucker, H. NH4+ toxicity in higher plants: A critical review. J. Plant Physiol. 2002, 159, 567–584. [Google Scholar] [CrossRef]
- Vance, C.; Uhde-stone, C.; Allan, D. Phosphorus acquisition and use: Critical adaptations by plants for securing a nonrenewable resource. New Phytol. 2003, 157, 423–447. [Google Scholar] [CrossRef]
- Gusewell, S. N:P ratios in terrestrial plants: Variation and functional significance. New Phytol. 2004, 164, 243–266. [Google Scholar] [CrossRef]

Disclaimer/Publisher’s Note: The statements, opinions and data contained in all publications are solely those of the individual author(s) and contributor(s) and not of MDPI and/or the editor(s). MDPI and/or the editor(s) disclaim responsibility for any injury to people or property resulting from any ideas, methods, instructions or products referred to in the content. |
© 2024 by the authors. Licensee MDPI, Basel, Switzerland. This article is an open access article distributed under the terms and conditions of the Creative Commons Attribution (CC BY) license (https://creativecommons.org/licenses/by/4.0/).