Article

Construction of Additive Allometric Biomass Models for Young Trees of Two Dominate Species in Beijing, China

1
Precision Forestry Key Laboratory of Beijing, Beijing Forestry University, Beijing 100083, China
2
Key Laboratory of Genetics and Germplasm Innovation of Tropical Special Forest Trees and Ornamental Plants, Ministry of Education, Hainan University, Haikou 570228, China
3
Surveying and 3S Engineering Research Center, Beijing Forestry University, Beijing 100083, China
4
College of Science, Beijing Forestry University, Beijing 100083, China
*
Authors to whom correspondence should be addressed.
Forests 2024, 15(6), 991; https://doi.org/10.3390/f15060991
Submission received: 6 May 2024 / Revised: 27 May 2024 / Accepted: 31 May 2024 / Published: 5 June 2024
(This article belongs to the Special Issue Modeling Aboveground Forest Biomass: New Developments)

Abstract

:
The traditional volume-derived biomass method is limited because it does not fully consider the carbon sink of young trees, which leads to the underestimation of the carbon sink capacity of a forest ecosystem. Therefore, there is an urgent need to establish an allometric biomass model of young trees to provide a quantitative basis for accurately estimating the carbon storage and carbon sink of young trees. The destructive data that were used in this study included the biomass of the young trees of the two dominant species (Betula pendula subsp. mandshurica (Regel) Ashburner & McAll and Populus × tomentosa Carrière) in China, which was composed of the aboveground biomass (Ba), belowground biomass (Bb), and total biomass (Bt). Univariate and bivariate dimensions were selected and five candidate biomass models were independently tested. Two additive allometric biomass model systems of young trees were established using the proportional function control method and algebraic sum control method, respectively. We found that the logistic function was the most suitable for explaining the allometric growth relationship between the Ba, Bt, and diameter at breast height (D) of young trees; the power function was the most suitable for explaining the allometric growth relationship between the Bb and D of young trees. When compared with the independent fitting model, the two additive allometric biomass model systems provide additive biomass prediction which reflects the conditions in reality. The accuracy of the Bt models and Ba models was higher, while the accuracy of the Bb models was lower. In terms of the two dimensions—univariate and bivariate, we found that the bivariate additive allometric biomass model system was more accurate. In the univariate dimension, the proportional function control method was superior to the algebraic sum control method. In the bivariate dimension, the algebraic sum control method was superior to the proportional function control method. The additive allometric biomass models provide a reliable basis for estimating the biomass of young trees and realizing the additivity of the biomass components, which has broad application prospects, such as the monitoring of carbon stocks and carbon sink evaluation.

Graphical Abstract

1. Introduction

The assessment of the carbon sink capacity must be based on an accurate biomass, which is then converted into the carbon content and carbon dioxide equivalent. The volume-derived biomass method is used for the evaluation of forest carbon sinks and considers trees with a diameter at breast height >5 cm. However, the volume-derived biomass method has not been able to assess the carbon sink of young trees, which leads to the underestimation of the carbon sink capacity of forest ecosystems [1]. The assessment of the carbon sink capacity of forest ecosystems has received extensive global attention [2,3,4]. To address the limitations of the volume-derived biomass method, it is necessary to evaluate the carbon sink of young trees.
The lack of allometric biomass models of young trees affects the accuracy of assessing the available forest biomass, forest fuel load, and carbon sink [5]. Due to the small size of young trees, not calculating the volume of a few young trees will not have a significant impact on the estimation of the carbon stock. However, young trees contribute significantly to the carbon sink because they grow faster than large-diameter trees [6,7]. In addition, reliable biomass models of young trees are particularly important in fire-prone forest ecosystems. For example, in the Pinus brutia Ten. forests in Turkey, nearly 15% of the forest area is dominated by young trees (D ranges from 0.1 to 8) [1].
There are differences in the definition of a young tree in different regions. In Turkey, trees with a diameter at breast height of <8 cm are considered to be young trees and are not measured in conventional forest inventory applications such as industrial round-wood production [1]. In China, trees with a diameter at breast height of <5 cm are considered to be young trees and are not measured in forest resource inventories [6]. The biomass estimation of young trees in Turkey mainly targeted the crown biomass component and was based on a small sample size [8]. Due to the difficulty of obtaining biomass samples, the development of an allometric biomass model of young trees in China has been limited to a few studies.
The main methods for estimating the forest biomass include the model and remote sensing inversion methods. The most reliable way to determine the forest biomass would be to cut and weigh all the trees in the forest. However, this would be destructive, time-consuming, costly, and could only be conducted on a small scale [9]. The model method can be used to estimate the forest biomass non-destructively. It estimates the forest biomass using readily measurable tree factors [9,10]. In the model method, the biomass can be estimated either by tree volume and biomass expansion factor or by the allometric biomass model. Biomass estimation on a large spatial scale can be realized using the remote sensing inversion method but atmospheric interference can affect the estimation accuracy of satellite data [11]. Therefore, using allometric biomass models is often the best choice for estimating the forest biomass if there is information on individual trees.
The allometric relationship of young trees is different from that of old trees [12,13]. Bond-Lamberty et al. (2002) found that when using data samples with a large diameter at breast height, the allometric biomass models were significantly biased in estimating the biomass of small-diameter trees [14]. Small-diameter trees play an important role in estimating forest biomass because they account for a large number of the individual trees that make up the biomass [12]. Therefore, it is necessary to separately develop an allometric biomass model of young trees. However, only a few studies have modeled the biomass of young trees [12,15,16].
The selection of the predictor is particularly important when developing an allometric biomass model. Many allometric biomass models were established between tree biomass and easily measured tree variables, such as the diameter at breast height, tree height, crown width, and wood density [17,18,19]. For these developed models, the diameter at breast height is the most commonly used and reliable predictor [20,21]. It has also been suggested that adding tree height as a predictor to allometric biomass models can significantly improve model performance [22,23].
Model form selection is an important uncertainty in estimating tree biomass. The power function is the most commonly used to model allometric biomass [24,25]. The exponential growth of biomass based on individual size is described in a power function form [26,27]. However, due to resource competition, the continuous acceleration and infinite growth of individual tree biomass in forest ecosystems is not valid. The logistic model is a classical method for predicting population size. The logistic model has similar rapid growth to the power function, which then gradually flattens out and finally approaches the asymptotic value [28]. The logistic model and power function have the same statistical validity, but the logistic model has better ecological significance and can better estimate shrub biomass [29].
For the modeling of tree biomass, the additivity of the biomass components should be ensured, that is, the total biomass of the trees should be equal to the sum of the biomass of each component. The total biomass of the trees is usually divided into different components based on their physiological function, such as the trunk, branch, leaf, and root biomass. When more than two tree components are involved, if the biomass model of each component is fitted separately, the intrinsic correlation between the tree components is not considered. In some studies, mathematical models were selected for the different tree components, parameter fitting was carried out independently, and allometric biomass models of each component were developed. When these models were used for prediction, there was a non-additivity problem between the predicted total biomass of the trees and the predicted biomass of each component [14,30,31,32].
To solve the additivity problem, different models and estimation methods have been proposed, such as the generalized moment method (GMM) [33], error-in-variable simultaneous equations method (EIV) [34], proportional function control method, and algebraic sum control method [35,36]. Among these methods, there is no unified conclusion on the best method. Zheng et al. (2022) showed that the prediction accuracy of the proportional function control method was higher [37]. Moreover, Xiong et al. (2023) showed that the GMM method had a better fitting performance [25]. Fu et al. showed that the EIV method has more advantages and potential [38].
Considering that the growth of young trees is different from that of old trees, it needs to be confirmed that the conclusions made in previous literature based on the allometric biomass model are applicable to young trees. In this study, based on the measured destructive data of young trees of Betula pendula subsp. mandshurica (Regel) Ashburner & McAll and Populus × tomentosa Carrière, the additive allometric biomass model system was established with the diameter at breast height and tree height as the predictors to ensure the additive relationship between the total biomass, aboveground biomass, and belowground biomass. We compared two additive methods, namely the proportional function control method and the algebra sum control method, to determine which method was better. We hypothesized that (1) the bivariate additive allometric biomass model system is more accurate; (2) when compared with the power function, the logistic model can better estimate the allometry of young trees; and (3) among the two additive methods, the proportional function control method is superior to the algebra sum control method.

2. Materials and Methods

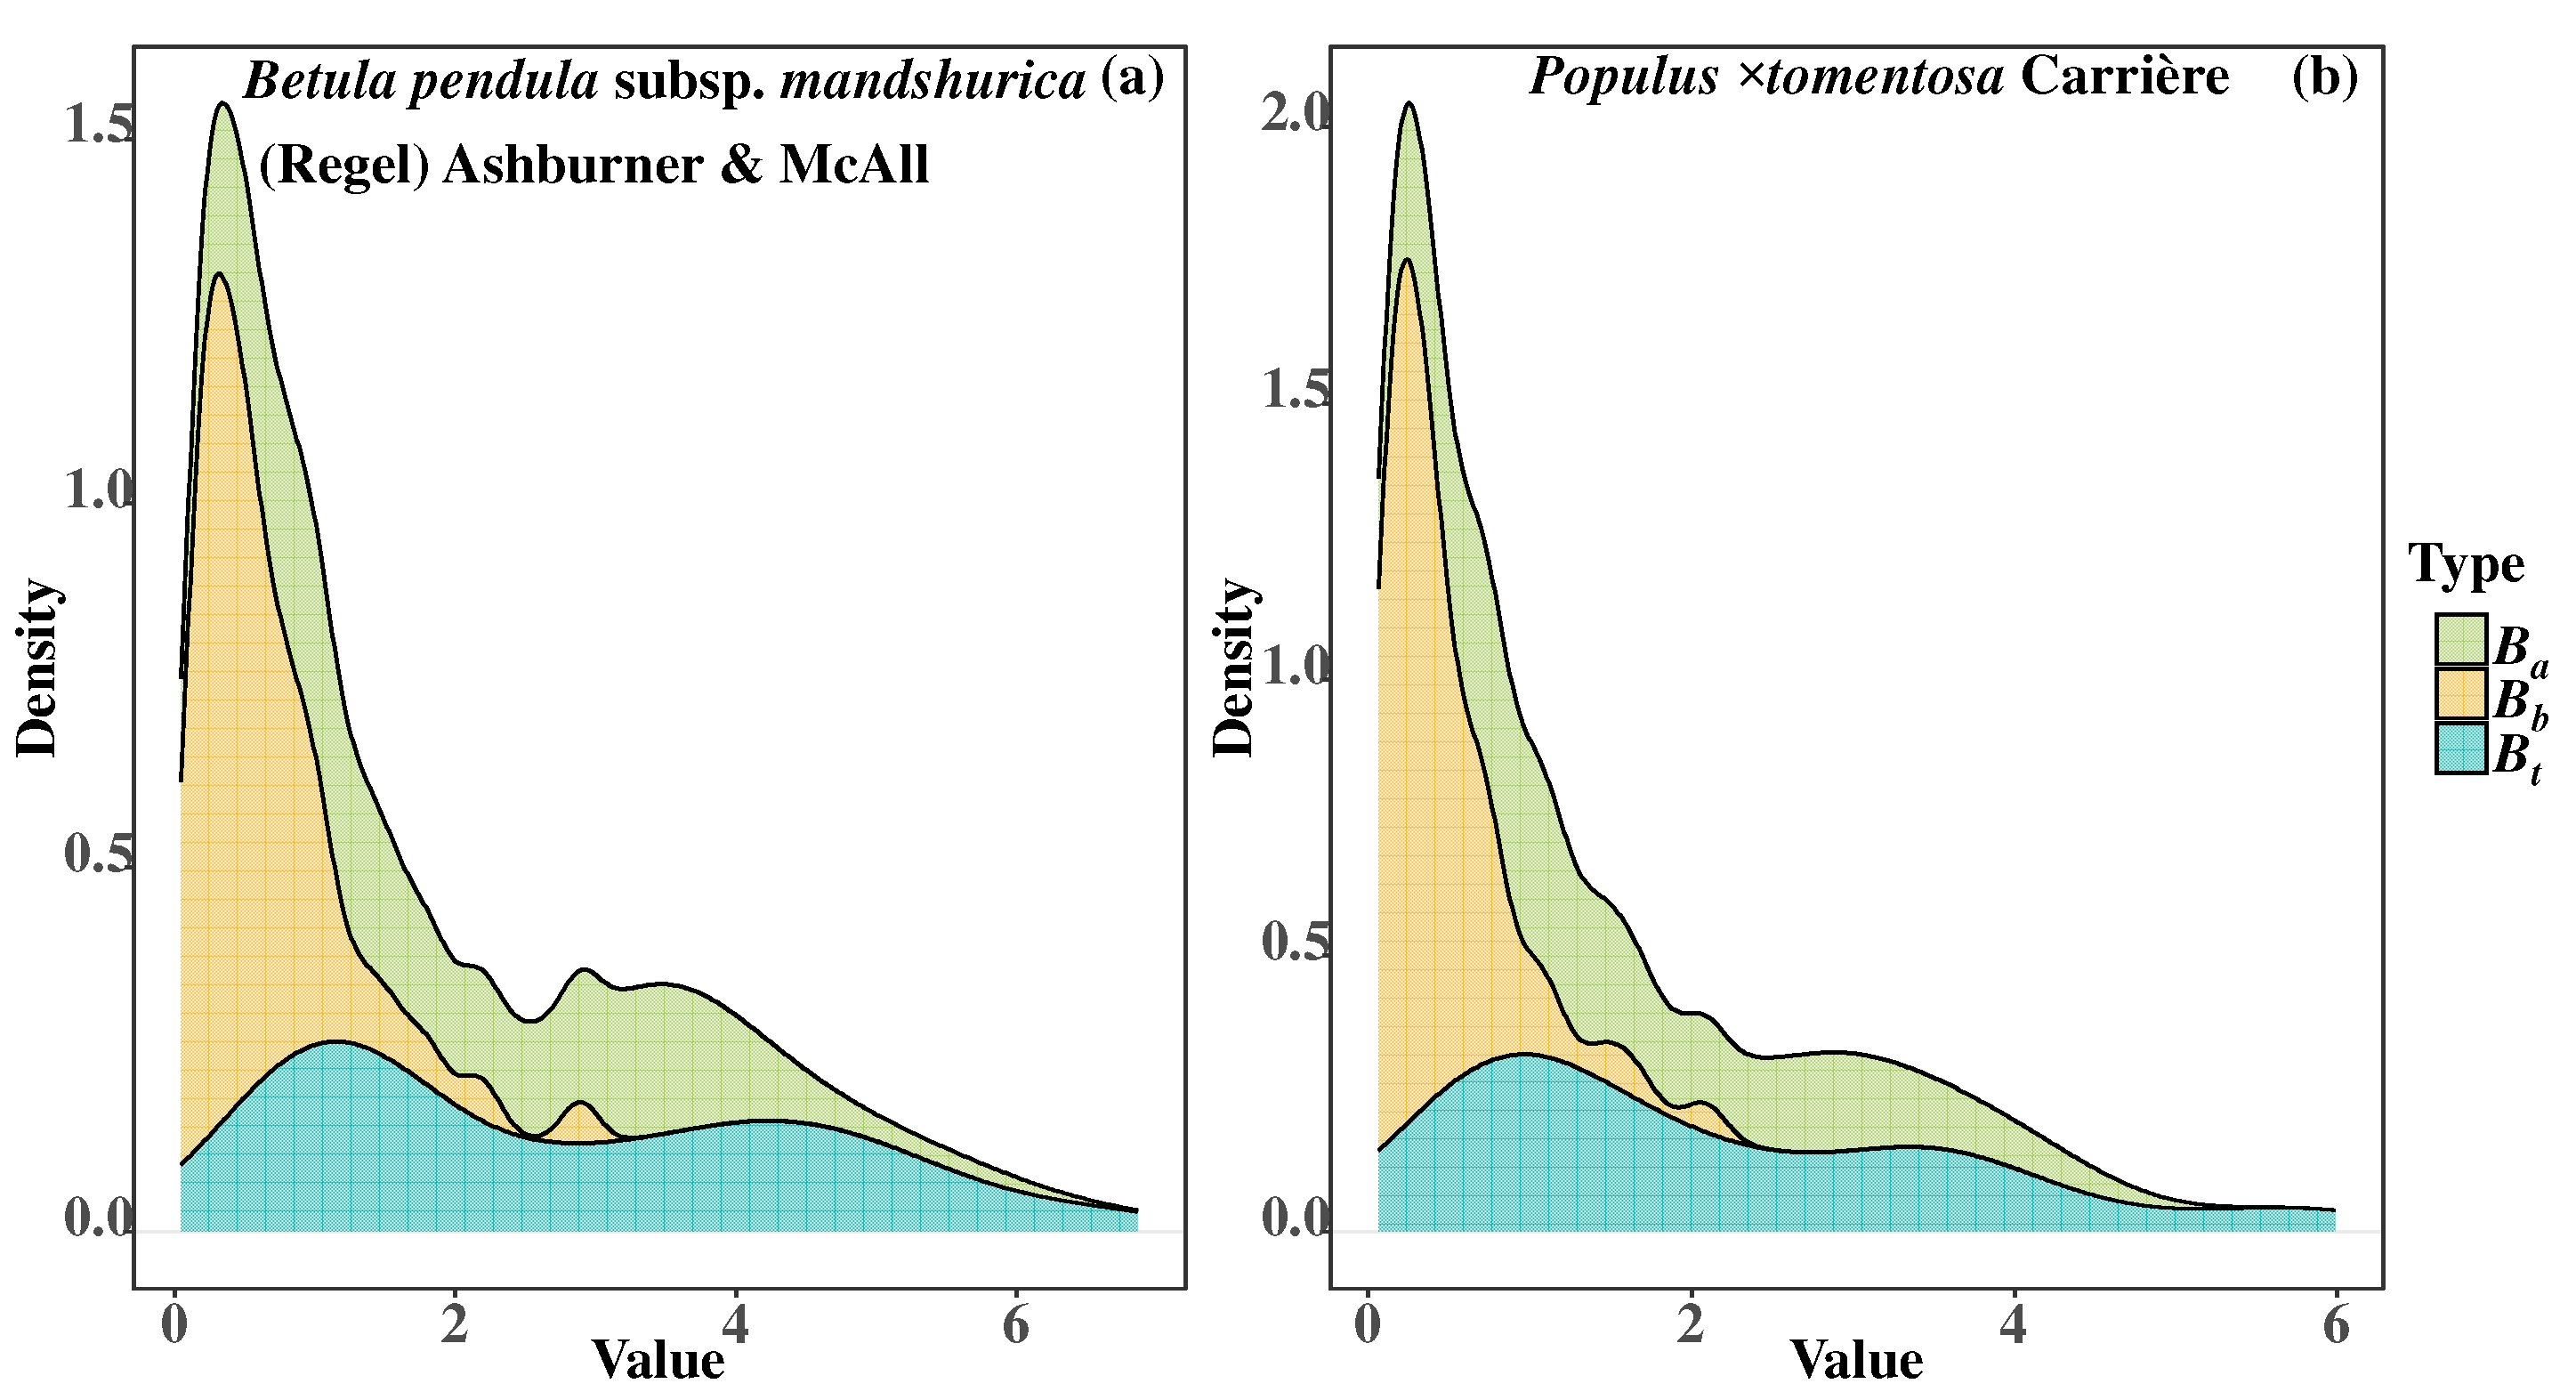
2.1. Study Site and Data

2.1.1. Study Site

Beijing is located at the junction of the Inner Mongolia Plateau and the North China Plain. The elevation is ≤100 m and the elevation of most areas ranges between 30 and 50 m. The climate is a warm temperate semi-humid continental monsoon climate with four distinct seasons, a hot and rainy summer and a cold and dry winter. The average annual temperature is about 11.5 °C and the frost-free period is 5 to 6 months annually. The annual average precipitation is 585 mm, with the summer precipitation accounting for about 74% of the annual precipitation. According to zonal vegetation types, Beijing belongs to the warm temperate deciduous broad-leaved forest area [39].

2.1.2. Data Collection

We obtained data during the peak annual biomass accumulation period from September to October 2021. A total of 44 plantation plots of 30 m × 30 m were investigated, and all the young trees with diameters below 5 cm and heights above 130 cm were measured (Table S1).
Table 1 shows the descriptive statistics of the data. The data was collected from 167 young trees: 104 Betula pendula subsp. mandshurica (Regel) Ashburner & McAll trees and 63 Populus × tomentosa Carrière trees. The factors that were measured for each tree included the diameter at breast height, tree height, aboveground biomass, belowground biomass, and total biomass. For each tree, the fresh weight of the trunk, branches, and leaves were weighed and samples were taken. The sample was dried in the oven at 105 °C to obtain the dry mass. According to the proportion of the fresh mass and dry mass of the sample, the dry mass of each component was calculated, and then the parts of the tree were added together to obtain the aboveground biomass. The belowground biomass was determined using the full excavation method. The whole root system was dug out manually, the soil on the root was cleared, and then the total fresh weight of the rhizome (≥5 mm), coarse roots (2–5 mm), and fine roots (<2 mm) were weighed. The sample was dried in the oven at 105 °C to obtain the dry mass. According to the proportion of the fresh mass and dry mass of the sample, the dry mass of each component was calculated, and then the parts of the tree were added together to obtain the belowground biomass. The total biomass of the tree was obtained by adding the aboveground and belowground biomass.

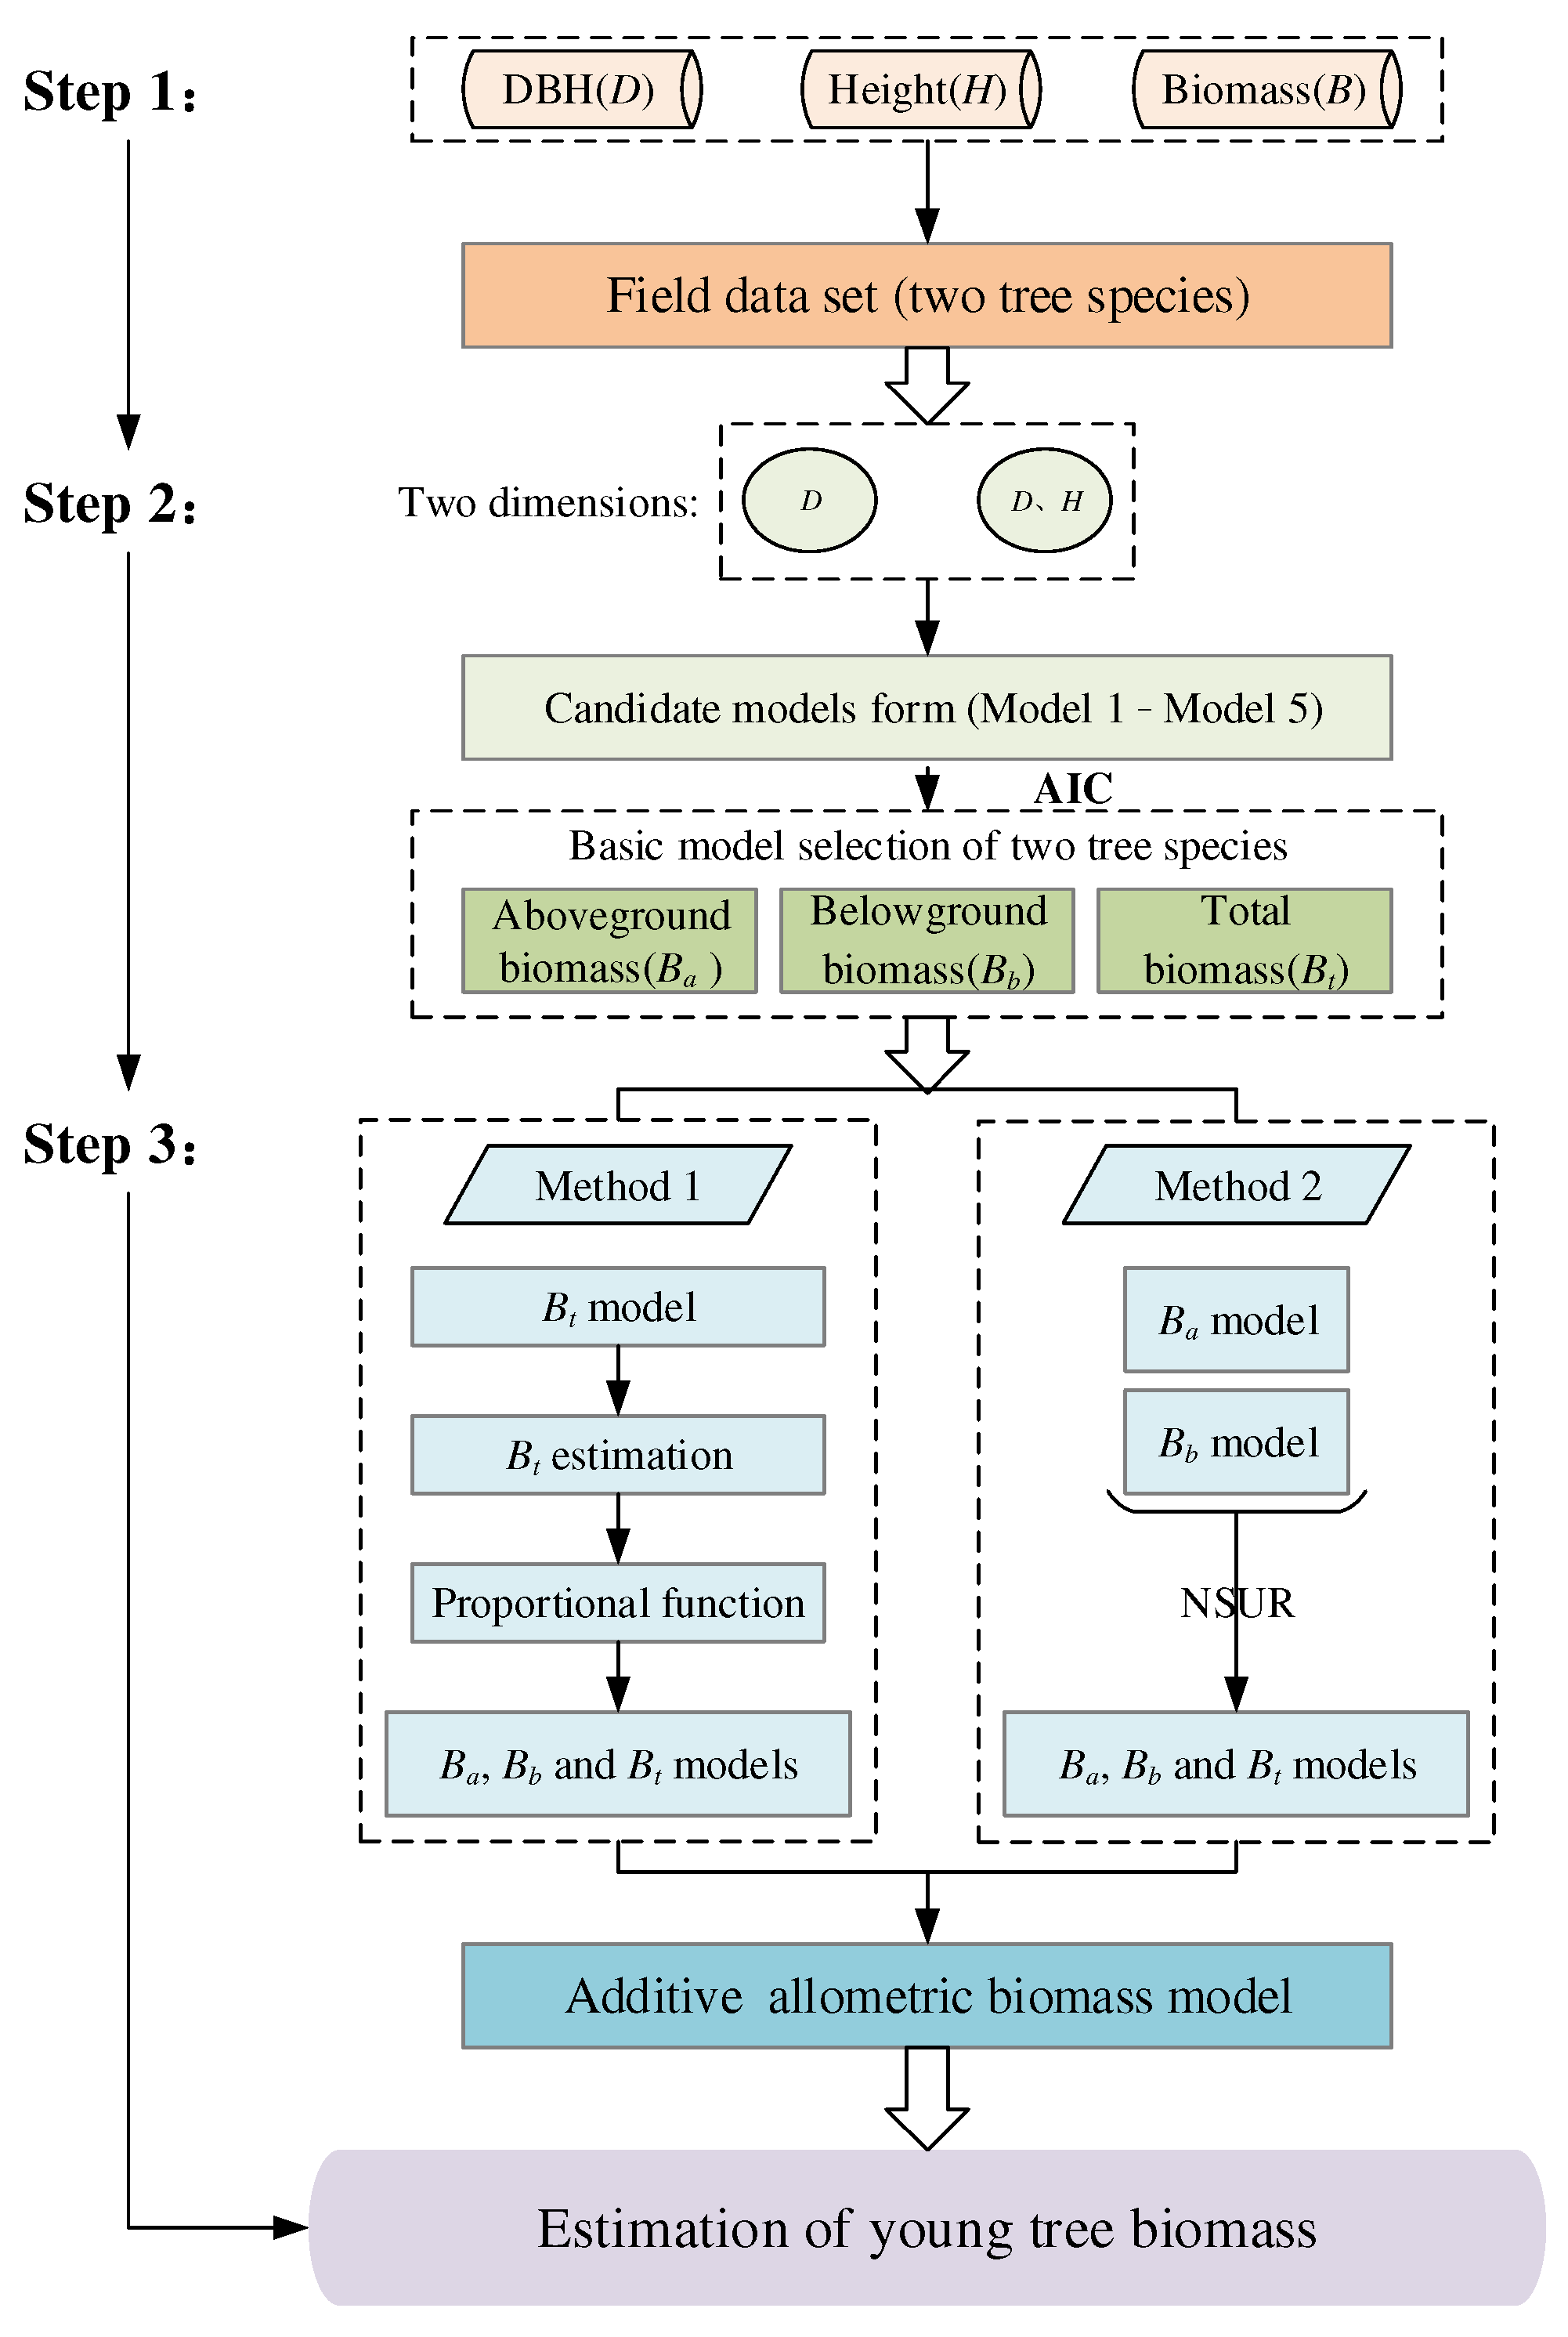
2.2. Statistical Analysis

2.2.1. Independent Fitting Model

Many biomass models have been widely used to assess the carbon sink of global forest ecosystems [29,32,40,41]. In this study, five kinds of biomass models commonly used in the past were tested. Univariate and bivariate combinations were considered: (1) diameter at breast height (D); and (2) D and tree height (H). Among them, the three model forms of logistics function (Model 1), quadratic polynomial function (Model 2), and power function (Model 3) only include D.
Model 1:
B = a 0 / 1 + e a 1 + a 2 D
Model 2:
B = a 0 + a 1 D + a 2 D 2
Model 3:
B = a 0 D a 1
Model 4:
B = a 0 D a 1 H a 2
Model 5:
B = exp a 0 + a 1 ln H × D 2
Model 5: The Akaike information criterion (AIC) statistics were used to assess the model complexity and its goodness of fit, with preference being given to the model with a smaller AIC value. Using the AIC minimization criterion, the optimal model form for the aboveground biomass, belowground biomass, and total biomass in terms of the univariate and bivariate combinations was selected.

2.2.2. Proportional Function Control Method

The basic principle of the proportional function control method is to directly fit the total biomass model and then assign the total biomass to the aboveground biomass and the belowground biomass. The method is specified below.
Steps: based on the optimal model form for the total biomass (Bt) in Section 2.2.1, B t = f 1 D and B t = f 2 D , H were developed to obtain the estimated value of the total biomass under two dimensions. Then, the scale function under two dimensions was set to: g 1 D = b 1 D c 1 and g 1 D , H = d 1 D e 1 H f 1 . With the estimated total biomass as the control, the biomasses of the two components were combined into a simultaneous equations system, and the parameters of the system were estimated by nonlinear seemingly unrelated regression. The univariate and bivariate additive allometric biomass model systems were expressed as follows:
B a = 1 1 + g 1 D × f 1 D + ε 1 B b = g 1 D 1 + g 1 D × f 1 D + ε 2
B a = 1 1 + g 1 D , H × f 2 D , H + ε 1 B b = g 1 D , H 1 + g 1 D , H × f 2 D , H + ε 2

2.2.3. Algebraic Sum Control Method

The basic principle of the algebraic sum control method is that the aboveground biomass, belowground biomass, and total biomass are combined into equations, and the total biomass model is obtained by adding the two-component models. The regression model of each component contains its own independent variables. The method is specified below.
Steps: based on the optimal model form from Section 2.2.1, the optimal model form of the aboveground biomass (Ba) in two dimensions was determined as follows: B a = m 1 D and B a = m 2 D , H , and the optimal model form of the belowground biomass (Bb) under the two dimensions was calculated as follows: B b = n 1 D and B b = n 2 D , H . The two biomass components and the total biomass were combined into a set of equations, and the parameters of the equations were estimated by nonlinear seemingly uncorrelated regression. The univariate and bivariate additive allometric biomass model systems were expressed as follows:
B a = m 1 D + ε 1 B b = n 1 D + ε 2 B t = m 1 D + n 1 D + ε 3
B a = m 2 D , H + ε 1 B b = n 2 D , H + ε 2 B t = m 2 D , H + n 2 D , H + ε 3

2.2.4. Model Evaluation

The coefficient of determination (R2) represents the ratio of the proportion of the variance that is explained by the independent variable to the variance of the dependent variable. When R2 is close to 1, it indicates that the model can explain the change in the dependent variable well. The root mean square error (RMSE) measures the average deviation between the observed and predicted values. The smaller the RMSE, the better the predictive ability of the model. The formulae for the R2 and RMSE are specified below:
R M S E = 1 n i = 1 n M i M ^ i 2
R 2 = 1 i = 1 n ( M i M ^ i ) 2 i = 1 n ( M i M ¯ ) 2
where, M i is the measured value (%), M ^ i is the predicted value (%), M ¯ is the average measured value (%), and n is the sample number.
Figure 1 shows the data collection and analysis process. All the statistical calculations were performed using R 4.3.1 [42]. The systemfit package was used to estimate the parameters of the simultaneous equations [43]. The ggplot2 package (version 3.4.4) was used to display the data [44].

3. Results

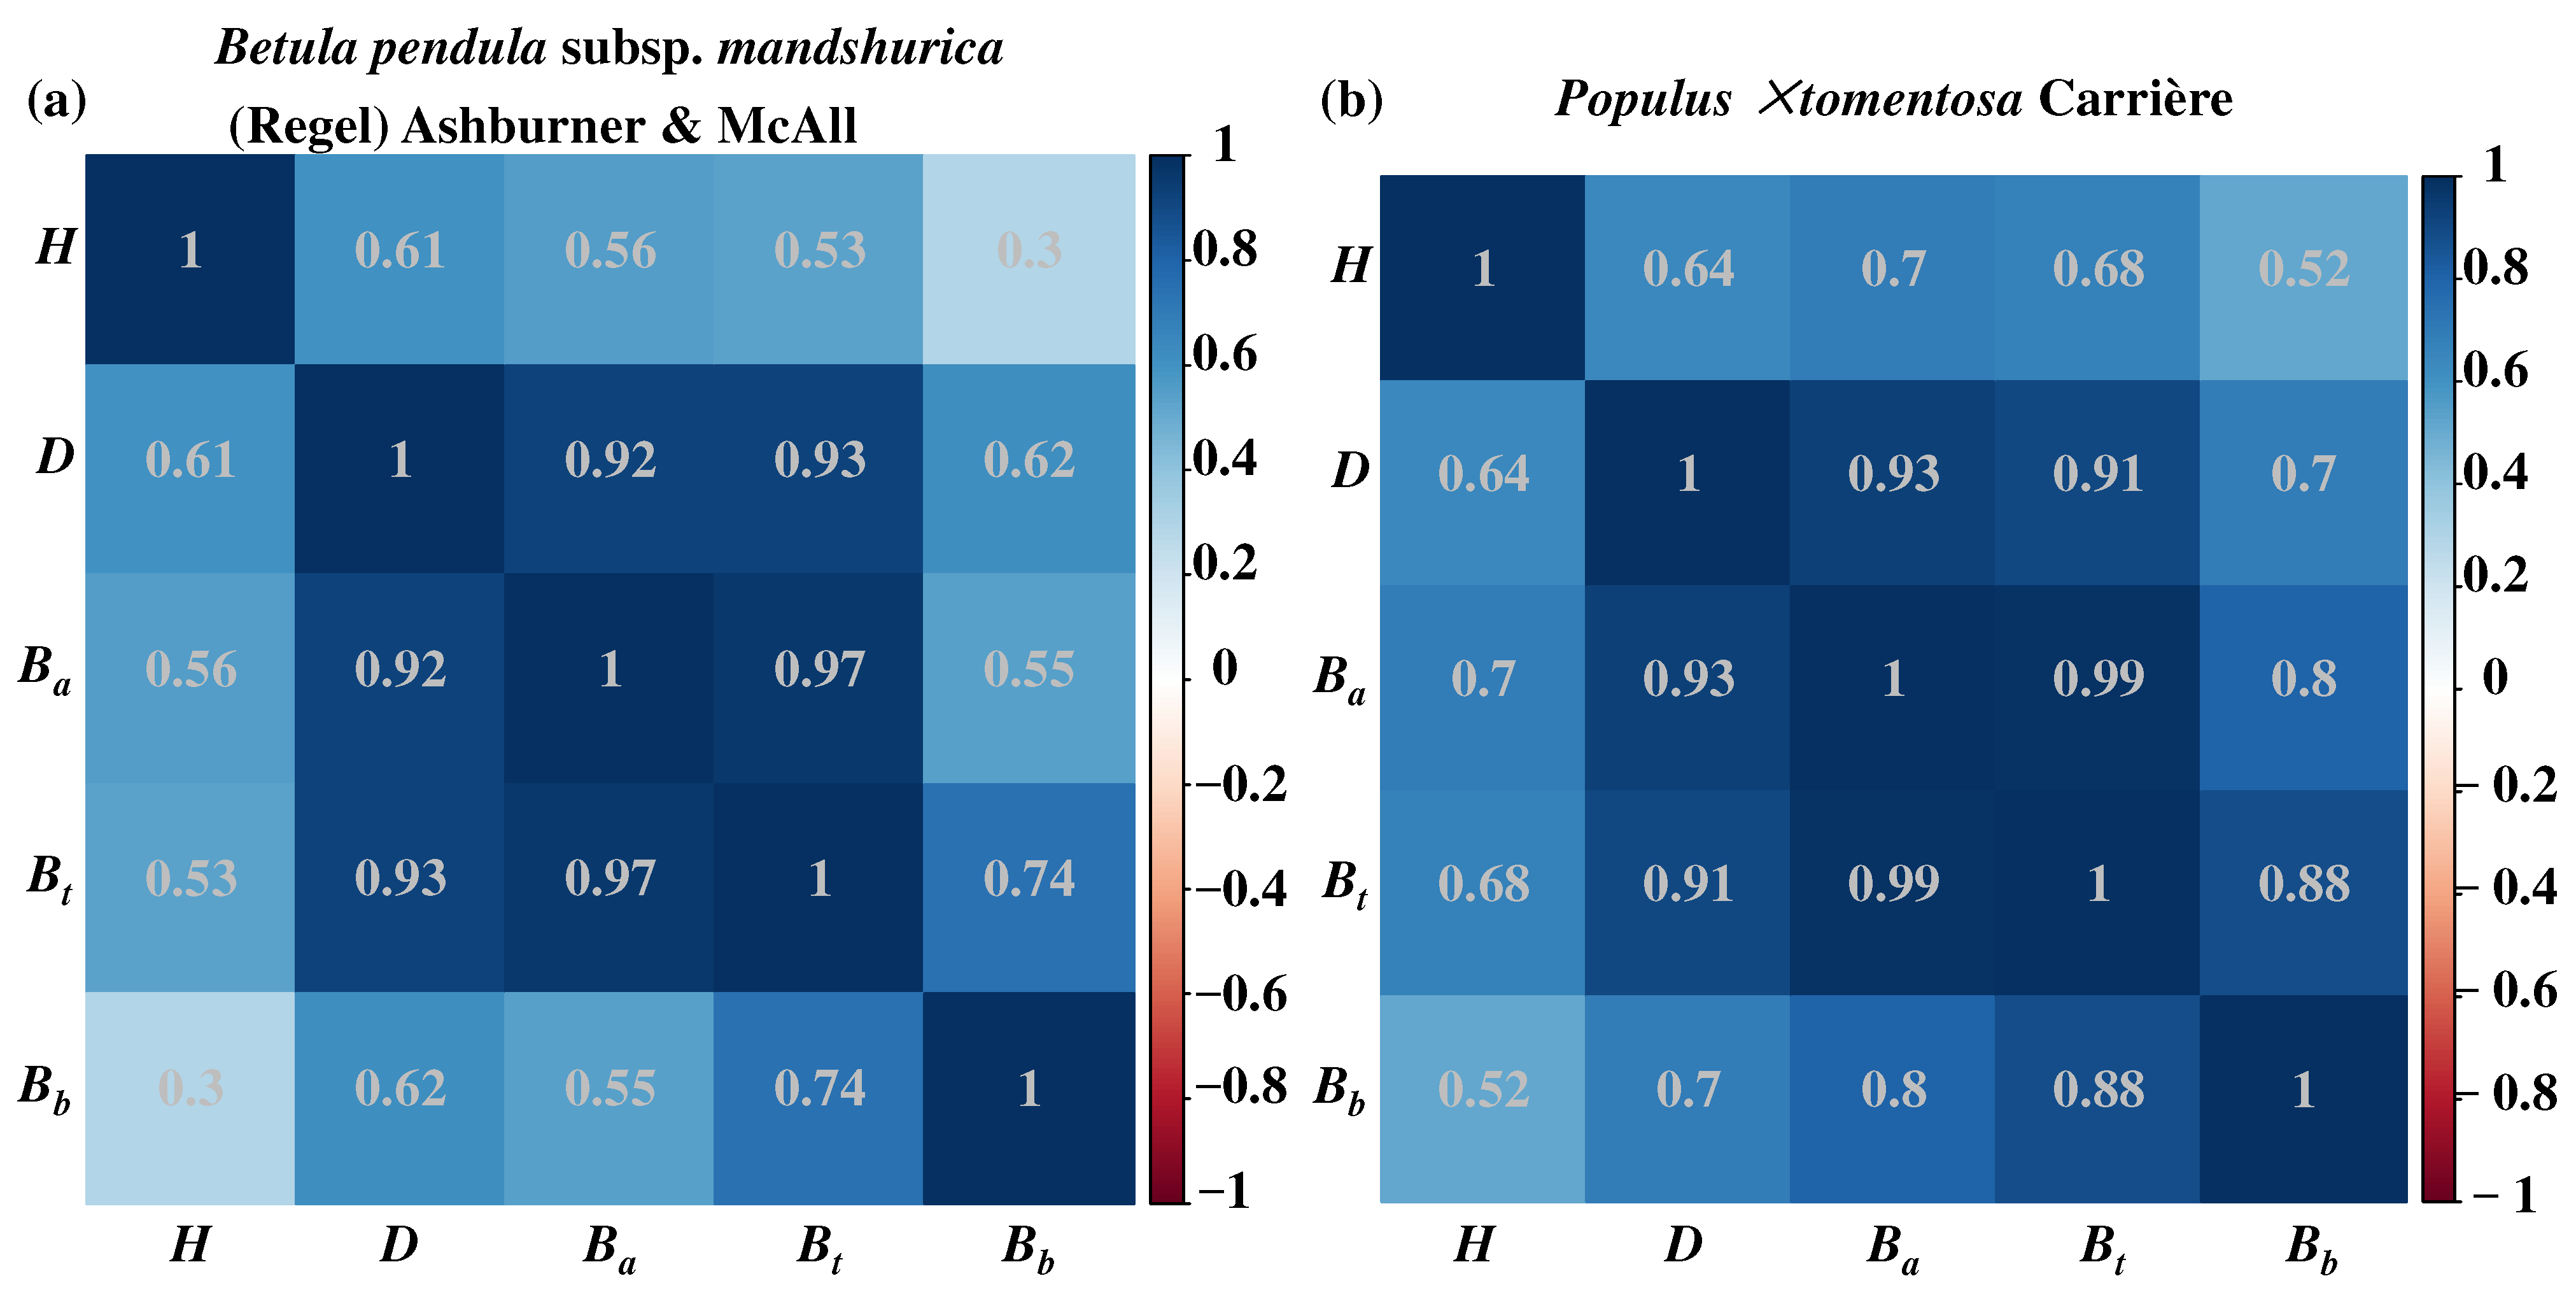
3.1. Correlation Analysis of Variables

The correlation analysis results are shown in Figure 2. Both D and H were positively correlated with Ba, Bb, and Bt. The correlation coefficient of Betula pendula subsp. mandshurica (Regel) Ashburner & McAll ranged from 0.3 to 0.97. The correlation coefficient of Populus × tomentosa Carrière ranged from 0.52 to 0.99.
The stacked kernel density of Ba, Bb, and Bt is shown in Figure 3. Skewness is a measure of the asymmetry degree in data distribution. The skewness of Betula pendula subsp. mandshurica (Regel) Ashburner & McAll ranged from 0.4973 to 2.0447, and that of Populus × tomentosa Carrière ranged from 0.7338 to 2.0037. The asymmetry degree of Bb is higher, and the asymmetry degree of Ba and Bt is lower.

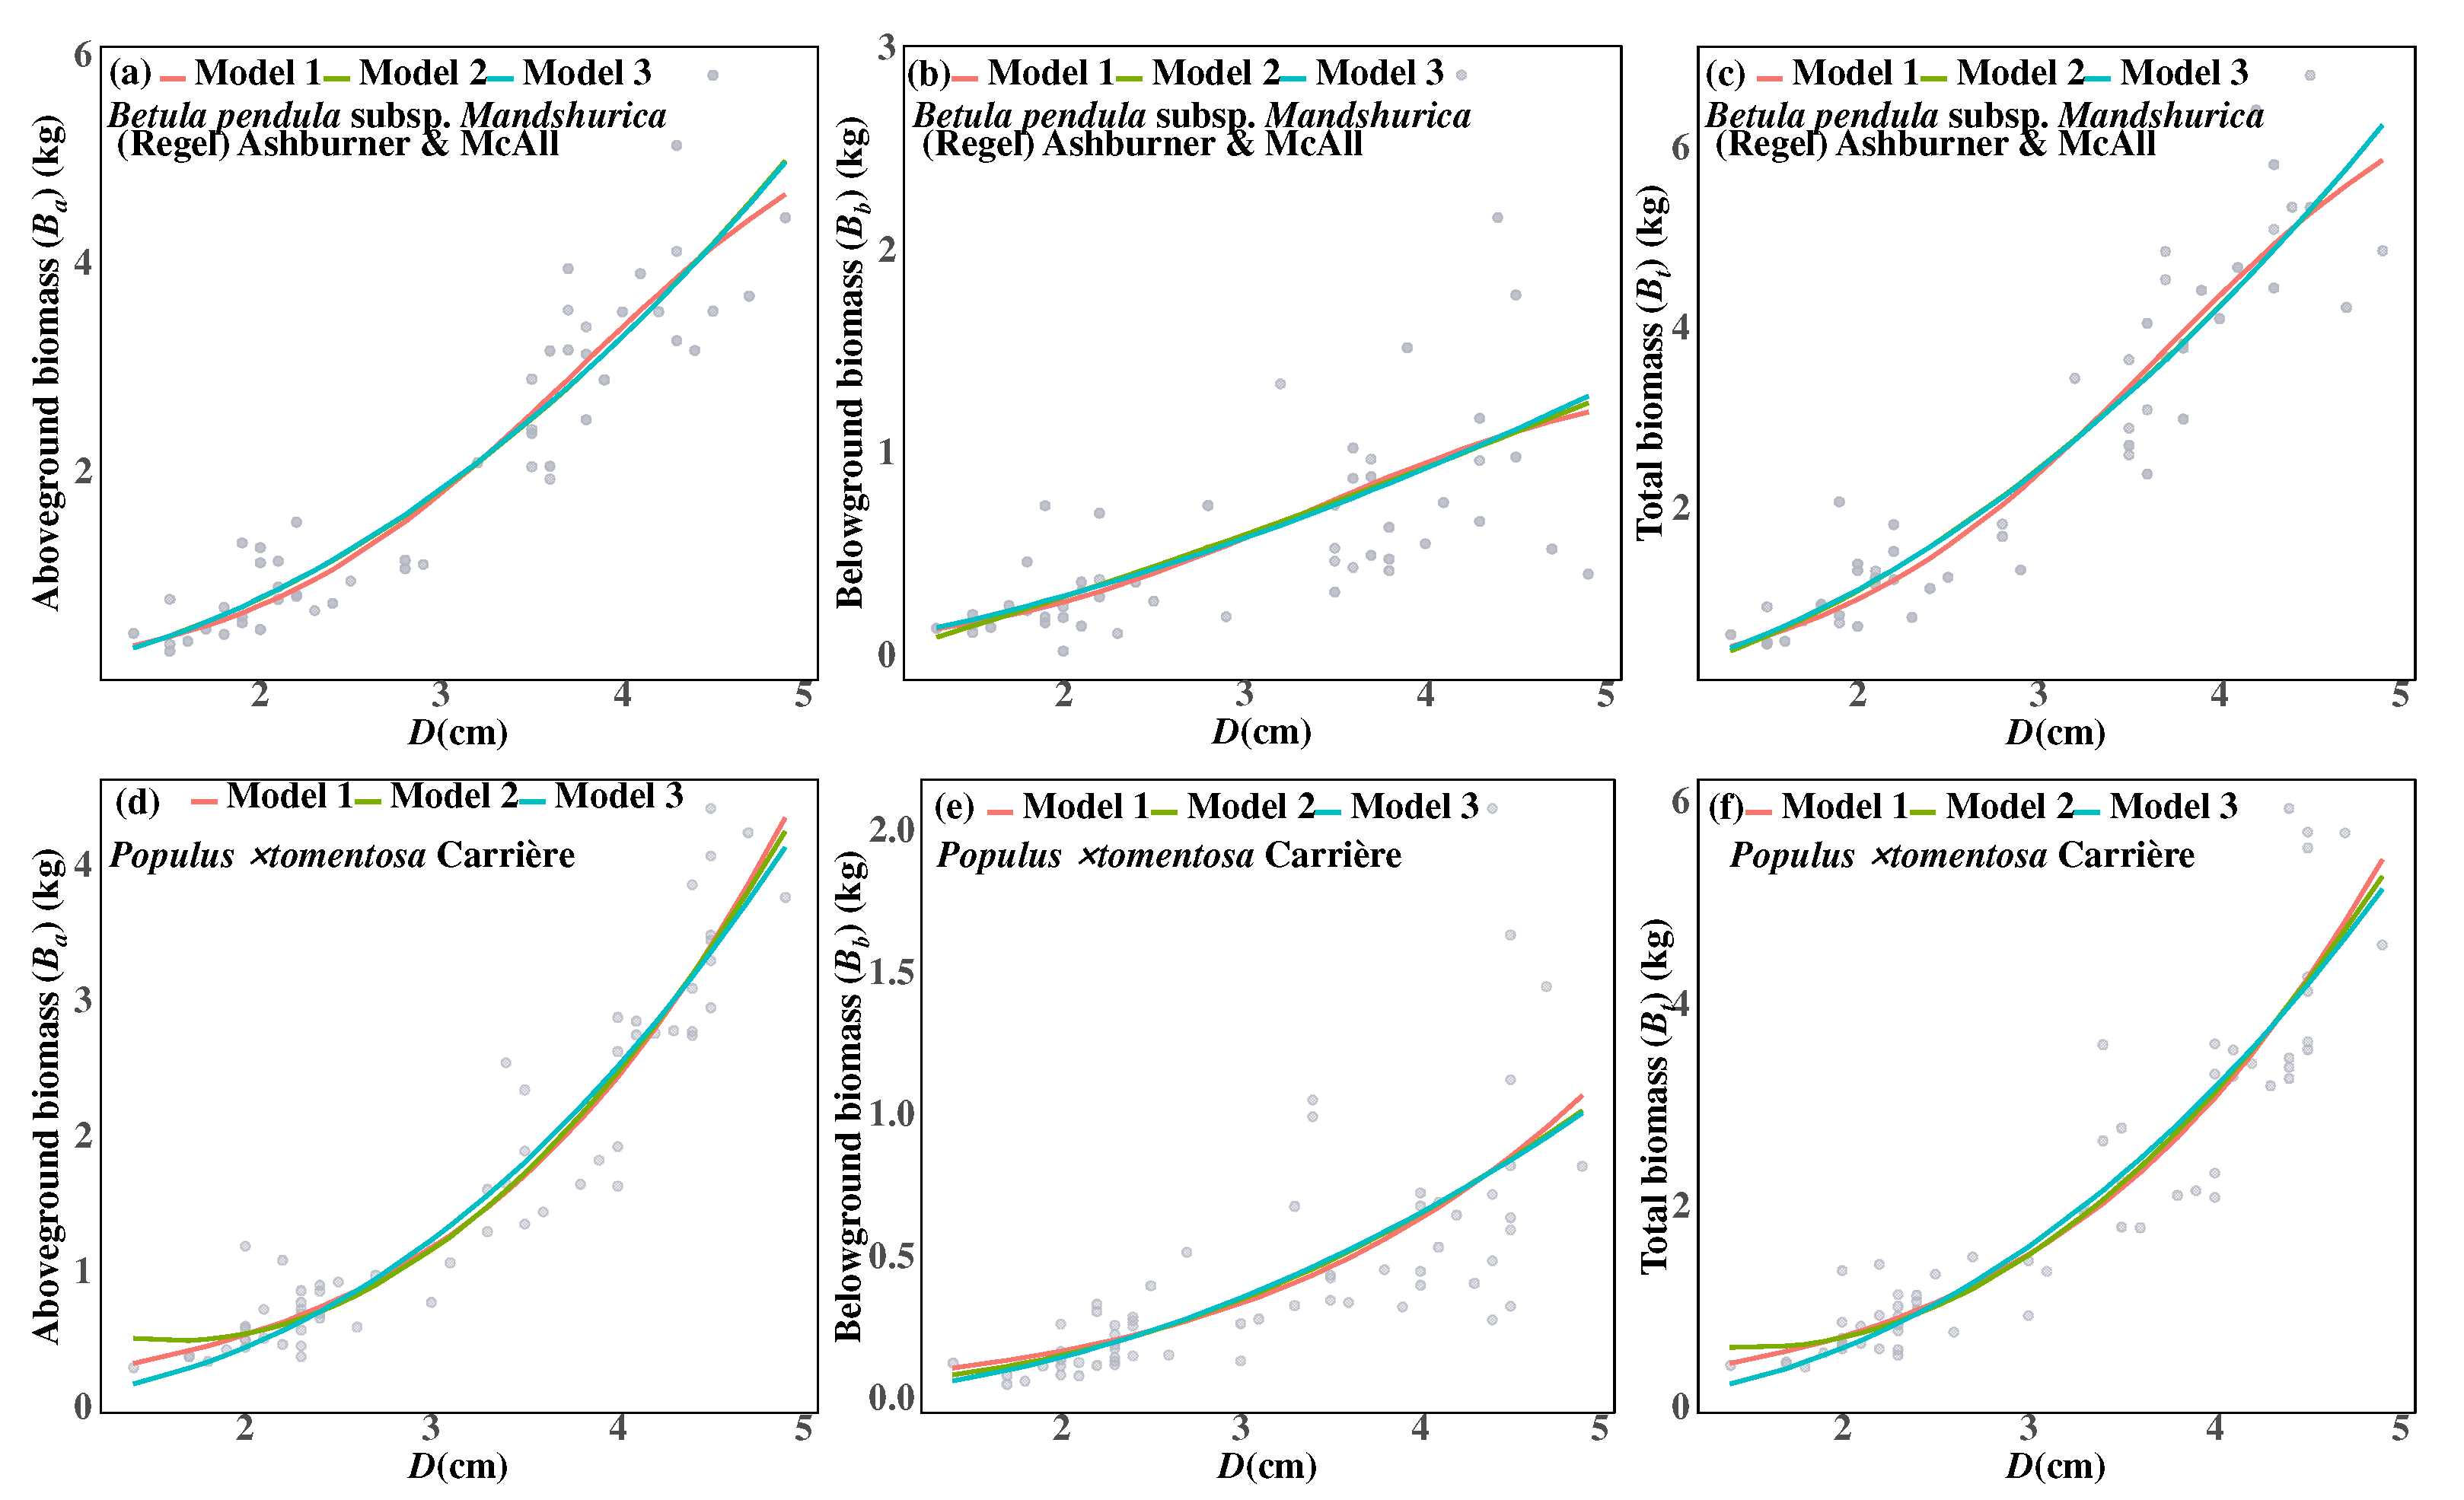
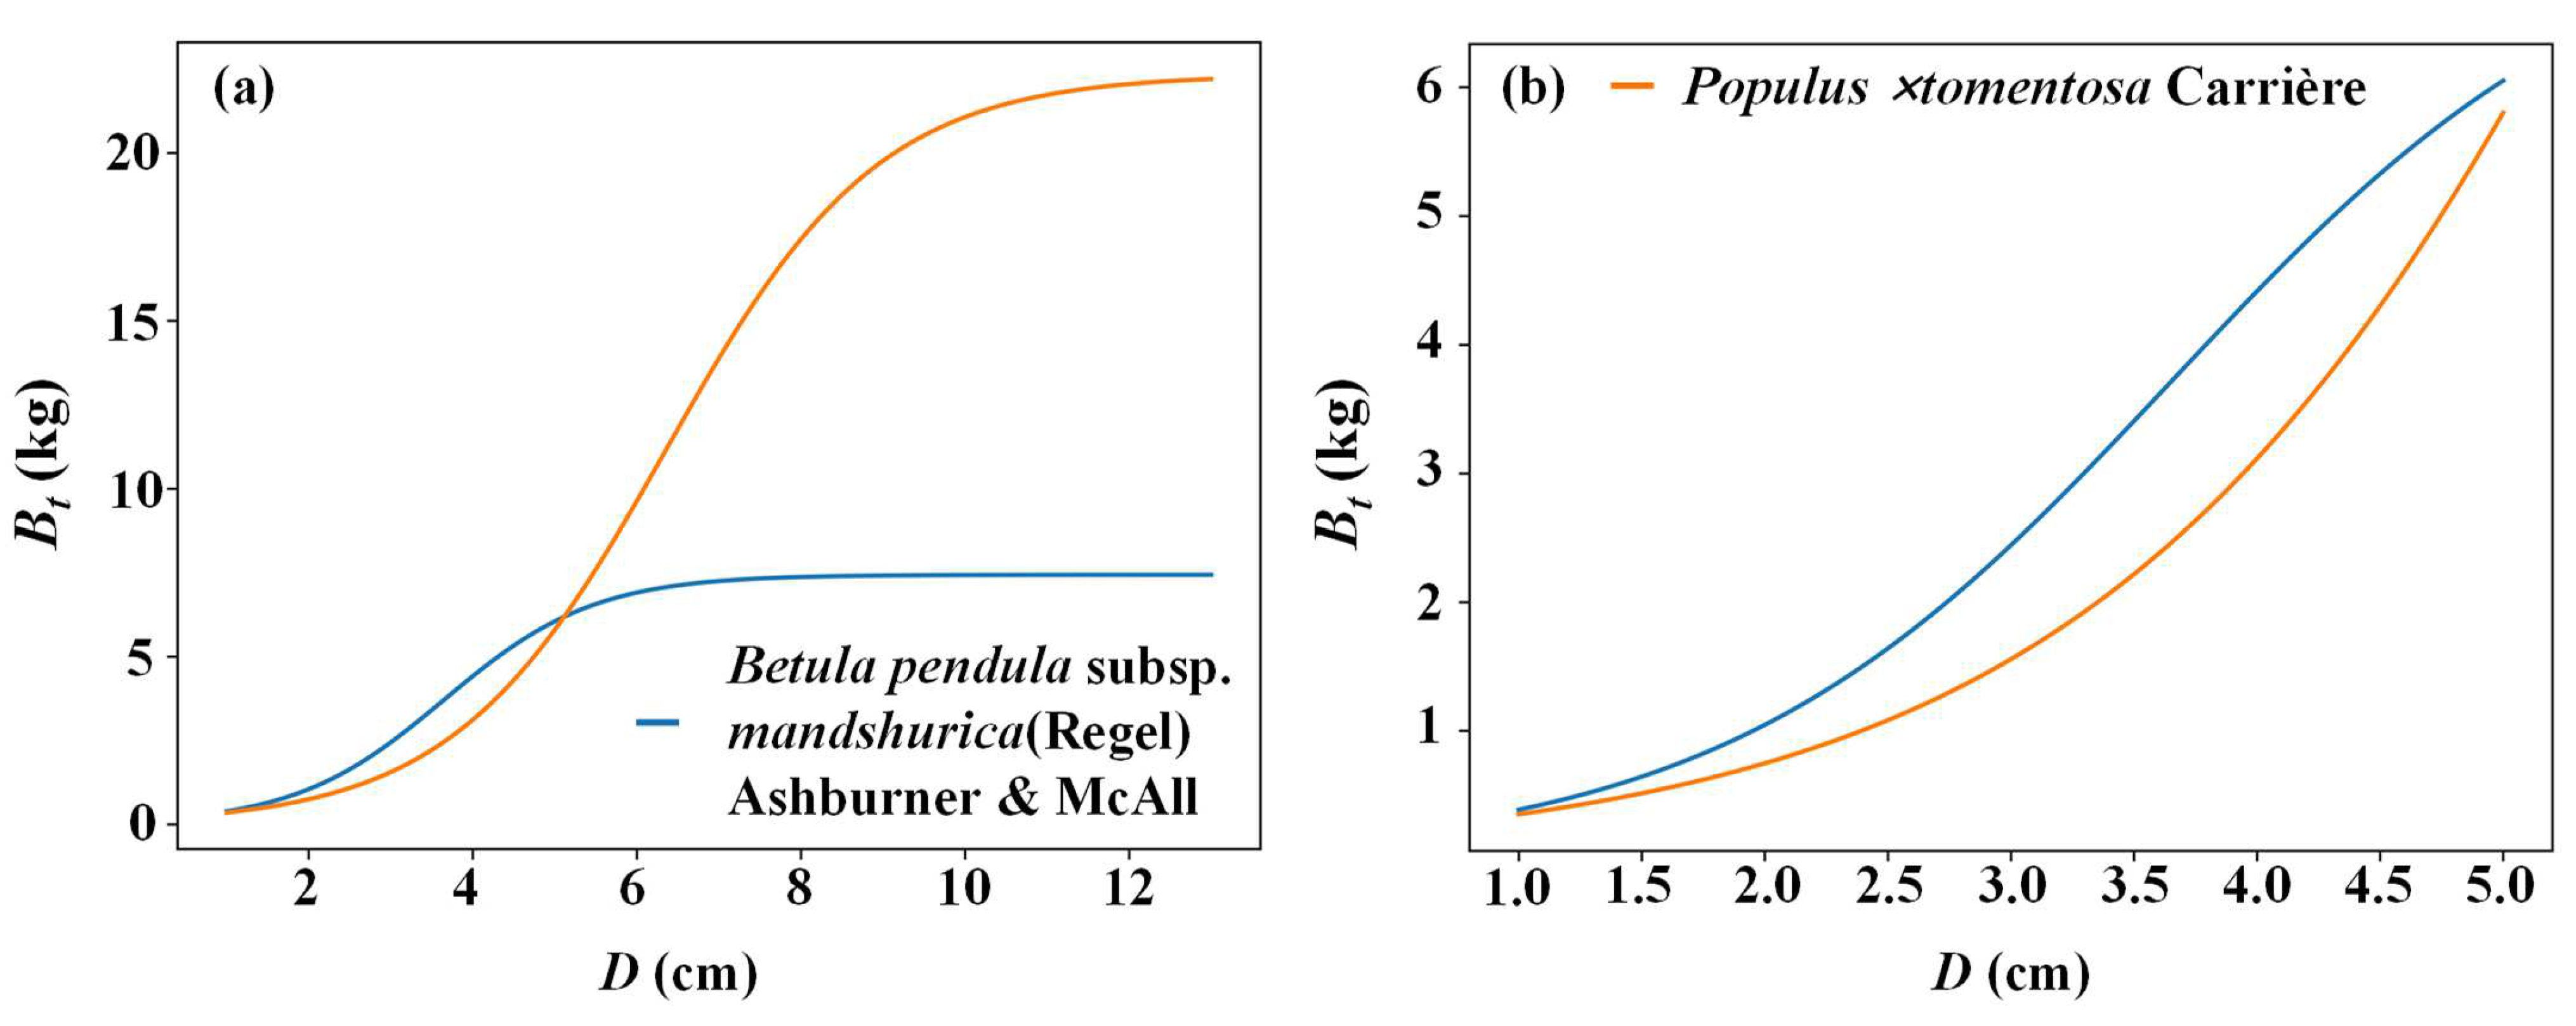
3.2. Analysis of the Independent Fitting Model

Based on the AIC minimization principle, the optimal model form was selected from the five candidate models. In the univariate dimension, the optimal model form for the aboveground biomass of the two species was Model 1, the optimal model form for the belowground biomass was Model 3, and the optimal model form for the total biomass was Model 1 (Figure 4, Table 2). In the bivariate dimension, the optimal model form for the aboveground biomass, belowground biomass, and total biomass of the two species was Model 4 (Table 3).

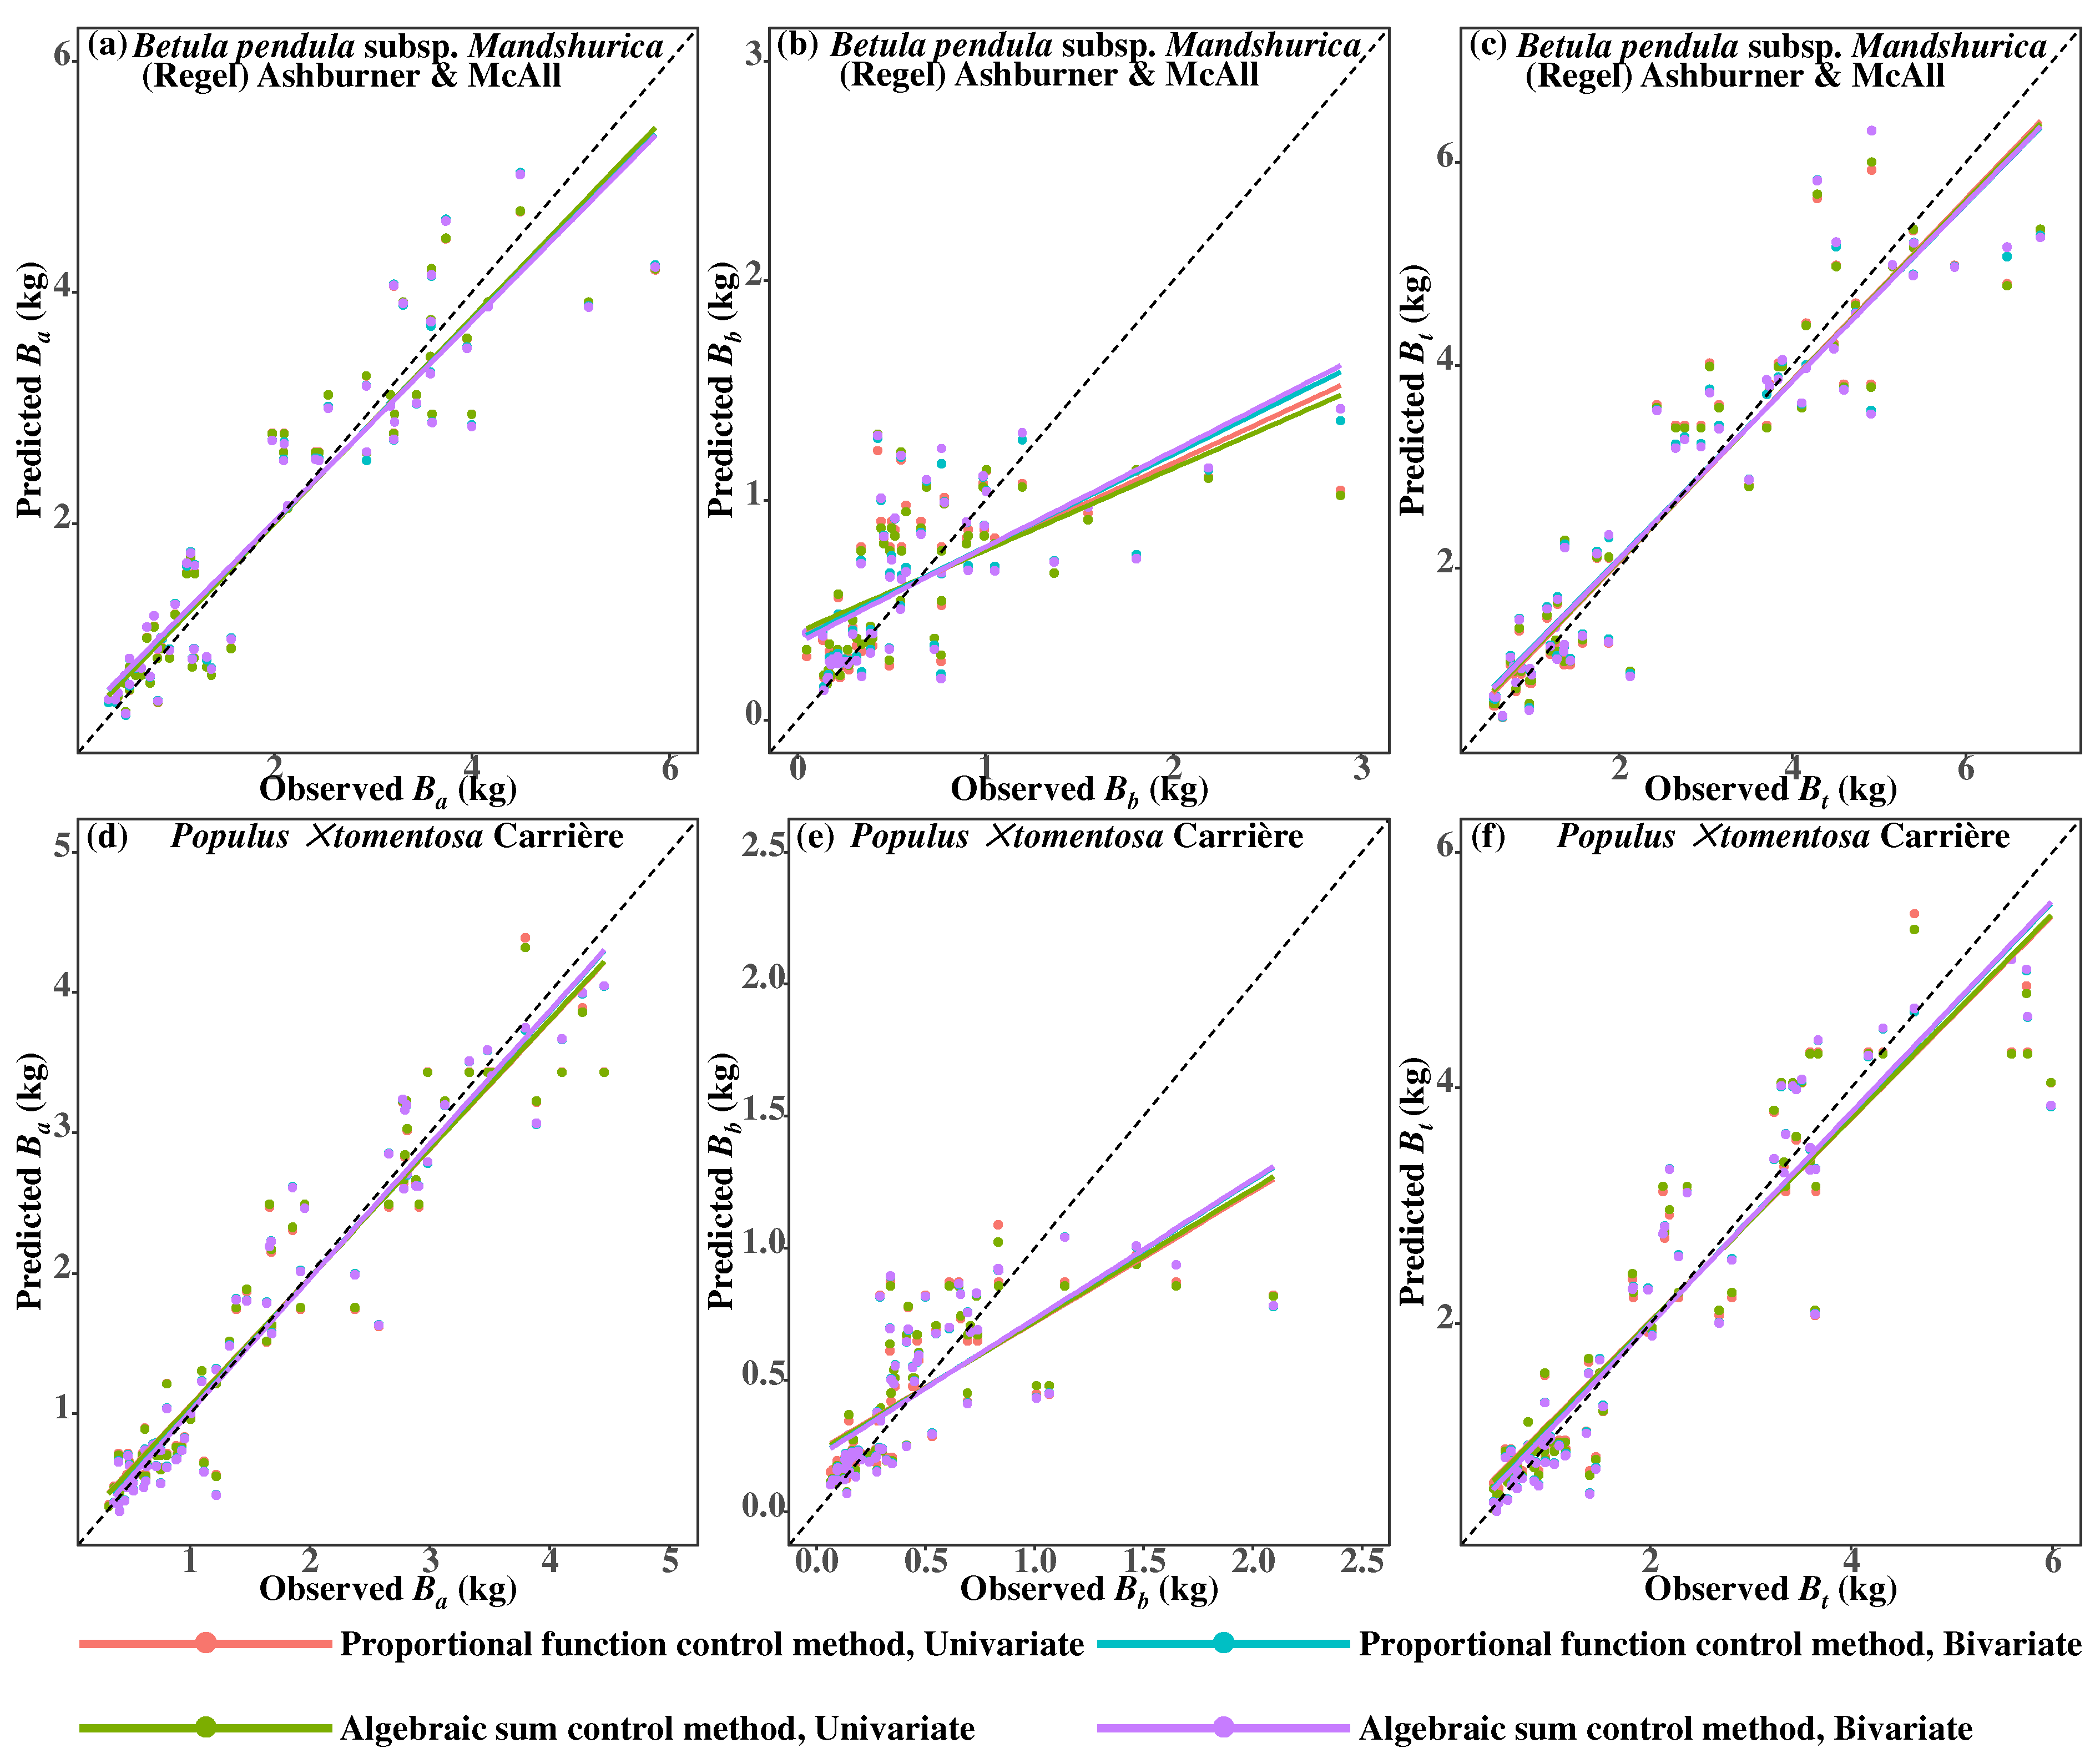
3.3. Analysis of the Two Additive Allometric Biomass Models

According to the estimation results of the optimal total biomass that was selected in Table 2 and Table 3, the proportional function was set and the equations were combined into simultaneous equations. The parameter estimation of the proportional function control method is shown in Table 4. According to the optimal model forms for the aboveground and belowground biomass that were selected in Table 2 and Table 3, the equations were combined into simultaneous equations. The parameter estimation using the algebraic sum control methods is shown in Table 5.
Figure 5 shows the logistic function results in Table 4. Both coefficients of the logistic function have ecological significance; a0 refers to the equilibrium biomass and −a2 is the growth rate relative to the equilibrium biomass. A larger −a2 value indicates that individual trees will rapidly increase in biomass at a younger stage, which is known as the equilibrium growth rate.
The results showed that the equilibrium biomass of Bt and Ba of Populus × tomentosa Carrière was higher than that of Betula pendula subsp. mandshurica (Regel) Ashburner & McAll. The equilibrium growth rate of Bt and Ba of Betula pendula subsp. mandshurica (Regel) Ashburner & McAll is higher than that of Populus × tomentosa Carrière (Table 4 and Table 5).
The parameter estimation processes of the two additive allometric biomass models were different but the accuracy performance of the models was similar. For the proportional function control method, the R2 of the total biomass model and aboveground biomass model was higher (0.861–0.9292) when compared with the R2 of the belowground biomass model (0.3899–0.5101). For the algebraic sum control methods, the R2 of the total biomass model and aboveground biomass model was high (0.8604–0.9293), while the R2 of the belowground biomass model was low (0.3795–0.5100; Table 6).
Combining the prediction accuracy of the three biomasses, the two dimensions were compared. The bivariate additive allometric biomass model system was the most accurate (Table 6). Then, the two additive methods were compared. In the univariate dimension, the proportional function control method was superior to the algebraic sum control method. In the bivariate dimension, the algebraic sum control method was superior to the proportional function control method (Table 6).
For Betula pendula subsp. mandshurica (Regel) Ashburner & McAll, the model performance was optimal when the algebraic sum control methods were used in the bivariate dimension (total biomass model: R2 = 0.8804, aboveground biomass model: R2 = 0.8753, belowground biomass model: R2 = 0.4239). For Populus × tomentosa Carrière, the model performance was optimal when the algebraic sum control methods were used in the bivariate dimension (total biomass model: R2 = 0.8786, aboveground biomass model: R2 = 0.9293, belowground biomass model: R2 = 0.5100; Figure 6).
In addition, we conducted validation and found that the two additive allometric biomass models were additive and met the needs of practical applications, and the independent regression models were not additive (Figure 7).

4. Discussion

A robust allometric biomass model should be built from a large number of data samples. When the sample size of the biomass data is relatively small, the accuracy of the model may be reduced. Consequently, this study included 167 young trees, which was sufficient to conduct robust biomass modeling for two tree species. Wang (2006) established independent biomass models with only 10 trees per species using biomass data from Pinus koraiensis and Larix gmelinii [45]. Additionally, Zheng et al. (2022) used the biomass data from 137 young trees on the Qinghai–Tibet Plateau to establish independent biomass models with the ground diameter instead of the diameter at breast height as a predictor [37]. Wang et al. used destructive biomass data from 501 trees in three provinces of young trees in northeast China to establish a biomass model [13]. Furthermore, Dong et al. (2014) established an additive allometric biomass model system with sample sizes of 41 Pinus koraiensis and 122 Larix gmelinii [46]. Then, Cui et al. (2020) harvested 45 Robinia pseudoacacia L. in the Loess Plateau of Shaanxi Province and established an additive allometric biomass model system [22]. This study did not collect samples from different ecological regions, so this is a potential limitation. Therefore, it is suggested that young trees of Betula pendula subsp. mandshurica (Regel) Ashburner & McAll and Populus × tomentosa Carrière should be sampled in different ecological zones in the future.
We found that the logistic function was the optimal model form for the aboveground biomass and total biomass, and the power function was more suitable for fitting the belowground biomass. Whether the traditional allometric biomass model (that is, the power function model) can fit all the observed biomass data well has been investigated by ecologists [24,47,48]. Although the power function has been verified statistically in previous biomass studies, it has been challenged theoretically [26,29]. Consistent with our study, Ma et al. (2021) found that the logistic function was superior to the power function for estimating the allometry relationship of shrub biomass [29]. In addition, Zhou et al. (2021) proposed the concept of a dynamic allometric scaling relationship between the trunk biomass and aboveground biomass, which was fitted to an asymptotic allometric model, and it was verified that it could fit biomass data better than a power function [26].
As hypothesized, we found that the prediction accuracy of the model that included tree height as a predictor was significantly improved. This is consistent with many other studies [22,49,50]. In contrast, Zhang et al. (2016) discovered that the addition of tree height to the biomass model did not improve the model performance as expected, especially for the branch biomass and leaf biomass [51]. Tree height is often overlooked in forest models because it is difficult to accurately measure tree height in closed-canopy forests, and there has been substantial debate on whether to use tree height as a predictor for biomass models [52]. For young trees, it is easy to measure the tree height. Therefore, in practical applications, it is more appropriate to use the bivariate additive allometric biomass model that was developed in this study.
We have verified that the sum of the predicted values of each biomass component model was different from the predicted values of the total biomass model when using the independent fitting model. The disadvantage of the independent fitting model is that additivity is not satisfied. In contrast, the two additive allometric biomass models that were developed have clear advantages. The models of the total biomass, aboveground biomass, and belowground biomass were fitted using simultaneous equations to explain the intrinsic correlation between the biomass components of the same tree. Therefore, it is crucial to emphasize the benefit of using the additive allometric biomass model in practical applications.
There are many additive modeling methods. However, we found that the proportional function control method was superior to the algebraic sum control method in the univariate dimension, and the algebraic sum control method was superior to the proportional function control method in the bivariate dimension. Many studies have used algebraic sum and proportional function control methods to construct additive allometric biomass model systems. For instance, Liu et al. (2023) conducted destructive sampling of trees on Hainan Island and established an additive allometric biomass model using the algebraic sum control method, which satisfied the additivity of the aboveground biomass, branch biomass, and leaf biomass [19]. Furthermore, Wang et al. (2018) established an additive allometric biomass model based on diameter at breast height and height in a young forest of Betula pendula subsp. mandshurica (Regel) Ashburner & McAll in northeast China using the algebraic sum control method [13]. Moreover, Fu et al. (2016) established an additive allometric biomass model with Pinus massoniana Lamb. in southern China using the algebraic sum control method [38]. Then, Zhang et al. (2016) established one-, two-, and three-variable additive allometric biomass models for Populus × tomentosa Carrière in the Jiangsu Province, China using the proportional function control method [51]. Zeng et al. (2017) realized the additivity between the aboveground biomass and four biomass components, the trunk, bark, branches, and leaves [53]. The proportional function control method is first fitted to the whole tree biomass, and then the proportional function is used to allocate the tree biomass to each biomass component. The algebraic sum control method is used to directly model the biomass component, and then the total biomass is obtained by adding the biomasses of each component. In the practice of forestry production, the goal is to obtain the whole tree biomass or the aboveground biomass, so the additive model that is developed using the proportional function control method is more practical.
Whether the sample data need to be divided into modeling data and testing data is still a controversial issue. Some studies suggest that the applicability of evaluating the predictive ability of the model by calculating the evaluation index of the modeling data must be tested [54]. However, Kozak and Kozak (2003) concluded that grouping samples for suitability tests would result in the loss of part of the modeling information and would not provide additional information for model evaluation [55]. To make full use of the sample information, this study did not distinguish between modeling samples and test samples, and all the sample data were used to build the biomass models.

5. Conclusions

In this study, two additive allometric biomass model systems of young trees of Betula pendula subsp. mandshurica (Regel) Ashburner & McAll and Populus × tomentosa Carrière were established, these provide a theoretical reference and technical support for estimating the biomass of young trees at a single tree scale. The two yield table is given for the application of the model (Tables S2 and S3). Our research results will provide a quantitative basis for the monitoring of carbon stocks and carbon sink evaluation of young trees in China. We found that the logistic function was more suitable for explaining the allometric growth relationship between the aboveground biomass, total biomass, and diameter at breast height of young trees; the power function was more suitable for explaining the allometric growth relationship between the belowground biomass and diameter at breast height of young trees. In the actual modeling process, an appropriate model form should be selected for the different biomass components since the biomass results of independent fitting models are not additive. The bivariate additive allometric model system has higher accuracy. Thus, in practical applications, we recommend the bivariate additive allometric model as the first choice. There was no consensus on which of the two additive methods was better. In the univariate dimension, the proportional function control method was superior to the algebraic sum control method. In the bivariate dimension, the algebraic sum control method was superior to the proportional function control method. In the actual modeling process, it is necessary to compare the methods and choose the best additive method.
The biomass of young trees is influenced by a variety of abiotic and biological factors, including climate, stand structure, and site conditions. Thus, it is suggested that future studies should consider including these factors as additional predictors. Mixed effect models have been shown to have advantages in improving the accuracy of model estimation. Therefore, the biomass prediction could be improved by combining the mixed effect model with the additive model.

Supplementary Materials

The following supporting information can be downloaded at: https://www.mdpi.com/article/10.3390/f15060991/s1, Table S1: Location and basic stand factors of 50 plantations plots. Table S2: Yield table of Betula pendula subsp. mandshurica (Regel) Ashburner & McAll. Table S3: Yield table of Populus × tomentosa Carrière.

Author Contributions

S.W.: Conceptualization, Formal analysis, Writing—Original draft preparation; Z.F.: Conceptualization, Formal analysis, Writing—Reviewing and Editing; Z.W.: Conceptualization, Formal analysis, Writing—Reviewing and Editing; L.H.: Formal analysis, Writing—Reviewing and Editing; T.M.: Investigation, Writing—Reviewing and Editing; X.Y.: Investigation, Writing—Reviewing and Editing; H.F.: Investigation, Writing—Reviewing and Editing; J.L.: Investigation, Writing—Reviewing and Editing. All authors have read and agreed to the published version of the manuscript.

Funding

This study was supported by 5·5 Engineering Research & Innovation Team Project of Beijing Forestry University (BLRC2023A03), the Natural Science Foundation of Beijing (8232038, 8234065), and the Key Research and Development Projects of Ningxia Hui Autonomous Region (2023BEG02050).

Data Availability Statement

The data used to support the findings of this study are available from the corresponding author upon request.

Acknowledgments

The authors would like to thank all the reviewers who participated in the review.

Conflicts of Interest

The authors declare no conflicts of interest.

References

  1. Eker, M.; Poudel, K.P.; Özçelik, R. Aboveground Biomass Equations for Small Trees of Brutian Pine in Turkey to Facilitate Harvesting and Management. Forests 2017, 8, 477. [Google Scholar] [CrossRef]
  2. Pan, Y.; Birdsey, R.A.; Fang, J.; Houghton, R.; Kauppi, P.E.; Kurz, W.A.; Phillips, O.L.; Shvidenko, A.; Lewis, S.L.; Canadell, J.G. A Large and Persistent Carbon Sink in the World’s Forests. Science 2011, 333, 988–993. [Google Scholar] [CrossRef]
  3. Gómez-García, E. Estimating the Changes in Tree Carbon Stocks in Galician Forests (NW Spain) between 1972 and 2009. For. Ecol. Manag. 2020, 467, 118157. [Google Scholar] [CrossRef]
  4. Dixon, R.K.; Solomon, A.M.; Brown, S.; Houghton, R.A.; Trexier, M.C.; Wisniewski, J. Carbon Pools and Flux of Global Forest Ecosystems. Science 1994, 263, 185–190. [Google Scholar] [CrossRef]
  5. Wang, S.; Zhang, H.; Feng, Z.; Wang, Y.; Su, J.; Gao, K.; Li, J. Dispersal Limitation Dominates the Spatial Distribution of Forest Fuel Loads in Chongqing, China. Ecosyst. Health Sustain. 2023, 9, 0079. [Google Scholar] [CrossRef]
  6. Zhang, H.; Feng, Z.; Shen, C.; Li, Y.; Feng, Z.; Zeng, W.; Huang, G. Relationship between the Geographical Environment and the Forest Carbon Sink Capacity in China Based on an Individual-Tree Growth-Rate Model. Ecol. Indic. 2022, 138, 108814. [Google Scholar] [CrossRef]
  7. Zhang, H.; Feng, Z.; Chen, P.; Chen, X. Development of a Tree Growth Difference Equation and Its Application in Forecasting the Biomass Carbon Stocks of Chinese Forests in 2050. Forests 2019, 10, 582. [Google Scholar] [CrossRef]
  8. Bilgili, E.; Kucuk, O. Estimating Above-Ground Fuel Biomass in Young Calabrian Pine (Pinus brutia Ten.). Energy Fuels 2009, 23, 1797–1800. [Google Scholar]
  9. Yuen, J.Q.; Fung, T.; Ziegler, A.D. Review of Allometric Equations for Major Land Covers in SE Asia: Uncertainty and Implications for above-and below-Ground Carbon Estimates. For. Ecol. Manag. 2016, 360, 323–340. [Google Scholar] [CrossRef]
  10. Luo, Y.; Wang, X.; Ouyang, Z.; Lu, F.; Feng, L.; Tao, J. A Review of Biomass Equations for China’s Tree Species. Earth Syst. Sci. Data 2020, 12, 21–40. [Google Scholar] [CrossRef]
  11. Huang, H.; Liu, C.; Wang, X.; Zhou, X.; Gong, P. Integration of Multi-Resource Remotely Sensed Data and Allometric Models for Forest Aboveground Biomass Estimation in China. Remote Sens. Environ. 2019, 221, 225–234. [Google Scholar] [CrossRef]
  12. Chaturvedi, R.K.; Raghubanshi, A.S. Aboveground Biomass Estimation of Small Diameter Woody Species of Tropical Dry Forest. New For. 2013, 44, 509–519. [Google Scholar] [CrossRef]
  13. Wang, X.; Zhao, D.; Liu, G.; Yang, C.; Teskey, R.O. Additive Tree Biomass Equations for Betula Platyphylla Suk. Plantations in Northeast China. Ann. For. Sci. 2018, 75, 60. [Google Scholar] [CrossRef]
  14. Bond-Lamberty, B.; Wang, C.; Gower, S.T. Aboveground and Belowground Biomass and Sapwood Area Allometric Equations for Six Boreal Tree Species of Northern Manitoba. Can. J. For. Res. 2002, 32, 1441–1450. [Google Scholar] [CrossRef]
  15. Daryaei, A.; Sohrabi, H. Additive Biomass Equations for Small Diameter Trees of Temperate Mixed Deciduous Forests. Scand. J. For. Res. 2016, 31, 394–398. [Google Scholar] [CrossRef]
  16. Nelson, A.S.; Weiskittel, A.R.; Wagner, R.G.; Saunders, M.R. Development and Evaluation of Aboveground Small Tree Biomass Models for Naturally Regenerated and Planted Species in Eastern Maine, USA. Biomass Bioenergy 2014, 68, 215–227. [Google Scholar] [CrossRef]
  17. Alvarez, E.; Duque, A.; Saldarriaga, J.; Cabrera, K.; de Las Salas, G.; del Valle, I.; Lema, A.; Moreno, F.; Orrego, S.; Rodríguez, L. Tree Above-Ground Biomass Allometries for Carbon Stocks Estimation in the Natural Forests of Colombia. For. Ecol. Manag. 2012, 267, 297–308. [Google Scholar] [CrossRef]
  18. Zeng, W.; Tang, S. Modeling Compatible Single-Tree Aboveground Biomass Equations for Masson Pine (Pinus Massoniana) in Southern China. J. For. Res. 2012, 23, 593–598. [Google Scholar] [CrossRef]
  19. Liu, B.; Bu, W.; Zang, R. Improved Allometric Models to Estimate the Aboveground Biomass of Younger Secondary Tropical Forests. Glob. Ecol. Conserv. 2023, 41, e02359. [Google Scholar] [CrossRef]
  20. Cole, T.G.; Ewel, J.J. Allometric Equations for Four Valuable Tropical Tree Species. For. Ecol. Manag. 2006, 229, 351–360. [Google Scholar] [CrossRef]
  21. Zhou, X.; Brandle, J.R.; Schoeneberger, M.M.; Awada, T. Developing Above-Ground Woody Biomass Equations for Open-Grown, Multiple-Stemmed Tree Species: Shelterbelt-Grown Russian-Olive. Ecol. Model. 2007, 202, 311–323. [Google Scholar] [CrossRef]
  22. Cui, Y.; Bi, H.; Liu, S.; Hou, G.; Wang, N.; Ma, X.; Zhao, D.; Wang, S.; Yun, H. Developing Additive Systems of Biomass Equations for Robinia pseudoacacia L. in the Region of Loess Plateau of Western Shanxi Province, China. Forests 2020, 11, 1332. [Google Scholar] [CrossRef]
  23. Rutishauser, E.; Noor’an, F.; Laumonier, Y.; Halperin, J.; Hergoualc’h, K.; Verchot, L. Generic Allometric Models Including Height Best Estimate Forest Biomass and Carbon Stocks in Indonesia. For. Ecol. Manag. 2013, 307, 219–225. [Google Scholar] [CrossRef]
  24. Picard, N.; Rutishauser, E.; Ploton, P.; Ngomanda, A.; Henry, M. Should Tree Biomass Allometry Be Restricted to Power Models? For. Ecol. Manag. 2015, 353, 156–163. [Google Scholar] [CrossRef]
  25. Xiong, N.; Qiao, Y.; Ren, H.; Zhang, L.; Chen, R.; Wang, J. Comparison of Parameter Estimation Methods Based on Two Additive Biomass Models with Small Samples. Forests 2023, 14, 1655. [Google Scholar] [CrossRef]
  26. Zhou, X.; Yang, M.; Liu, Z.; Li, P.; Xie, B.; Peng, C. Dynamic Allometric Scaling of Tree Biomass and Size. Nat. Plants 2021, 7, 42–49. [Google Scholar] [CrossRef]
  27. Zheng, X.-J.; Wang, Y.-G.; Wu, X.; Ren, W.; Wu, Y.; Li, Y.; Cao, X.; Ma, J.; Zhou, H. An Expanded Allometric Model for Crowns of Four Co-Existing Desert Shrubs. Trees 2019, 33, 1423–1433. [Google Scholar] [CrossRef]
  28. Bertsimas, D.; King, A. Logistic Regression: From Art to Science. Stat. Sci. 2017, 32, 367–384. [Google Scholar] [CrossRef]
  29. Ma, J.; Yuan, C.; Zhou, J.; Li, Y.; Gao, G.; Fu, B. Logistic Model Outperforms Allometric Regression to Estimate Biomass of Xerophytic Shrubs. Ecol. Indic. 2021, 132, 108278. [Google Scholar] [CrossRef]
  30. Jenkins, J.C.; Birdsey, R.A.; Pan, Y. Biomass and NPP Estimation for the Mid-Atlantic Region (USA) Using Plot-level Forest Inventory Data. Ecol. Appl. 2001, 11, 1174–1193. [Google Scholar] [CrossRef]
  31. Xiao, C.-W.; Ceulemans, R. Allometric Relationships for Below-and Aboveground Biomass of Young Scots Pines. For. Ecol. Manag. 2004, 203, 177–186. [Google Scholar] [CrossRef]
  32. Mugasha, W.A.; Eid, T.; Bollandsås, O.M.; Malimbwi, R.E.; Chamshama, S.A.O.; Zahabu, E.; Katani, J.Z. Allometric Models for Prediction of Above-and Belowground Biomass of Trees in the Miombo Woodlands of Tanzania. For. Ecol. Manag. 2013, 310, 87–101. [Google Scholar] [CrossRef]
  33. Greene, W.H. Econometric Analysis; Pearson Education: Delhi, India, 2003; ISBN 81-7758-684-X. [Google Scholar]
  34. Tang, S.; Wang, Y. A Parameter Estimation Program for the Error-in-Variable Model. Ecol. Model. 2002, 156, 225–236. [Google Scholar] [CrossRef]
  35. Zeng, W.; Tang, S. Using Measurement Error Modeling Method to Establish Compatible Single-Tree Biomass Equations System; Forest Research: Beijing, China, 2010; Volume 23, pp. 797–803. [Google Scholar]
  36. Liu, Q.; Peng, D.; Huang, G.; Zeng, W.; Wang, X. Compatible standing tree volume and above-ground biomass equations for spruce (Picea asperata) in northeastern China. J. Beijing For. Univ. 2015, 37, 8–15. (In Chinese) [Google Scholar]
  37. Zheng, X.; Yi, L.; Li, Q. Developing biomass estimation models of young trees in typical plantation on the Qinghai-Tibet Plateau, China. Chin. J. Appl. Ecol. 2022, 33, 2923–2935. (In Chinese) [Google Scholar]
  38. Fu, L.; Lei, Y.; Wang, G.; Bi, H.; Tang, S.; Song, X. Comparison of Seemingly Unrelated Regressions with Error-in-Variable Models for Developing a System of Nonlinear Additive Biomass Equations. Trees 2016, 30, 839–857. [Google Scholar] [CrossRef]
  39. Fang, J.; Yoda, K. Climate and Vegetation in China II. Distribution of Main Vegetation Types and Thermal Climate. Ecol. Res. 1989, 4, 71–83. [Google Scholar] [CrossRef]
  40. Zianis, D.; Muukkonen, P.; Mäkipää, R.; Mencuccini, M. Biomass and Stem Volume Equations for Tree Species in Europe; FI: Helsinki, Finland, 2005; ISBN 951-40-1983-0. [Google Scholar]
  41. Henry, M.; Picard, N.; Trotta, C.; Manlay, R.; Valentini, R.; Bernoux, M.; Saint André, L. Estimating Tree Biomass of Sub-Saharan African Forests: A Review of Available Allometric Equations. Silva Fenn. 2011, 45, 477–569. [Google Scholar] [CrossRef]
  42. R Core Team. R: A Language and Environment for Statistical Computing; R Foundation for Statistical Computing: Vienna, Austria, 2013. [Google Scholar]
  43. Henningsen, A.; Hamann, J.D. Systemfit: A Package for Estimating Systems of Simultaneous Equations in R. J. Stat. Softw. 2008, 23, 1–40. [Google Scholar] [CrossRef]
  44. Wickham, H. Ggplot2. Wiley Interdiscip. Rev. Comput. Stat. 2011, 3, 180–185. [Google Scholar] [CrossRef]
  45. Wang, C. Biomass Allometric Equations for 10 Co-Occurring Tree Species in Chinese Temperate Forests. For. Ecol. Manag. 2006, 222, 9–16. [Google Scholar] [CrossRef]
  46. Dong, L.; Zhang, L.; Li, F. A Compatible System of Biomass Equations for Three Conifer Species in Northeast, China. For. Ecol. Manag. 2014, 329, 306–317. [Google Scholar] [CrossRef]
  47. Poorter, H.; Jagodzinski, A.M.; Ruiz-Peinado, R.; Kuyah, S.; Luo, Y.; Oleksyn, J.; Usoltsev, V.A.; Buckley, T.N.; Reich, P.B.; Sack, L. How Does Biomass Distribution Change with Size and Differ among Species? An Analysis for 1200 Plant Species from Five Continents. New Phytol. 2015, 208, 736–749. [Google Scholar] [CrossRef]
  48. Muller-Landau, H.C.; Condit, R.S.; Chave, J.; Thomas, S.C.; Bohlman, S.A.; Bunyavejchewin, S.; Davies, S.; Foster, R.; Gunatilleke, S.; Gunatilleke, N. Testing Metabolic Ecology Theory for Allometric Scaling of Tree Size, Growth and Mortality in Tropical Forests. Ecol. Lett. 2006, 9, 575–588. [Google Scholar] [CrossRef]
  49. Dong, L.; Zhang, L.; Li, F. Developing Two Additive Biomass Equations for Three Coniferous Plantation Species in Northeast China. Forests 2016, 7, 136. [Google Scholar] [CrossRef]
  50. Wang, X.; Fang, J.; Tang, Z.; Zhu, B. Climatic Control of Primary Forest Structure and DBH–Height Allometry in Northeast China. For. Ecol. Manag. 2006, 234, 264–274. [Google Scholar] [CrossRef]
  51. Zhang, C.; Peng, D.-L.; Huang, G.-S.; Zeng, W.-S. Developing Aboveground Biomass Equations Both Compatible with Tree Volume Equations and Additive Systems for Single-Trees in Poplar Plantations in Jiangsu Province, China. Forests 2016, 7, 32. [Google Scholar] [CrossRef]
  52. Chave, J.; Réjou-Méchain, M.; Búrquez, A.; Chidumayo, E.; Colgan, M.S.; Delitti, W.B.; Duque, A.; Eid, T.; Fearnside, P.M.; Goodman, R.C. Improved Allometric Models to Estimate the Aboveground Biomass of Tropical Trees. Glob. Change Biol. 2014, 20, 3177–3190. [Google Scholar] [CrossRef]
  53. Zeng, W.; Zhang, L.; Chen, X.; Cheng, Z.; Ma, K.; Li, Z. Construction of Compatible and Additive Individual-Tree Biomass Models for Pinus Tabulaeformis in China. Can. J. For. Res. 2017, 47, 467–475. [Google Scholar] [CrossRef]
  54. Shao, J. Linear Model Selection by Cross-Validation. J. Am. Stat. Assoc. 1993, 88, 486–494. [Google Scholar] [CrossRef]
  55. Kozak, A.; Kozak, R. Does Cross Validation Provide Additional Information in the Evaluation of Regression Models? Can. J. For. Res. 2003, 33, 976–987. [Google Scholar] [CrossRef]
Figure 1. Flowchart of the data collection and analysis.
Forests 15 00991 g001
Figure 2. Correlation heat map of five variables (diameter at breast height [D], tree height [H], aboveground biomass [Ba], belowground biomass [Bb], and total biomass [Bt]). Blue indicates positive correlation. Red indicates negative correlation. (a) Betula pendula subsp. mandshurica (Regel) Ashburner & McAll. (b) Populus × tomentosa Carrière.
Forests 15 00991 g002
Figure 3. Stacked kernel density plot of three biomass components (aboveground biomass [Ba], belowground biomass [Bb], and total biomass [Bt]). (a) Betula pendula subsp. mandshurica (Regel) Ashburner & McAll. (b) Populus × tomentosa Carrière.
Forests 15 00991 g003
Figure 4. Comparative analysis of three univariate candidate models (Model 1, Model 2, and Model 3) with two tree species and three biomass components (aboveground biomass [Ba], belowground biomass [Bb], and total biomass [Bt]). (ac) is the result of Betula pendula subsp. mandshurica (Regel) Ashburner & McAll. (df) is the result of Populus × tomentosa Carrière.
Forests 15 00991 g004
Figure 5. Visualizations of logistic function in Table 4. (a) Comparative analysis of the equilibrium biomass of two tree species (Betula pendula subsp. mandshurica (Regel) Ashburner & McAll and Populus × tomentosa Carrière). (b) Comparative analysis of the equilibrium growth rate of two tree species (Betula pendula subsp. mandshurica (Regel) Ashburner & McAll and Populus × tomentosa Carrière).
Forests 15 00991 g005
Figure 6. Regression results of the observed values and the predicted values of the proportional function control and algebraic sum control methods in the univariate and bivariate dimensions with two tree species and three biomass components (aboveground biomass [Ba], belowground biomass [Bb], and total biomass [Bt]). (ac) is the result of Betula pendula subsp. mandshurica (Regel) Ashburner & McAll. (df) is the result of Populus × tomentosa Carrière.
Forests 15 00991 g006
Figure 7. Additivity verification of the independent fitting model and two additive allometric biomass models (proportional function control method and algebraic sum control method). (a) Independent fitting model. (b) Proportional function control method. (c) Algebraic sum control method.
Forests 15 00991 g007
Table 1. Statistics of the tree characteristics (N, D, and H) and biomass components (Ba, Bb, and Bt) of two tree species (Betula pendula subsp. mandshurica (Regel) Ashburner & McAll and Populus × tomentosa Carrière).
Tree SpeciesND (Mean ± S.D.)H (Mean ± S.D.)Ba (Mean ± S.D.)Bb (Mean ± S.D.)Bt (Mean ± S.D.)
Betula pendula subsp. mandshurica (Regel) Ashburner & McAll1043.0 ± 1.04.4 ± 1.42.095 ± 1.4250.631 ± 0.5402.727 ± 1.778
Populus × tomentosa Carrière633.1 ± 1.04.5 ± 1.41.650 ± 1.1840.445 ± 0.3892.095 ± 1.513
Note: S.D.—Standard deviation, N—number of samples, D—diameter at breast height (cm), H—tree height (m), Ba—aboveground biomass (kg), Bb—belowground biomass (kg), Bt—total biomass (kg).
Table 2. Parameter estimation (a0, a1, and a2) and Akaike information criterion (AIC) results for three univariate candidate models (Model 1, Model 2, and Model 3) with two tree species (Betula pendula subsp. mandshurica (Regel) Ashburner & McAll and Populus × tomentosa Carrière) and three biomass components (aboveground biomass [Ba], belowground biomass [Bb], and total biomass [Bt]).
Tree SpeciesComponentModela0a1a2AIC
Betula pendula subsp. mandshurica (Regel) Ashburner & McAllBa(1)6.03094.1417−1.1056160.28
Ba(2)0.0385−0.0340.215166.39
Ba(3)0.20852.0017NA164.41
Bb(1)1.46273.5013−1.0489123.81
Bb(2)−0.22640.24560.0122125.17
Bb(3)0.1071.5734NA123.23
Bt(1)7.43553.9978−1.0944202.02
Bt(2)−0.18820.2120.2272210.81
Bt(3)0.30991.8962NA208.64
Populus × tomentosa CarrièreBa(1)16.50014.9433−0.801554.30
Ba(2)1.4302−1.12640.348755.26
Ba(3)0.08772.4293NA56.36
Bb(1)4.67664.5959−0.692824.74
Bb(2)0.0914−0.06820.05324.78
Bb(3)0.0382.0698NA22.81
Bt(1)22.33014.9061−0.7718114.68
Bt(2)1.5216−1.19460.4017115.44
Bt(3)0.1242.3484NA114.84
Note: NA indicates no parameter.
Table 3. Parameter estimation (a0, a1, and a2) and Akaike information criterion (AIC) results of two bivariate candidate models (Model 4 and Model 5) with two tree species (Betula pendula subsp. mandshurica (Regel) Ashburner & McAll and Populus × tomentosa Carrière) and three biomass components (aboveground biomass [Ba], belowground biomass [Bb], and total biomass [Bt]).
Tree SpeciesComponentModela0a1a2AIC
Betula pendula subsp. mandshurica (Regel) Ashburner & McAllBa(4)0.21572.0291−0.0442166.14
Ba(5)−1.67130.6432NA220.91
Bb(4)0.18792.0841−0.7946117.52
Bb(5)−2.2990.4976NA135.52
Bt(4)0.35382.0019−0.1724206.67
Bt(5)−1.27910.6106NA273.25
Populus × tomentosa CarrièreBa(4)0.06492.22190.358541.19
Ba(5)−2.67110.8104NA67.90
Bb(4)0.02681.87410.378222.78
Bb(5)−3.65670.7321NA22.82
Bt(4)0.09052.14310.3649106.15
Bt(5)−2.36540.7943NA120.52
Note: NA indicates no parameter.
Table 4. Parameter results of the total biomass model and proportional function for two tree species (Betula pendula subsp. mandshurica (Regel) Ashburner & McAll and Populus × tomentosa Carrière) using the univariate and bivariate proportional function control method.
SpeciesDimensionModelTotal BiomassProportional Function
a0a1a2b0b1b2
Betula pendula subsp. mandshurica (Regel) Ashburner & McAllUnivariate17.43553.9978−1.09440.5107−0.4223/
Bivariate40.35382.0019−0.17240.9139−0.0397−0.6976
Populus × tomentosa CarrièreUnivariate122.33014.9061−0.77180.3929−0.2906/
Bivariate40.09052.14310.36490.3879−0.31670.0305
Table 5. Parametric results of the aboveground biomass and belowground biomass model for two tree species (Betula pendula subsp. mandshurica (Regel) Ashburner & McAll and Populus × tomentosa Carrière) using the univariate and bivariate algebraic sum control method.
SpeciesDimensionModelAboveground BiomassModelBelowground Biomass
b0b1b2c0c1c2
Betula pendula subsp. mandshurica (Regel) Ashburner & McAllUnivariate15.95734.1662−1.119730.10861.5628/
Bivariate40.21532.0213−0.036640.18672.0909−0.7964
Populus × tomentosa CarrièreUnivariate112.22324.7389−0.843730.03742.0816/
Bivariate40.06422.23290.355540.02471.93060.3798
Table 6. Precision index (R2 and RMSE) results of the proportional function control and algebraic sum control methods in the univariate and bivariate dimensions with two tree species (Betula pendula subsp. mandshurica (Regel) Ashburner & McAll and Populus × tomentosa Carrière) and three biomass components (aboveground biomass [Ba], belowground biomass [Bb], and total biomass [Bt]).
SpeciesDimensionAdditive MethodTotal BiomassAboveground BiomassBelowground Biomass
R2RMSER2RMSER2RMSE
Betula pendula subsp. mandshurica (Regel) Ashburner & McAllUnivariate10.87560.62720.86830.52470.38990.4257
Univariate20.87490.62890.86810.52520.37950.4293
Bivariate10.87950.61740.87480.50910.42210.4164
Bivariate20.88040.61500.87530.51060.42390.4157
Populus × tomentosa CarrièreUnivariate10.86100.56430.91280.35520.49430.2809
Univariate20.86040.56550.91270.35840.49410.281
Bivariate10.87860.52730.92920.32290.51010.2788
Bivariate20.87860.52720.92930.32270.51000.2789
Disclaimer/Publisher’s Note: The statements, opinions and data contained in all publications are solely those of the individual author(s) and contributor(s) and not of MDPI and/or the editor(s). MDPI and/or the editor(s) disclaim responsibility for any injury to people or property resulting from any ideas, methods, instructions or products referred to in the content.

