Article

Tree-Level Climate Sensitivity Reveals Size Effects and Impending Growth Decline in Silver Fir Affected by Dieback

by
Juan Pablo Crespo-Antia
1,2,
Ester González de Andrés
2,
Antonio Gazol
2,
Jesús Julio Camarero
2 and
Juan Carlos Linares
1,*
1
Department of Physical, Chemical and Natural Systems, Universidad Pablo de Olavide, 41013 Sevilla, Spain
2
Instituto Pirenaico de Ecología (IPE-CSIC), 50059 Zaragoza, Spain
*
Author to whom correspondence should be addressed.
Forests 2024, 15(6), 999; https://doi.org/10.3390/f15060999
Submission received: 15 May 2024 / Revised: 4 June 2024 / Accepted: 5 June 2024 / Published: 7 June 2024

Abstract

:
Worldwide studies have related recent forest decline and mortality events to warmer temperatures and droughts, as well as pointing out a greater vulnerability to climate changes in larger trees. Previous research performed on silver fir (Abies alba Mill.) suggest an increasing decline and mortality, mainly related to rising water shortages. Here, we investigate these die-off events in two silver fir populations at the rear edge of the species in the western Pyrenees. We used dendrochronology to investigate tree age, size (diameter) and individual climate sensitivity (climate–growth relationships) as predisposing factors related to growth patterns and drought resilience indexes in canopy-level declining and non-declining trees. The regional climate was also investigated, including temperature trends, quantile regression in precipitation and frequency of extreme events in drought indexes (SPEI). The regional climate was characterized by an increase in mean temperatures and a higher frequency of extreme drought events in recent decades, without a decrease in total precipitation. Larger trees were more sensitive to temperature and prone to decline. Declining trees presented decreasing growth trends years ago, providing a robust predisposing trait. Both populations were not different in mean growth, despite the contrasting local climate and management legacies, although we identified a higher resilience to drought in the eastmost stand. A significant regression was found between growth trends and climate sensitivity, supporting that declining trees are more sensitive to warmer temperatures and drought. Hence, the results support a contrasting climate sensitivity related to tree size (but not to tree age), suggesting impending decline and mortality in large trees with higher temperature sensitivity (negative temperature–growth correlations). Nonetheless, contributing factors, such as the legacy of previous logging, should also be accounted for.

1. Introduction

Climate change constrains the persistence of several tree species, as well as the expected dynamics and diversity of forests worldwide [1,2,3]. Recent forest decline and mortality events linked to warmer temperatures and droughts are pervasive [4,5]. In addition, some of these studies suggest that larger trees—that is, those accounting for a greater carbon stock in their biomass—may be more sensitive to climate changes [3,6]. Another significant factor influencing forest structure, diversity, and dynamics is the management regime, such as prior logging, which may predispose some forests to decay [7].
Silver fir (Abies alba Mill.) is an ecological- and forestry-relevant tree species affected by these historical legacies of land use. It is one of the tallest tree species within the Abies genus in Europe, contributing to the preservation of forest biodiversity and the carbon sink [8]. Silver fir decline has occurred periodically in Europe since 1500 [9]. In the rear edge of the species, located about the ecotone of the Mediterranean region, dieback symptoms have been related to warming and extreme drought events but also contributing factors such pathogens and the legacy of management (clear-cut logging with short regeneration periods, the abrupt removal of shelter trees, and plantation without shelter trees) [10,11,12,13,14].
Dendrochronology provides a comprehensive framework of principles, methodologies, and analytical techniques for the interpretation of tree growth patterns [15]. Growth sensitivity to different environmental factors offers a distinctive physiological trait of woody plants for investigating phenotypic responses [16]. Hence, tree-level climate sensitivity may be quantified and further investigated as a dendro-phenotype, characteristic of some physiological responses or linked to other individual traits, such as tree age and size.
Here, we focus on two populations of silver fir affected by extensive dieback and mortality (Cotatuero, CO; Paco Ezpela, PE) [11,12,17]. Our main objective was to investigate tree age, size (diameter), and tree-level climate sensitivity (climate–growth relationships) as predisposing factors related to growth trends and drought resilience indexes. To achieve these objectives, we apply dendrochronological methods and analyze regional climate data. Specifically, we aimed to (i) quantify differences in growth trends, measured by annual basal area increments (BAIs) and BAI trends, comparing non-declining and declining trees; (ii) analyze regional climatic trends in temperature, precipitation, and drought index (SPEI); and (iii) assess relationships between tree-level BAIs and BAI trends and climate variables, and use these climate sensitivity estimates as a dendro-phenotypic functional trait, related to declining symptoms. We hypothesize that larger trees will exhibit higher climate sensitivity, resulting in a predisposing factor to growth decline and enhanced vulnerability to drought events.

2. Materials and Methods

2.1. Study Species

According to the European Atlas of Forest Tree Species [8], silver fir (Abies alba Mill.) can attain heights of up to 60 m. It reaches reproductive age around 30–40 years, with its seeds dispersed by wind, and it boasts a longevity of 500 to 600 years. Its distribution spans elevations from 500 to 2000 m above sea level, primarily concentrated in Central Europe, while extending southward, where the southernmost populations of this species are found in the Spanish Pyrenees and the mountains of southern Italy and the Balkans [8].
Silver fir exhibits tolerance to a diverse range of soils, displaying a preference for deep and moist soils with a pH ranging from acidic to neutral. Typically thriving in cold climates and humid environments, it experiences precipitation levels between 700 and 1800 mm/year, along with temperatures ranging from 14 to 19 °C during the summer. Key limiting factors for its development include low summer temperatures, insufficient humidity during the growing season, and frost during its early germination stages [10]. Recent studies underscore the increasing significance of drought as a limiting factor for the species’ development [11,14].

2.2. Study Area

The sampling sites were located at the southwestern boundary of this species’ distribution range. Two populations of silver fir were studied in northern Spain, specifically within the Aragonese Pyrenees: Paco Ezpela (PE) and Cotatuero (CO) (Table 1). Soils are basic and deep. In the PE stand, silver fir grows with European beech (Fagus sylvatica L.), while the understory is mainly formed by common holly (Ilex aquifolium L.), common hazel (Corylus avellana L.) and European box (Buxus sempervirens L.). In the CO stand, silver fir grows with Scots pine (Pinus sylvestris L.), while the understory vegetation is dominated by European box (Buxus sempervirens L.) [12].
Over the past decades, both silver fir populations have exhibited signs of decline and mortality [11,17]. To explore the impact of forestry, the PE population was chosen, as it represents an area historically subjected to forest management, including selective logging [11,12,17]. This was contrasted with the CO population, situated within the Ordesa y Monte Perdido National Park, an area protected for over a century, since 1918 [12].
According to climatological data obtained from the Koninklijk Nederlands Meteorologisch Instituut Climate Explorer (https://climexp.knmi.nl, accessed on 10 May 2024), CO records an average annual temperature of 6 °C and precipitation of 1092 mm/year, while PE has an average annual temperature of 9.4 °C and precipitation of 880 mm/year (see Supplementary Materials, Figure S1).

2.3. Field Sampling and Dendrochronological Methods

Field sampling took place in October 2019 in both populations, adhering to standard dendrochronological methods. The methodology used to assess defoliation was a semi-quantitative scale based on estimates of crown defoliation percentages [12,13,17]. A tree with the maximum amount of foliage was used in each site for a visual reference; with that reference, non-declining trees were considered those with a crown cover >50%, while declining trees were those with a crown cover ≤50%. We performed a literature revision to summarize the percentage of declining trees (trees with crown cover ≤ 50%) in each study site from the late 1990s to 2020 [12,13,17]. In PE, 20 non-declining trees and 20 trees exhibiting canopy decline symptoms (crown cover ≤ 50%) were chosen. In CO, the sampling included 15 non-declining trees and 15 trees with canopy decline symptoms, following identical criteria (Table 1).
Wood cores were taken at a height of 1.3 m (diameter at breast height; DBH), two samples collected per tree, using a Pressler auger. Cores were air-dried and glued to wooden mounts, and sanded with progressively finer sandpaper until the tree rings became distinctly visible. Visual cross-dating was applied to all samples, and this dating was further validated using COFECHA software [18]. Subsequently, ring width measurements were conducted on scanned images at a resolution of 1200 dpi (EPSON XL 10000 scanner (Epson, Suwa, Japan)) with an accuracy of 0.001 mm, utilizing the CooRecorder-CDendro software ver. 9.3.1 (CDendro &CooRecorder, Saltsjöbaden, Sweden) [19].
The ring growth series was used to estimate (1) the DBH inside bark (see Equation (1)), (2) age at the DBH (based on individual cross-dating), and (3) the annual BAI for all trees (see Equation (2)). Growth pattern analyses were conducted for the period 1970–2018 to obtain a comparable sample across the entire age range of the sampled individuals, as younger trees did not have records prior to this period.
The ring width was transformed into the DBH inside bark, expressed in cm, by considering the cumulative radial growth through the following equation:
DBH = (ΣTRW × 2)
The ring width was transformed into the BAI due to this measure holding greater biological significance in describing tree growth, in terms of annually accumulated biomass, than the ring width itself [20]. Moreover, previous studies have demonstrated that the temporal patterns of BAI sensitively reflect the probability of decline and mortality in this species [12,21]. The BAI was annually resolved from the tree ring widths as the difference between consecutive cross-sectional basal areas (BAs), assuming a circular stem outline, expressed in cm2, using the following equation:
B A I = π R t 2 R t 1 2
where R is the radius of a given core sample, while t is the year of tree-ring formation.

2.4. Climate Data and Drought Index

Precipitation, temperature, and SPEI were downloaded from the Koninklijk Nederlands Meteorologisch Instituut Climate Explorer website (https://climexp.knmi.nl, accessed on 10 May 2024) with a spatial resolution of 0.25°, utilizing the coordinates listed in Table 1 that correspond to the study areas.
The temperature data were sourced from [22], while precipitation data were sourced from [23], utilizing a European gridded dataset of observed daily precipitation and temperature. The analysis covered average temperatures for the period spanning 1921 to 2018. Using this information, seasonal and annual means were computed; the cumulative seasonal and annual precipitation were also estimated during the same period.
To assess drought, we used the Standardized Precipitation–Evapotranspiration Index (SPEI) [24,25,26]. The SPEI was applied at two temporal scales: a 3-month scale to evaluate the seasonal drought index and a 12-month scale to assess the annual drought index. The SPEI data covered the period from 1920 to 2018. This compilation of climatological data and SPEI facilitates the evaluation and comprehension of how climatic conditions and drought impact the growth and health of silver fir populations in the study areas.

2.5. Statistical Analysis

For the dendrochronological data, we conducted a two-way analysis of variance (ANOVA) to investigate the influence of both tree status (declining and non-declining) and populations (PE and CO) on key variables including DBH, age at DBH, mean BAI, and the BAI trend for the complete time span (1970–2018) and from 1990 to 2018, to gain insights into contemporary trends. To identify specific differences and contrasts between the levels of our factors, we used the Tukey Honestly Significant Difference (HSD) test for post hoc analysis.
To examine the temperature trends within each population, annual and seasonal Pearson correlation coefficients were computed. This analysis was conducted on two time series: 1921–2018, to assess temperature patterns over the past century, and 1970–2018, for a more detailed exploration of temperature behavior in the time series linked to tree growth.
The behavior of precipitation in each population was examined through an annual and seasonal Mann–Kendall trend test on two temporal series: 1921–2018, to understand precipitation patterns over the past century, and 1970–2018, for a more detailed analysis of precipitation behavior in relation to tree growth. An additional analysis was conducted in the 1921–2018 time series using quantile regression for the 0.10, 0.25, 0.50, 0.75, and 0.90 quantiles to determine whether extreme precipitation events have shown an increase or decrease.
Once the temperature and precipitation behaviors of both populations were identified, a one-way analysis of variance (ANOVA) was conducted to compare these variables between the two populations. In all cases, statistically significant differences were considered for p-values less than 0.05.
To analyze the Standardized Precipitation–Evapotranspiration Index (SPEI), the entire time series data were arranged in ascending order. All data points less than −1, indicative of a dry season, were then chosen. Following this selection, the decades in which these events occurred were identified to assess whether drought events are evenly distributed over time or if their frequency has increased in recent years.
The tree-level BAI trend was estimated as the slope of the linear regression of BAI and the calendar year. Tree-level BAI climate-sensitivity was estimated as the Pearson correlation coefficient of the BAI and seasonal climate variables estimated from the summer prior to the year of tree-ring formation to the current autumn. We performed these analyses for the time periods 1970–2018 and 1990–2018.
Population-level climate sensitivity was evaluated by conducting an annual and seasonal Pearson correlation analysis between the average temperature, cumulative precipitation, and SPEI and the mean BAI and BAI trend of the selected time periods (1970–2018 and 1990–2018). Statistically significant differences were considered to be those with a p-value less than 0.05 in any of these comparisons. All analyses were performed using the Rstudio program [27].
Furthermore, BAI responsiveness to drought was assessed by selecting the years 2011, 1995, and 1985, representing periods of heightened drought conditions. These years were chosen with a sufficient gap between them to prevent overlapping effects and were within the analyzed growth series of the trees (1970–2018). It is important to note that, in CO, the year 2012 exhibited a lower Standardized Precipitation–Evapotranspiration Index (SPEI) (indicating drier conditions) than in 2011. However, 2011 was selected to ensure temporal consistency across both populations. The drought sensitivity (DS; see Equation (3)) as an indicator of resistance to drought and drought recovery (DR; see Equation (4)) as an indicator of resilience were determined. The calculations were made based on the relative changes in BAI during the selected drought years, utilizing the following equations (see [28]):
DS = (BAID − BAID−3)/(BAID−3)
DR = (BAID+3 − BAID−3)/(BAID−3)
where BAID represents the BAI value for the drought year, BAID−3 is the average BAI for the 3 years preceding the drought, and BAID+3 is the BAI for the 3 years following the drought. The 3-year interval was chosen following the methodology proposed by [12,28], which clarifies that this temporal margin adequately reflects short-term drought effects on BAI. This analysis was conducted for all individuals, non-declining and declining, in each population. Finally, we analyzed the tree-level relationship (regression model) of climate sensitivity and tree DBH and age, estimated at coring height.

3. Results

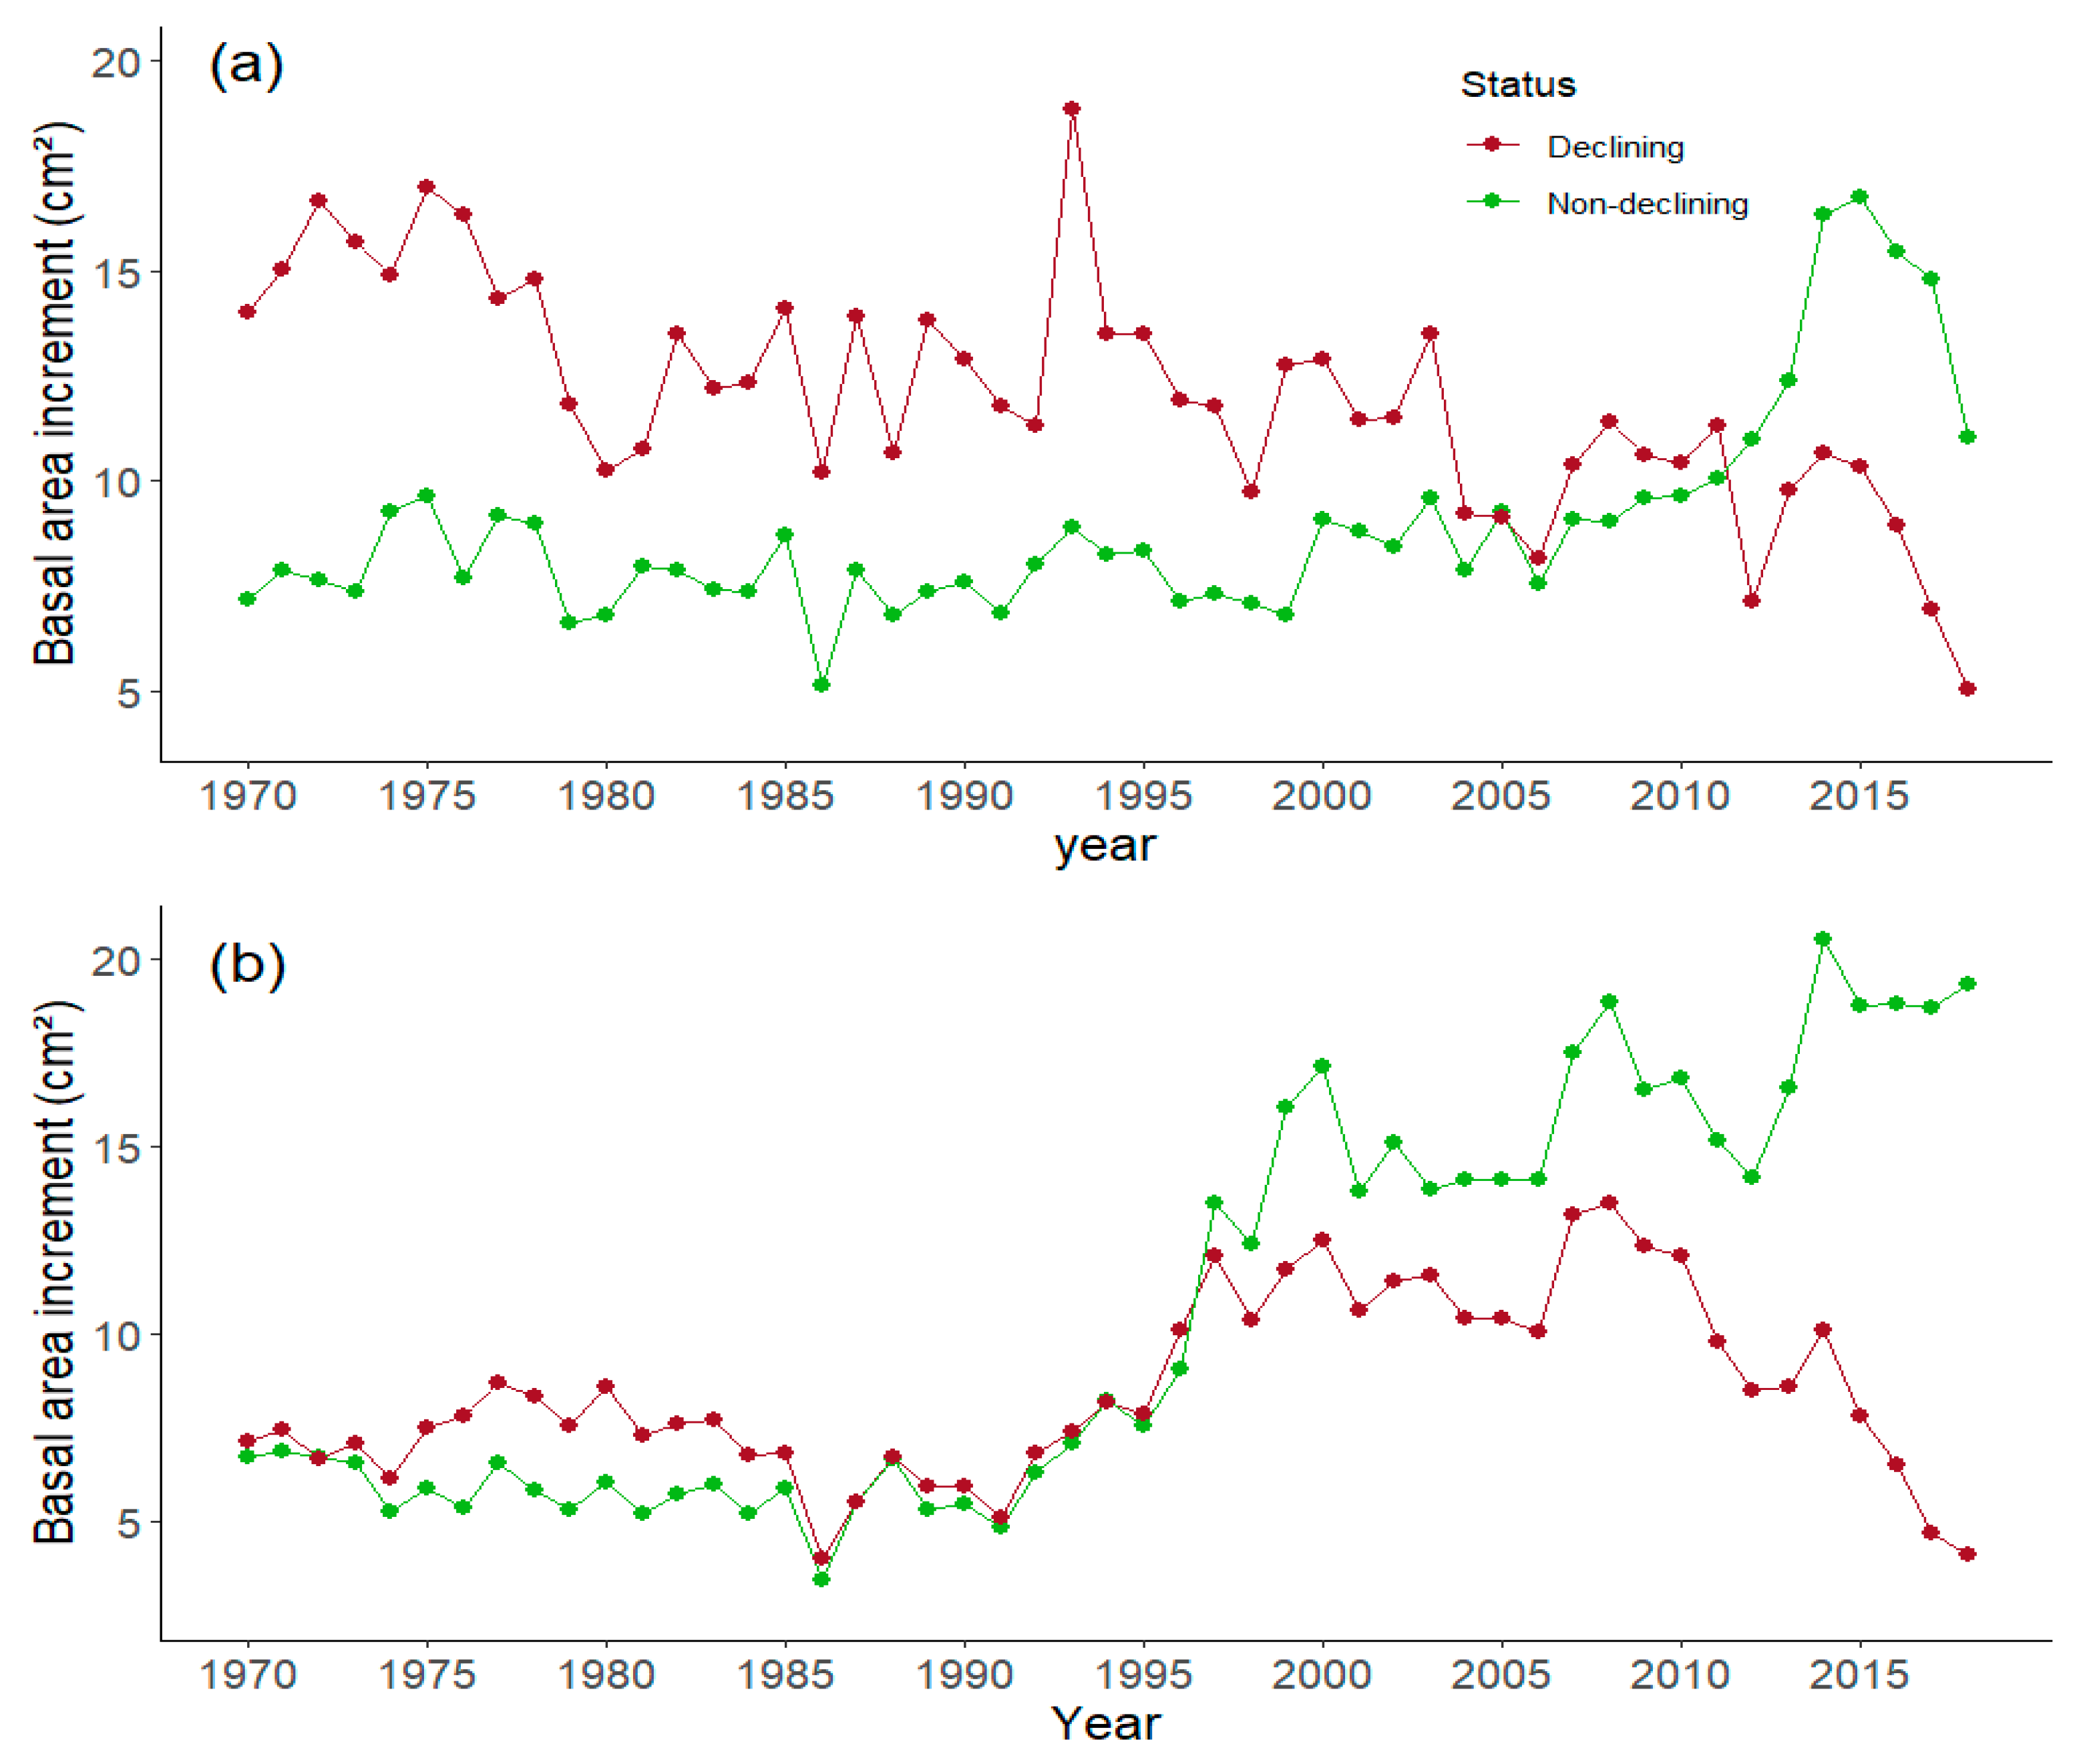
3.1. Dendrochronology

The ANOVA comparisons (see Supplementary Materials Tables S1–S12 and Figures S2–S8) showed that there are no significant differences in mean BAI between declining and non-declining trees. However, declining trees were, on average, slightly older than non-declining trees and exhibited significant differences in the trend BAI for the selected time spans. The comparison between the two populations showed that CO exhibits a significantly higher DBH and age at DBH (PE 107 ± 4.32 vs. CO 120 ± 2.98). The BAI did not show significant differences, indicating similar average growth rates in both populations; however, the BAI trend was more positive in PE from 1970 to 2018.
The analysis between non-declining and declining trees in Cotatuero (CO) revealed no significant differences in age at DBH and mean BAI. The differences were found in the DBH (see Table S4) and BAI trend (see Table 2), which significantly differed between declining and non-declining trees, suggesting higher growth rates and larger (but not older) trees within this group. In fact, the BAI was higher in declining trees from 1970 to 2000 (see Figure 1a).
The comparisons between the non-declining and declining trees of Paco Ezpela (PE) showed no significant differences in DBH, age at DBH, and BAI for the period 1970–2018. The mean BAI of the recent time span (1990–2018) was higher in the non-declining trees of PE, indicating a recent decrease in the growth of declining trees. This observation is further supported by the significant differences in BAI trends observed for the selected time spans (see Table 2 and Figure 1b).

3.2. Temperature, Precipitation, and SPEI

The seasonal and annual average temperature (°C) and precipitation (mm/year) are detailed in Table 3. The annual mean temperature was significantly higher in PE, and the annual precipitation was significantly lower in PE (see Supplementary Materials, Tables S15 and S16).

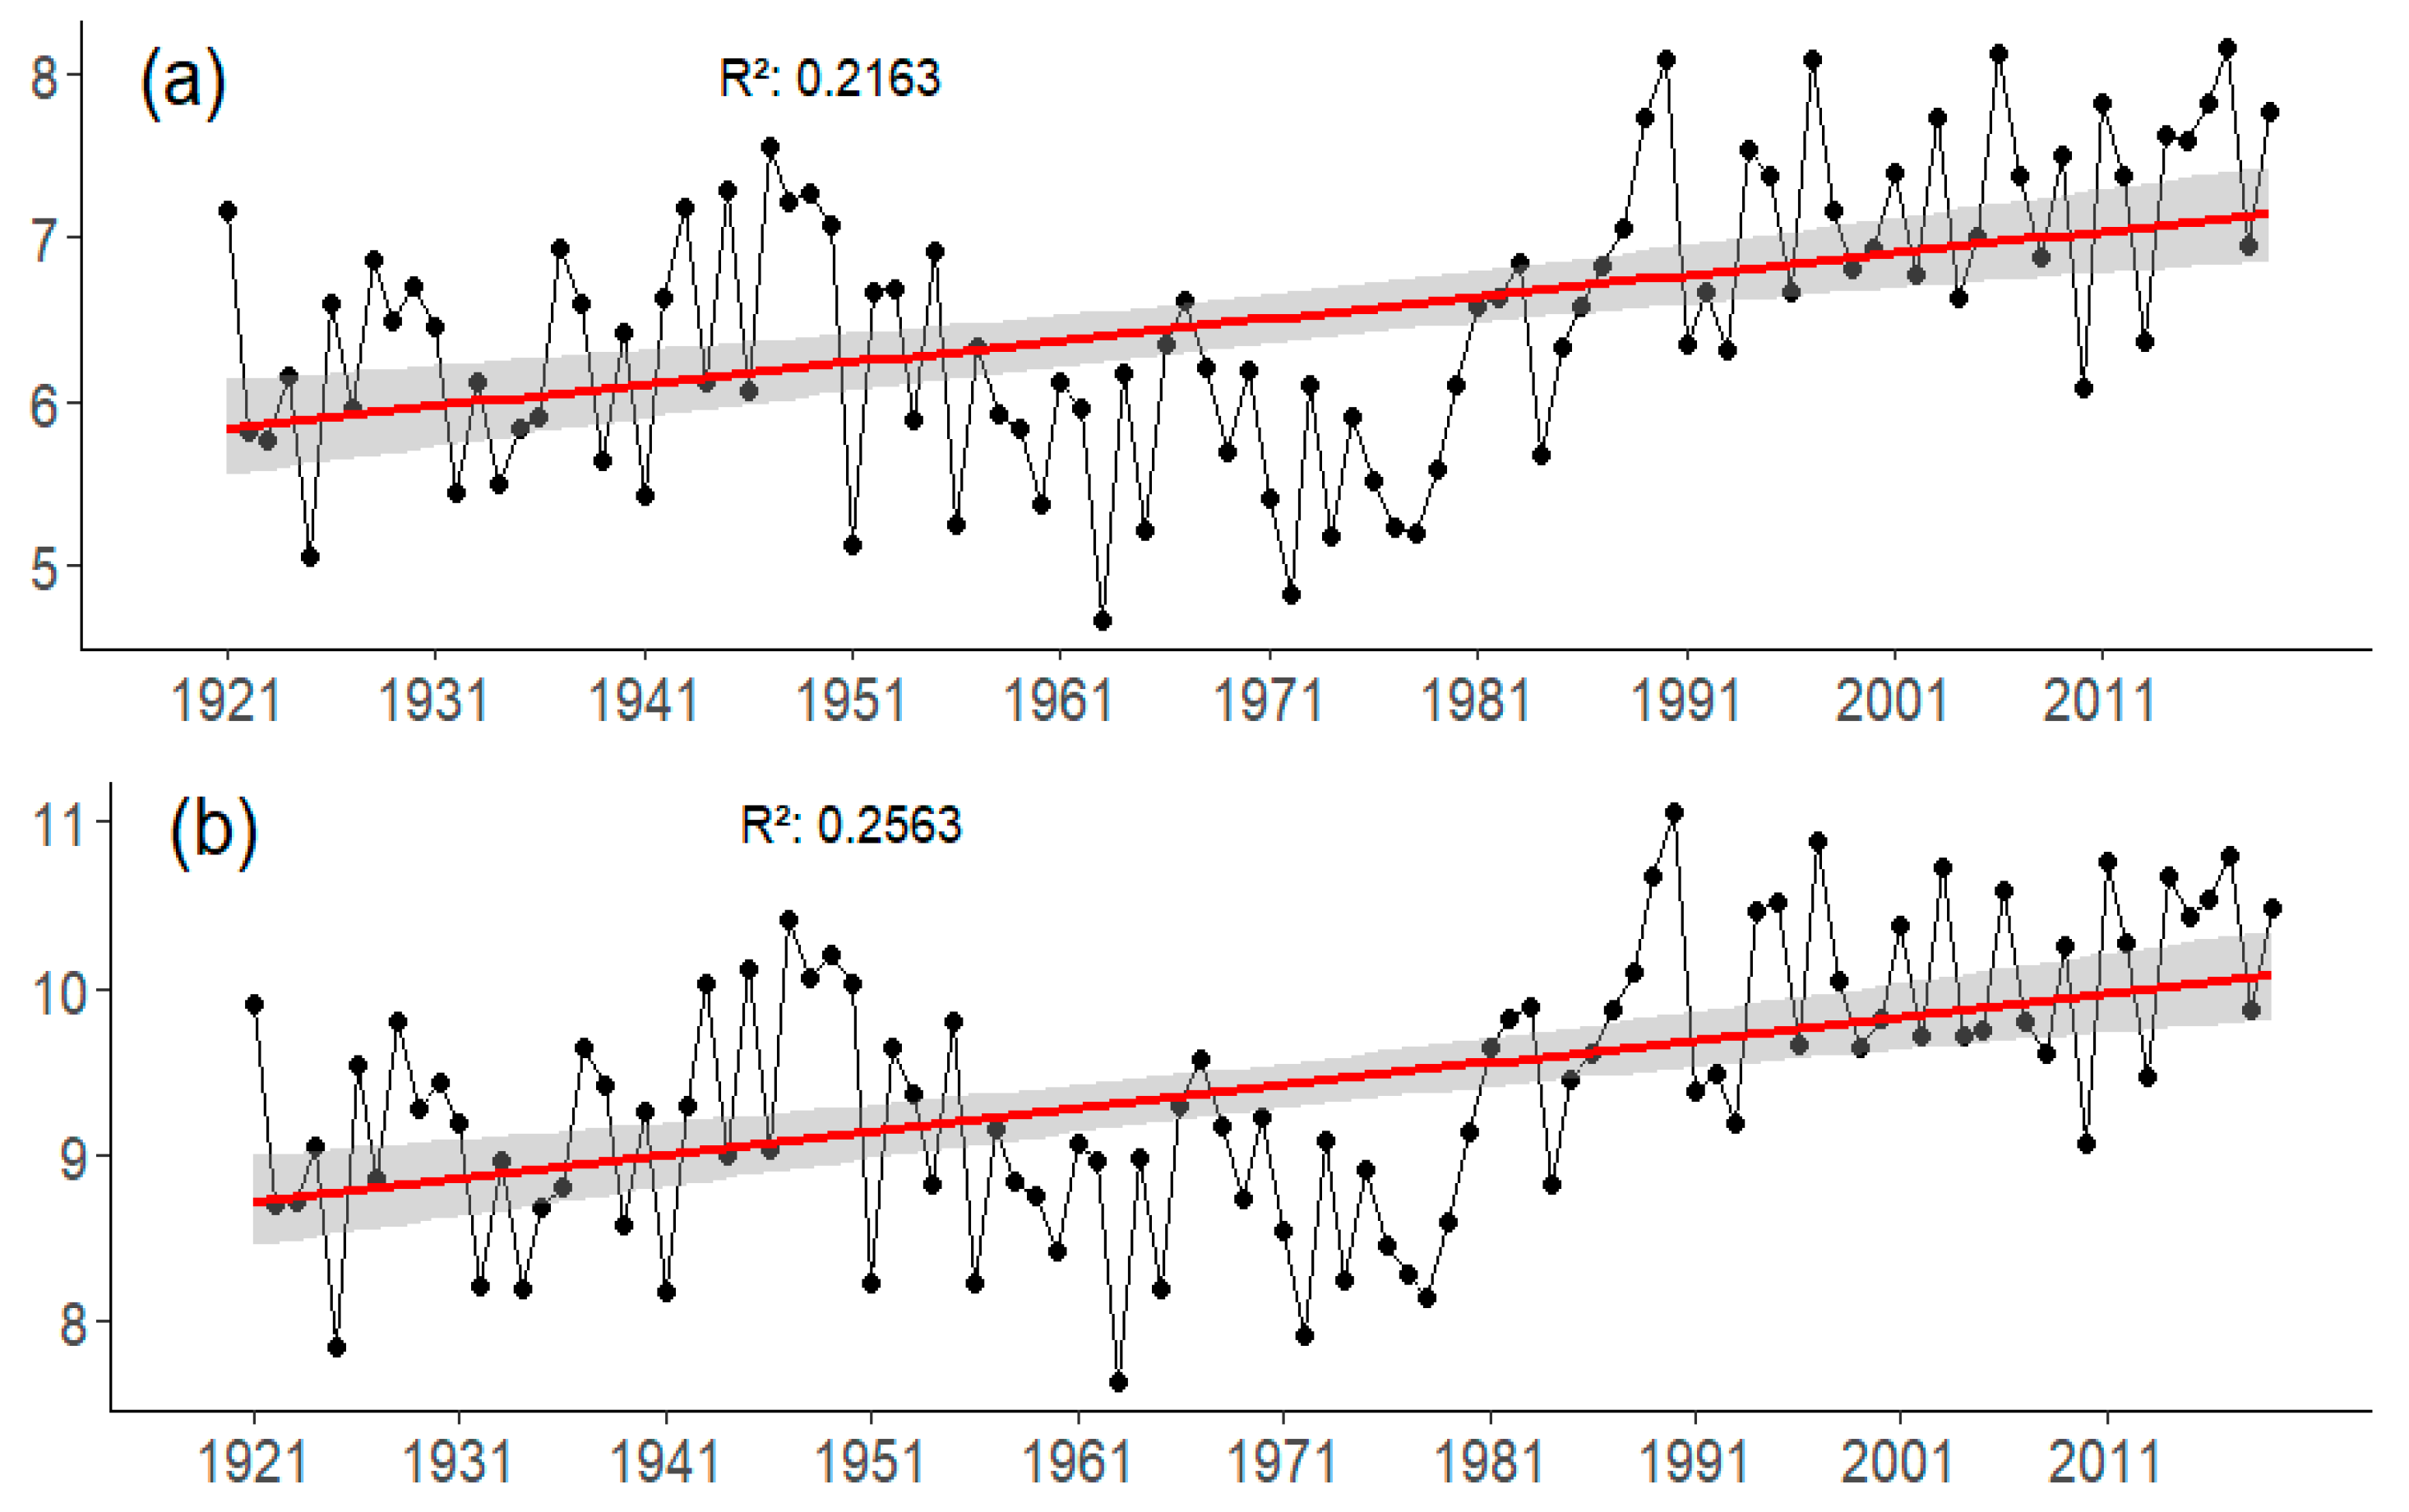
3.2.1. Temperature Trend

Both populations exhibited a gradual increase in mean temperature over the last century (1921–2018) (Figure 2), where the winter season contributed predominantly to this temperature rise. Furthermore, during the period analyzed for tree BAI, from 1970 to 2018, both populations have maintained a temperature-increasing trend, here with seasonal warming mainly observed in spring (see Supplementary Materials, Tables S15 and S16).

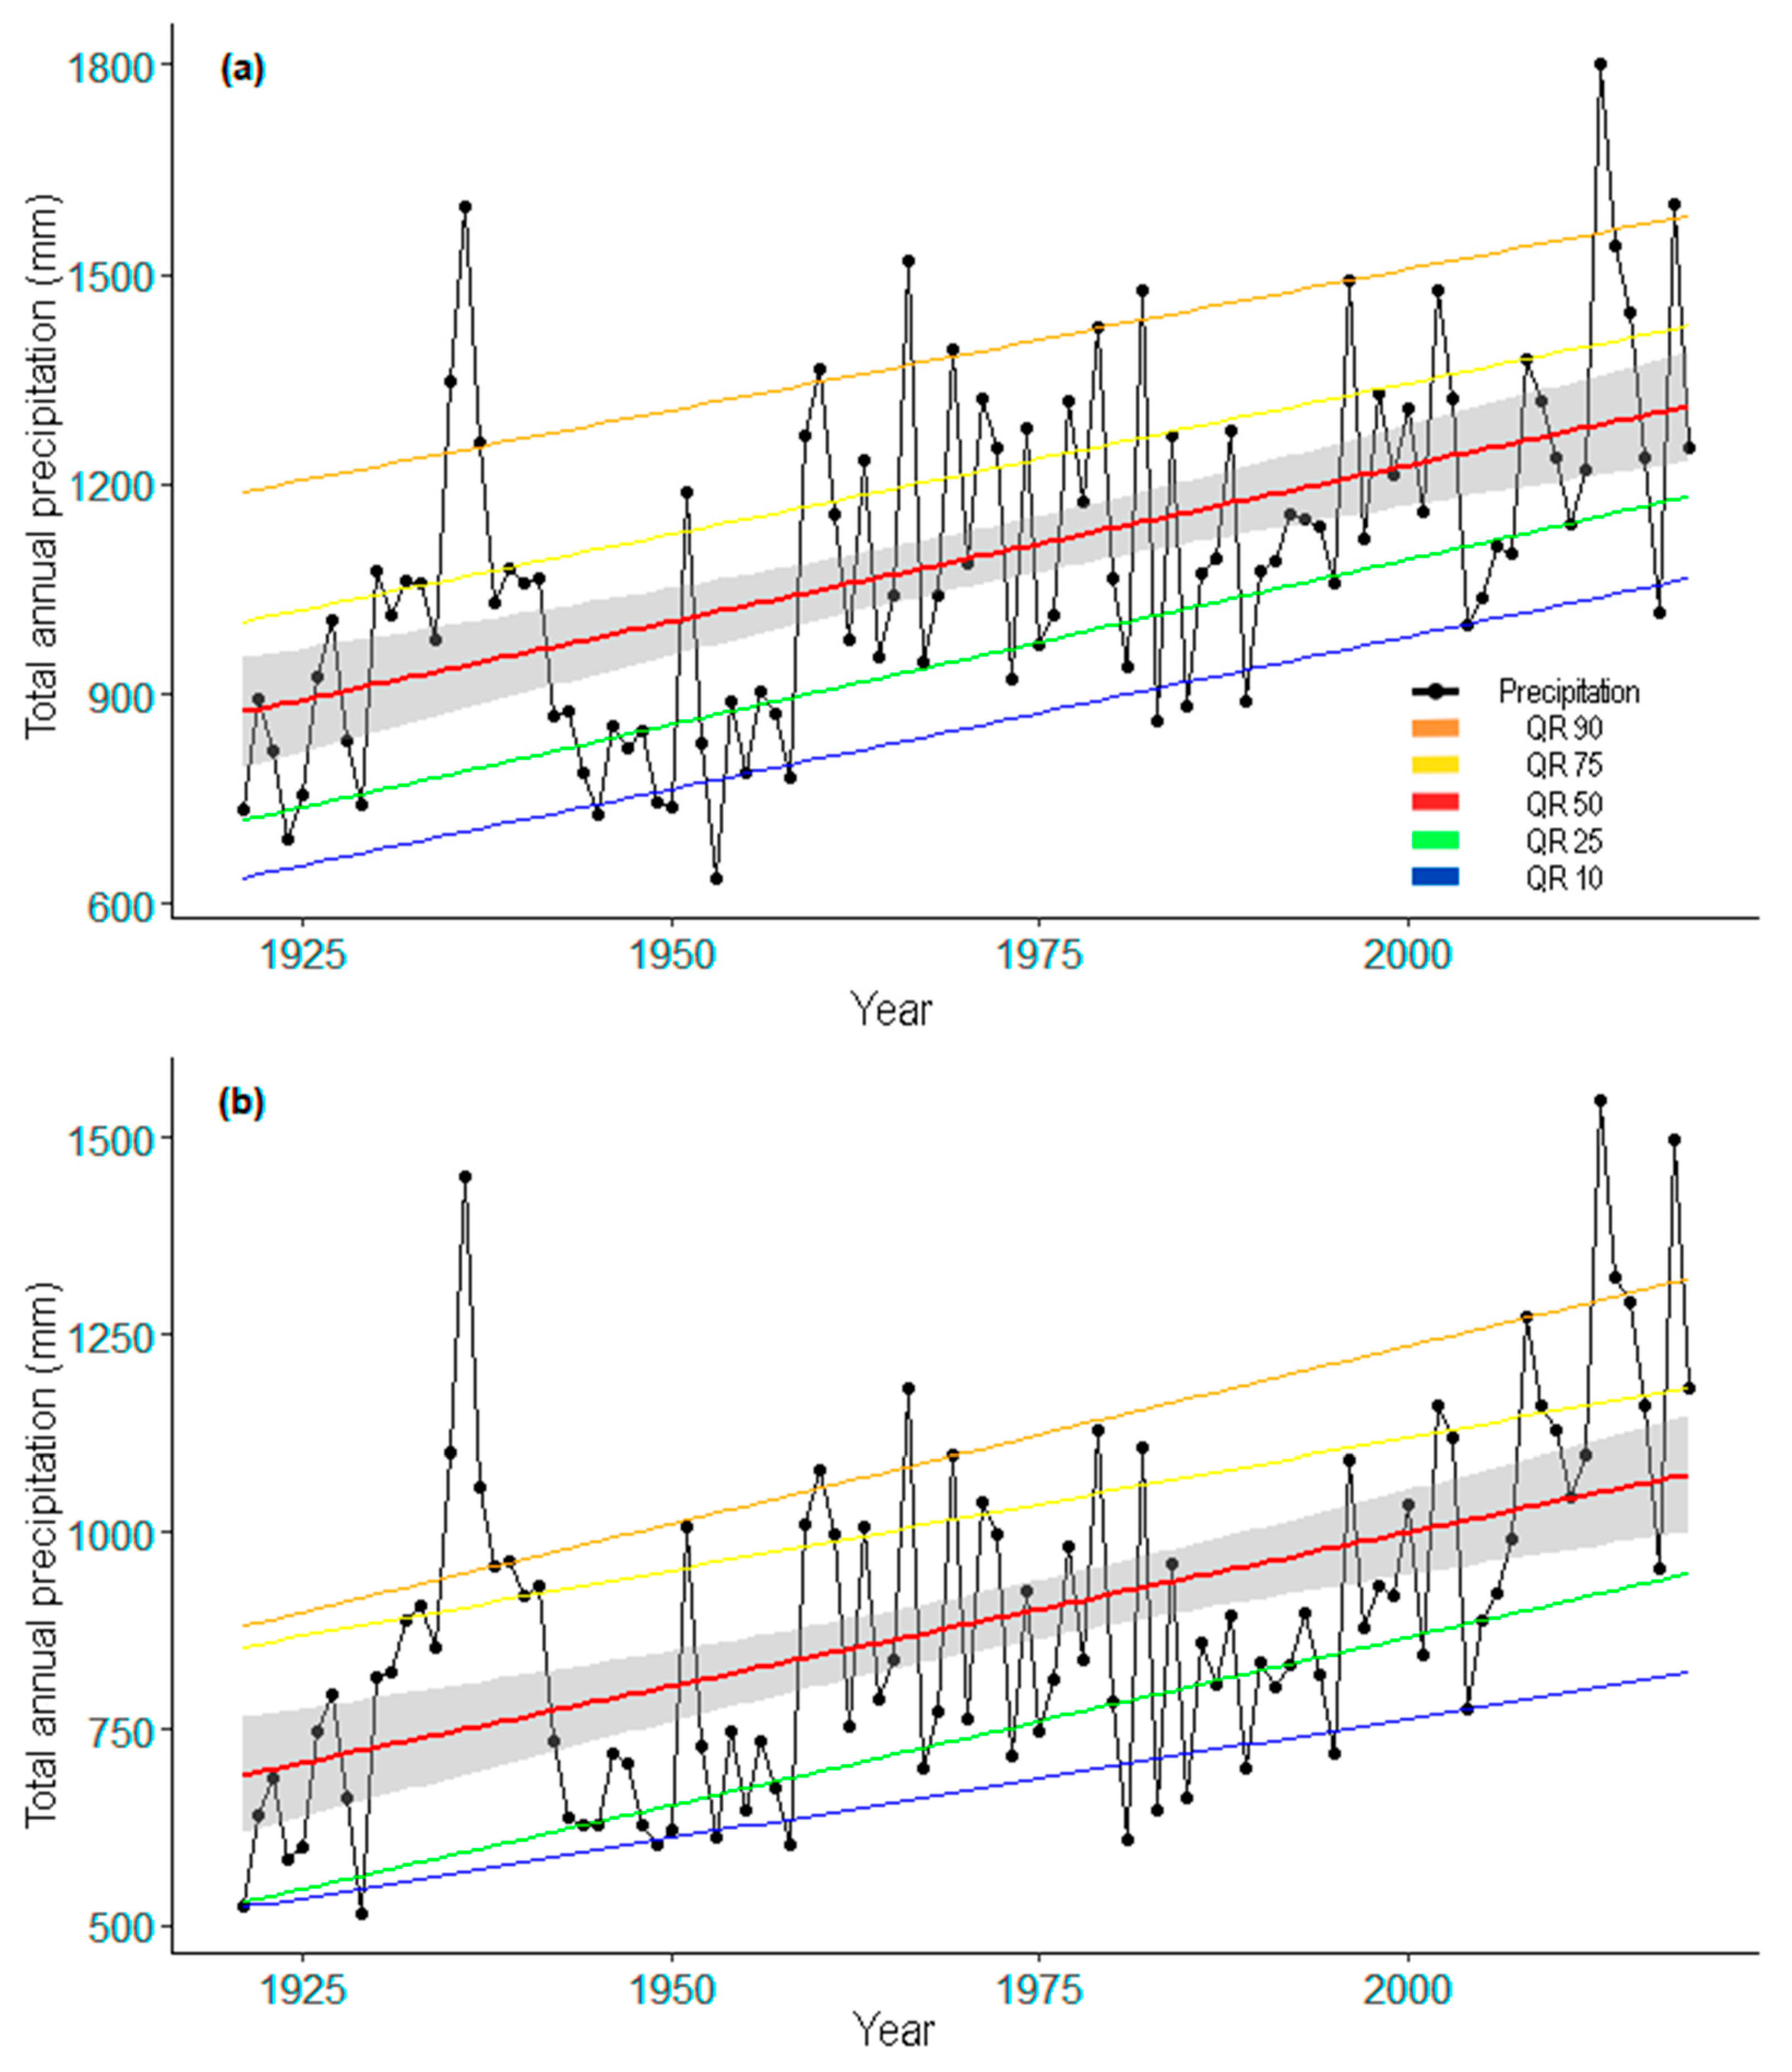
3.2.2. Precipitation Trend

The Mann–Kendall trend test revealed an increase in precipitation in both study areas. For the time series spanning from 1921 to 2018, this increase was predominantly influenced by autumn. This increment was further substantiated by the quantile regression analysis, where all quantiles (0.10, 0.25, 0.50, 0.75, and 0.90) displayed a positive slope (Figure 3) and yielded a p-value below 0.05. The Mann–Kendall trend test for the time series related to tree growth (1970–2018) allowed us to identify that both populations maintained the trend of increasing precipitation, predominantly influenced by the same season (see Supplementary Materials, Tables S17–S19).

3.2.3. Drought Index (SPEI)

In CO, there were 21 years with an SPEI lower than −1. Out of these, 67% of the values are concentrated in the time series related to tree growth (1970–2018), and 29% are concentrated in the last decade, indicating an increase in the frequency of drought episodes. When analyzing the seasonal distribution, summer reflects higher drought indices in the time series related to tree growth (1970–2018). During this period, summer contains 74% of the drought indices lower than −1, with the decades of 2009–2018 and 1989–1999 having the highest percentages at 21% and 26%, respectively (Figure 4a)
PE exhibits a condition similar to CO; there were 20 years with an SPEI lower than −1. Out of these, 75% of the values are concentrated in the time series related to tree growth (1970–2018), and 30% are concentrated in the last decade, demonstrating a recent increase in the frequency of drought episodes. When analyzing the seasonal distribution, summer reflects higher drought indices in the time series related to tree growth (1979–2018). During this period, summer contains 79% of the drought indices lower than −1, with the decades of 2009–2018 and 1989–1999 having the highest percentage at 26% (Figure 4b).

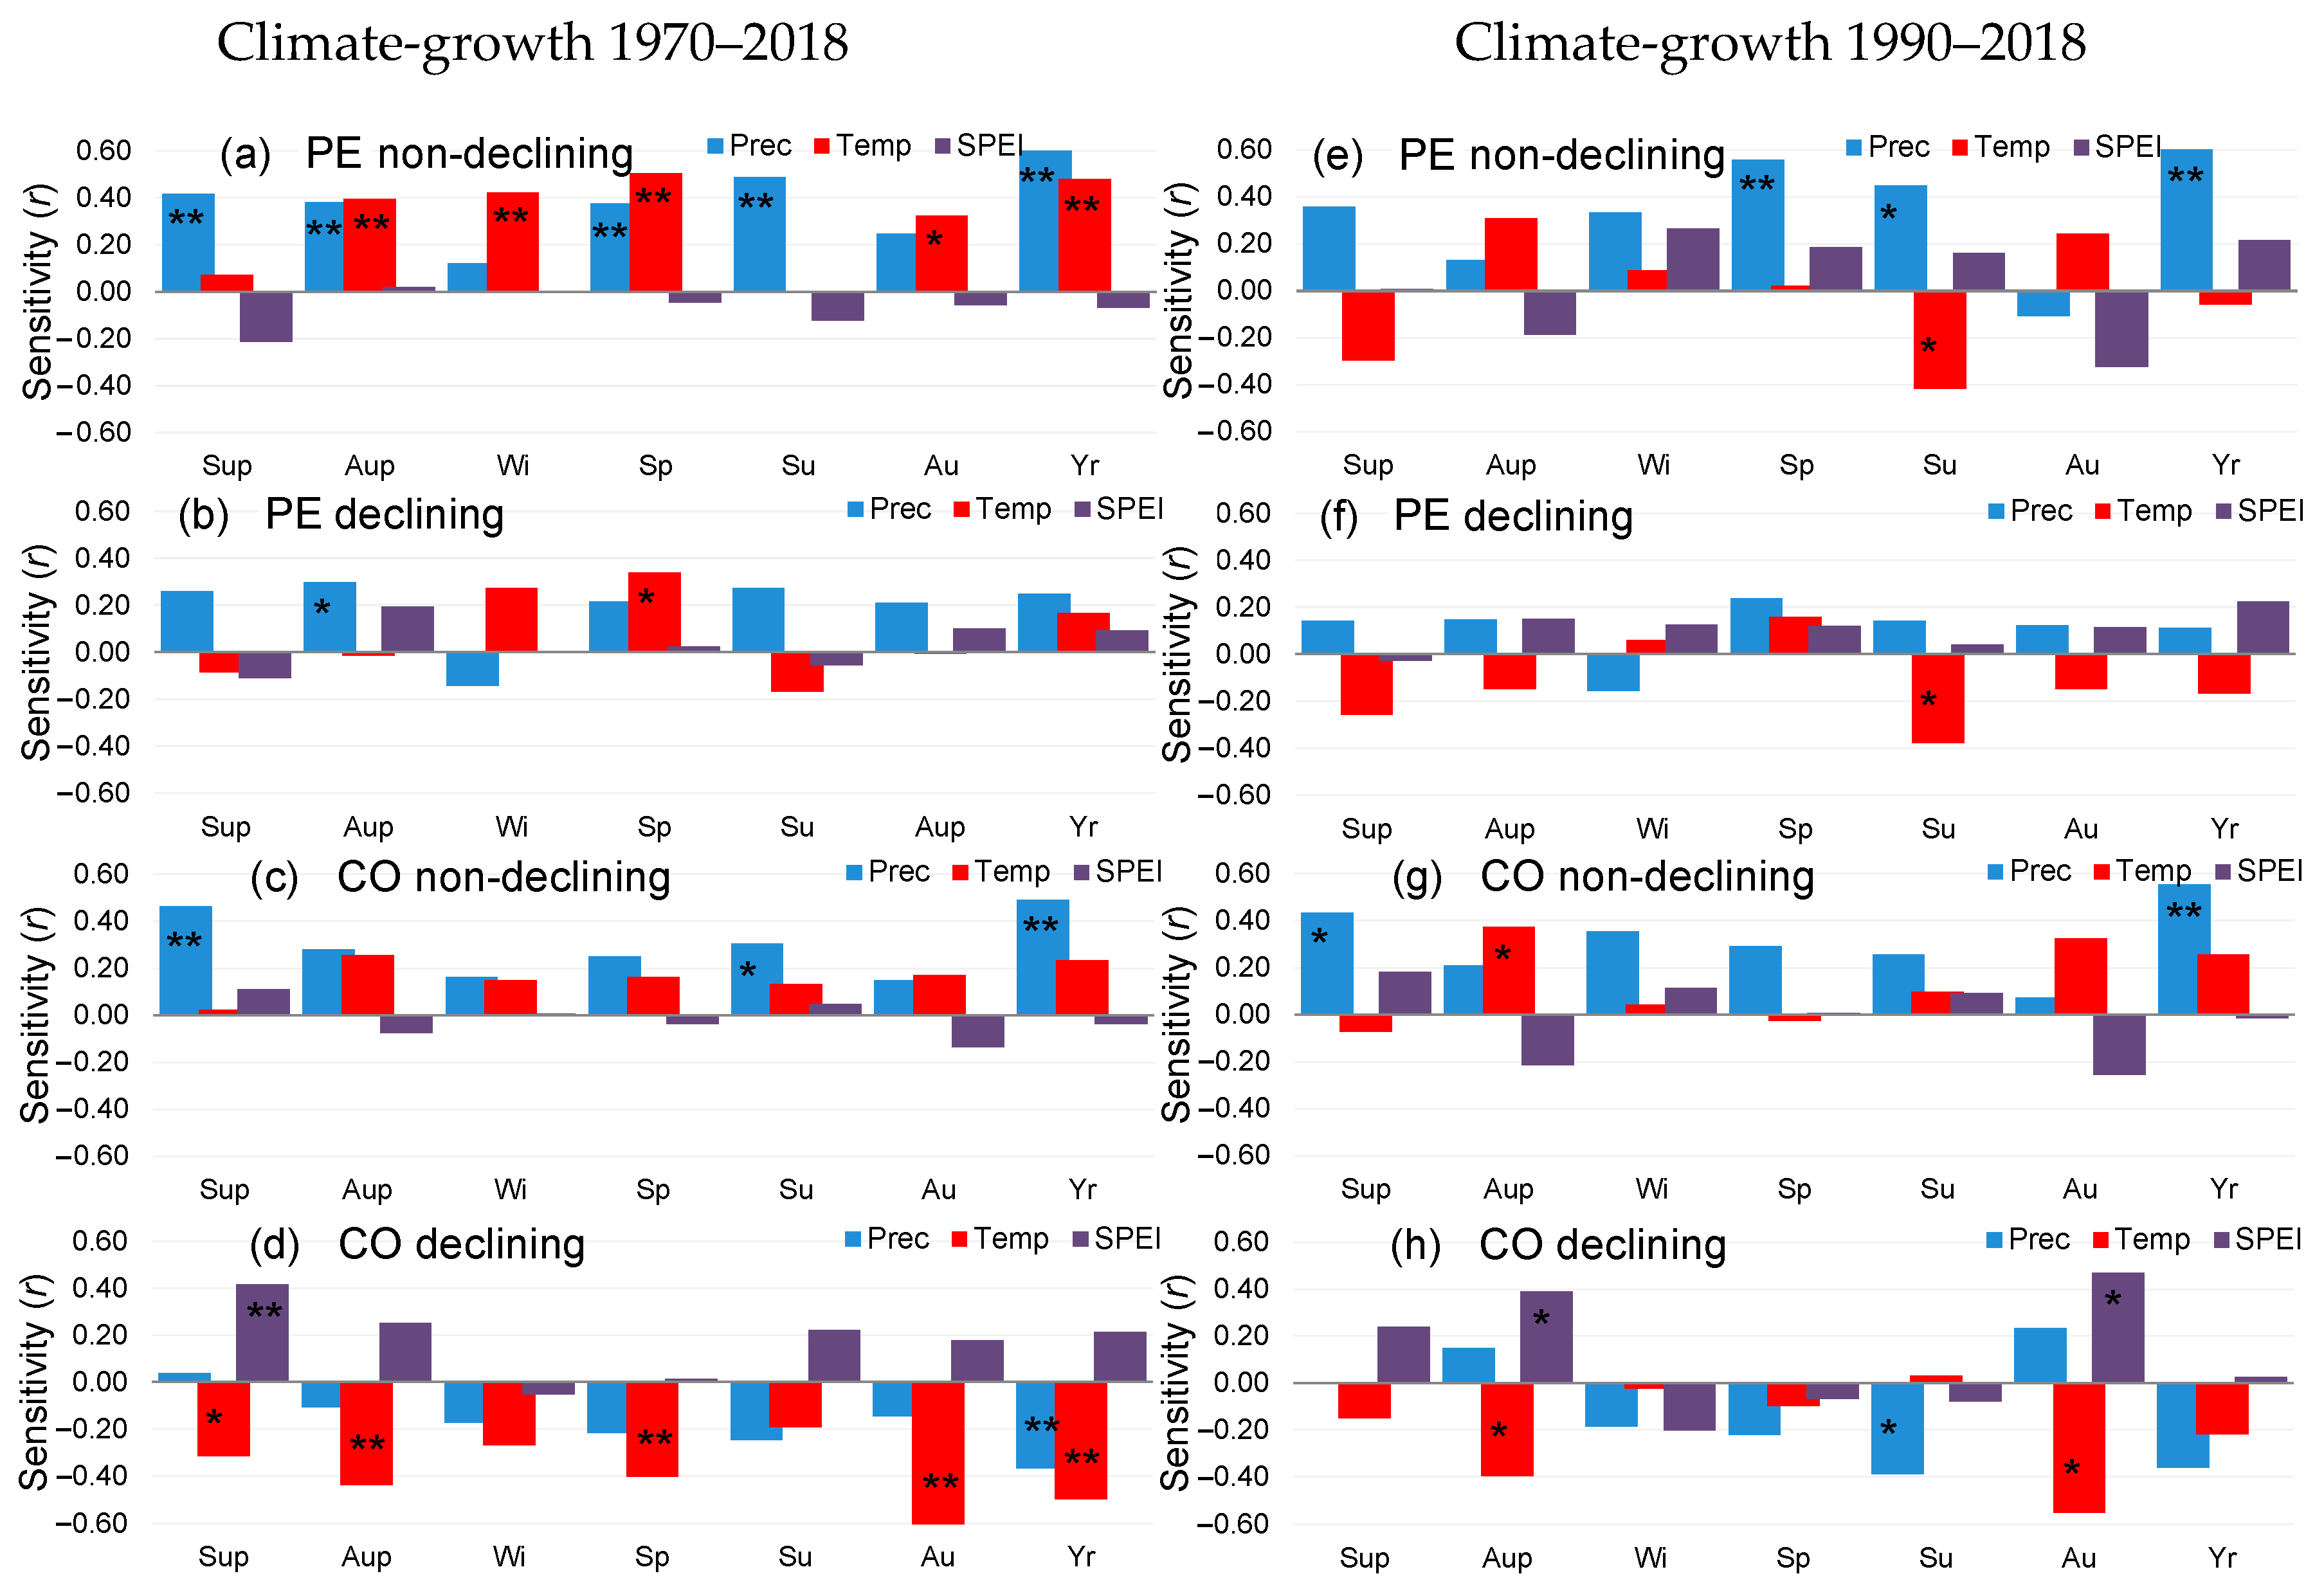
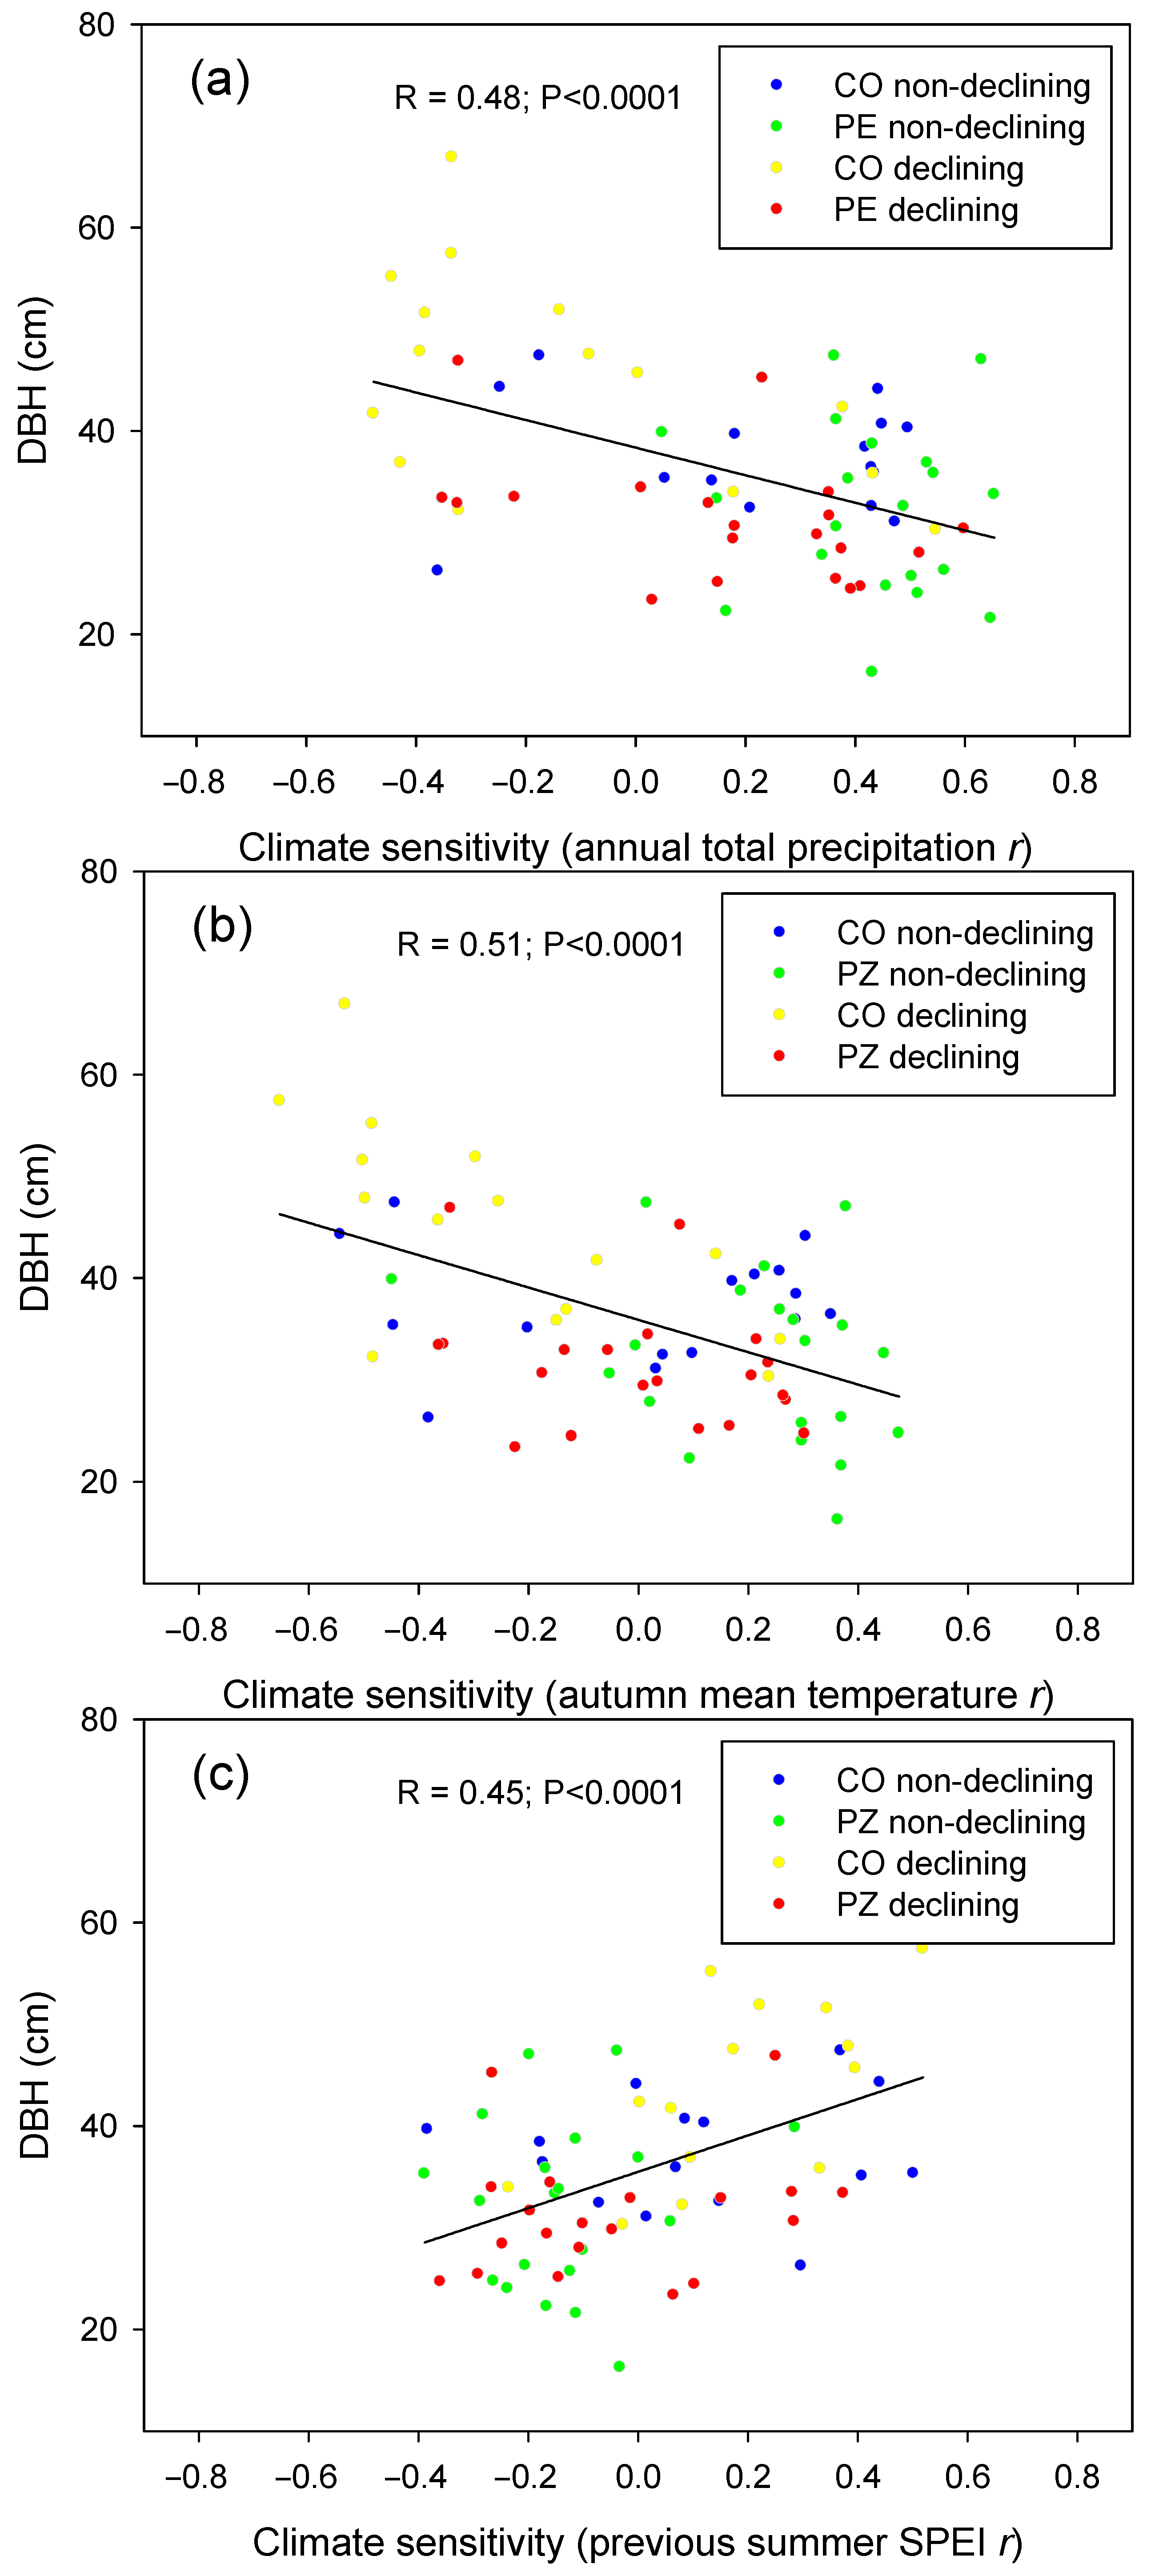
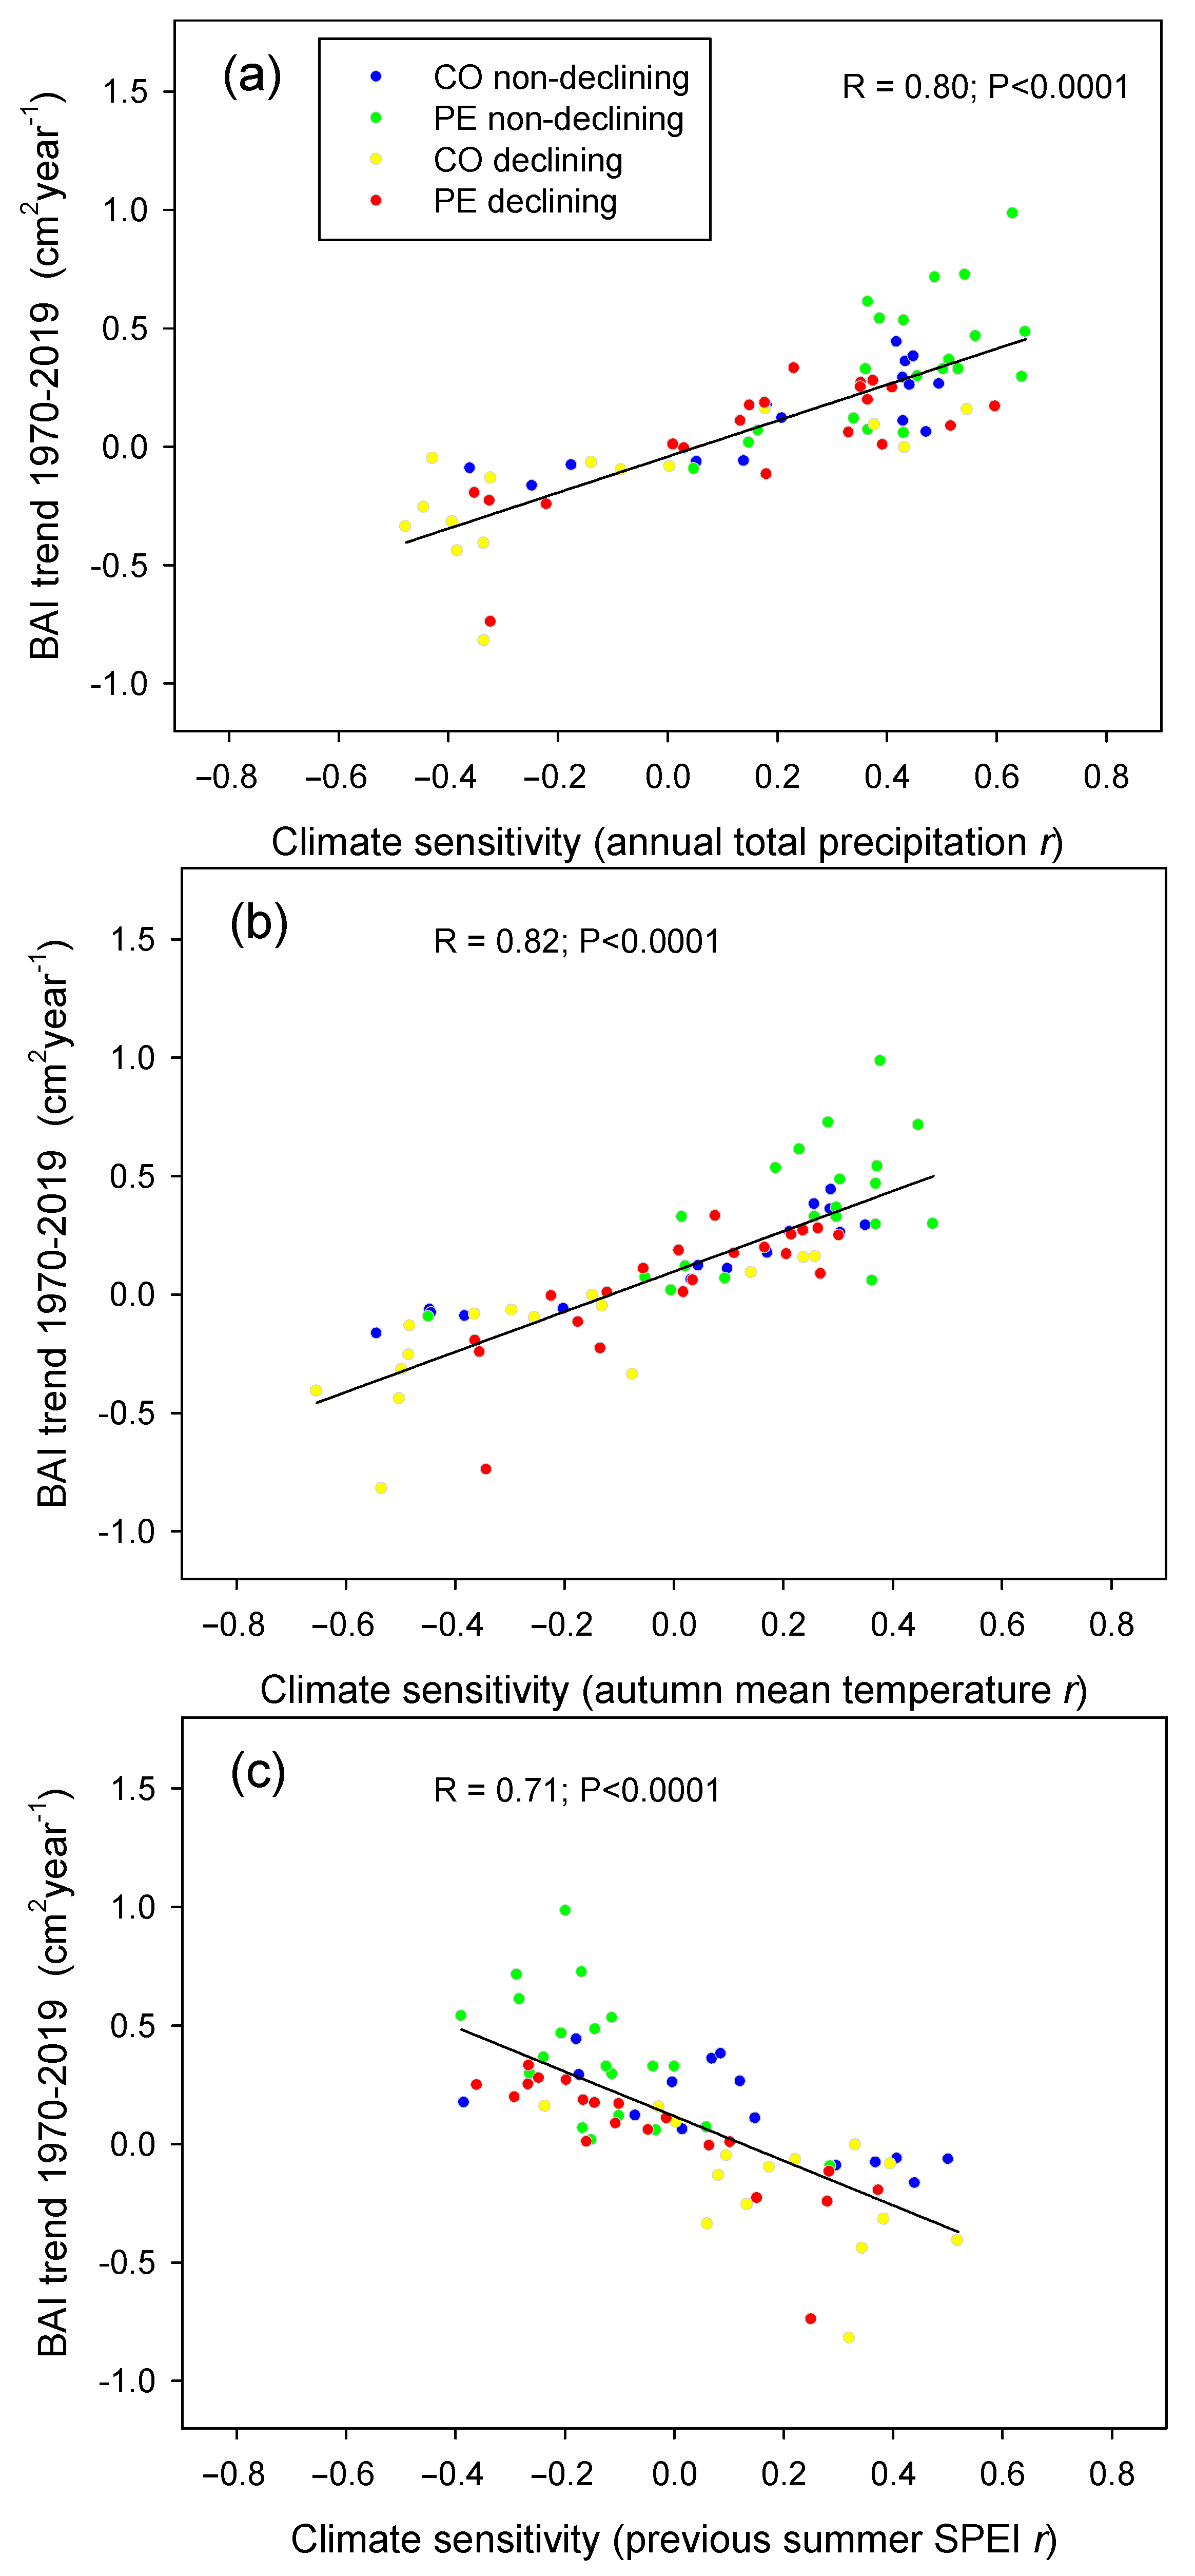
3.3. Climate Sensitivity

The population-level climate–growth sensitivity, estimated for the time span 1970–2018 (Figure 5a–d), indicates that non-declining trees from PE had positive correlations with precipitation and temperature for almost all seasons, as well as at the annual scale (Figure 5a); in contrast, non-declining trees from CO only showed a positive correlation with the precipitation of the previous summer (Sup), current summer (Su) and the total annual precipitation (Yr) (Figure 5c). Non-declining trees from PE also exhibited a positive sensitivity to temperature (Figure 5a). Declining trees from PE (Figure 5b) and CO (Figure 5d) differed, the negative influence of temperature being more evident in CO.
The population-level climate–growth sensitivity, estimated for the most recent time span 1990–2018 (Figure 5e–h), showed a shifting climate sensitivity in the non-declining trees from PE toward negative correlations to summer (Su) temperatures (Figure 5e). In the CO population, the most relevant difference was the positive relationship with the previous autumn (Aup) temperature (Figure 5g). The declining trees showed a negative relationship with summer (Su) temperature (Figure 5f), while the declining trees of CO showed a negative relationship with previous (Aup) and current autumn (Au) temperatures. The SPEI showed a positive relationship with the prior and current autumn (Figure 5h).

3.4. BAI Responsiveness to Drought

The results for drought sensitivity (DS) and drought recovery (DR) reveal that both populations do not exhibit a clear trend of sensitivity and recovery to drought conditions (Table 4 and Table 5). Negative values in DS show a limited resistance to drought on the part of individuals, and for DR, negative or lower values indicate low resilience. In the three years’ analysis of the BAI response to the annual drought index, it is observed that PE shows a higher sensitivity compared to CO. Specifically, the year 2011 stands out for having the greatest disparity in the results. In this year, both the overall population and non-declining and declining individuals in PE show negative values, while in CO, positive values are observed; it is important to highlight that between the years 2009 and 2012, high drought indices (below −1) were repeated for the CO population.

3.5. Age and Size Effect on Growth Patterns

The correlations obtained between tree-level DBH, age and BAI trends, and climate sensitivity are shown in the Supplementary Materials, Figure S9. The regression obtained between tree-level DBH and climate sensitivity (Figure 6) reveals that trees with smaller diameters exhibit a stronger positive sensitivity to total annual precipitation (Figure 6a), while trees with larger diameters showed a stronger negative sensitivity to autumn temperature (Figure 6b) and positive responses to prior summer water availability (SPEI, Figure 6c). The regression obtained between the tree-level growth trend and climate sensitivity (Figure 7) reveals that declining trees (characterized by negative BAI trends, see Table 2) exhibit a stronger negative sensitivity to autumn temperature (Figure 7b) and positive responses to prior summer water availability (Figure 7c). By contrast, the trees with a positive BAI trend were characterized by a stronger positive sensitivity to total annual precipitation (Figure 7a) and autumn temperature (Figure 7b).

4. Discussion

Extensive forest decline and mortality have been reported worldwide. Here, we investigate the influence of climate on tree growth trends and subsequent silver fir dieback and mortality in two populations from the Pyrenees, at the southwestern rear edge of the silver fir distribution range. We demonstrate the reliability of BAI trends as an indicator of impending tree decline and highlight the sensitivity of larger-diameter trees to climatic stressors, particularly an increase in autumn temperatures and drought (SPEI).
The study sites differed in elevation, total precipitation, and mean temperature, which limited the direct comparison between them. The unmanaged site (CO) is cooler but also located on a steeper slope, which may reduce the soil water-holding capacity and make trees prone to drought stress, as indicated by tree-ring data. Despite these differences, at a regional scale, both study sites are within the boundary of the species, with similarities in growth pattern and tree dieback [11,12,17]. Hence, both populations seem reliable for analyzing and forecasting the impacts of climate change on marginal silver fir stands.
Decline symptoms have been reported in A. alba stands from the Pyrenees since the 1980s, including growth decline, defoliation, limited seed production, and lack of regeneration [11,17,21]. Our result showed that both logged (PE) and unmanaged (CO) stands presented trees affected by die-off, characterized by similar decreasing basal area increments. This similar growth pattern suggests that regional warming might be the primary factor driving increased tree mortality [29,30]. Slow-growing trees within each population seem to die at a faster rate, likely as a result of diminished carbon budgets, which seem to limit the physiological adaptive capacity to increasing drought stress [29,30,31]. Nevertheless, we demonstrate that fast-growing individuals (with a higher DBH but not older) are also currently experiencing dieback.
Regional climate trends (temperature, precipitation, and SPEI) had similar patterns in both study areas. Mean annual temperature increases were according to the overall observed warming [32]. Nonetheless, the total annual precipitation shows slightly increasing trends, while the quantile regression analysis did not reveal a significant increase in extreme events (dry or wet), as no significant differences were obtained in the slope of the quantiles above or below the mean (i.e., quantile 0.5). Given that precipitation did not show long-term declining trends, our findings suggest that warming has a foremost role in the A. alba climate response. This is further supported by the SPEI analysis, which identified pervasive drought events in recent decades for both study areas. The intensity of drought was higher in the PE population, as it shows higher mean temperatures and a lower total precipitation compared to CO.
Climate–BAI relationships suggest a higher relative weight of temperature over precipitation controlling A. alba growth [11,33]. At the population level, we obtained a significant negative relationship in recent years (1990–2018) between the autumn and previous autumn temperature and BAI for the declining trees of CO, and summer temperature for the declining trees of PE. This negative response to warming has been previously reported in trees affected by dieback in different forests on a global scale [34]. Additionally, at tree-level, we observed the detrimental impact of drought on BAI trends. These findings, coupled with the rising frequency of drought events, align with worldwide observations of increasing tree mortality due to extreme weather conditions, particularly those involving droughts and heat waves [1].
BAI responsiveness to drought was not definite in our results. However, declining trees showed a higher drought sensitivity and lower short-term drought recovery, compared to non-declining trees. PE showed a higher drought sensitivity and lower drought recovery compared to CO in two of the three years analyzed. Although PE faces more arid conditions, because of warmer temperatures and reduced precipitation, CO also experienced recurrent drought events in the last decades, but it yielded improved drought recovery. Here, the synergistic effect between selective logging and drought in A. alba dieback should be considered. For instance, the unmanaged forest of CO showed older trees, with a higher DBH. However, it should be noted that there were no marked differences in the BAI, at least regarding recent decades, nor between non-declining and declining trees. These results suggest that logging could have enhanced to some extent the growth rates of PE, as western A. alba populations have typically more limited climate conditions to grow and harbor less genetic diversity [35,36,37]. Although forest management, such as thinning, is made with the aim of increasing the growth rate of the remaining trees, in our study case, it is noticeable that long-term selective logging was addressed to felling the biggest trees with the fastest growth rates, promoting the result that the remaining trees are nowadays those with slower growth rates [12]. In this sense, logging would be still enhancing growth to some extent, but it might not be the norm. Indeed, previous studies found that the declining trees from managed stands have, on average, lower growth rates [17], as should be expected if we consider BAI as a proxy of the whole tree carbon balance.
Our results support the reliability of BAI trends, to a greater extent than the mean BAI, as indicator of impending crown dieback [21]. While there were no significant differences in BAI between declining and non-declining trees (they were only significant in recent years for PE), differences were observed in BAI trends (See Table 2), indicating decreasing growth within the declining group. BAI may be used as a reliable proxy of whole-tree carbon gain [38,39]. Specifically, declining trends in BAI have been related to increasing mortality likelihood [9,40]. Indeed, reduced radial growth arises prior to visual symptoms of decline, such as abundant needle loss [11,12]. Dendrochronological estimates of drought sensitivity may also identify the impending decline of some populations, as declining trees showed a higher sensitivity to, and slower recovery from, drought.
The unmanaged population (CO) supports the hypothesis about the enhanced sensitivity of large trees to climate changes [1,3,6]. Hence, declining trees showed a higher DBH compared to non-declining trees, without significant differences in age at DBH. This result evidences that the differences in size rely on the growth rate, instead of age-effect. In contrast, in the population subjected to selective logging (PE), the DBH was not significantly different between declining and non-declining trees, suggesting that logged stands may suffer a restricted variability in sizes and growth rates as a consequence of long-term selective logging [11,12,17]. Nonetheless, the BAI of declining trees was slightly higher until the first half of the 1990s, pointing to this common pattern of higher growth rates or pervasive growth releases in current declining trees [39]. Additionally, we found that, at tree-level, larger diameters and trees with declining growth trends showed a stronger negative sensitivity to autumn temperature.

5. Conclusions

In this study, we aimed to investigate tree age, size (diameter), and tree-level climate sensitivity as predisposing factors related to growth trends and drought resilience indexes in contrasting populations of silver fir. Our hypothesis posited that larger trees would exhibit a higher climate sensitivity, predisposing them to growth decline and consequently making them more vulnerable to drought events. Our findings support this hypothesis, as we observed a significant relationship between tree size and climate sensitivity. Larger-diameter trees showed a greater sensitivity to climate variables, particularly temperature and drought, which corresponded to declining growth trends and an increased susceptibility to drought-induced decline symptoms.
Furthermore, our analysis of regional climatic trends revealed patterns consistent with global climate change projections, with increasing temperatures and drought events. These climatic changes have significant implications for silver fir populations, as demonstrated by the differing growth patterns and vulnerability to drought observed between declining and non-declining trees, even without a decline in total precipitation.
Overall, our study provides valuable insights into the complex interactions between tree characteristics, climate sensitivity, and growth trends in silver fir populations. These findings contribute to our understanding of forest dynamics under changing climatic conditions and highlight the importance of considering tree-level responses to climate variability in forest management and conservation efforts.

Supplementary Materials

The following supporting information can be downloaded at: https://www.mdpi.com/article/10.3390/f15060999/s1, Figure S1. Climate diagram Cotatuero (CO) and Paco Ezpela (PE) 1921–2018. Figure S2. Boxplot comparing age at DBH between declining (D) and non-declining (ND) trees in Cotatuero (CO) and Paco Ezpela (PE) populations. Figure S3. Boxplot comparing DBH between declining (D) and non-declining (ND) trees in Cotatuero (CO) and Paco Ezpela (PE) populations. Figure S4. Regression between tree age at coring height and DBH. Figure S5. Boxplot comparing mean BAI from 1970 to 2018 (cm2) between declining (D) and non-declining (ND) trees in Cotatuero (CO) and Paco Ezpela (PE) populations. Figure S6. Boxplot comparing mean BAI from 1990 to 2018 (cm2) between declining (D) and non-declining (ND) trees in Cotatuero (CO) and Paco Ezpela (PE) populations. Figure S7. Boxplot comparing BAI trend (cm2 × year−1) from 1970 to 2018 between declining (D) and non-declining (ND) trees in Cotatuero (CO) and Paco Ezpela (PE) populations. Figure S8. Boxplot comparing BAI trend (cm2 × year−1) from 1990 to 2018 between declining (D) and non-declining (ND) trees in Cotatuero (CO) and Paco Ezpela (PE) populations. Figure S9. Correlation matrix between climate, growth sensitivity, and growth patterns. Table S1. Two-way ANOVA of age at DBH. Table S2. Post-hoc Tukey HSD analysis of Age at DBH. Table S3. Two-way ANOVA of DBH. Table S4. Post hoc Tukey HSD analysis of DBH. Table S5. Two-way ANOVA of BAI mean from 1970 to 2018 (cm2). Table S6. Post hoc Tukey HSD analysis of BAI mean from 1970 to 2018 (cm2). Table S7. Two-way ANOVA of mean BAI from 1990 to 2018 (cm2). Table S8. Post hoc Tukey HSD analysis of mean BAI from 1990 to 2018 (cm2). Table S9. Two-way ANOVA of BAI trend from 1970 to 2018 (cm2 × year−1). Table S10. Post hoc Tukey HSD analysis of BAI trend from 1970 to 2018 (cm2 × year−1). Table S11. Two-way ANOVA of BAI trend from 1990 to 2018 (cm2 × year−1). Table S12. Post hoc Tukey HSD analysis of BAI trend from 1990 to 2018 (cm2 × year−1). Table S13. ANOVA temperature between populations. Table S14. ANOVA precipitation between populations. Table S15. Pearson correlation index for temperature in Cotatuero (CO). Table S16. Pearson correlation index for temperature in Paco Ezpela (PE). Table S17. Mann–Kendall trend test for precipitation in Cotatuero (CO). Table S18. Mann–Kendall trend test for precipitation in Paco Ezpela (PE). Table S19. Slope and p-value of precipitation quantile regression (1921–2018) in both populations.

Author Contributions

Conceptualization, J.C.L. and J.J.C.; Formal analysis, J.P.C.-A.; Funding acquisition, J.C.L. and J.J.C.; Investigation, J.P.C.-A.; Resources, E.G.d.A., A.G. and J.J.C.; Writing—original draft, J.P.C.-A.; Writing—review and editing, J.P.C.-A., E.G.d.A., A.G., J.J.C. and J.C.L. All authors have read and agreed to the published version of the manuscript.

Funding

This research was funded by Junta de Andalucía, grant number PAIDI, P18-RT-1170, and by the Spanish Ministry of Science and Innovation, grant numbers TED2021-129770B-C22 and PID2021-123675OB-C44.

Data Availability Statement

Data are available from the authors upon request.

Acknowledgments

We thank the Aragón Regional Government for its continuous support of this research. We thank three anonymous reviewers for their comments and corrections over the earlier versions of the manuscript.

Conflicts of Interest

The authors declare no conflicts of interest.

References

  1. Allen, C.D.; Breshears, D.D.; McDowell, N.G. On Underestimation of Global Vulnerability to Tree Mortality and Forest Die-off from Hotter Drought in the Anthropocene. Ecosphere 2015, 6, 1–55. [Google Scholar] [CrossRef]
  2. Batllori, E.; Lloret, F.; Aakala, T.; Anderegg, W.R.L.; Aynekulu, E.; Bendixsen, D.P.; Bentouati, A.; Bigler, C.; Burk, C.J.; Camarero, J.J.; et al. Forest and Woodland Replacement Patterns Following Drought-Related Mortality. Proc. Natl. Acad. Sci. USA 2020, 117, 29720–29729. [Google Scholar] [CrossRef] [PubMed]
  3. McDowell, N.G.; Allen, C.D.; Anderson-Teixeira, K.; Aukema, B.H.; Bond-Lamberty, B.; Chini, L.; Clark, J.S.; Dietze, M.; Grossiord, C.; Hanbury-Brown, A.; et al. Pervasive Shifts in Forest Dynamics in a Changing World. Science 2020, 368, eaaz9463. [Google Scholar] [CrossRef] [PubMed]
  4. Allen, C.D.; Macalady, A.K.; Chenchouni, H.; Bachelet, D.; McDowell, N.; Vennetier, M.; Kitzberger, T.; Rigling, A.; Breshears, D.D.; Hogg, E.T.; et al. A Global Overview of Drought and Heat-Induced Tree Mortality Reveals Emerging Climate Change Risks for Forests. For. Ecol. Manag. 2010, 259, 660–684. [Google Scholar] [CrossRef]
  5. Senf, C.; Buras, A.; Zang, C.S.; Rammig, A.; Seidl, R. Excess Forest Mortality Is Consistently Linked to Drought across Europe. Nat. Commun. 2020, 11, 6200. [Google Scholar] [CrossRef] [PubMed]
  6. Bennett, A.C.; McDowell, N.G.; Allen, C.D.; Anderson-Teixeira, K.J. Larger Trees Suffer Most during Drought in Forests Worldwide. Nat. Plants 2015, 1, 15139. [Google Scholar] [CrossRef] [PubMed]
  7. Camarero, J.J. The Multiple Factors Explaining Decline in Mountain Forests: Historical Logging and Warming-Related Drought Stress Is Causing Silver-Fir Dieback in the Aragón Pyrenees. In High Mountain Conservation in a Changing World; Catalan, J., Ninot, J.M., Aniz, M.M., Eds.; Advances in Global Change Research; Springer International Publishing: Cham, Switzerland, 2017; Volume 62, pp. 131–154. [Google Scholar] [CrossRef]
  8. European Commission. Joint Research Centre. In European Atlas of Forest Tree Species; Publications Office: Luxembourg, 2016. [Google Scholar]
  9. Bigler, C.; Gričar, J.; Bugmann, H.; Čufar, K. Growth Patterns as Indicators of Impending Tree Death in Silver Fir. For. Ecol. Manag. 2004, 199, 183–190. [Google Scholar] [CrossRef]
  10. Dobrowolska, D.; Bončina, A.; Klumpp, R. Ecology and Silviculture of Silver Fir (Abies alba Mill.): A Review. J. For. Res. 2017, 22, 326–335. [Google Scholar] [CrossRef]
  11. Gazol, A.; González De Andrés, E.; Colangelo, M.; Valeriano, C.; Camarero, J.J. Pyrenean Silver Fir Forests Retain Legacies of Past Disturbances and Climate Change in Their Growth, Structure and Composition. Forests 2023, 14, 713. [Google Scholar] [CrossRef]
  12. Sangüesa-Barreda, G.; Camarero, J.J.; Oliva, J.; Montes, F.; Gazol, A. Past Logging, Drought and Pathogens Interact and Contribute to Forest Dieback. Agric. For. Meteorol. 2015, 208, 85–94. [Google Scholar] [CrossRef]
  13. Valeriano, C.; Tumajer, J.; Gazol, A.; González De Andrés, E.; Sánchez-Salguero, R.; Colangelo, M.; Linares, J.C.; Valor, T.; Sangüesa-Barreda, G.; Julio Camarero, J. Delineating Vulnerability to Drought Using a Process-Based Growth Model in Pyrenean Silver Fir Forests. For. Ecol. Manag. 2023, 541, 121069. [Google Scholar] [CrossRef]
  14. Vejpustková, M.; Čihák, T.; Fišer, P. The Increasing Drought Sensitivity of Silver Fir (Abies alba Mill.) Is Evident in the Last Two Decades. J. For. Sci. 2023, 69, 67–79. [Google Scholar] [CrossRef]
  15. Fritts, H.C. Tree Rings and Climate; Academic Press: London, UK, 1976. [Google Scholar]
  16. Housset, J.M.; Tóth, E.G.; Girardin, M.P.; Tremblay, F.; Motta, R.; Bergeron, Y.; Carcaillet, C. Tree-Rings, Genetics and the Environment: Complex Interactions at the Rear Edge of Species Distribution Range. Dendrochronologia 2021, 69, 125863. [Google Scholar] [CrossRef]
  17. Camarero, J.J.; Bigler, C.; Linares, J.C.; Gil-Pelegrín, E. Synergistic Effects of Past Historical Logging and Drought on the Decline of Pyrenean Silver Fir Forests. For. Ecol. Manag. 2011, 262, 759–769. [Google Scholar] [CrossRef]
  18. Holmes, R.L. Computer-Assisted Quality Control in Tree-Ring Dating and Measurement. Tree-Ring Bull. 1983, 43, 69–78. [Google Scholar]
  19. Larsson, L.; Larsson, P. CooRecorder/CDendro Package. Available online: http://www.cybis.se/forfun/dendro (accessed on 10 May 2024).
  20. Biondi, F.; Qeadan, F. A Theory-Driven Approach to Tree-Ring Standardization: Defining the Biological Trend from Expected Basal Area Increment. Tree-Ring Res. 2008, 64, 81–96. [Google Scholar] [CrossRef]
  21. Linares, J.C.; Camarero, J.J. Growth Patterns and Sensitivity to Climate Predict Silver Fir Decline in the Spanish Pyrenees. Eur. J. For. Res. 2012, 131, 1001–1012. [Google Scholar] [CrossRef]
  22. Cornes, R.C.; Van Der Schrier, G.; Van Den Besselaar, E.J.M.; Jones, P.D. An Ensemble Version of the E-OBS Temperature and Precipitation Data Sets. JGR Atmos. 2018, 123, 9391–9409. [Google Scholar] [CrossRef]
  23. Haylock, M.R.; Hofstra, N.; Klein Tank, A.M.G.; Klok, E.J.; Jones, P.D.; New, M. A European Daily High-resolution Gridded Data Set of Surface Temperature and Precipitation for 1950–2006. J. Geophys. Res. 2008, 113, 2008JD010201. [Google Scholar] [CrossRef]
  24. Beguería, S.; Vicente-Serrano, S.M.; Angulo-Martínez, M. A Multiscalar Global Drought Dataset: The SPEIbase: A New Gridded Product for the Analysis of Drought Variability and Impacts. Bull. Am. Meteor. Soc. 2010, 91, 1351–1356. [Google Scholar] [CrossRef]
  25. Vicente-Serrano, S.M.; Beguería, S.; López-Moreno, J.I. A Multiscalar Drought Index Sensitive to Global Warming: The Standardized Precipitation Evapotranspiration Index. J. Clim. 2010, 23, 1696–1718. [Google Scholar] [CrossRef]
  26. Beguería, S.; Vicente-Serrano, S.M.; Reig, F.; Latorre, B. Standardized Precipitation Evapotranspiration Index (SPEI) Revisited: Parameter Fitting, Evapotranspiration Models, Tools, Datasets and Drought Monitoring. Int. J. Climatol. 2014, 34, 3001–3023. [Google Scholar] [CrossRef]
  27. R Core Team. R: A Language and Environment for Statistical Computing. 2024. Available online: https://www.R-project.org/ (accessed on 10 May 2024).
  28. Alderotti, F.; Sillo, F.; Brilli, L.; Bussotti, F.; Centritto, M.; Ferrini, F.; Gori, A.; Inghes, R.; Pasquini, D.; Pollastrini, M.; et al. Quercus ilex L. Dieback Is Genetically Determined: Evidence Provided by Dendrochronology, δ13C and SSR Genotyping. Sci. Total Environ. 2023, 904, 166809. [Google Scholar] [CrossRef] [PubMed]
  29. Van Mantgem, P.J.; Stephenson, N.L.; Byrne, J.C.; Daniels, L.D.; Franklin, J.F.; Fulé, P.Z.; Harmon, M.E.; Larson, A.J.; Smith, J.M.; Taylor, A.H.; et al. Widespread Increase of Tree Mortality Rates in the Western United States. Science 2009, 323, 521–524. [Google Scholar] [CrossRef] [PubMed]
  30. Adams, H.D.; Guardiola-Claramonte, M.; Barron-Gafford, G.A.; Villegas, J.C.; Breshears, D.D.; Zou, C.B.; Troch, P.A.; Huxman, T.E. Temperature Sensitivity of Drought-Induced Tree Mortality Portends Increased Regional Die-off under Global-Change-Type Drought. Proc. Natl. Acad. Sci. USA 2009, 106, 7063–7066. [Google Scholar] [CrossRef] [PubMed]
  31. McDowell, N.; Pockman, W.T.; Allen, C.D.; Breshears, D.D.; Cobb, N.; Kolb, T.; Plaut, J.; Sperry, J.; West, A.; Williams, D.G.; et al. Mechanisms of Plant Survival and Mortality during Drought: Why Do Some Plants Survive While Others Succumb to Drought? New Phytol. 2008, 178, 719–739. [Google Scholar] [CrossRef] [PubMed]
  32. Intergovernmental Panel on Climate Change. Climate Change 2021—The Physical Science Basis: Working Group I Contribution to the Sixth Assessment Report of the Intergovernmental Panel on Climate Change, 1st ed.; Cambridge University Press: Cambridge, UK, 2023. [Google Scholar] [CrossRef]
  33. Carrer, M.; Nola, P.; Motta, R.; Urbinati, C. Contrasting Tree-Ring Growth to Climate Responses of Abies alba toward the Southern Limit of Its Distribution Area. Oikos 2010, 119, 1515–1525. [Google Scholar] [CrossRef]
  34. Hammond, W.M.; Williams, A.P.; Abatzoglou, J.T.; Adams, H.D.; Klein, T.; López, R.; Sáenz-Romero, C.; Hartmann, H.; Breshears, D.D.; Allen, C.D. Global Field Observations of Tree Die-off Reveal Hotter-Drought Fingerprint for Earth’s Forests. Nat. Commun. 2022, 13, 1761. [Google Scholar] [CrossRef] [PubMed]
  35. Konnert, M.; Bergmann, F. The Geographical Distribution of Genetic Variation of Silver Fir (Abies alba, Pinaceae) in Relation to Its Migration History. Pl. Syst. Evol. 1995, 196, 19–30. [Google Scholar] [CrossRef]
  36. Liepelt, S.; Cheddadi, R.; De Beaulieu, J.-L.; Fady, B.; Gömöry, D.; Hussendörfer, E.; Konnert, M.; Litt, T.; Longauer, R.; Terhürne-Berson, R.; et al. Postglacial Range Expansion and Its Genetic Imprints in Abies alba (Mill.)—A Synthesis from Palaeobotanic and Genetic Data. Rev. Palaeobot. Palynol. 2009, 153, 139–149. [Google Scholar] [CrossRef]
  37. Bosela, M.; Popa, I.; Gömöry, D.; Longauer, R.; Tobin, B.; Kyncl, J.; Kyncl, T.; Nechita, C.; Petráš, R.; Sidor, C.G.; et al. Effects of Post-glacial Phylogeny and Genetic Diversity on the Growth Variability and Climate Sensitivity of European Silver Fir. J. Ecol. 2016, 104, 716–724. [Google Scholar] [CrossRef]
  38. Dobbertin, M. Tree Growth as Indicator of Tree Vitality and of Tree Reaction to Environmental Stress: A Review. Eur. J. For. Res. 2005, 124, 319–333. [Google Scholar] [CrossRef]
  39. Wyckoff, P.H.; Clark, J.S. Predicting Tree Mortality from Diameter Growth: A Comparison of Maximum Likelihood and Bayesian Approaches. Can. J. For. Res. 2000, 30, 156–167. [Google Scholar] [CrossRef]
  40. Ogle, K.; Whitham, T.G.; Cobb, N.S. Tree-Ring Variation in Pinyon Predicts Likelihood of Death Following Severe Drought. Ecology 2000, 81, 3237–3243. [Google Scholar] [CrossRef]
Figure 1. Average basal area increment of non-declining (green) and declining (red) trees from 1970 to 2018 at study sites (a) Cotatuero and (b) Paco Ezpela.
Forests 15 00999 g001
Figure 2. Trend of annual mean temperature 1921–2018 in study area (a) Cotatuero and (b) Paco Ezpela. The red line represents a linear trendline.
Forests 15 00999 g002
Figure 3. Trend of precipitation in study area in (a) Cotatuero and (b) Paco Ezpela. The lines represent different quantile regression lines.
Forests 15 00999 g003
Figure 4. Annual (12 months estimate) drought index (SPEI) in Cotatuero, CO (a) and Paco Ezpela, PE (b). The blue and red bars represent 12-months periods with drought above and below the mean, respectively.
Forests 15 00999 g004
Figure 5. Climate sensitivity (correlation) of mean growth (mean basal area increment) for periods 1970–2018 (left panel, (ad) figures) and 1990–2018 (right panel, (eh) figures) of Abies alba trees from Paco Ezpela (PZ) (a,b,e,f) and Cotatuero (CO) (c,d,g,h) populations. Sensitivity was tested at seasonal and annual scales for mean temperature (red), total precipitation (blue), and SPEI drought index (purple). Seasonal scale is defined by mean (sum) of three-monthly-scale temperature (precipitation), while seasonal-scale SPEI data were directly obtained from database using available three months estimates (noted as SPEI_3); similarly, annual estimates consider hydrological year (prior September to current August), and August estimate of SPEI_12 (Yr). Seasons are noted as winter (Wi), spring (Sp), summer (Su), and autumn (Au), including December–February, March–May, June–August, and September–November, respectively. Further, we consider seasonal correlations for summer and autumn of the previous year of tree-ring formation (Sup and Aup, respectively). * and ** indicate significant correlations after Bonferroni correction at a threshold of p < 0.01 and p < 0.05, respectively.
Forests 15 00999 g005
Figure 6. Tree-level DBH and climate sensitivity (correlation, r) estimates for tree-level basal area increment and annual total precipitation (a), autumn mean temperature (b), and previous summer SPEI (c) for period 1970–2018. Declining and non-declining trees are represented separately for Paco Ezpela (PZ) (red and green dots, respectively) and Cotatuero (CO) (yellow and blue dots, respectively). The inset indicates the regression coefficient of the obtained linear function and its p-value.
Forests 15 00999 g006
Figure 7. Tree-level growth trend and climate sensitivity (correlation, r) estimates for basal area increment and annual total precipitation (a), autumn mean temperature (b), and previous summer SPEI (c) for period 1970–2018. Declining and non-declining trees are represented separately for Paco Ezpela (PZ) (red and green dots, respectively) and Cotatuero (CO) (yellow and blue dots, respectively). The inset indicates the regression coefficient of the obtained linear function and its p-value.
Forests 15 00999 g007
Table 1. Stand characteristics of study sites. The population-level percentage of declining trees is expressed as the percentage of trees reported by the literature with crown cover ≤ 50%.
Paco Ezpela (PE)Cotatuero (CO)
Latitude (N)42.75000042.653576
Longitude (W)−0.520000−0.050732
AspectN-NES-SO
Elevation (m.a.s.l.)12321640
Slope (°)2734
Basal area (m2ha−1)15.129.4
Number of sampled trees40 (20 + 20)30 (15 + 15)
Declining trees 1999–2001 (%)40No Data
Declining trees 2011–2012 (%)6456
Declining trees 2017–2020 (%)2815
Table 2. Mean BAI and BAI trend statistics of silver fir stands PE and CO for periods 1970–2018 and 1990–2018. Data are mean values ± SE. Different letters within the same column (for a given variable and time period) indicate significant differences.
Site (Code)1970 to 20181990 to 2018
Mean BAI (cm2) BAI Trend (cm2 × Year−1)Mean BAI (cm2) BAI Trend (cm2 × Year−1)
Cotatuero (CO) Declining14.3 ± 2.20 a−0.17 ± 0.06 c13.0 ± 1.92 ab−0.31 ± 0.16 b
Cotatuero (CO) Non-declining11.3 ± 0.93 a0.13 ± 0.06 b12.2 ± 1.23 ab0.36 ± 0.10 a
Paco Ezpela (PE) Declining9.92 ± 0.91 a0.04 ± 0.05 bc10.8 ± 1.08 b−0.07 ± 0.05 b
Paco Ezpela (PE) Non-declining12.8 ± 1.32 a0.36 ± 0.06 a16.5 ± 1.70 a0.48 ± 0.10 a
Table 3. Seasonal and annual mean temperature and total precipitation.
Site (Code)AnnualWinterSpringSummerAutumn
Temperature (°C)
Paco Ezpela (PE)9.402.308.0017.1010.20
Cotatuero (CO)6.00−0.404.9014.207.30
Precipitation (mm)
Paco Ezpela (PE)882228254165236
Cotatuero (CO)1093281320208284
Table 4. BAI response to annual drought index (SPEI) in Cotatuero (CO).
Cotatuero (CO)198519952011
Combined (Non-Declining + Declining)
Drought sensitivity (DS)12.81%−4.74%5.54%
Drought recovery (DR)−9.97%−20.13%10.60%
Non-declining
Drought sensitivity (DS)−4.73%4.29%4.26%
Drought recovery (DR)−6.49%−4.05%20.51%
Declining
Drought sensitivity (DS)1.72%−3.44%−3.49%
Drought recovery (DR)4.86%−11.24%−12.99%
Table 5. BAI response to annual drought index (SPEI) in Paco Ezpela (PE).
Paco Ezpela (PE)198519952011
Combined (Non-Declining + Declining)
Drought sensitivity (DS)−2.13%4.82%−16.93%
Drought recovery (DR)−18.41%53.59%−12.96%
Non-declining
Drought sensitivity (DS)4.59%4.51%−12.79%
Drought recovery (DR)−7.88%61.76%−1.80%
Declining
Drought sensitivity (DS)−7.28%5.13%−22.62%
Drought recovery (DR)−26.49%45.68%−28.34%
Disclaimer/Publisher’s Note: The statements, opinions and data contained in all publications are solely those of the individual author(s) and contributor(s) and not of MDPI and/or the editor(s). MDPI and/or the editor(s) disclaim responsibility for any injury to people or property resulting from any ideas, methods, instructions or products referred to in the content.

