
Vegetation Dynamics since the Last Glacial Maximum in Central Yunnan, Southwest China

 ,
,  and
and
Abstract
1. Introduction
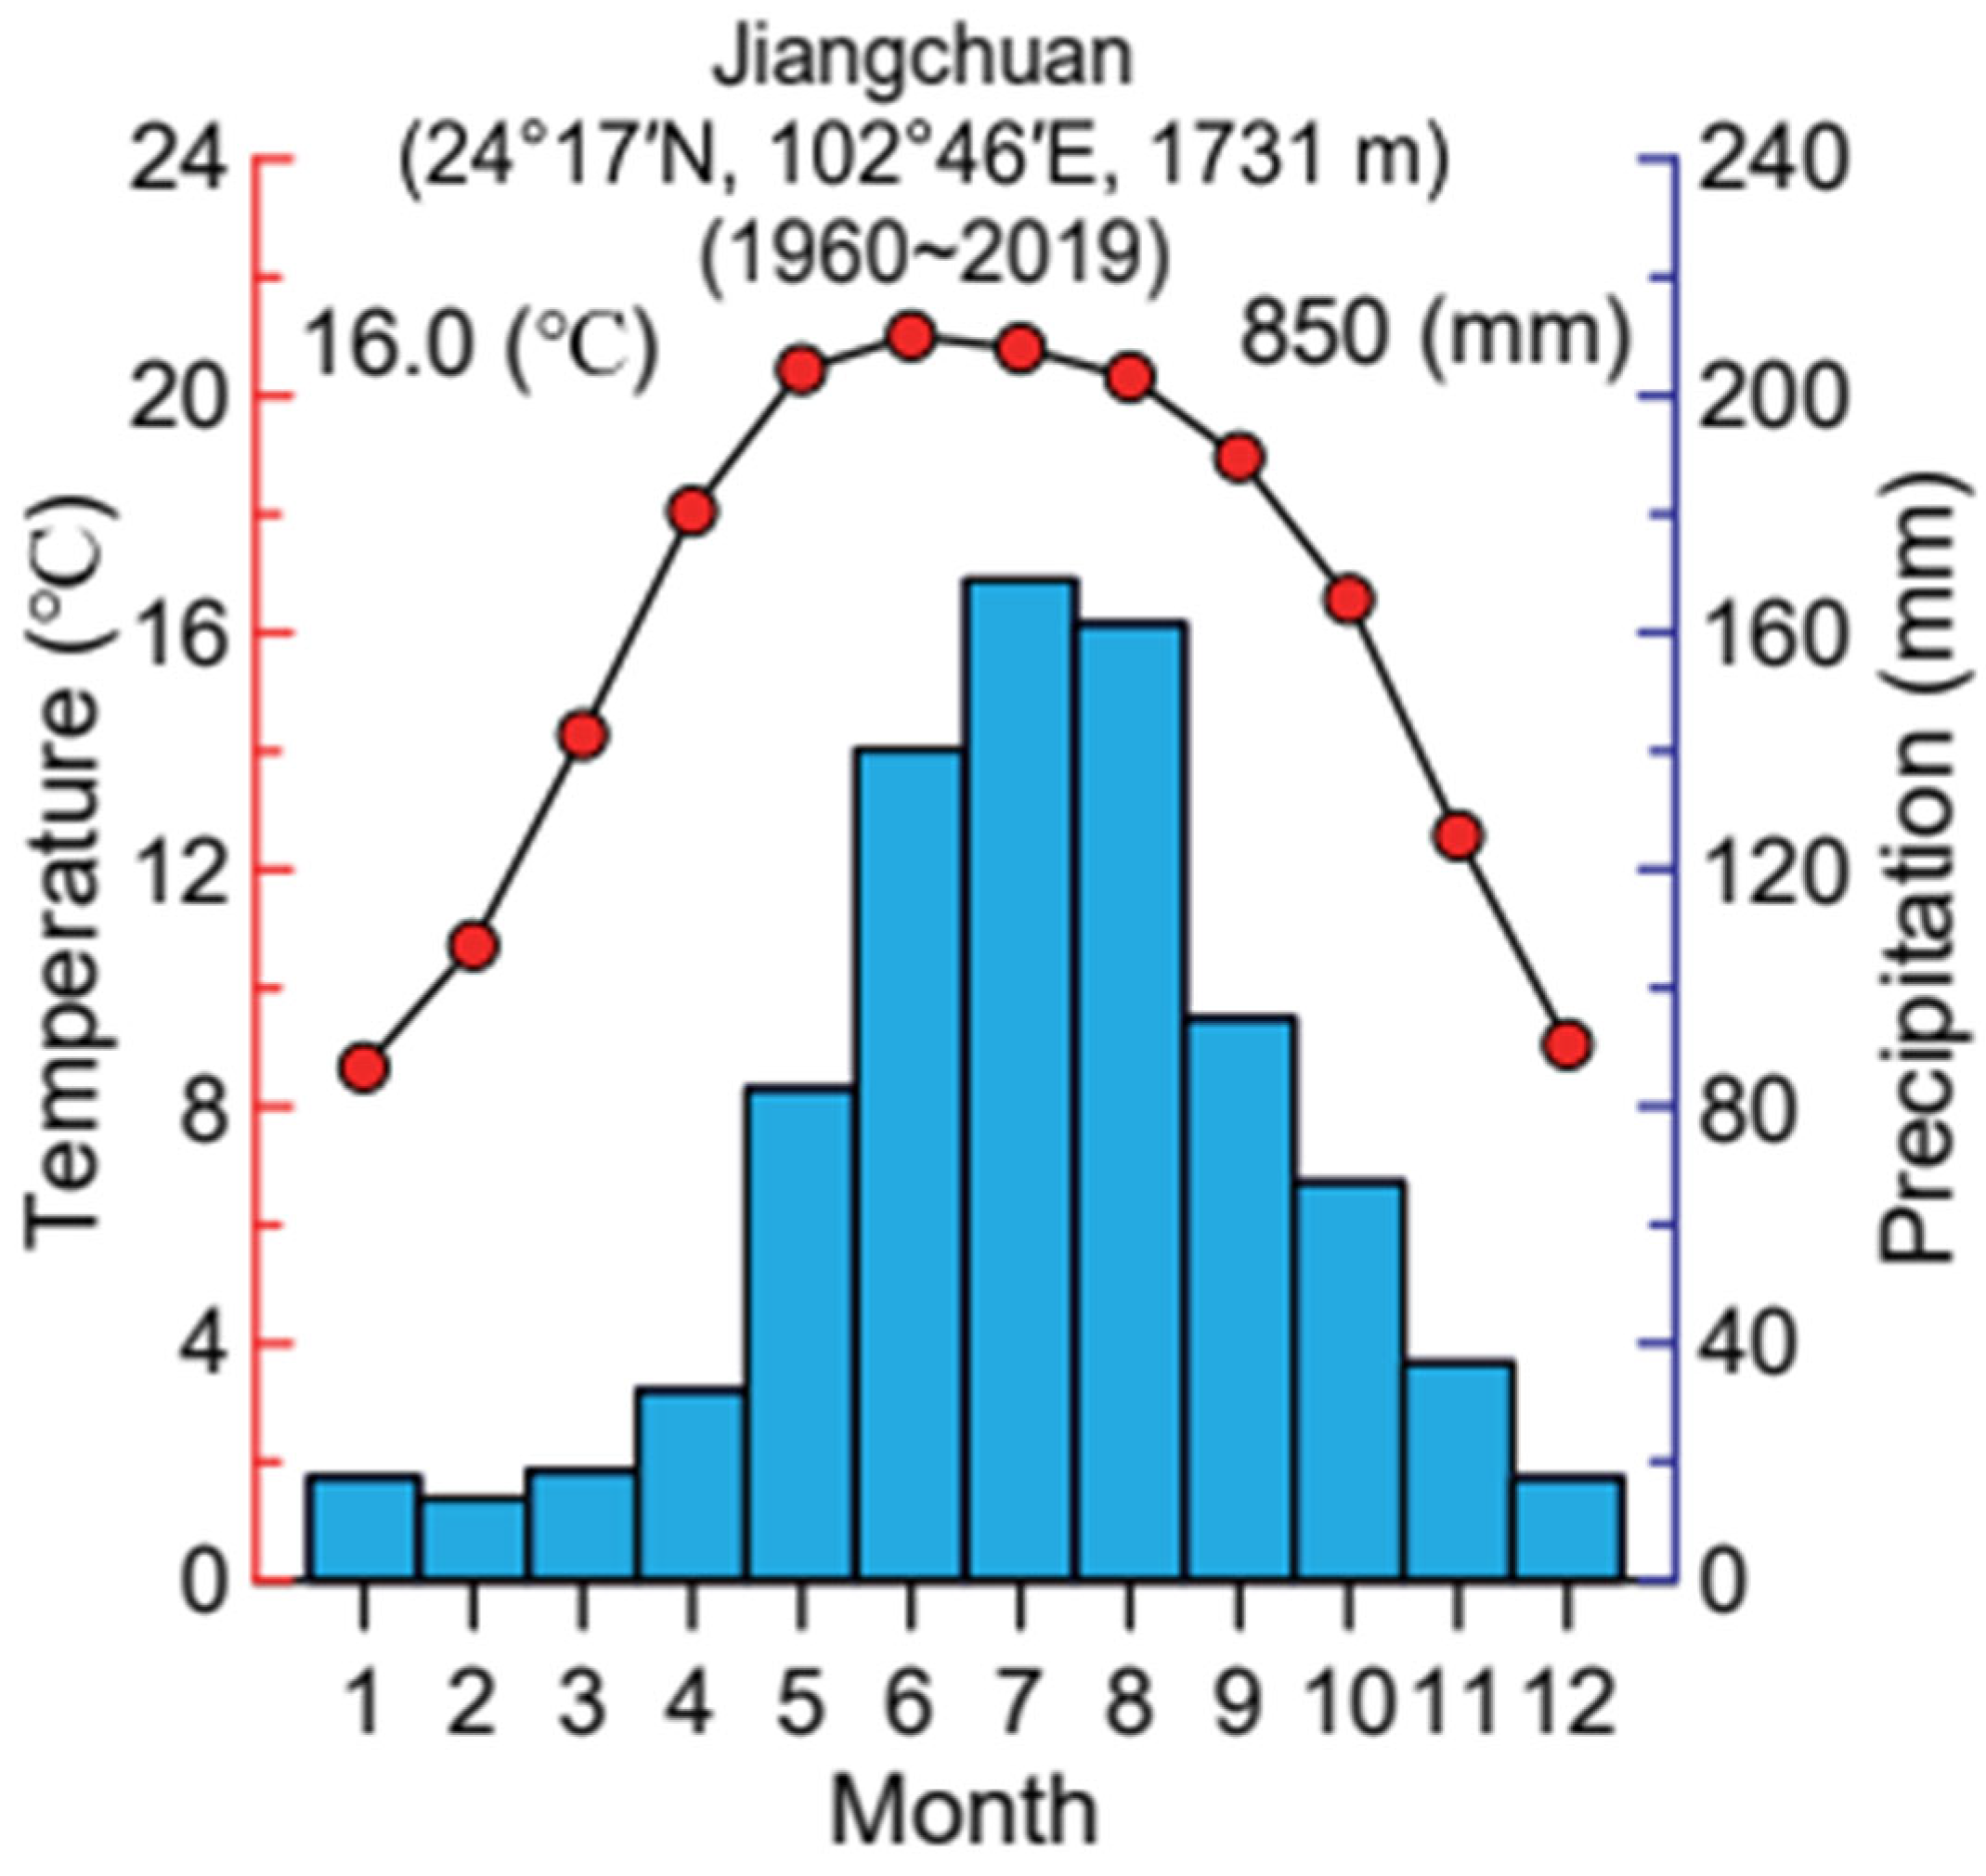
2. Site Description
3. Materials and Methods
4. Results
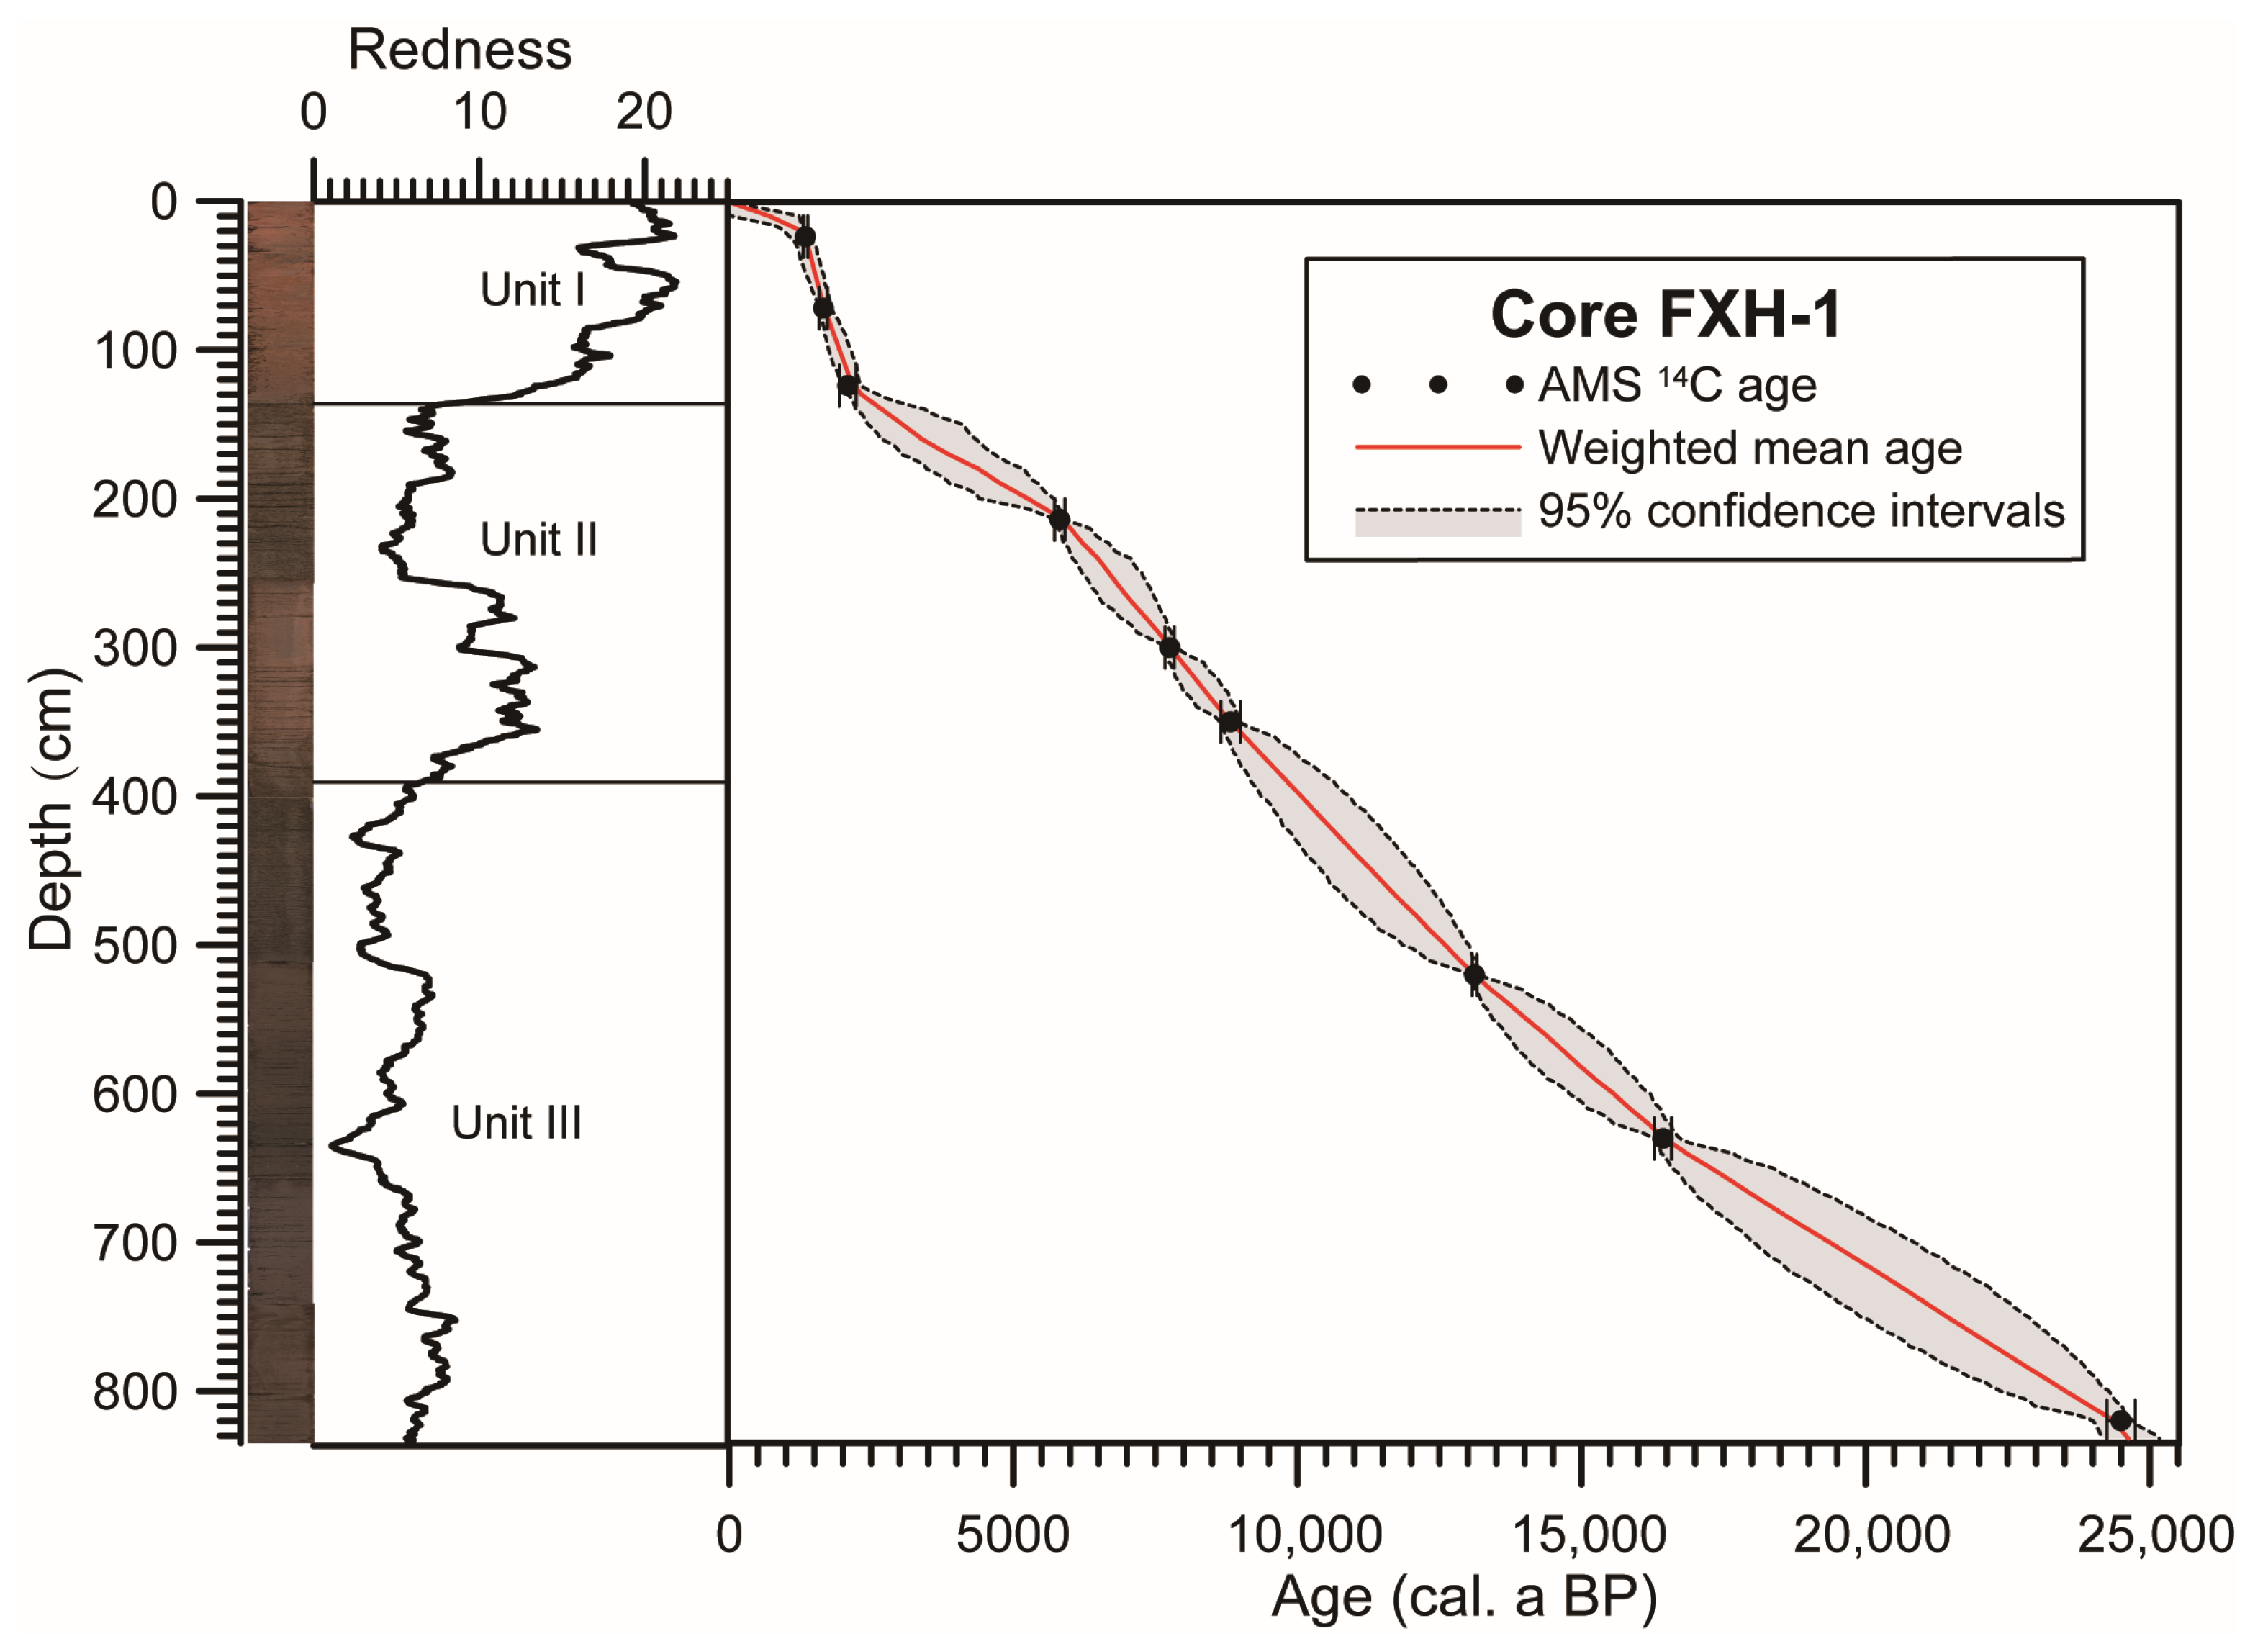
4.1. Stratigraphy and Chronology of Core FXH-1 from Lake Fuxian
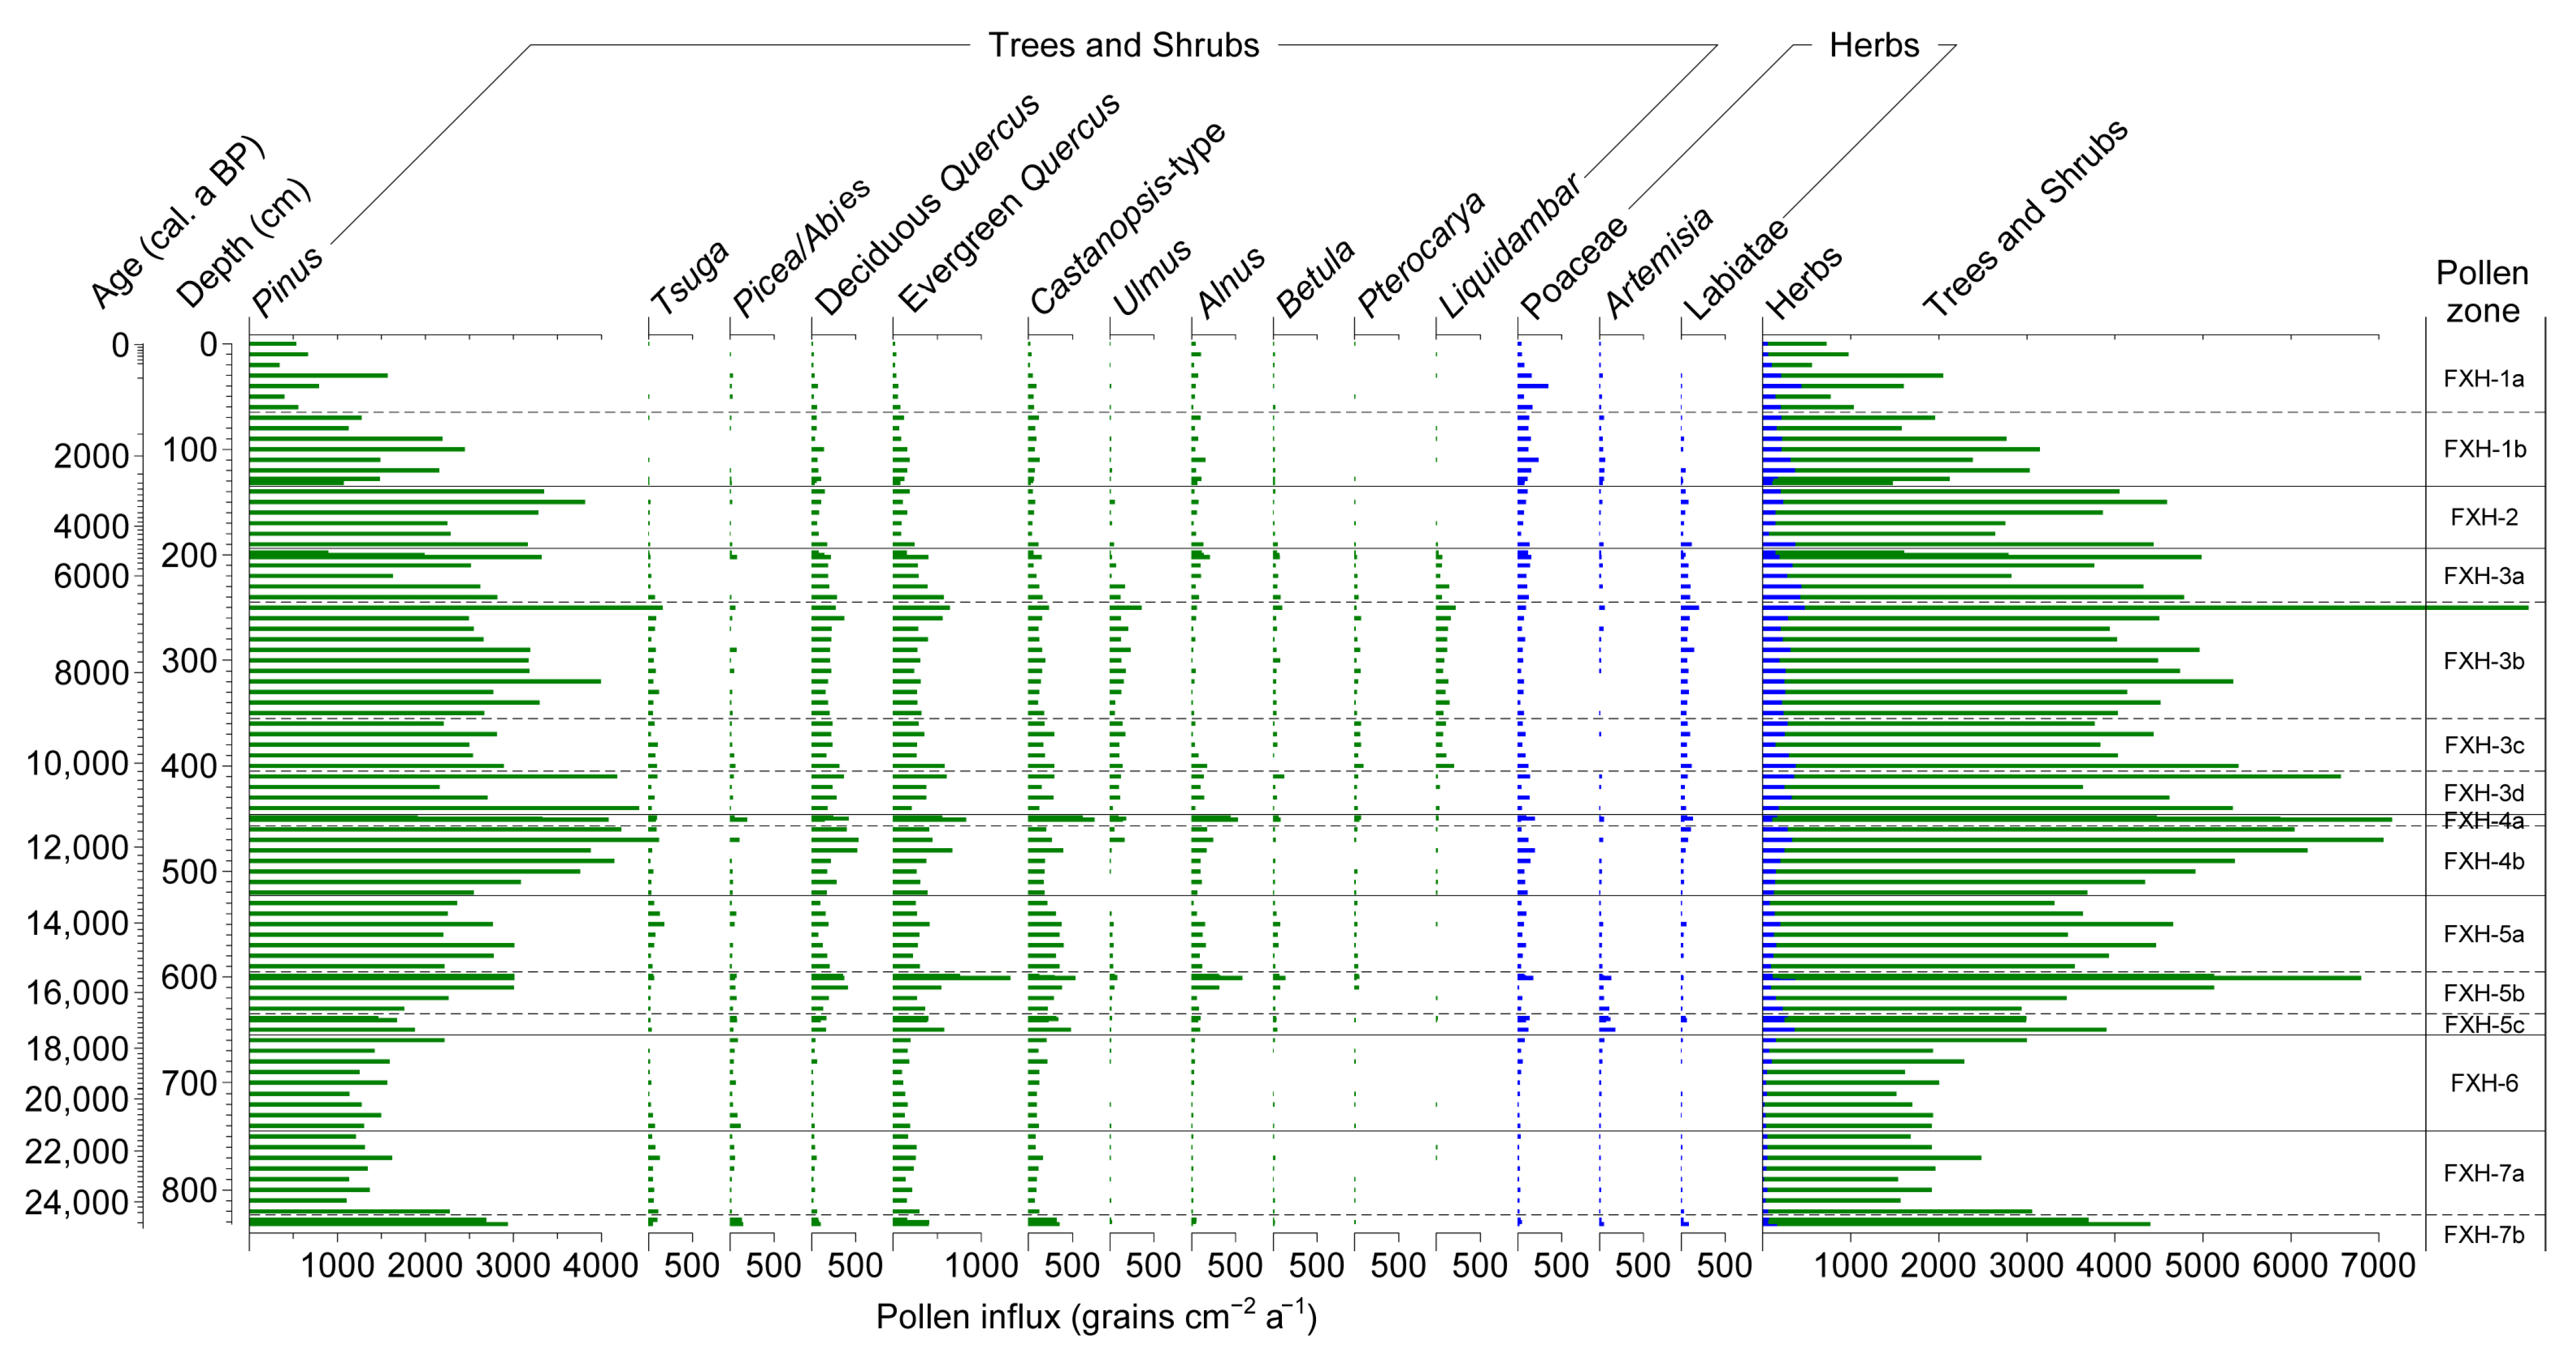
4.2. Pollen Record of Core FXH-1 from Lake Fuxian
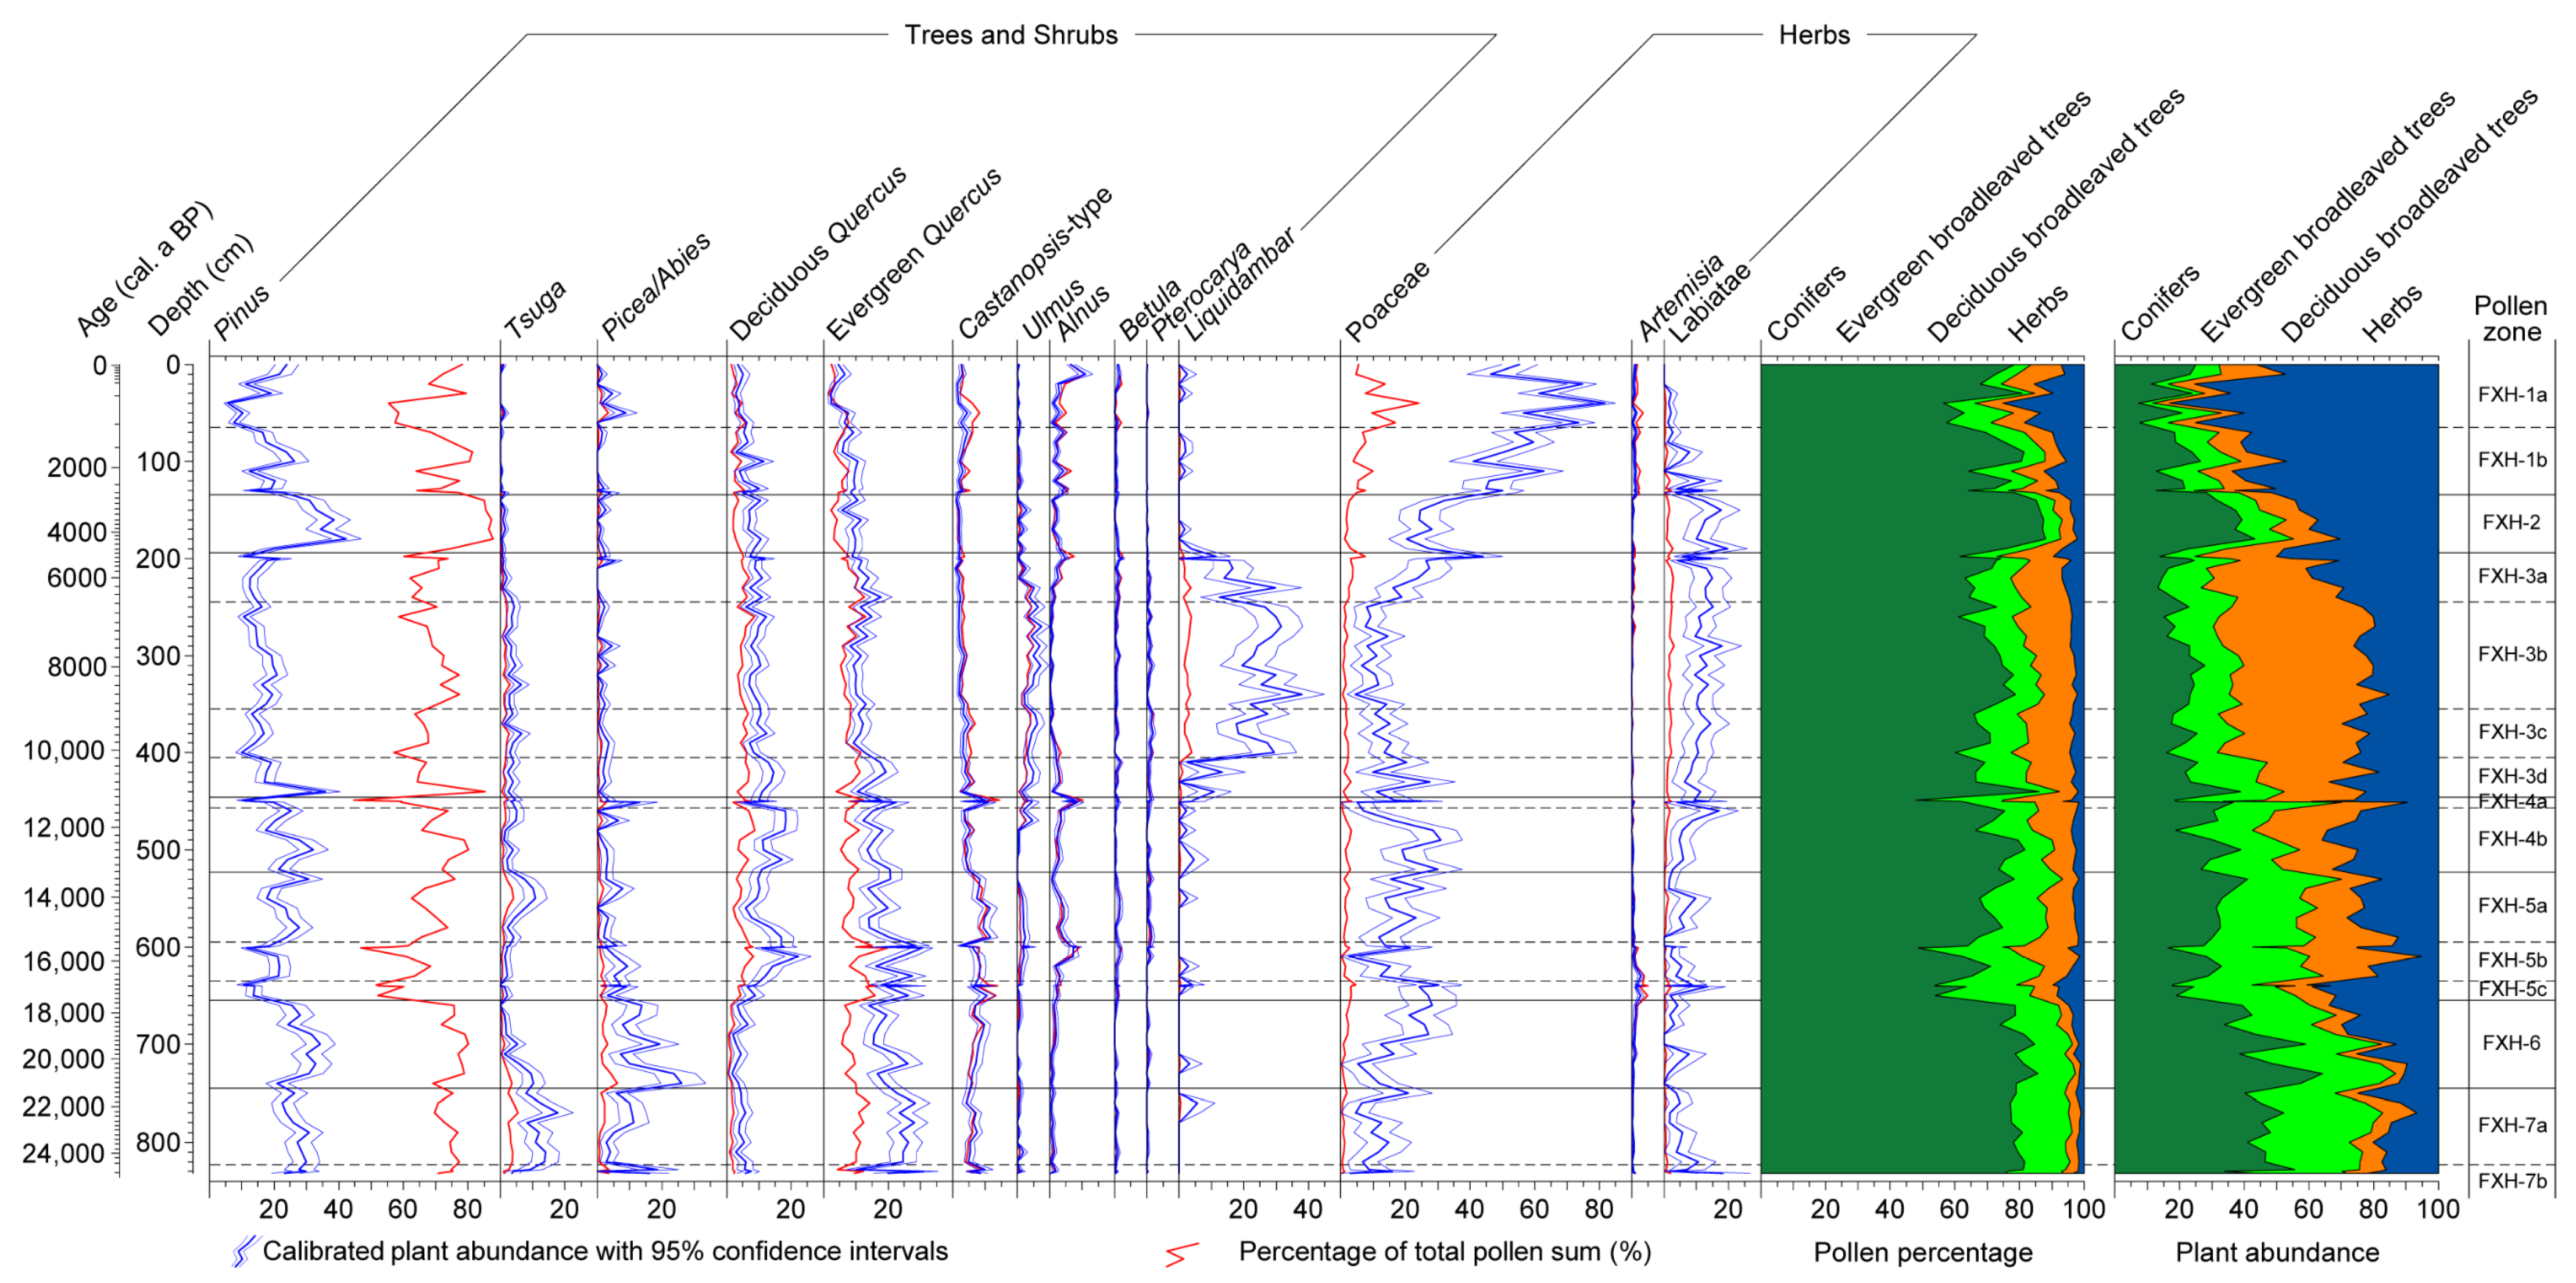
4.3. PA of RVC in the Catchment of Lake Fuxian since the LGM
4.4. Forest Types in the Catchment of Lake Fuxian since the LGM
4.5. Regional Vegetation Dynamics in the Catchment of Lake Fuxian since the LGM
5. Discussion
5.1. Regional Vegetation Dynamics in the Lake Fuxian Catchment since the LGM in Response to Climate Change
5.2. Regional Vegetation Dynamics in the Lake Fuxian Catchment since 2500 cal. a BP in Response to Human Activities
6. Conclusions
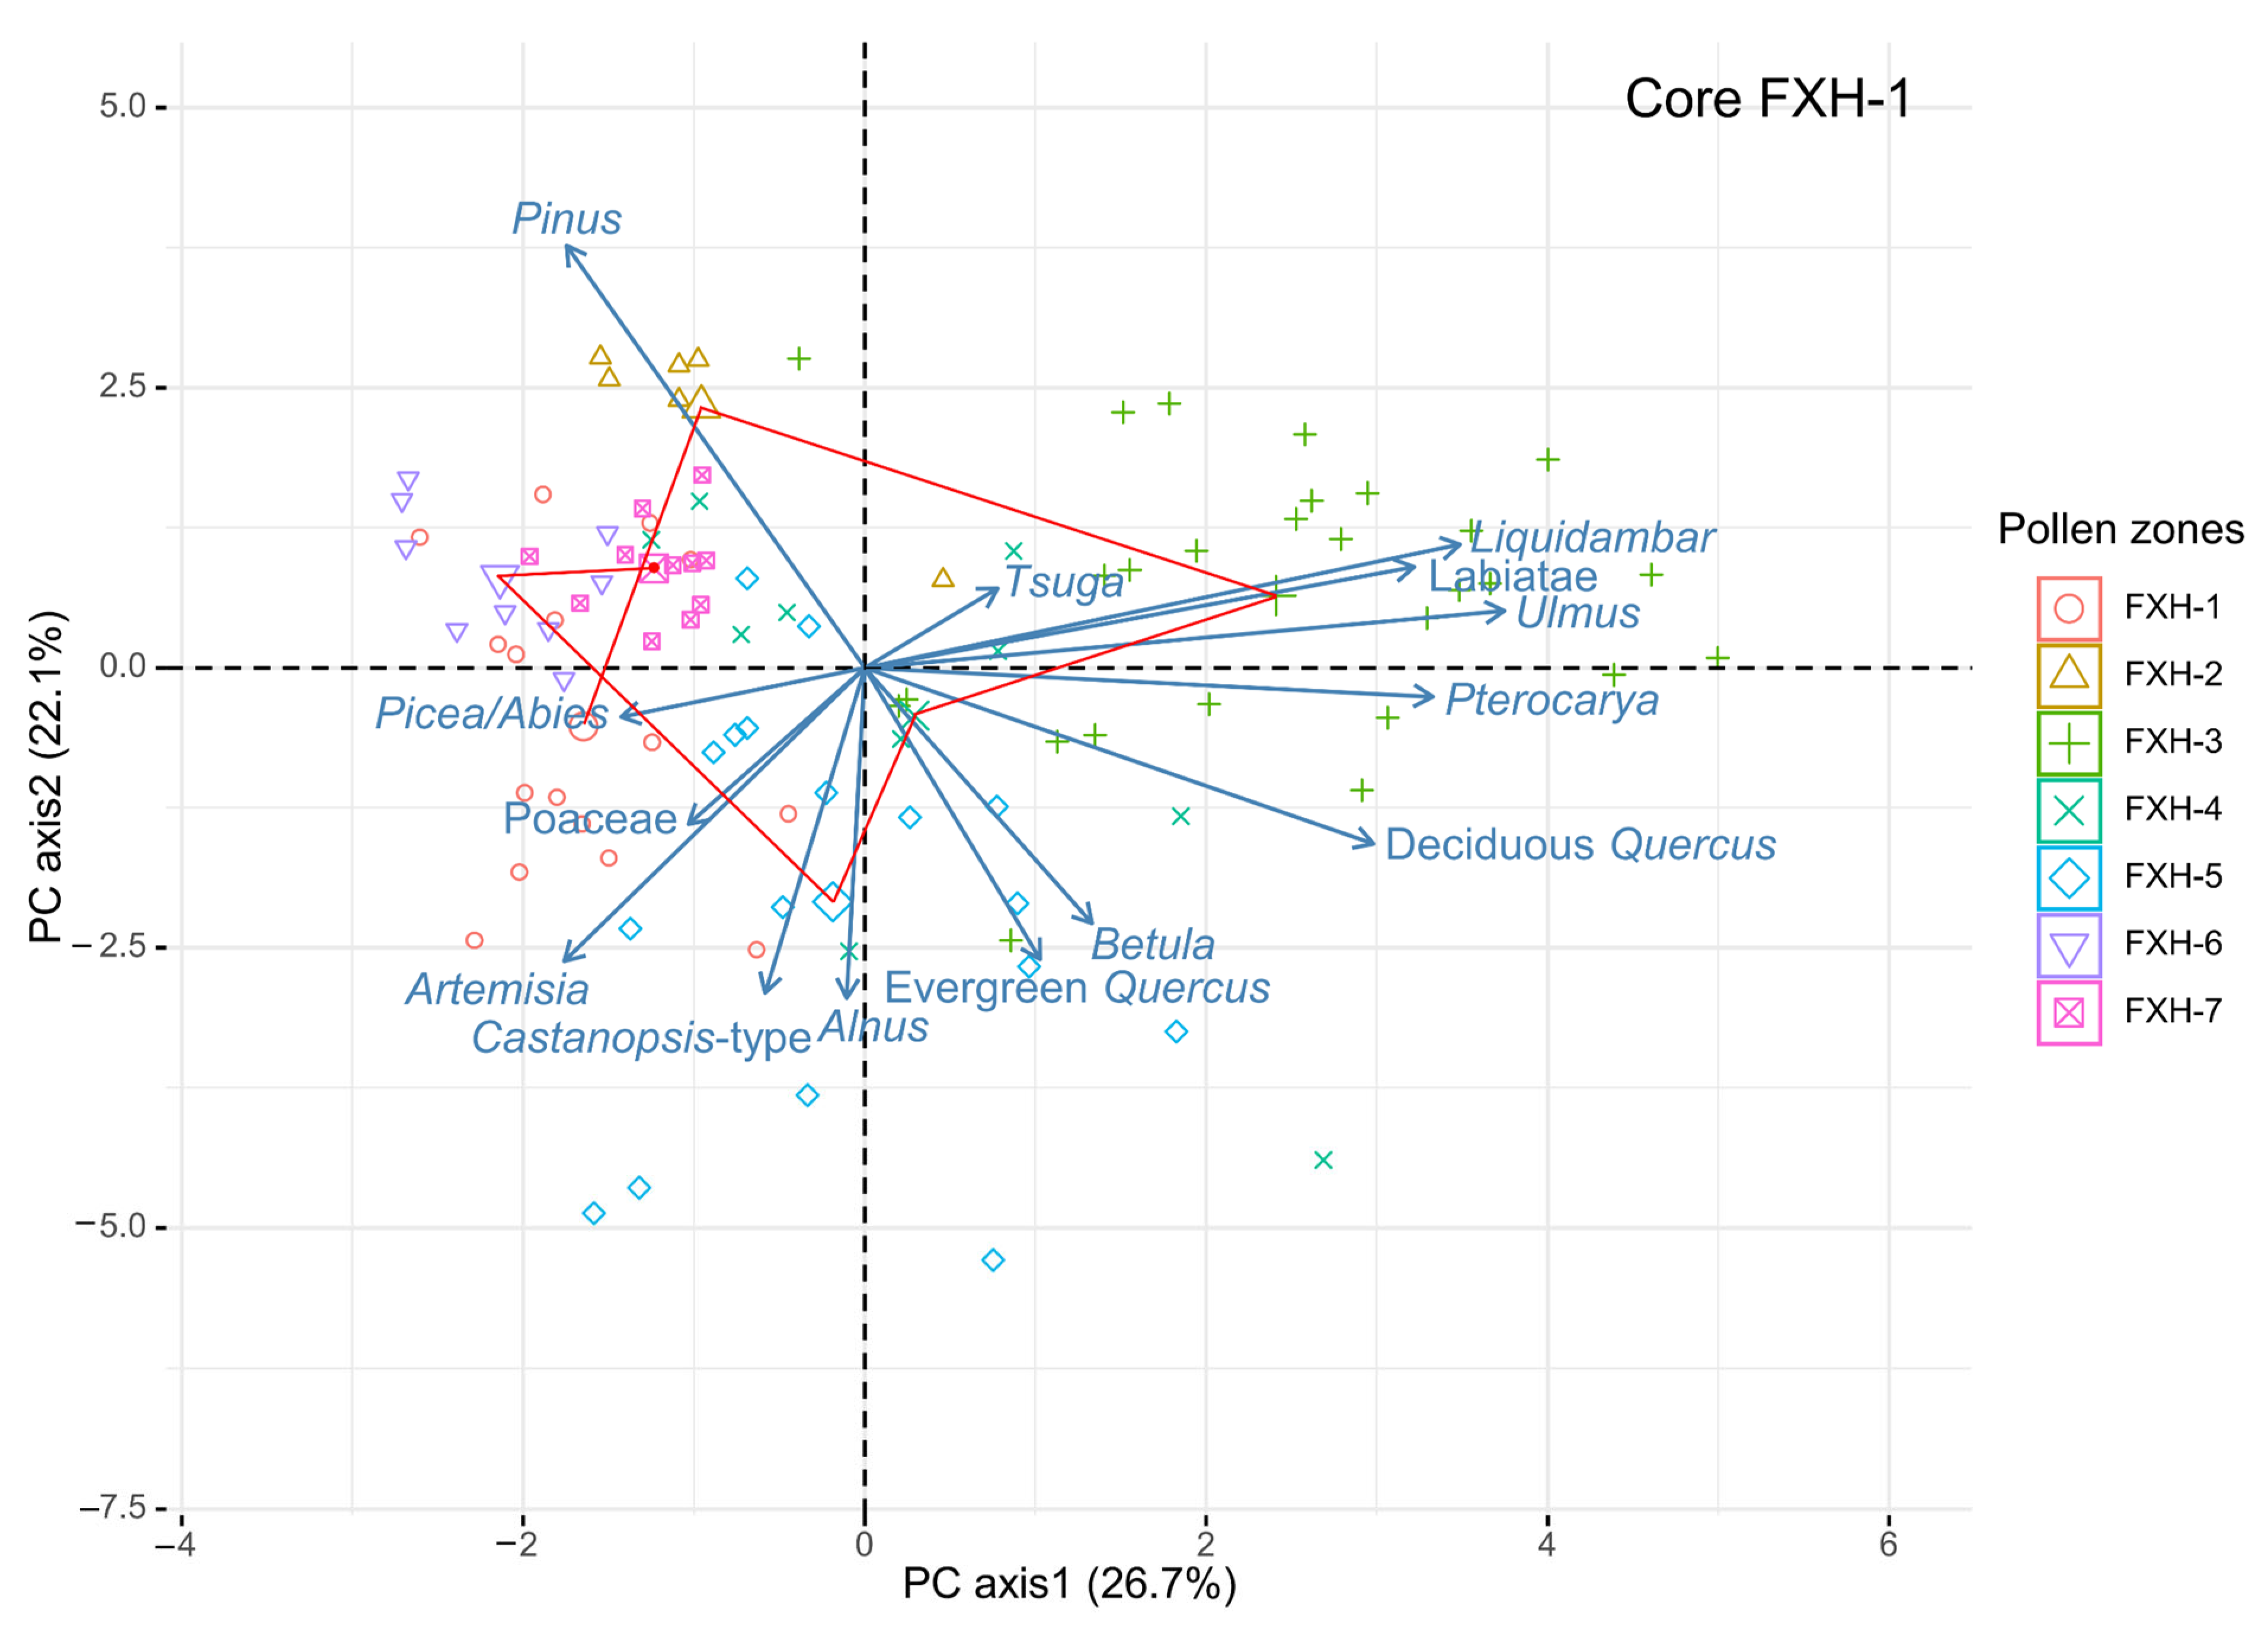
- The results of the cluster analysis and PCA on pollen percentage taxa show that fossil pollen spectra of core FXH-1 can be divided into seven pollen zones distinctly.
- The PAs estimated from the REVEALS model exhibit this model’s applicability in assisting the vegetational interpretation of fossil pollen data.
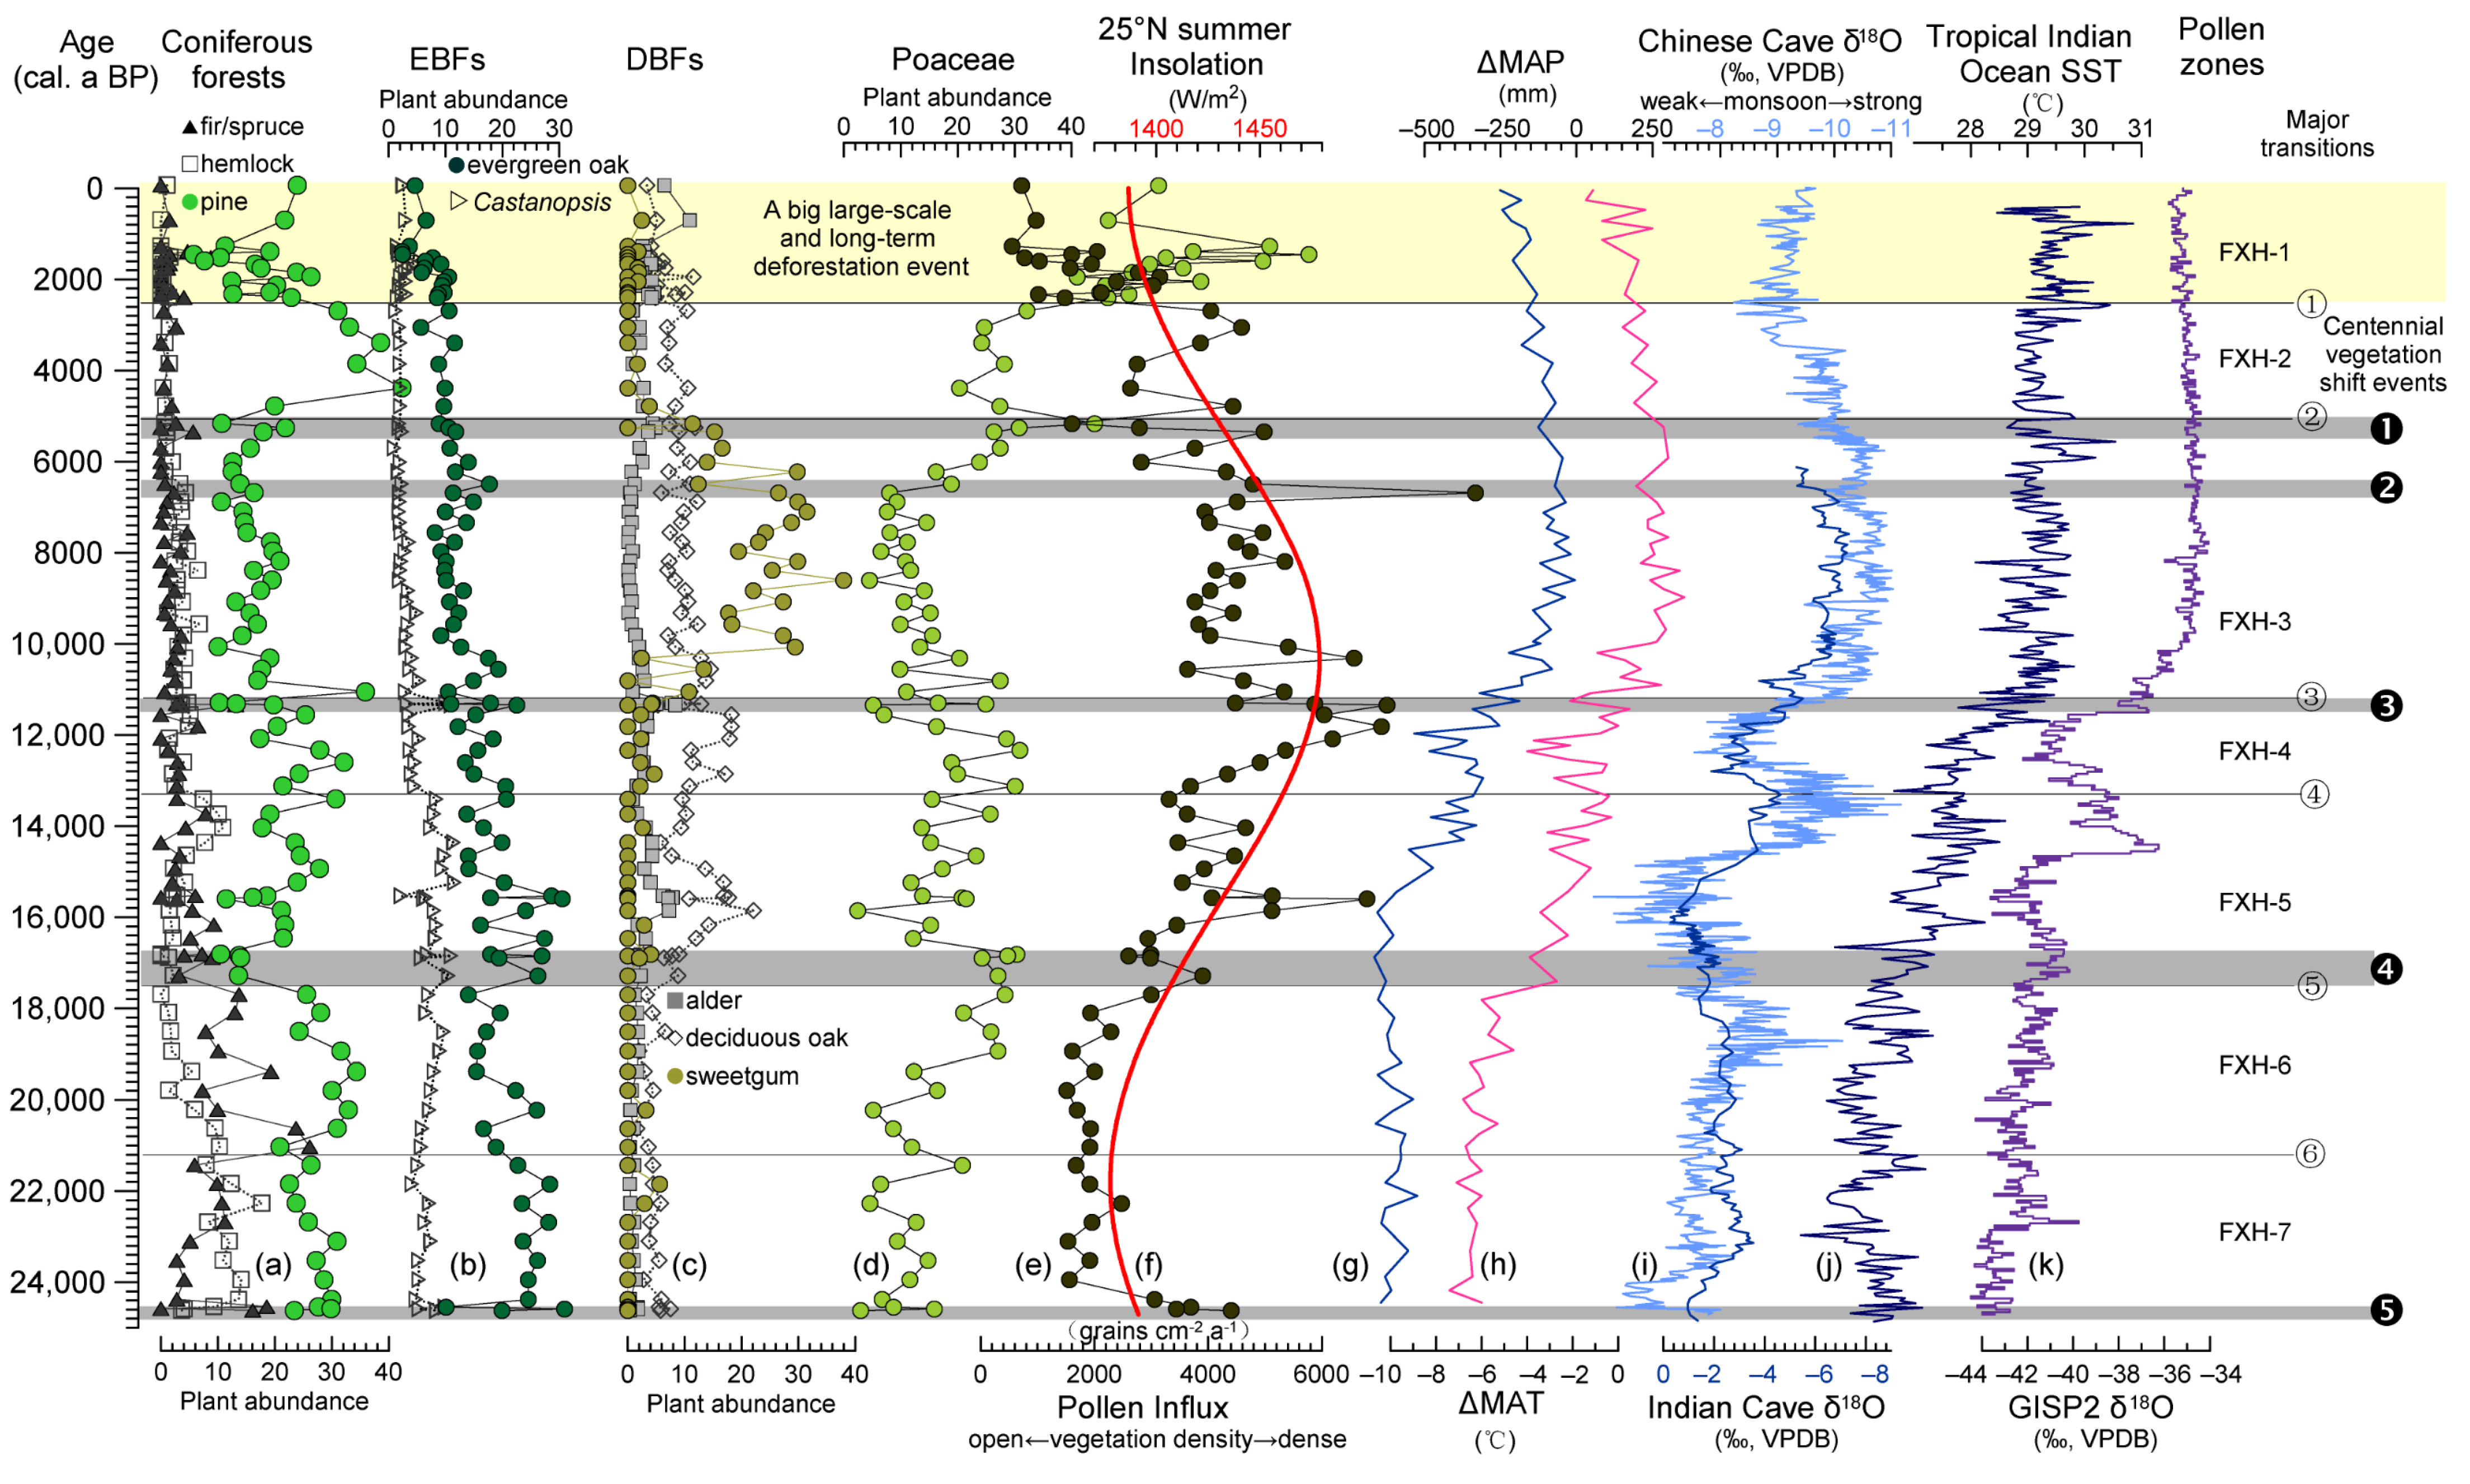
- This study reveals that the vegetation dynamics since the LGM in the Lake Fuxian catchment experienced seven relatively stable stages, six major transitions, five centennial shift events, and one big large-scale and long-term deforestation event.
- In the Lake Fuxian catchment, 25,000–21,200 cal. a BP saw some EBFs, DBFs, pine forests, hemlock forests, and fir/spruce forests, as well as few grasslands and wetlands; 21,200–17,500 cal. a BP witnessed remarkable expansions of pine forests and fir/spruce forests; a great expansion of DBFs and EBFs occurred at 17,500–13,300 cal. a BP; the expansion of pine forests and alder forests as well as the shrinkage of EBFs and hemlock forests occurred at 13,300–11,200 cal. a BP; during 11,200–5000 cal. a BP, sweetgum forests reached their maximum of the last 25,000 years; during 5000–2500 cal. a BP, pine forests reached their maximum of the entire sequence, and sweetgum forests diminished to near absence. The last 2500 years saw a big deforestation event.
- Vegetation density in the lake catchment has changed synchronously with summer insolation of 25° N since the LGM.
- Regional vegetation dynamics since the LGM in the Lake Fuxian catchment were associated with hydrothermal conditions during 25,000 to 2500 cal. a BP and human activities during the last 2500 years.
Author Contributions
Funding
Data Availability Statement
Acknowledgments
Conflicts of Interest
References
- Kunming Institute of Ecology, Chinese Academy of Sciences, Agricultural Regionalization Commission Office of Yunnan Province. Vegetation Ecological Landscapes of Yunnan; China Forestry Publishing House: Beijing, China, 1994. (In Chinese) [Google Scholar]
- Wu, Z.; Zhu, Y.; Jiang, H. (Eds.) Yunnan Vegetation; Science Press: Beijing, China, 1987. (In Chinese) [Google Scholar]
- Wang, Y. Mountain Climate of Yunnan; Yunnan Science and Technology Press: Kunming, China, 2006. (In Chinese) [Google Scholar]
- Tang, C.Q. The Subtropical Vegetation of Southwestern China: Plant Distribution, Diversity and Ecology; Springer: Dordrecht, The Netherlands, 2015. [Google Scholar]
- Mittermeier, R.A.; Turner, W.R.; Larsen, F.W.; Brooks, T.M.; Gascon, C. Global Biodiversity Conservation: The Critical Role of Hotspots. In Biodiversity Hotspots: Distribution and Protection of Conservation; Zachos, F.E., Habel, J.C., Eds.; Springer: Heidelberg, Germany, 2011. [Google Scholar]
- Tang, L.; Shen, C.; Lu, H.; Li, C.; Ma, Q. Fifty years of Quaternary palynology in the Tibetan Plateau. Sci. China Earth Sci. 2021, 64, 1825–1843. [Google Scholar] [CrossRef]
- Walker, D. Late Pleistocene-early Holocene vegetational and climatic changes in Yunnan Province, southwest China. J. Biogeogr. 1986, 13, 477–486. [Google Scholar] [CrossRef]
- Lin, S.; Qiao, Y.; Walker, D. Late Pleistocene and Holocene vegetation history at Xi Hu, Er Yuan, Yunnan Province, southwest China. J. Biogeogr. 1986, 13, 419–440. [Google Scholar]
- Sun, X.; Wu, Y.; Qiao, Y.; Walker, D. Late Pleistocene and Holocene vegetation history at Kunming, Yunnan province, southwest China. J. Biogeogr. 1986, 13, 441–476. [Google Scholar]
- Liu, J.; Tang, L.; Qiao, Y.; Head, M.J.; Walker, D. Late Quaternary vegetation history at Menghai, Yunnan province, southwest China. J. Biogeogr. 1986, 13, 399–418. [Google Scholar]
- Birks, H.J.B.; Birks, H.H. Quaternary Palaeoecology; Edward Arnold: London, UK, 1980. [Google Scholar]
- Shen, J.; Jones, R.T.; Yang, X.; Dearing, J.A.; Wang, S. The Holocene vegetation history of Lake Erhai, Yunnan province southwestern China: The role of climate and human forcings. Holocene 2006, 16, 265–276. [Google Scholar] [CrossRef]
- Song, X.; Yao, Y.; Wortley, A.H.; Paudayal, K.N.; Yang, S.; Li, C.; Blackmore, S. Holocene vegetation and climate history at Haligu on the Jade Dragon snow mountain, Yunnan, SW China. Clim. Change 2012, 113, 841–866. [Google Scholar] [CrossRef]
- Xiao, X.; Haberle, S.G.; Shen, J.; Yang, X.; Han, Y.; Zhang, E.; Wang, S. Latest Pleistocene and Holocene vegetation and climate history inferred from an alpine lacustrine record, northwestern Yunnan Province, southwestern China. Quat. Sci. Rev. 2014, 86, 35–48. [Google Scholar] [CrossRef]
- Chen, F.; Chen, X.; Chen, J.; Zhou, A.; Wu, D.; Tang, L.; Zhang, X.; Huang, X.; Yu, J. Holocene vegetation history, precipitation changes and Indian Summer Monsoon evolution documented from sediments of Xingyun Lake, south-west China. J. Quat. Sci. 2014, 29, 661–674. [Google Scholar] [CrossRef]
- Yang, Y.; Zhang, H.; Chang, F.; Meng, H.; Pan, A.; Zheng, Z.; Xiao, R. Vegetation and climate history inferred from a Qinghai Crater Lake pollen record from Tengchong, southwestern China. Palaeogeog. Palaeoclim. Palaeoecol. 2016, 461, 1–11. [Google Scholar] [CrossRef]
- Xiao, X.; Haberle, S.G.; Li, Y.; Liu, E.; Shen, J.; Zhang, E.; Yin, J.; Wang, S. Evidence of Holocene climatic change and human impact in northwestern Yunnan Province: High-resolution pollen and charcoal records from Chenghai Lake, southwestern China. Holocene 2018, 28, 129–137. [Google Scholar] [CrossRef]
- Shi, Q.; Shen, C.; Meng, H.; Huang, L.; Sun, Q. A 1640-Year vegetation and fire history of the Lake Haixihai catchment in northwestern Yunnan, Southwest China. Forests 2023, 14, 990. [Google Scholar] [CrossRef]
- Liao, M.; Li, K.; Ni, J.; Zhang, Y.; Li, Y. An abrupt vegetation change on south-central Yunnan Plateau (Southwest China) during the last deglaciation. Palaeogeog. Palaeoclim. Palaeoecol. 2024, 641, 112130. [Google Scholar] [CrossRef]
- Clark, P.U.; Dyke, A.S.; Shakun, J.D.; Carlson, A.E.; Clark, J.; Wohlfarth, B.; Mitrovica, J.X.; Hostetler, S.W.; McCabe, A.M. The Last Glacial Maximum. Science 2009, 325, 710–714. [Google Scholar] [CrossRef] [PubMed]
- Clark, P.U.; Shakun, J.D.; Baker, P.A.; Bartlein, P.J.; Brewer, S.; Brook, E.; Carlson, A.E.; Cheng, H.; Kaufman, D.S.; Liu, Z.; et al. Global climate evolution during the last deglaciation. Proc. Natl. Acad. Sci. USA 2012, 109, E1134–E1142. [Google Scholar] [CrossRef]
- Mayewski, P.A.; Rohling, E.E.; Stager, J.C.; Karlén, W.; Maasch, K.A.; Meeker, L.D.; Meyerson, E.A.; Gasse, F.; van Kreveld, S.; Holmgren, K.; et al. Holocene climate variability. Quat. Res. 2004, 62, 243–255. [Google Scholar] [CrossRef]
- Rasmussen, S.O.; Bigler, M.; Blockley, S.P.; Blunier, T.; Buchardt, S.L.; Clausen, H.B.; Cvijanovic, I.; Dahl-Jensen, D.; Johnsen, S.J.; Fischer, H.; et al. A stratigraphic framework for abrupt climatic changes during the Last Glacial period based on three synchronized Greenland ice-core records: Refining and extending the INTIMATE event stratigraphy. Quat. Sci. Rev. 2014, 106, 14–28. [Google Scholar] [CrossRef]
- Bond, G.; Kromer, B.; Beer, J.; Muscheler, R.; Evans, M.N.; Showers, W.; Sharon Hoffmann, S.; Lotti-Bond, R.; Hajdas, I.; Bonani, G. Persistent solar influence on North Atlantic climate during the Holocene. Science 2001, 294, 2130–2136. [Google Scholar] [CrossRef] [PubMed]
- Bosson, J.B.; Huss, M.; Cauvy-Fraunié, S.; Clément, J.C.; Costes, G.; Fischer, M.; Poulenard, J.; Arthaud, F. Future emergence of new ecosystems caused by glacial retreat. Nature 2023, 620, 562–569. [Google Scholar] [CrossRef]
- Dallmeyer, A.; Kleinen, T.; Claussen, M.; Weitzel, N.; Cao, X.; Herzschuh, U. The deglacial forest conundrum. Nat. Commun. 2022, 13, 6035. [Google Scholar] [CrossRef]
- Bova, S.; Rosenthal, Y.; Liu, Z.; Godad, S.P.; Yan, M. Seasonal origin of the thermal maxima at the Holocene and the last interglacial. Nature 2021, 589, 548–553. [Google Scholar] [CrossRef]
- Shen, J.; Xiao, X. Evolution of the South Asian monsoon during the last 20 ka recorded in lacustrine sediments from Southwestern China. Quat. Sci. 2018, 38, 799–820. (In Chinese) [Google Scholar]
- Cook, C.G.; Jones, R.T.; Langdon, P.G.; Leng, M.J.; Zhang, E. New insights on Late Quaternary Asian palaeomonsoon variability and the timing of the Last Glacial Maximum in southwestern China. Quat. Sci. Rev. 2011, 30, 808–820. [Google Scholar] [CrossRef]
- Yao, Y.; Song, X.; Wortley, A.H.; Blackmore, S.; Li, C. A 22 570-year record of vegetational and climatic change from Wenhai Lake in the Hengduan Mountains biodiversity hotspot, Yunnan, Southwest China. Biogeosciences 2015, 12, 1525–1535. [Google Scholar] [CrossRef]
- Zhang, X.; Zheng, Z.; Huang, K.; Yang, X.; Tian, L. Sensitivity of altitudinal vegetation in southwest China to changes in the Indian summer monsoon during the past 68000 years. Quat. Sci. Rev. 2020, 239, 106359. [Google Scholar] [CrossRef]
- Xiao, X.; Yao, A.; Hillman, A.; Shen, J.; Haberle, S.G. Vegetation, climate and human impact since 20 ka in central Yunnan province based on high-resolution pollen and charcoal records from Dianchi, southwestern China. Quat. Sci. Rev. 2020, 236, 106297. [Google Scholar] [CrossRef]
- Chen, X.; Wu, D.; Huang, X.; Lv, F.; Brenner, M.; Jin, H.; Chen, F. Vegetation response in subtropical southwest China to rapid climate change during the Younger Dryas. Earth-Sci. Rev. 2020, 201, 103080. [Google Scholar] [CrossRef]
- Li, K.; Liao, M.; Ni, J. Vegetation response to climate change and human activity in southwestern China since the Last Glacial Maximum. Palaeogeog. Palaeoclim. Palaeoecol. 2024, 636, 111990. [Google Scholar] [CrossRef]
- Sugita, S. Theory of quantitative reconstruction of vegetation I: Pollen from Large Sites REVEALS regional vegetation composition. Holocene 2007, 17, 229–241. [Google Scholar] [CrossRef]
- Hellman, S.; Gaillard, M.; Broström, A.; Sugita, S. The REVEALS model, a new tool to estimate past regional plant abundance from pollen data in large lakes: Validation in southern Sweden. J. Quat. Sci. 2008, 23, 21–42. [Google Scholar] [CrossRef]
- Li, B.; Zhang, W.; Fyfe, R.; Fan, B.; Wang, S.; Xu, Q.; Zhang, N.; Ding, G.; Yang, J.; Li, Y. High-resolution quantitative vegetation reconstruction in the North China Plain during the early-to-middle Holocene using the REVEALS model. Catena 2024, 234, 107577. [Google Scholar] [CrossRef]
- Nanjing Institute of Geography and Limnology, Chinese Academy of Sciences. Environments and Sediments of Fault Depression Lakes in Yunnan; Science Press: Beijing, China, 1989. (In Chinese) [Google Scholar]
- Nanjing Institute of Geography and Limnology, Chinese Academy of Sciences. Lake Fuxian; Ocean Press: Beijing, China, 1990. (In Chinese) [Google Scholar]
- Yang, L.; Li, H. (Eds.) Wetlands of Yunnan; China Forestry Publishing House: Beijing, China, 2010. (In Chinese) [Google Scholar]
- Wang, S.; Du, H. Annals of Lakes in China; Science Press: Beijing, China, 1998. (In Chinese) [Google Scholar]
- Editorial Board of Vegetation Map of China, Chinese Academy of Sciences. Vegetation Atlas of China; Science Press: Beijing, China, 2001. (In Chinese) [Google Scholar]
- Cheng, S.; Li, Y. Geomorphology of the Fuxian drainage basin and its structural implication. J. Geomech. 2010, 16, 383–391. (In Chinese) [Google Scholar]
- Kong, W.; Wang, Y.; Xiang, L.; Wang, Z.; He, Z.; Yang, S. An analysis on the landscape pattern of the vegetation in Fuxian Lake basin in Yunnan. J. Yunnan Univ. 2012, 34, 468–475. (In Chinese) [Google Scholar]
- Ai, J.; Wen, Q.; Tao, J. Study on forest vegetation and its value of soil and water conservation in Lake Fuxian Basin, Yunnan Province. J. Anhui Agri. Sci. 2010, 38, 11010–11012. [Google Scholar]
- Faegri, K.; Iversen, J. Textbook of Pollen Analysis; Macmillan: New York, NY, USA, 1975. [Google Scholar]
- Stockmarr, J. Tablets with spores used in absolute pollen analysis. Pollen Spores 1971, 13, 615–621. [Google Scholar]
- Matthias, I.; Giesecke, T. Insights into pollen source area, transport and deposition from modern pollen accumulation rates in lake sediments. Quat. Sci. Rev. 2014, 87, 12–23. [Google Scholar] [CrossRef]
- Grimm, E.C. TILIA and TILIA.GRAPH: PC Spreadsheet and Graphics Software for Pollen Data, Version 2.0.b.4. INQUA Comm. Study Holocene Work.-Group Data Handl. Methods 1990, 4, 5–7. [Google Scholar]
- Grimm, E.C. CONISS: A FORTRAN 77 program for stratigraphically constrained cluster analysis by the method of incremental sum of squares. Comput. Geosci. 1987, 13, 13–35. [Google Scholar] [CrossRef]
- Kassambara, A.; Mundt, F.; factoextra: Extract and Visualize the Results of Multivariate Data Analyses. R Package Version 1.0.7. 2020. Available online: https://CRAN.R-project.org/package=factoextra (accessed on 26 December 2023).
- R Core Team. R: A Language and Environment for Statistical Computing; R Foundation for Statistical Computing: Vienna, Austria, 2023; Available online: https://www.R-project.org/ (accessed on 26 December 2023).
- Wang, M.; Sun, Q.; Meng, H.; Huang, L.; Li, H.; Zhang, H.; Shen, C. Holocene vegetation dynamics revealed by a high-resolution pollen record from a large lake in central Yunnan, Southwest China. Land 2024, 13, 782. [Google Scholar] [CrossRef]
- Theuerkauf, M.; Couwenberg, J.; Kuparinen, A.; Liebscher, V. A matter of dispersal: REVEALSinR introduces state-of-the art dispersal models to quantitative vegetation reconstruction. Veg. Hist. Archaeobotany 2016, 25, 541–553. [Google Scholar] [CrossRef]
- Liu, Y.; Sun, H.; Zhou, X.; Duan, L.; Li, H.; Zhang, H. Paleoenvironmental significance of organic carbon isotope in lacustrine sediments in Lake Fuxian during the past 5 ka. J. Lake Sci. 2017, 29, 722–729. (In Chinese) [Google Scholar]
- Reimer, P.J.; Austin, W.E.; Bard, E.; Bayliss, A.; Blackwell, P.G.; Ramsey, C.B.; Butzin, M.; Cheng, H.; Edwards, R.L.; Friedrich, M.; et al. The IntCal20 northern hemisphere radiocarbon age calibration curve (0–55 cal ka BP). Radiocarbon 2020, 62, 725–757. [Google Scholar] [CrossRef]
- Sugita, S.; Parshall, T.; Calcote, R.; Walker, K. Testing the landscape reconstruction algorithm for spatially explicit reconstruction of vegetation in northern Michigan and Wisconsin. Quat. Res. 2010, 74, 289–300. [Google Scholar] [CrossRef]
- Serge, M.A.; Mazier, F.; Fyfe, R.; Gaillard, M.-J.; Klein, T.; Lagnoux, A.; Galop, D.; Githumbi, E.; Mindrescu, M.; Nielsen, A.B.; et al. Testing the effect of relative pollen productivity on the REVEALS model: A validated reconstruction of Europe-wide Holocene vegetation. Land 2023, 12, 986. [Google Scholar] [CrossRef]
- Yunnan Forest Writing Committee. Forests of Yunnan; Yunnan Science and Technology Press & China Forestry Publishing House: Kunming, China, 1986. (In Chinese) [Google Scholar]
- Laskar, J.; Robutel, P.; Joutel, F.; Gastineau, M.; Correia, A.C.M.; Levrard, B. A long-term numerical solution for the insolation quantities of the Earth. Astron. Astrophys. 2004, 428, 261–285. [Google Scholar] [CrossRef]
- Zhang, X.; Zheng, Z.; Huang, K.; Cheng, J.; Cheddadi, R.; Zhao, Y.; Liang, C.; Yang, X.; Wan, Q.; Tang, Y.; et al. Quantification of Asian monsoon variability from 68 ka BP through pollen-based climate reconstruction. Sci. Bull. 2023, 68, 713–726. [Google Scholar] [CrossRef]
- Cheng, H.; Edwards, R.L.; Sinha, A.; Spöt, C.; Yi, L.; Chen, S.; Kelly, M.; Kathayat, G.; Wang, X.; Li, X.; et al. The Asian monsoon over the past 640,000 years and ice age terminations. Nature 2016, 534, 640–646. [Google Scholar] [CrossRef]
- Dutt, S.; Gupta, A.K.; Clemens, S.C.; Cheng, H.; Singh, R.K.; Kathayat, G.; Edwards, R.L. Abrupt changes in Indian summer monsoon strength during 33,800 to 5500 years B.P. Geophys. Res. Lett. 2015, 42, 5526–5532. [Google Scholar] [CrossRef]
- Mohtadi, M.; Prange, M.; Oppo, D.W.; Pol-Holz, R.D.P.; Merkel, U.; Zhang, X.; Steinke, S.; Lückge, A. North Atlantic forcing of tropical Indian Ocean climate. Nature 2014, 509, 76–80. [Google Scholar] [CrossRef]
- Grootes, P.M.; Stuiver, M. Oxygen 18/16 variability in Greenland snow and ice with 10-3- to 105-year time resolution. J. Geophys. Res. 1997, 102, 26455–26470. [Google Scholar] [CrossRef]
- Wang, Q.; Yang, X.; Anderson, N.J.; Zhang, E.; Li, Y. Diatom response to climate forcing of a deep, alpine lake (Lugu Hu, Yunnan, SW China) during the Last Glacial Maximum and its implications for understanding regional monsoon variability. Quat. Sci. Rev. 2014, 86, 1–12. [Google Scholar] [CrossRef]
- Xiao, X.; Zhao, Y.; Chi, C.; Zheng, Z.; Ma, C.; Liang, C.; Mao, L.; Hillman, A. Quantitative pollen-based paleoclimate reconstructions for the past 18.5 ka in southwestern Yunnan Province, China. Glob. Planet. Chang. 2023, 230, 104288. [Google Scholar] [CrossRef]
- Xiao, X.; Haberle, S.G.; Shen, J.; Xue, B.; Burrows, M.; Wang, S. Postglacial fire history and interactions with vegetation and climate in southwestern Yunnan Province of China. Clim. Past 2017, 13, 613–627. [Google Scholar] [CrossRef]
- Li, Y.; Chen, X.; Xiao, X.; Zhang, H.; Xue, B.; Shen, J.; Zhang, E. Diatom-based inference of Asian monsoon precipitation from a volcanic lake in southwest China for the last 18.5 ka. Quat. Sci. Rev. 2018, 182, 109–120. [Google Scholar] [CrossRef]
- Zong, Y.; Lloyd, J.M.; Leng, M.J.; Yim, W.W.-S.; Huang, G. Reconstruction of Holocene monsoon history from the Pearl River Estuary, southern China, using diatoms and carbon isotope ratios. Holocene 2006, 16, 251–263. [Google Scholar] [CrossRef]
- Wang, M.; Meng, H.; Huang, L.; Sun, Q.; Zhang, H.; Shen, C. Vegetation succession and forest fires over the past 13 000 years in the catchment of Yangzonghai Lake, Yunnan. Quat. Sci. 2020, 40, 175–189. (In Chinese) [Google Scholar]
- Fan, Y. Histories of Vegetation, Climate and Forest Fire over the Last 15,400 Years in the Yilong Lake Catchment of Southern Yunnan. Master’s Thesis, Yunnan Normal University, Kunming, China, 2021. [Google Scholar]
- Wu, J.; Shen, C.; Yang, H.; Shi, Q.; Xie, S. Holocene temperature variability in China. Quat. Sci. Rev. 2023, 312, 107184. [Google Scholar] [CrossRef]
- Liu, G.; Li, X.; Chiang, H.C.; Chawchai, S.; He, S.; Lu, Y.; Aung, L.T.; Maung, P.M.; Tun, W.N.; Oo, K.M.; et al. On the glacial-interglacial variability of the Asian monsoon in speleothem δ18O records. Sci. Adv. 2020, 6, eaay8189. [Google Scholar] [CrossRef]
- Cai, Y.; Zhang, H.; Cheng, H.; An, Z.; Lawrence, E.R.; Wang, X.; Tan, L.; Liang, F.; Wang, J.; Kelly, M. The Holocene Indian monsoon variability over the southern Tibetan Plateau and its teleconnections. Earth Planet. Sci. Lett. 2012, 335–336, 135–144. [Google Scholar] [CrossRef]
- Hillman, A.L.; Abbott, M.B.; Finkenbinder, M.S.; Yu, J. An 8600 year lacustrine record of summer monsoon variability from Yunnan, China. Quat. Sci. Rev. 2017, 174, 120–132. [Google Scholar] [CrossRef]
- Wang, X.; Huang, X.; Sachse, D. Two-phase hydrological changes during the mid-to late Holocene transition in Southwest China. Quat. Sci. Rev. 2023, 322, 108432. [Google Scholar] [CrossRef]
- Bond, G.; Broecker, W.; Johnsen, S.; McManus, J.; Labeyrie, L.; Jouzel, J.; Bonani, G. Correlations between climate records from North Atlantic sediments and Greenland ice. Nature 1993, 365, 143–147. [Google Scholar] [CrossRef]
- Wang, Y.; Cheng, H.; Edwards, R.L.; He, Y.; Kong, X.; An, Z.; Wu, J.; Kelly, M.J.; Dykoski, C.A.; Li, X. The Holocene Asian mon-soon: Links to solar changes and North Atlantic climate. Science 2005, 308, 854–857. [Google Scholar] [CrossRef]
- Gupta, A.K.; Anderson, D.M.; Overpeck, J.T. Abrupt changes in the Asian southwest monsoon during the Holocene and their links to the North Atlantic Ocean. Nature 2003, 421, 354–357. [Google Scholar] [CrossRef]
- Shen, C. Millennial-Scale Variations and Centennial-Scale Events in the Southwest Aian Monsoon: Pollen Evidence from Tibet. Ph.D. Thesis, Louisiana State University, Baton Rouge, LA, USA, 2003. [Google Scholar]
- Duan, F.; Zhang, Z.; Liu, D.; Chen, J.; Shao, Q.; Wang, Y. Stalagmite-based long-term and multi-centennial hydroclimatic variations in southwestern China during the Holocene and relations to global climate change. Quat. Sci. Rev. 2023, 319, 108327. [Google Scholar] [CrossRef]
- Hillman, A.L.; Yu, J.; Abbott, M.B.; Cooke, C.A.; Bain, D.J.; Steinman, B.A. Rapid environmental change during dynastic transitions in Yunnan Province, China. Quat. Sci. Rev. 2014, 98, 24–32. [Google Scholar] [CrossRef]
- Hillman, A.L.; O’Quinn, R.F.; Abbott, M.B.; Bain, D.J. A Holocene history of the Indian monsoon from Qilu Lake, southwestern China. Quat. Sci. Rev. 2020, 227, 106051. [Google Scholar] [CrossRef]
- Yao, A.; Jiang, Z.; Chen, X.; Liang, Y. Bronze Age wetland/scapes: Complex political formations in the humid subtropics of southwest China, 900–100 BC. J. Anthropol. Archaeol. 2015, 40, 213–229. [Google Scholar] [CrossRef]
- Dal Martello, R.; Li, X.; Fuller, D. Two-season agriculture and irrigated rice during the Dian: Radiocarbon dates and archaeobotanical remains from Dayingzhuang, Yunnan, Southwest China. Archaeol. Anthropol. Sci. 2021, 13, 62. [Google Scholar] [CrossRef]
- Yao, A.; Jiang, Z. Rediscovering the settlement system of the ‘Dian’ kingdom, in Bronze Age southern China. Antiquity 2012, 86, 353–367. [Google Scholar] [CrossRef]
- Dong, X.; Wu, Y. Vicissitudes of Lake Dianchi: Millennium Environmental History Perspective; Intellectual Property Publishing House: Beijing, China, 2013. (In Chinese) [Google Scholar]
- He, Y.; Xia, G. The General History of Yunnan; China Social Sciences Press: Beijing, China, 2011. (In Chinese) [Google Scholar]
- Fitzgerald, C.D. The Southern Expansion of the Chinese People; Australian National University Press: Canberra, Australia, 1972. [Google Scholar]


| Lab ID | Depth (cm) | Dating Material | 14C Age (a BP) | Calibrated Age/2σ (cal. a BP) * | Median Age (cal. a BP) |
|---|---|---|---|---|---|
| Beta-518737 | 24 | Bulk organic | 1460 ± 30 | 1390–1300 | 1340 |
| Beta-518738 | 72 | Bulk organic | 1780 ± 30 | 1740–1590 | 1660 |
| Beta-518739 | 124 | Bulk organic | 2120 ± 30 | 2290–2000 | 2080 |
| Beta-518740 | 214 | Bulk organic | 5110 ± 30 | 5930–5750 | 5810 |
| Beta-518741 | 300 | Bulk organic | 6930 ± 30 | 7840–7680 | 7750 |
| Beta-518742 | 350 | Bulk organic | 7950 ± 30 | 8990–8650 | 8820 |
| Beta-518743 | 520 | Bulk organic | 11,190 ± 30 | 13,170–13,090 | 13,110 |
| Beta-518744 | 630 | Bulk organic | 13,610 ± 40 | 16,590–16,290 | 16,430 |
| Beta-518745 | 820 | Bulk organic | 20,400 ± 60 | 24,740–24,230 | 24,490 |
Disclaimer/Publisher’s Note: The statements, opinions and data contained in all publications are solely those of the individual author(s) and contributor(s) and not of MDPI and/or the editor(s). MDPI and/or the editor(s) disclaim responsibility for any injury to people or property resulting from any ideas, methods, instructions or products referred to in the content. |
© 2024 by the authors. Licensee MDPI, Basel, Switzerland. This article is an open access article distributed under the terms and conditions of the Creative Commons Attribution (CC BY) license (https://creativecommons.org/licenses/by/4.0/).
Share and Cite
Wang, M.; Shen, C.; Sun, Q.; Meng, H.; Huang, L.; Zhang, H.; Sun, H. Vegetation Dynamics since the Last Glacial Maximum in Central Yunnan, Southwest China. Forests 2024, 15, 1075. https://doi.org/10.3390/f15071075
Wang M, Shen C, Sun Q, Meng H, Huang L, Zhang H, Sun H. Vegetation Dynamics since the Last Glacial Maximum in Central Yunnan, Southwest China. Forests. 2024; 15(7):1075. https://doi.org/10.3390/f15071075
Chicago/Turabian StyleWang, Min, Caiming Shen, Qifa Sun, Hongwei Meng, Linpei Huang, Hucai Zhang, and Huiling Sun. 2024. "Vegetation Dynamics since the Last Glacial Maximum in Central Yunnan, Southwest China" Forests 15, no. 7: 1075. https://doi.org/10.3390/f15071075
APA StyleWang, M., Shen, C., Sun, Q., Meng, H., Huang, L., Zhang, H., & Sun, H. (2024). Vegetation Dynamics since the Last Glacial Maximum in Central Yunnan, Southwest China. Forests, 15(7), 1075. https://doi.org/10.3390/f15071075