Article

Biochar Application Improved Sludge-Amended Landscape Soil Fertility Index but with No Added Benefit in Plant Growth

1
College of Forestry, Jiangxi Agricultural University, Nanchang 330045, China
2
College of Forestry & Landscape Architecture, South China Agricultural University, Guangzhou 510642, China
*
Author to whom correspondence should be addressed.
Forests 2024, 15(7), 1128; https://doi.org/10.3390/f15071128
Submission received: 8 May 2024 / Revised: 17 June 2024 / Accepted: 26 June 2024 / Published: 28 June 2024
(This article belongs to the Topic Effect of Heavy Metals on Plants, 2nd Volume)

Abstract

:
Co-application of sewage sludge (SS) with biochar in landscape/forestry soil is a common strategy for enhancing soil fertility and reducing the bioavailability of potential toxic elements (PTEs) derived from SS, such as Cd, Pb, Cu, Zn, and Ni. However, due to variability of biochar quality and uncertainties in responses of different plant species, whether the co-application benefits the landscape/forestry plant system remains elusive. Here, we tested the effectiveness of three types of biochar (SS-derived biochar (SB), rice straw-derived biochar (RB), and litter-derived biochar (LB)), which were added to soil amended with SS at 50% (w/w) at rates of 1.5%, 3%, and 4.5% as growth media for the landscape plant Aglaonema modestum (A. modestum). We analyzed the substrate’s physicochemical properties and assessed the alleviation of phytotoxicity by biochar application. A significant increase in the fertility index of substrate was observed in all the treatments with biochar addition. The addition of biochar reduced the potential mobility of PTEs while increasing their residual fraction in media. Nonetheless, it has been found that the addition of biochar has ineffective or even negative effects on A. modestum growth (height, biomass, root length) and nutrient absorption. Importantly, the reduction in root biomass and the increased activity of root antioxidant enzymes (SOD, POD, CAT, and MDA) indicate contamination stress of biochar on the roots of A. modestum. Toxic elements of concern—namely Cu, Cd, and Pb—were not significantly higher in tissues of A. modestum saplings planted in biochar-SS-amended soil. However, elevated levels of other elements that may pose toxicity concerns, such as Ni and Zn, increased in tissues at high biochar dosages. Based on the Entropy–Weight TOPSIS method, it was further confirmed that compared to the treatment without biochar, all treatments except for 3.0% LB application resulted in poorer A. modestum comprehensive growth. Our results emphasize the need for detailed research on the response of specific plants to biochar in specific environments, including plant adaptability and the unexplored toxicity of biochar, to understand the large variations and mechanisms behind these ineffective or negative effects before the large-scale co-utilization of SS and biochar in landscape/forestry soils.

1. Introduction

The significant production of sewage sludge (SS) and the increasingly stringent disposal regulations have led to a global search for safer sludge treatment methods. Extensive practice has shown that it is possible to partially replace organic or inorganic fertilizers with SS compost for cultivating landscape/forestry plants [1,2,3]. This method allows for effective recovery of nutrients in sludge, reducing reliance on non-renewable resources and promoting sustainable forestry [4,5,6]. Moreover, it provides a spacious disposal location for SS while acting as a protective barrier against the transmission of specific contaminants found in SS, such as potential toxic elements (PTEs), microplastics, and antibiotic resistance genes, thus preventing their entry into the human food chain. While there are numerous benefits, it is important to note that using SS as a cultivation substrate for landscape/forestry plants may result in the introduction of PTEs into the cultivation system. Our previous research has observed a significant increase in the PTE content in soil that has been amended with SS, even when the SS composting process meets national standards, which would lead to higher accumulation of PTEs in landscape/forestry plants (such as Alocasia macrorrhiza (L.) G. Don, Dianella ensifolia (L.) DC and Mangifera persiciforma C.Y. Wu et T.L. Ming, etc.) grown on SS-amended soil [1,7]. Although certain PTEs like Zn and Cu are necessary for plant growth in small amounts, excessive levels of these PTEs can be toxic to plants, leading to inhibited growth [8]. Hence, it is crucial to find innovative ways to harness the benefits of SS as a substrate for potted plants while also minimizing the environmental risks linked to its usage.
Reducing the migration rate of PTEs in polluted soil by adding strong adsorbents with PTEs is a new trend. Some alkaline materials, clay minerals, and organic materials are widely used for soil remediation. The use of these adsorbents has been found to be effective in reducing the mobility of PTEs in soil and phytoxicity [9]. This provides a new land use method for SS, which involves combining efficient and low-cost adsorbents with fertilization characteristics with SS [10,11,12,13]. Biochar, as an efficient adsorbent, is the preferred choice due to its affordability, availability from various sources, and minimal negative effects [2,12]. Application of biochar to SS-amended soil has been found to impact the physical, chemical, and biological characteristics of the soil [2]. It has also been observed that adding appropriate biochars in suitable doses to SS-amended soil leads to the redistribution of PTEs from the soil to the biochar itself. This redistribution reduces the mobility and bioavailability of PTEs [10,11]. Notably, the bioavailable fraction of PTEs accumulates in plants and organisms, contributing to the toxicity of specific pollutants [2,12]. However, while previous research has demonstrated the effective immobilization of PTEs in SS-amended soil using biochar, limited literature is available on whether these advantages extend to plants grown in SS-amended soil.
In previous studies, the use of biochar to improve soil conditions and reduce phytotoxicity of PTEs has been considered a viable method for promoting plant growth [14]. Several reviews on the effects of biochar on plant growth have reported overall positive responses [15,16]. However, it is important to further evaluate the generalizability of these conclusions, as many studies have used skewed biochar feedstock, application rates, and plant selection preferences [17]. The application of biochar may encounter certain uncertainties in terms of its impact on plant growth. Firstly, the diversity of biochar feedstock leads to an extremely complex structure and content of endogenous pollutants in biochar [18]. Some feedstocks, such as SS, may have a high PTE content [19]. Polyphenol compounds are toxic compounds that are abundant in some organic waste materials, such as pruning waste and litter [20]. Many volatile and bioactive compounds, such as ethylene, butyric acid, benzoic acid, quinones, and 2-phenoxyethanol, are present in some non-woody biochar materials. However, their presence in biochar has not been seriously addressed. By introducing biochar improvers into soil, these compounds may promote growth or produce toxic effects depending on their concentration. Secondly, the variability of plant response to biochar [21,22] is usually related to the amount of biochar applied. High nutrient biochar that exceeds the recommended fertilization rate may cause an imbalance in soil nutrient levels, with little improvement in soil nutrient retention and increased nutrient leaching potential. At the same time, small agglomerated particles may form at high biochar doses, leading to a decrease in effective adsorption surface area [18]. In this case, plant growth may exhibit negative effects. Thirdly, toxicity-sensitive plants may exhibit negative growth reactions to the specific plant toxicity reactions of certain chemicals in biochar [23]. For example, in our previous study, it was found that under the same type and application rate of biochar, the alleviation effect of adding biochar on plant toxicity in SS-amended soil depends on plant adaptability [2]. The above phenomena make us believe that due to the differences in biochar types, application rate, and plant types, the impact of adding biochar to sludge-amended soil on landscape plants may be elusive. Before large-scale biochar applications (as a conditioner applied to sludge-amended soil cultivation systems), it is necessary to evaluate the adaptability of specific landscape plants to biochar (which should include different types and application rate).
Aglaonema modestum Schott ex Engl. (A. modestum) is a perennial evergreen herb of the genus Aglaonema in the family Araceae and a common landscape plant in the south subtropical region of China [24], with a high market demand. One of the goals of nursery proprietors was to use SS to partially replace the traditional substrate to cultivate A. modestum in order to save costs. However, the possible negative impact of SS-derived PTEs is a problem they need to solve. In this study, we added three kinds of biochar (SS-derived biochar, forest litter-derived biochar, and rice straw-derived biochar) to SS-amended landscape soil at different rates and observed the growth of A. modestum in the substrate. Our specific objectives are as follows: (1) to quantify the changes in the physical and chemical properties of SS-amended soil, especially the bioavailability of PTEs, after the addition of biochar of different feedstock sources at different rates; (2) to assess the impact of combined application of SS and different biochar on the growth of A. modestum and the accumulation and migration of PTEs in A. modestum. We assume that A. modestum exhibits different growth patterns when different types of biochar are added at different rates. This study is expected to open up new directions for the resource utilization of SS and provide some theoretical guidance and data support for large-scale application in landscape/forestry plant cultivation.

2. Materials and Methods

2.1. Experimental Materials

The soil used for the pot experiment was collected from a 0–20 cm layer of soil at Foshan Botanical Garden, Foshan City, Guangdong Province, China (23°6′19.0584″ N, 113°0′5.3532″ E). According to the International Union of Soil Sciences (IUSS) Working Group World Reference Base for Soil Resources (IUSS Working Group WRB, 2015), the soil is classified as an Ultisol. Stones and other debris were removed, then the soil was naturally dried and sieved (2 mm).
The SS was collected from the Lvyou Sludge Treatment Plant in Qingyuan City, Guangdong Province, China (28°14′16.0332″ N, 118°33′42.7896″ E). They were air-dried at 25–30 °C for two months, ground, and sieved (2 mm).
Three types of biochar were used in the experiment, namely sludge-derived biochar (SB), rice straw biochar (RB), and litter biochar (LB). Among them, SB and RB were purchased from Taishan Sanshun Environmental Protection Technology Co., Ltd., Taishan city, Guangdong Province, China, and Zhenjiang Huafeng Agricultural Bioengineering Co., Ltd., Zhenjiang city, Jiangsu Province, China, respectively. Both biochars were prepared by pyrolysis at 500 °C. Litter biochar (LB) was prepared from the leaf litter of Ficus altissima. The litter was air-dried and pyrolyzed at 500 °C (BCP-05, Liaoning Institute of Energy Research Co., Ltd., Yingkou City, Liaoning Province, China). All biochar was screened through a 2 mm sieve before use. The basic physical and chemical properties of soil, SS, and biochar are listed in Table S1 and Figure S1.
The landscape plant of A. modernum, as an experimental plant, was purchased from Fangcun Flower Production Company in Guangzhou, Guangdong Province, China, with a mean height of 15.0 cm and a mean ground diameter of 4.98 mm. Plastic pots (20 cm in height and 22 cm in diameter) were used for plant cultivation.

2.2. Pot Experiment Design

Before the experiment, the screened sludge and soil were uniformly mixed in a 1:1 (w/w) ratio, which is referred to as sludge-amended soil. Subsequently, the following experimental treatments were set up according to the dry weight ratio: sludge-amended soil without biochar (CK); sludge-amended soil mixed with 1.5% of SB (SB1.5), 1.5% of RB (RB1.5), and 1.5% of LB (LB1.5); sludge-amended soil mixed with 3.0% of SB (SB3.0), 3.0% of RB (RB3.0), and 3.0% of LB (LB3.0); sludge-amended soil mixed with 4.5% of SB (SB4.5), 4.5% of RB (RB4.5), and 4.5% of LB (LB4.5). Each treatment had 5 replicates, with a total of 50 pots in this experiment. An additional 30 pots, including 3 replicates for each treatment, were set for measuring the physicochemical properties of the growing substrates. Thus, there were 80 pots in total. The matrix mass in each pot is 3 kg (dry mass). The pots were filled and left for equilibration for two weeks.
Two weeks later (March 2020), A. modenum seedlings were transplanted to the pots (one seedling in each pot) and watered with tap water to about 80% of field capacity (dynamic monitored by MiniTrase Kit). The pots were placed randomly in a greenhouse with a temperature set at around 25–30 °C, a 14 h light/10 h dark light cycle. Weeds in each pot were removed by hand. No extra fertilizer was used during the experiment.

2.3. Plant Harvesting and Sample Collection and Analysis

After eight months’ growth (in November 2020), the seedlings were harvested. Immediately before harvesting, the plant height was measured with a ruler. Subsequently, the entire plant was uprooted, and the roots and stems (aboveground parts) of each plant were isolated in the laboratory. The plant samples were rinsed with tap water and 0.1 mol/L hydrochloric acid (HCl), then were further rinsed with deionized water 3 times. WinRHIZO Pro 2017 (Regent Instrument Inc., Quebec, QC, Canada) is used to determine root morphological characteristics, including total root length, surface area, and volume. Then, all the roots and stems of the plants were dried (105 °C for 30 min and then at 65 °C to a constant weight) and weighed for dry biomass. Then, the samples were ground and sieved (0.25 mm) for later use.
Root activity was measured by triphenylte-trazolium chloride reduction. Root soluble protein was analyzed using Coomassie brilliant blue staining, superoxide dismutase (SOD) activity was measured by the nitrogen blue tetrazolium photochemical reduction method, and peroxidase (POD) activity was recorded by guaiacol. Similarly, malondialdehyde (MDA) concentration was determined by thiobarbituric acid color development, and catalase (CAT) activity was observed by direct ultraviolet spectrophotometry [14].
Plant samples were digested with concentrated H2SO4-H2O2 to obtain the test solution, and the concentrations of nitrogen (N), phosphorus (P), and potassium (K) were determined using the alkali hydrolysis diffusion method, the molybdenum antimony inverse colorimetry method, and flame spectrophotometry, respectively. The concentration of copper (Cu), zinc (Zn), lead (Pb), cadmium (Cd), and nickel (Ni) was determined using the dry ashing-inductively coupled plasma mass spectrometry method [1].

2.4. Matrix Sample Collection and Testing

After two weeks of equilibrium, the matrix was sampled using a circular sampler to determine the stacking density and porosity for each treatment. Simultaneously samples for chemical analysis (0.5 kg per pot) were collected, air dried, and sieved (0.25 mm). After harvesting the plants, 0.5 kg of matrix samples were collected from each pot for chemical analysis. The chemical properties of the substrate before and after planting were analyzed. The pH of the substrate was measured in deionized water (1:2.5 w/v) using a glass electrode pH meter. After digestion with K2CL2O7-H2SO4 solution, the organic matter in the matrix was determined by titration. Total nitrogen was determined by the improved Kjeldahl method. Available nitrogen was determined by the alkaline hydrolysis diffusion method. After digestion with H2SO4-HClO4 and extraction with a diacid solution (0.05 mol · L−1 HCl+0.0125 mol · L−1 H2SO4), total phosphorus and available phosphorus were determined using the molybdenum blue method at a wavelength of 700 nm. The total K was determined by flame photometry, and the available K was measured by 1 mol · L−1 NH4OAc extraction flame photometry [25].
The fractionation of PTEs in the substrate before seedling planting was extracted using an improved three-stage BCR sequential extraction program. BCR fractionation includes exchangeable (F1), reducible (F2), oxidizable (F3), and residual (F4) and was determined using ICP-MS. The content of PTEs in the matrix after plant harvesting was determined by the tri-acid (HF-HClO4-HNO3) test method using atomic absorption spectroscopy [25].

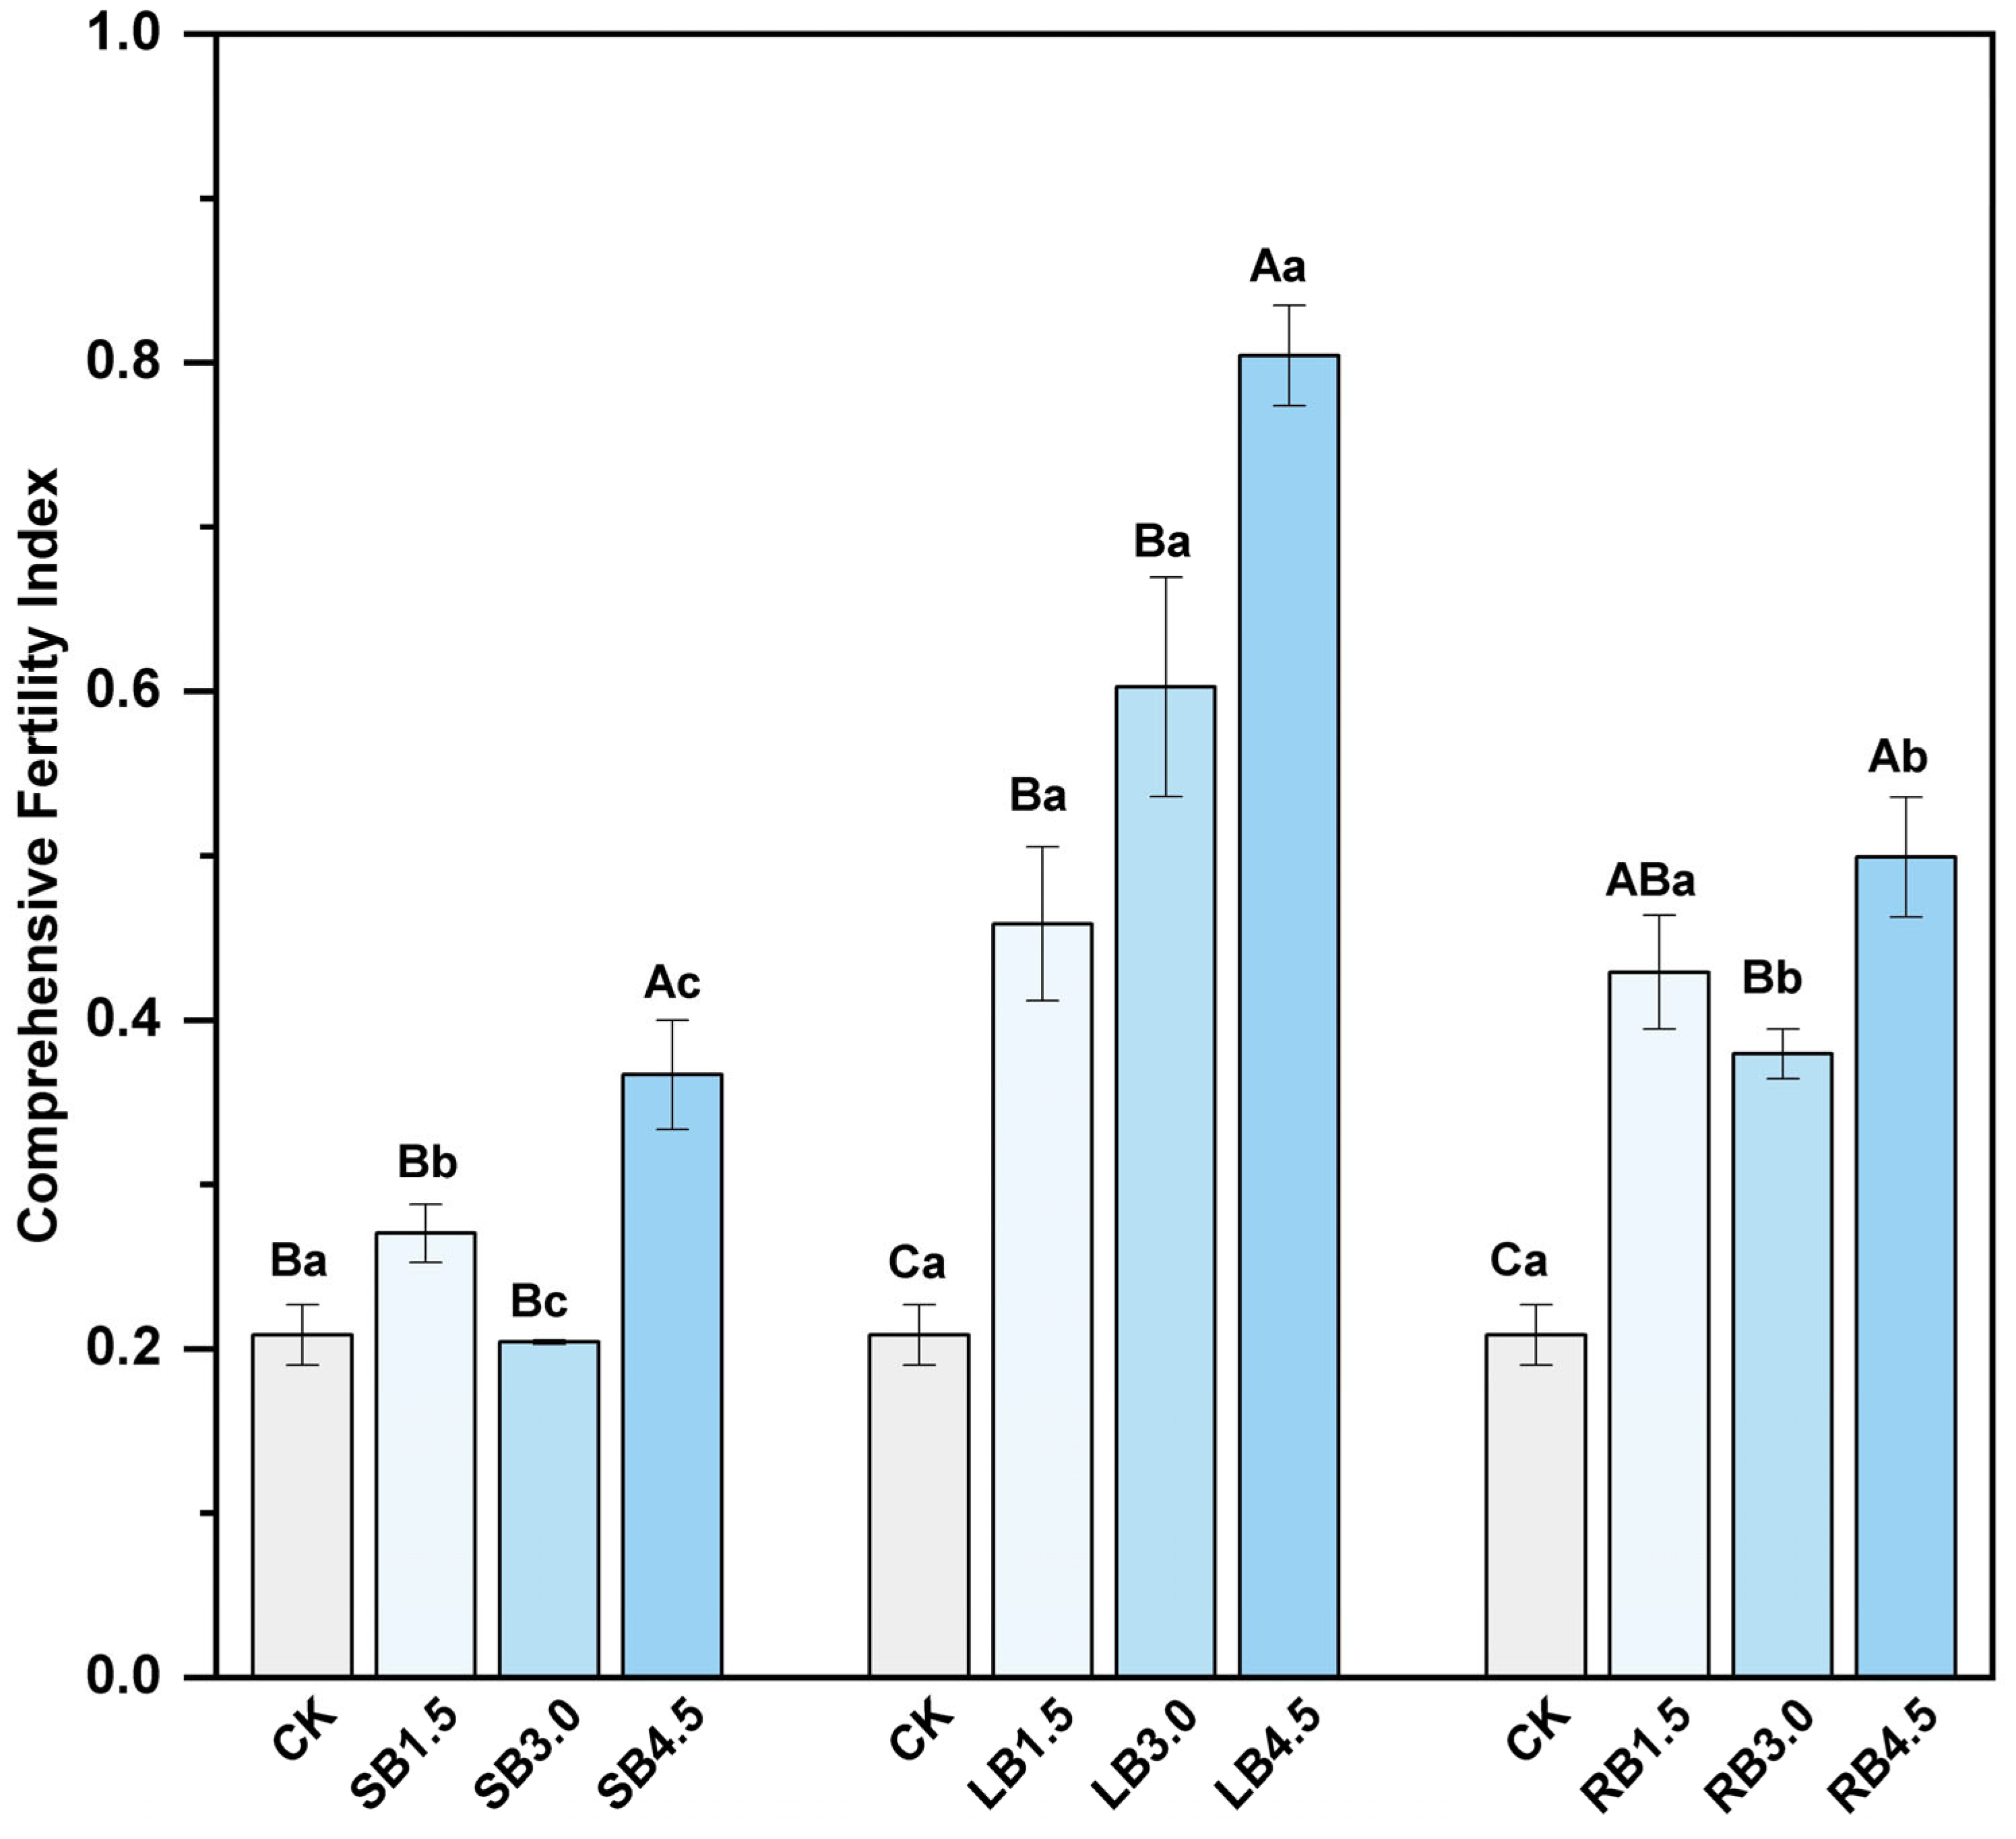
2.5. Comprehensive Evaluation of Soil Fertility

Comprehensive evaluation of soil fertility was conducted using a full dataset. The fertility indicators tested in this study were treated as equally important for membership function analysis and weight value allocation. Then, principal component analysis was performed on the indicators to obtain the weight value of each indicator. The soil fertility quality index (IFI) was calculated using the following formula:
I F I = i = 1 n q i w i
where qi is the membership value of the i soil fertility evaluation index and wi is the weight value of the i soil fertility evaluation index. The IFI ranges from 0 to 1, and the higher the value, the higher the soil fertility.

2.6. Comprehensive Evaluation of the Impact of Biochar on A. modestum Growth

Referring to the method of Qu et al. [26], the TOPSIS integrated analysis method was used to comprehensively evaluate the suitability of the fertilization treatment for A. modestum (see Table S2 for the meaning of the symbols in the following formulas). The specific steps are as follows:
x i j * = x i j m i n ( x j ) m a x ( x j ) m i n ( x j )
x i j * = m a x ( x j ) x i j m a x ( x j ) m i n ( x j )
H j = 1 ln m ( j = 1 n f i j   l n f i j )
f ij = 1 + x i j n i = 0 n 1 + x i j n
ω j = 1 H j m j = 1 m H j ( 0     ω j     1 ,   j = 1 m ω j = 1 )
Z = ( ω j · x i j * ) m × n
Z j +   =   max   ( Z 1   j ,   Z 2   j , , Z n   j )
Z j   =   min   ( Z 1   j ,   Z 2   j , , Z n   j )
D i + = j = 1 m   ω j ( Z i j Z j + ) 2
D i = j = 1 m   ω j ( Z i j Z j ) 2
C i = D j D j + + D j × 100 %

2.7. Calculations and Statistical Analysis

Analysis of variance (ANOVA) using IBM SPSS Statistics 23.0 (SPSS Inc., New York, NY, USA) and correlation tests were conducted at a 5% confidence level to examine differences in soil physicochemical properties and plant growth across various treatments. Tukey’s Honestly Significant Difference (HSD) test was performed at a significance level of p < 0.05 to compare the mean values of each treated pot. The data were presented as mean ± standard error (SE). Column figures were generated using Origin 2023, and Mantel test analysis maps were created using R 4.2.3.

3. Results

3.1. Soil Properties

3.1.1. Soil Physicochemical Properties

The addition of LB and RB significantly increased AK content but did not significantly alter substrate pH and AN content. The introduction of SB did not have a significant influence on the physicochemical characteristics of the substrate, except for TN, TP, and AP in the SB4.5 treatment, as well as AP and AK in the SB1.5 treatment (Table S3). Nevertheless, the analysis results of soil fertility quality indexes (IFIs) showed that under the application of LB and RB, the fertility indexes were significantly improved. The application of SB at low rates (1.5% and 3.0%) did not significantly improve soil fertility (Figure 1). At the same application rate, LB had a significantly better improvement effect on the IFI of the substrate than SB and RB.

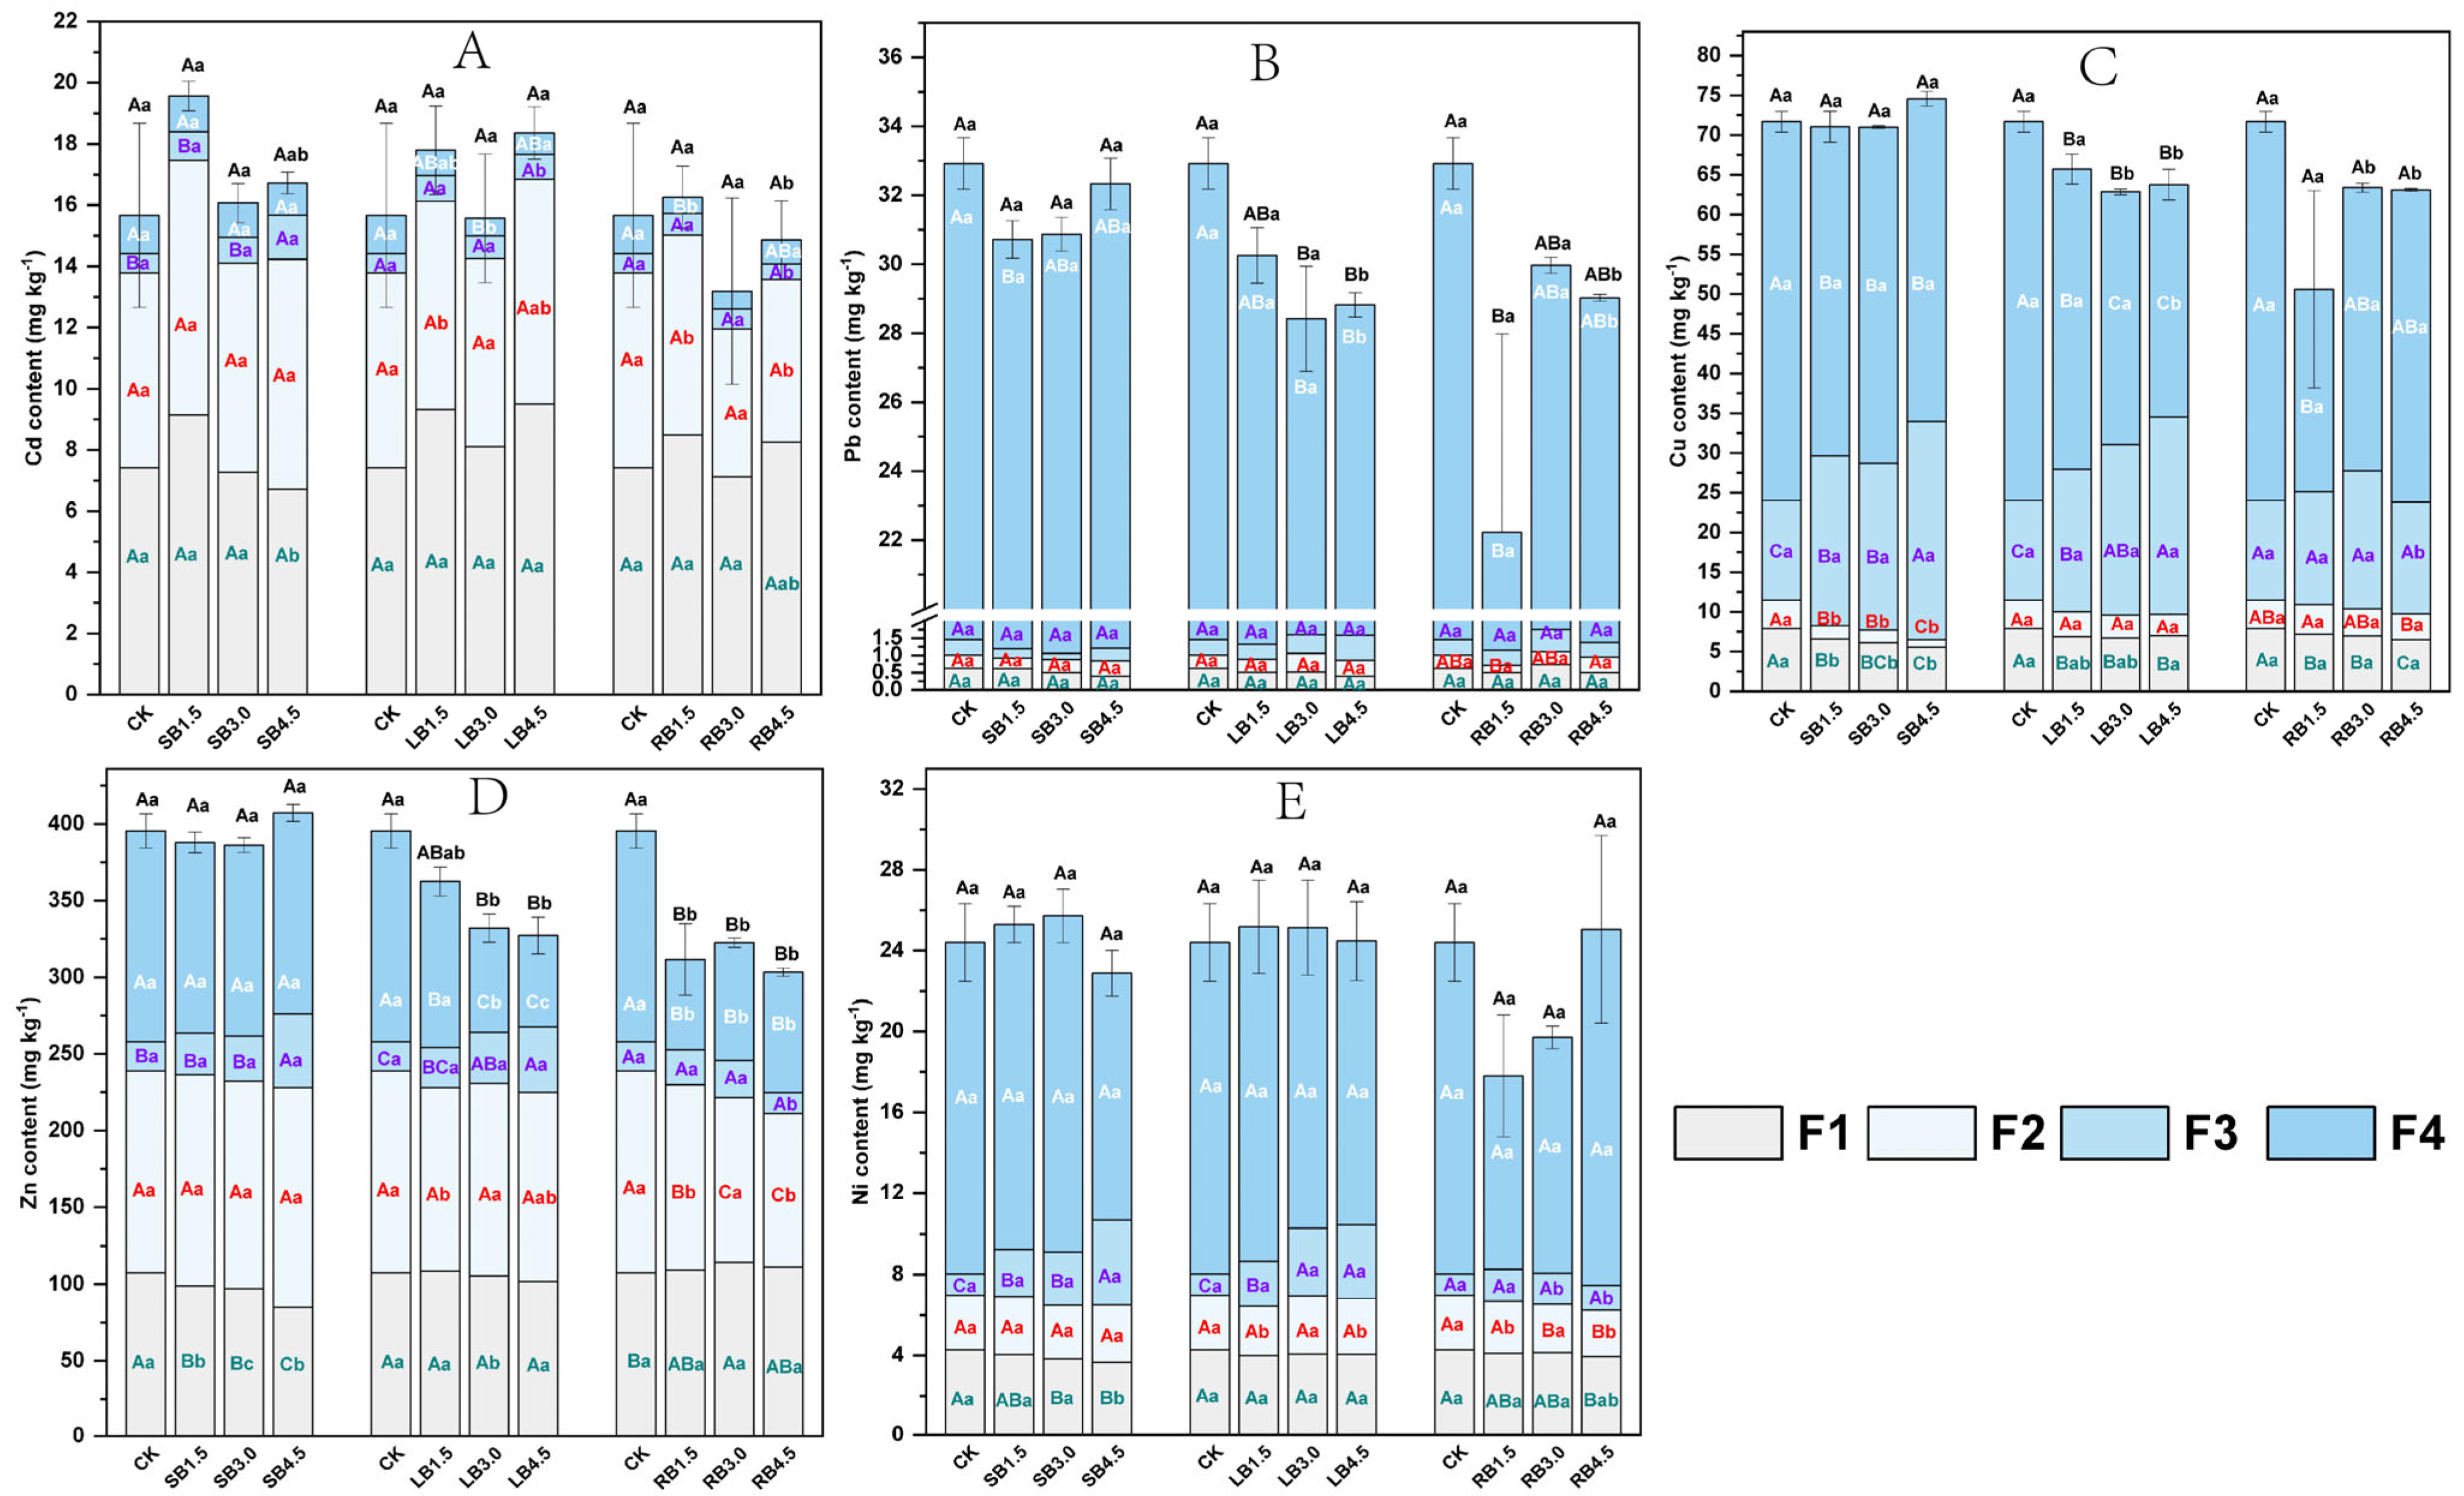
3.1.2. Potential Toxic Element Content and Fractionation

Compared to CK, SB addition had no significant effect on the total content of five PTEs in the substrate, but LB and RB reduced the content of Cu and Zn, respectively (Figure 2C,D). In addition, significant reductions in total Pb and Zn contents were observed in treatments of LB3.0 and LB4.5, as well as in Pb content in RB1.5. For different fractionations, the addition of three types of biochar significantly reduced the exchangeable (F1) content of Cu, and SB reduced the content of F1-Zn and F1-Ni (excluding Ni in SB1.5). SB and RB addition reduced the content of F2-Cu and F2-Zn, respectively. SB and LB increased the content of F3-Cu and F3-Ni; SB and LB reduced the F4-Cu content; and LB reduced the F4-Zn content.

3.2. Growth and Survival Responses of A. modestum

3.2.1. Plant Height and Biomass

Overall seedling survival at the end of the pot experiment was 100% pooled across treatments. The addition of the three types of biochar showed a detrimental effect on the plant height of A. modestum, with most treatments having significantly lower plant height than CK. However, there was no significant difference between biochar types under the same application rate (Figure 3A). The addition of SB and RB resulted in a neutral or negative root length response for A. modestum, but addition of LB at 3.0% or 4.5% significantly increased root length (Figure 3B). In LB1.5 and RB3.0 treatments, the root dry weight significantly increased over CK, but in other cases, regardless of the type and application rate of biochar, the shoot and root dry weight of A. modestum responded neutrally or negatively (Figure 3C).

3.2.2. Nutrient Contents in A. modestum

Both N and P content in A. modestum shoot showed no significant changes between treatments apart from P in LB1.5, but addition of three types of biochar significantly increased the K content in root (excluding SB1.5). SB had no significant effect on the absorption of N and K by A. modestum roots (except for K in SB3.0), but SB1.5 and SB3.0 significantly inhibited and promoted the absorption of P by A. modestum roots, respectively (Figure 4). LB had no significant effect on the absorption of P by the roots of A. modestum but significantly promoted absorption of K, while the absorption of N showed a dose effect (inhibition at 1.5% and promotion at 3.0% and 4.5%). RB addition significantly promoted the absorption of K by A. modestum roots; RB1.5 and RB4.5 promoted the absorption of P; and RB1.5 led to a significant increase in N content in root.

3.2.3. Root Morphology and Physiological Index

Neutral or negative responses of root activity (Figure 5A), soluble protein (Figure 5B), and MDA (Figure 5F) to biochar have been observed at any dosage. It is worth mentioning that LB1.5 and LB3.0 significantly inhibited the root activity of A. modestum. Treatments of SB1.5, LB1.5, and LB3.0 significantly increased the activity of antioxidant enzymes SOD (Figure 5C) and POD (Figure 5D) in the roots of A. modestum, while RB4.5 significantly increased SOD activity. However, the addition of different types of biochar resulted in a significant decrease in CAT activity in the roots of A. modestum (Figure 5E).

3.3. Plant Absorption and Accumulation of PTEs

3.3.1. PTEs Content in A. modestum Different Tissues

No significant reductions were observed for the Cd content in the treatments with SB and RB applied, whereas an increase was detected for Cd content in the shoots of LB1.5 and LB3.0. Adding different types of biochar at different rates did not significantly affect the content of Pb and Cu in roots (Figure 6). However, for the shoots, SB1.5, LB1.5, LB3.0, and RB4.5 treatments resulted in a significant increase in Pb content, while SB1.5, LB4.5, and RB1.5 caused a significant increase in Cu content. SB1.5 and RB1.5 significantly reduced the shoots’ Zn content. However, when the application rate of SB and RB increased to 3.0% and 4.5%, it led to a significant increase in shoot Zn content. High application rate (4.5%) of biochar significantly increased the Zn content in the roots, but the Zn content in the roots in SB1.5 and SB3.0 was significantly lower than in CK. The application of SB resulted in a significant decrease in Ni content in the shoots of A. modestum but had an unsignificant effect on the roots (except for SB3.0). LB4.5 had a significant effect on the absorption of Ni by A. modestum. RB1.5 significantly reduced Ni content in shoots but significantly increased the root Ni content. In addition, RB4.5 significantly increased the root Ni content.

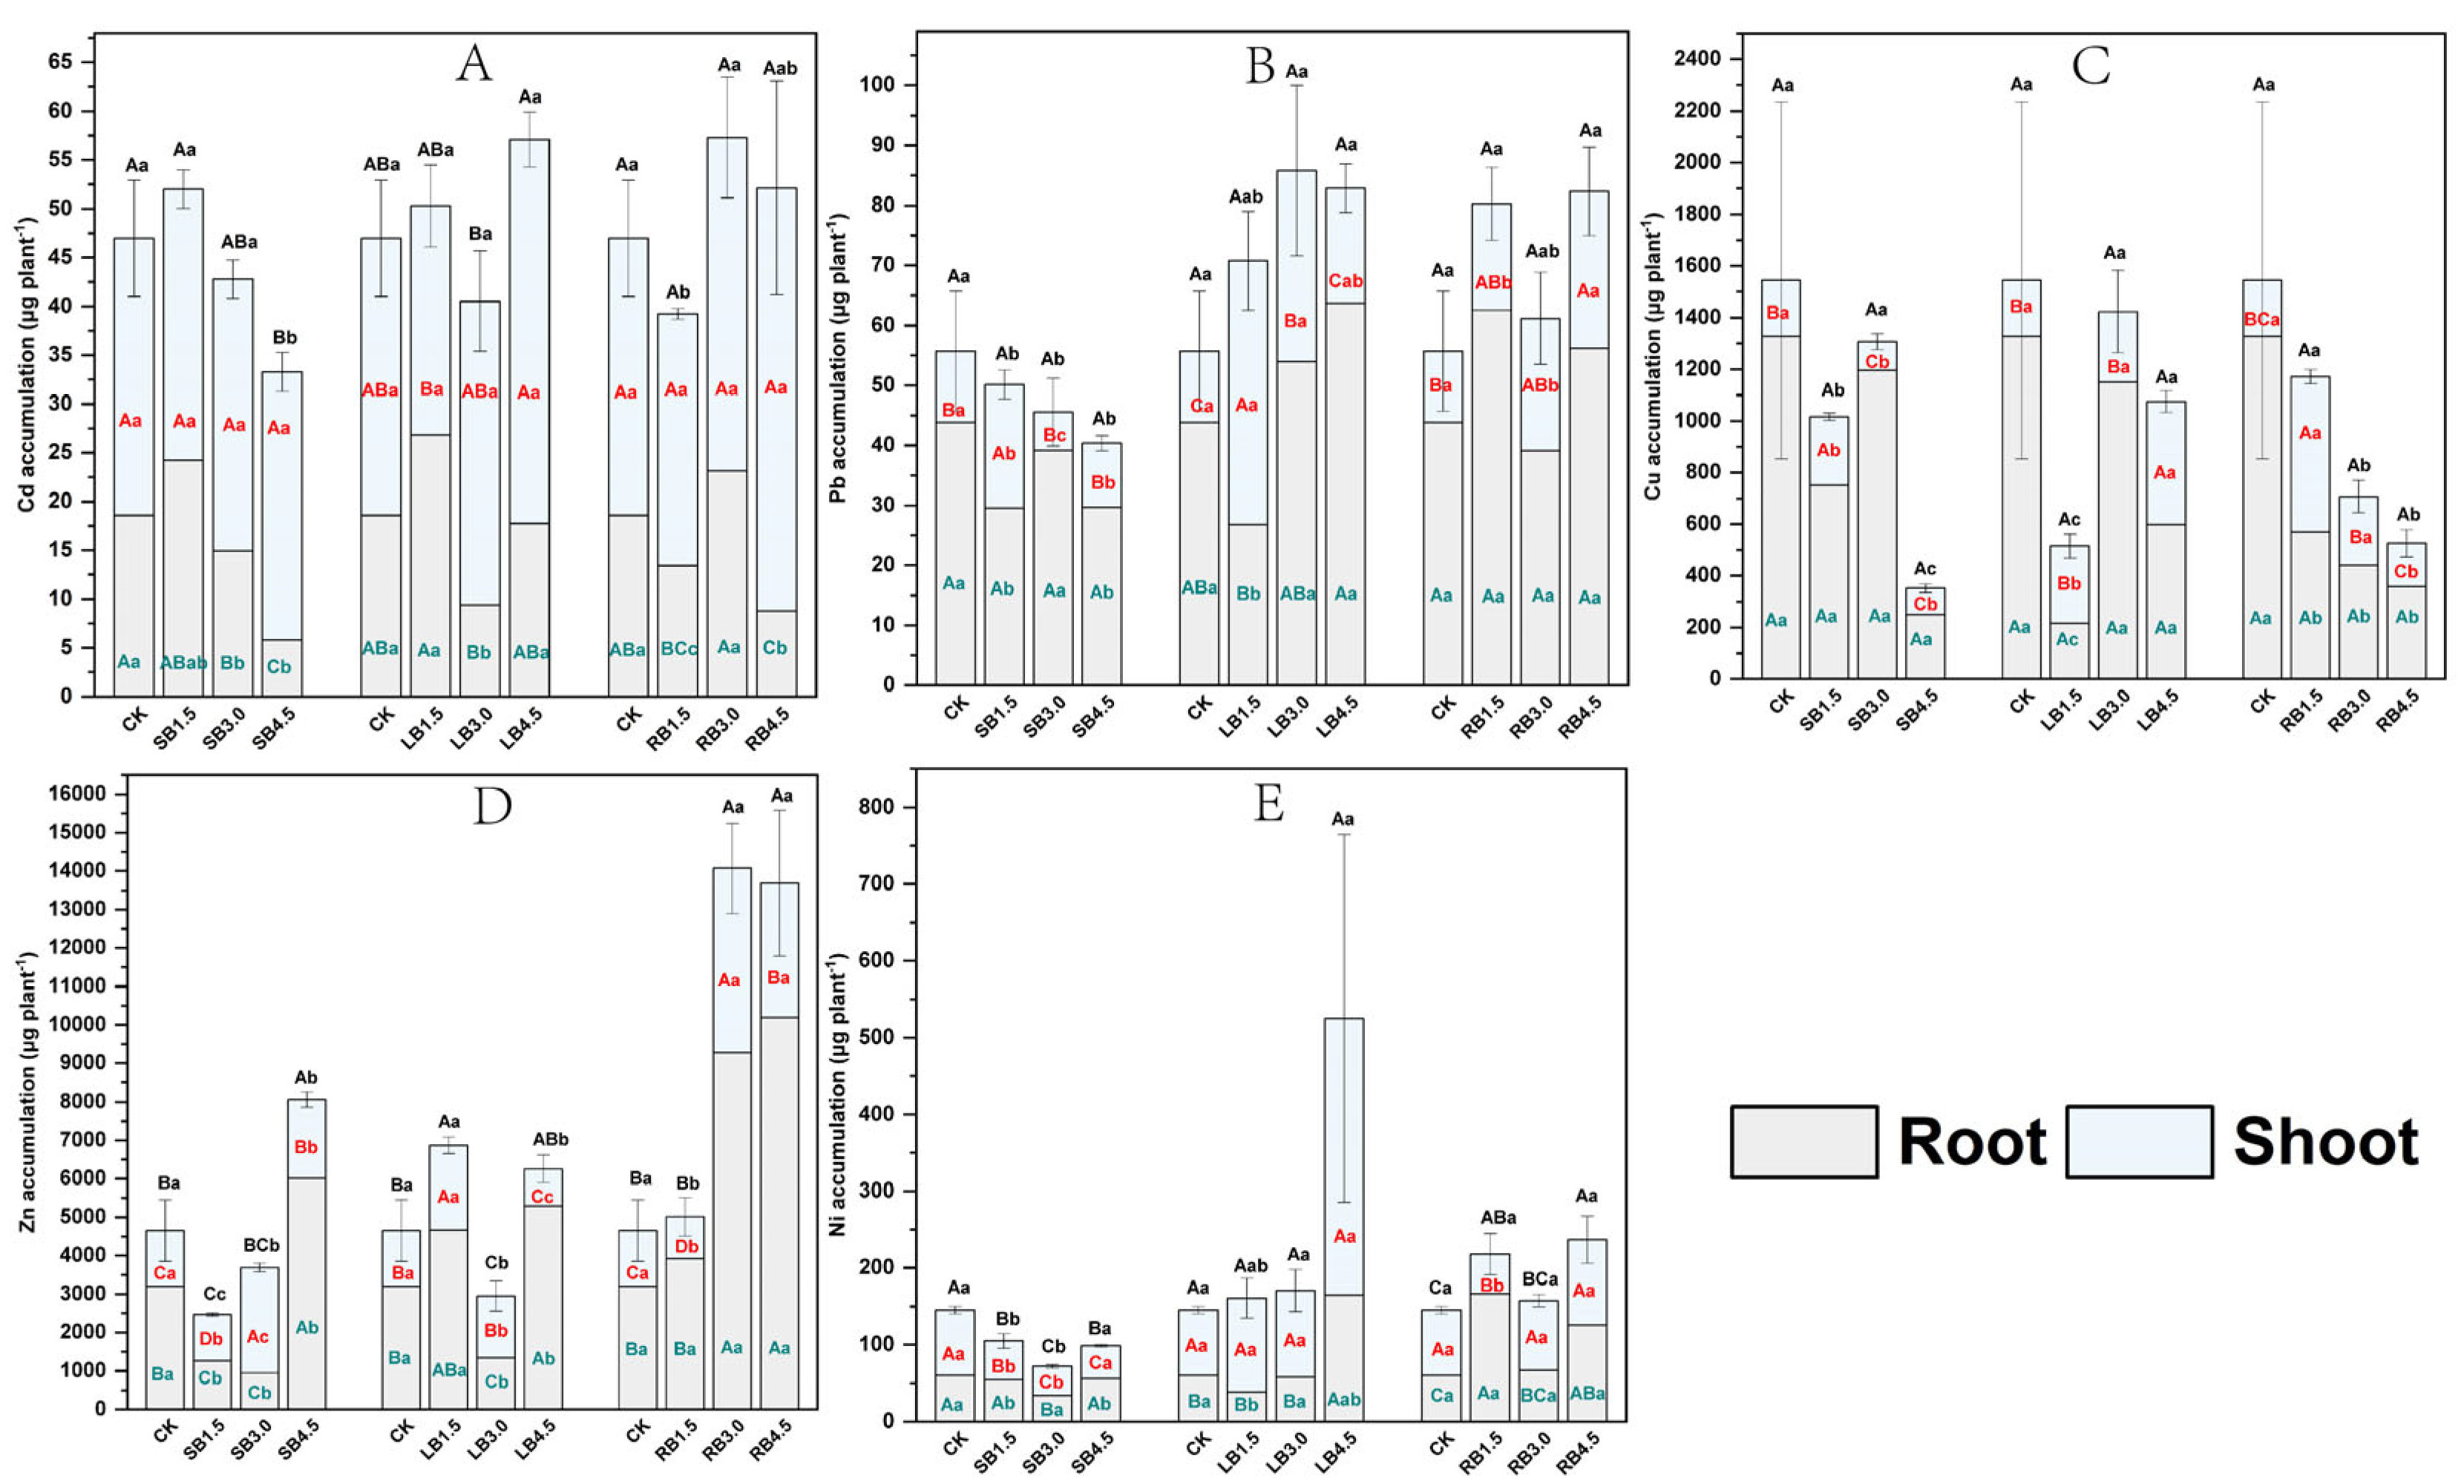
3.3.2. Accumulation of PTEs

Compared to CK, biochar addition showed zero or negative effects on the accumulation of PTEs in A. modestum, except for Cd in SB4.5, Zn in SB1.5 and LB3.0, and Ni in SB treatment (Figure 7). It is worth mentioning that SB4.5, LB1.5, RB3.0, and RB4.5 significantly increased the accumulation of Zn in A. modestum.

3.4. Comprehensive Evaluation of A. modestum Growth Based on TOPSIS

To investigate the comprehensive impact of adding different biochar on the growth of A. modestum, a comprehensive evaluation system was established for 25 sub-factor indicators (Table S4) characterizing the comprehensive growth of A. modestum. The entropy weight method was used to perform weighted analysis on individual indicators. The weight of each indicator and the target weight were shown in Table S4. Table 1 shows the comprehensive scores and ranking of different treatments. Overall, except for LB4.5, which showed a positive effect on A. modestum, all treatments with the addition of biochar showed a negative effect.

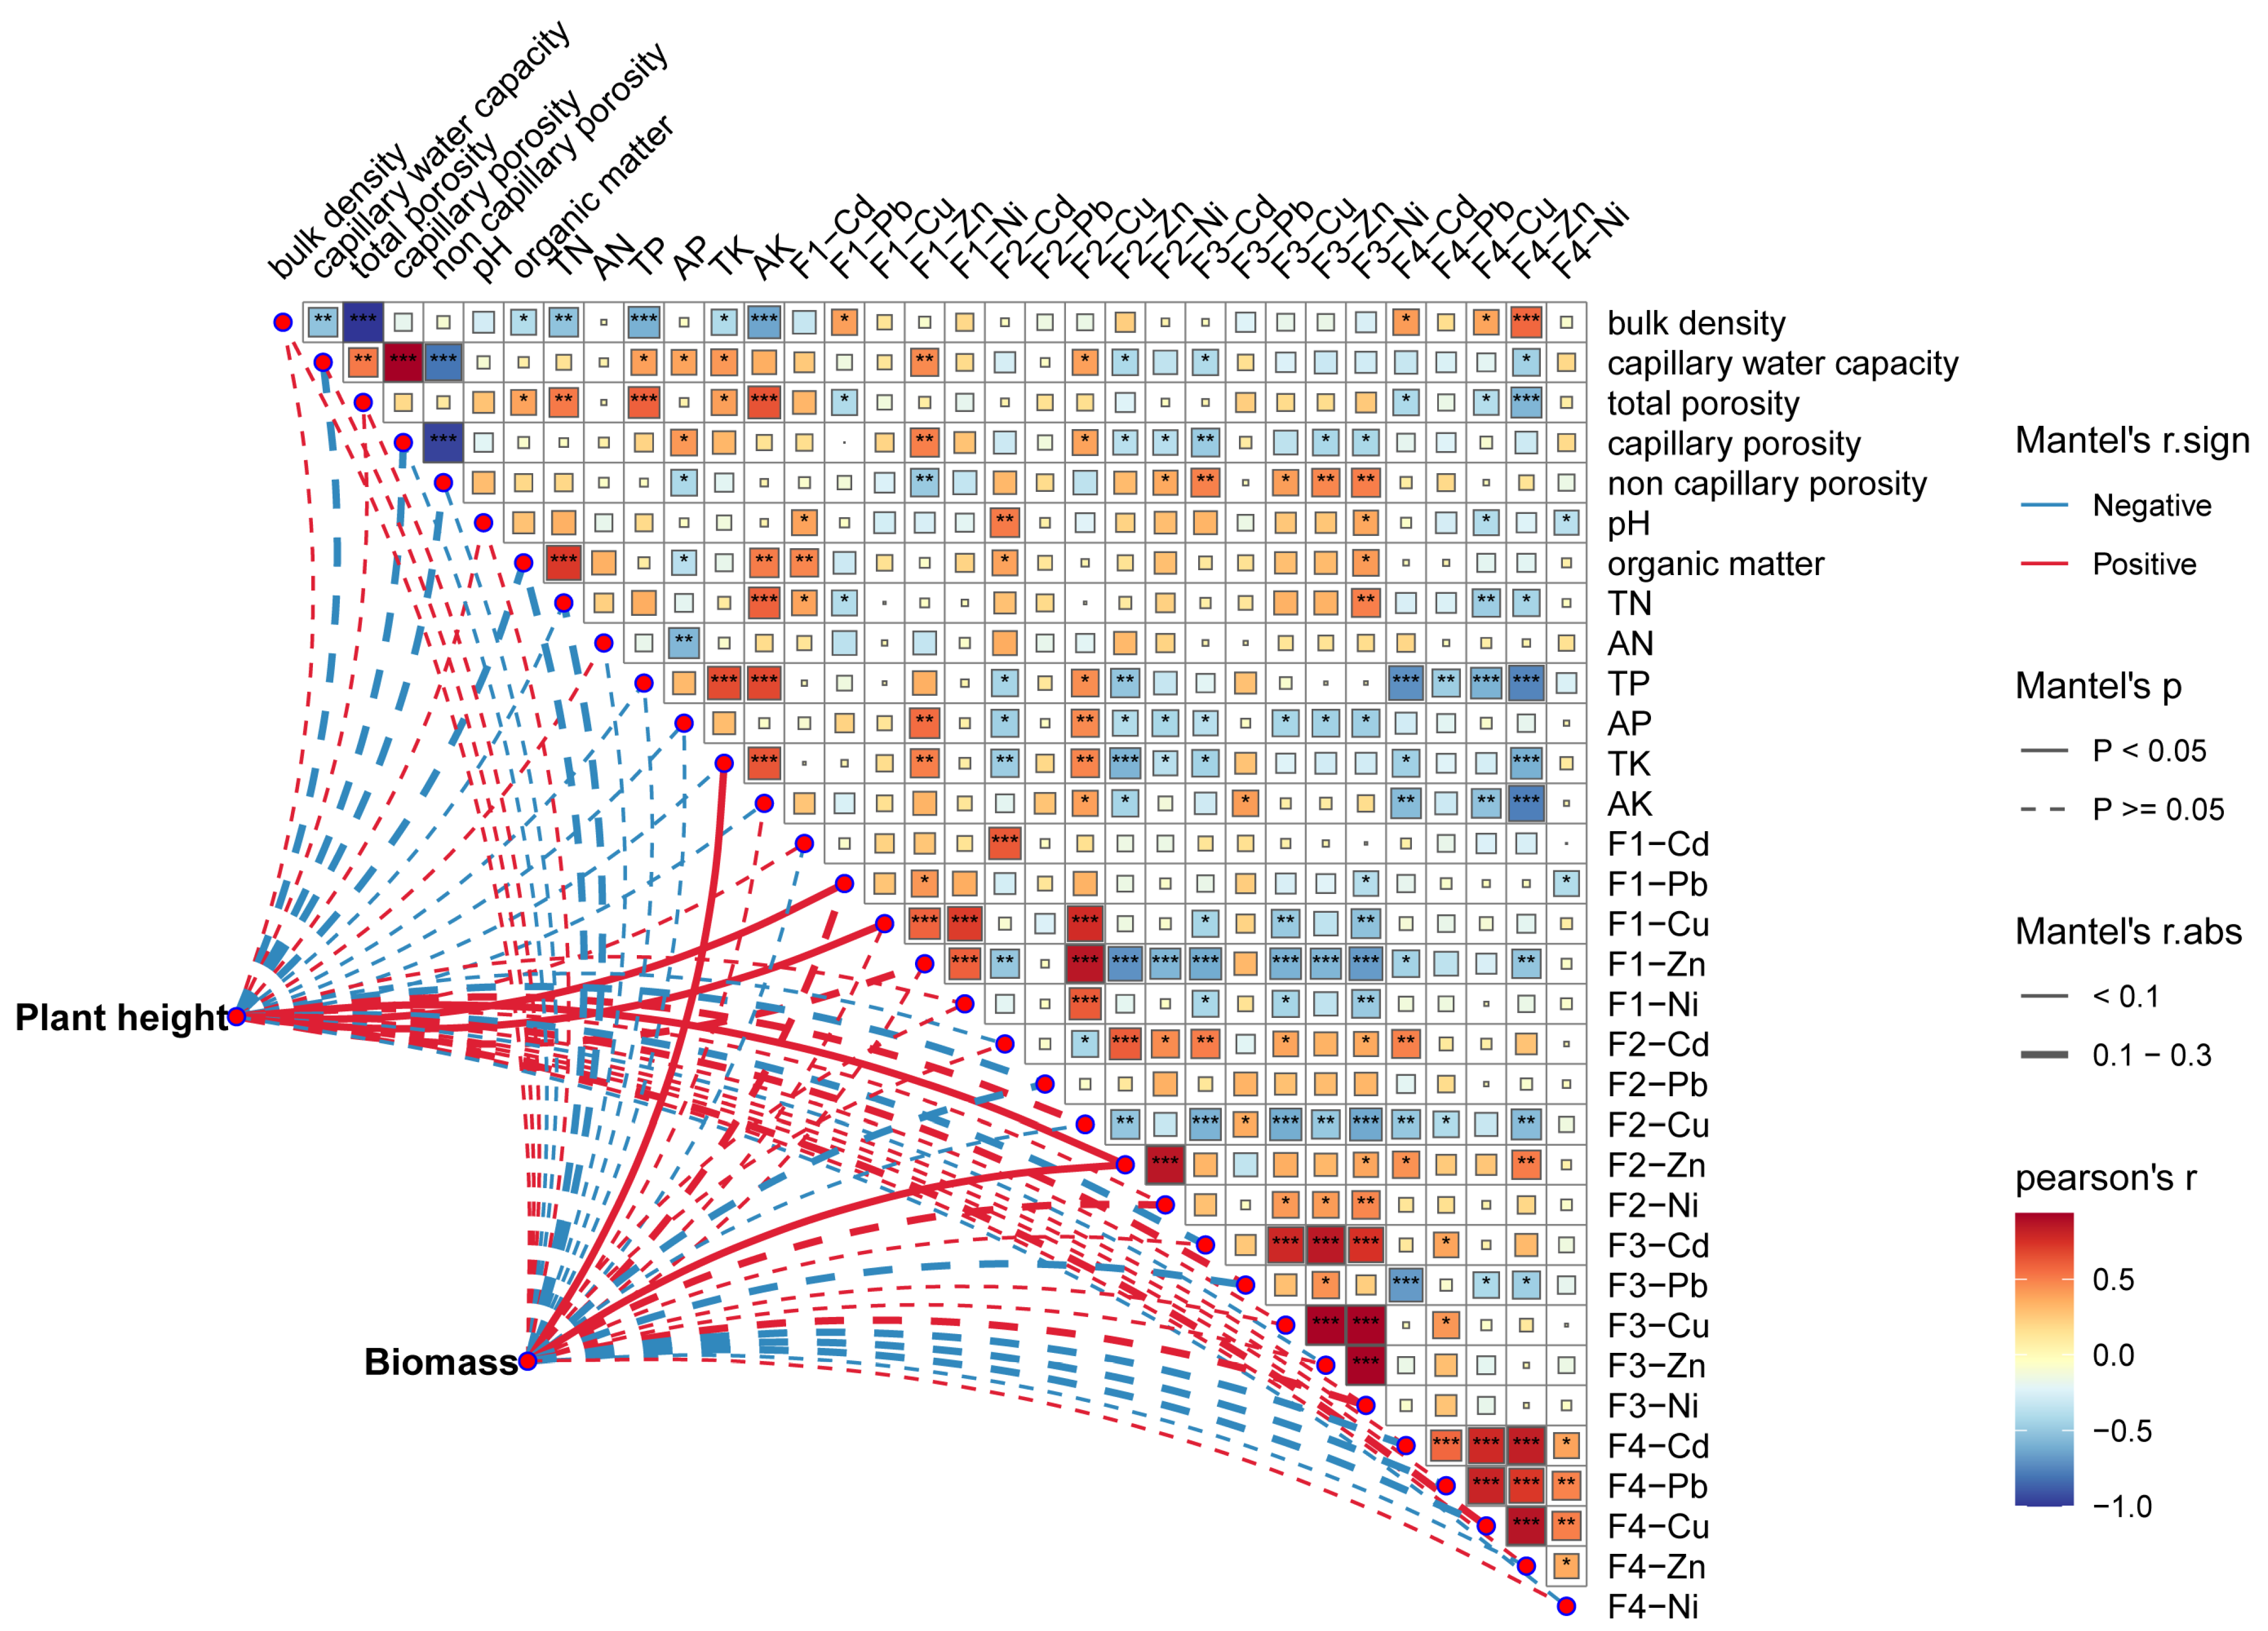
3.5. Factors Affecting the Growth of A. modestum

Mantel test analysis revealed the linkages between A. modestum growth and soil chemical properties. (Figure 8). The results showed that TK and F2-Zn had a significant impact on the biomass of A. modestum, while F1 Pb, F1 Cu, and F2-Zn had a significant impact on the plant height of A. modestum. (Figure 8). The Zn fraction of the soil was the main factor affecting the concentration in A. modestum. Among all variables, N contributed the most to the biomass.

4. Discussion

4.1. Physicochemical Properties of Sludge-Amended Soil Improved with Biochar Addition

The positive effects of biochar on soil have been quantified in previous studies through various methods, including soil biota response, metal toxicity mitigation, and soil hydraulic characteristics. Consistent with theoretical expectation, this study found that biochar significantly increased the fertility index of SS-amended landscape soil by improving (although not significant in most cases) the abiotic characteristics of the soil (such as increasing pH value, reducing soil bulk density, and increasing water holding capacity) (Table S3) and increasing certain macronutrient and micronutrient availability of SS-amended landscape soil (Table S3). Early reviews on biochar included a summary of the positive effects of adding biochar to soil physicochemical properties [27] and pointed out that these benefits mainly stem from its rich carbon content, well-developed pore structure, large specific surface area, abundant oxygen-containing functional groups, and high aromatization [28,29,30]. In addition, biochar is a rich source of potassium, phosphorus, and nitrogen, demonstrating the potential to meet the immediate nutrient supply of soil [30], which can explain the observation in this study that adding biochar has higher macronutrient and micronutrient availability in soil (Table S3). The observed changes in soil fertility index are related to the application rate and type of biochar (Figure 1), which can be expected, as previous reports have shown that biochar from different raw material sources has different densities, total pore volumes, average pore sizes, etc. [27,31,32], which are considered the main factors that alter soil properties. In this study, RB had a higher total pore volume and average pore size than SB (Figure S1). Therefore, the higher the application rate of RB, the more significant the change in bulk density or soil porosity (Table S3).
Biochar, characterized by its large surface area and porous structure, provides ample binding sites for the adsorption of PTEs and reduces their mobilization [33,34]. The addition of biochar significantly reduced the effective content of Cu in sludge amended soil (Figure 2), as observed in previous studies [10]. However, it is worth noting that this immobilization varies between different biochar types and addition rates. Specifically, SB has a more significant fixation effect on Cd, Zn, Cu, and Ni than RB, which is mainly attributed to the larger specific surface area and total pore volume of SB used in the experiment, as well as more PTE adsorption sites (Figure S1). In addition, there is evidence to suggest that the smaller the pore size of biochar, the more difficult it is for PTE ions entering the pore size to dissolve [35]. SB exhibits a smaller average pore size compared to RB and LB, but it has a larger specific surface area and total pore capacity than LB and RB, making it more favorable for the adsorption and fixation of PTEs (Figure S1).

4.2. Biochar Application to SS-Amended Soil Affects A. modestum Growth and Nutrient Element Absorption

Regardless of the type and application rate of biochar, it was observed in this study that biochar had ineffective or even negative effects on A. modestum growth (significant reduction in plant height and biomass and reduction in root biomass, root length, surface area, and volume), which contradicts the average plant growth trends described in recent meta-analyses [15,16,36]. However, these results are similar to those of Biederman & Harpole [15] and Zou et al. [37], who reported in a meta-analysis of 20 studies on plant responses to biochar. Nearly half of the plants showed negative (but not significant) biomass and root responses to biochar addition. This indicates that plant growth and the effectiveness of nutrients in soil physical properties induced by biochar are not the only mechanisms of biochar interactions. In general, perennial plant species benefit less from biochar addition than annuals [15], which is the same in the current experiment where the perennial A. modestum even showed reduced growth after addition of biota from biochar plots. An unexplored explanation for the ineffective or negative reactions of plants to biochar may be related to the exposure of plants to volatile compounds produced during pyrolysis, which are either recondensed in liquid form on the surface of biochar or trapped in pores in gas form [17,38]. Previous studies have shown that immobilizing SS-derived PTEs can greatly reduce their toxicity. However, if the immobilization effect of biochar is less effective than its inherent pollution, it may have negative consequences [2]. SB, LB, and RB all contain different pollutants, which explains the strong species-specific response pattern of plants to biochar modifiers in short-term experiments [23]. The Mantel test analysis further confirms that PTEs in biochar-SS-amended soil have a negative impact on A. modestum growth, despite a decrease in F1 of PTEs (Figure 8). In addition, the health and productivity of plants depend on the ecosystem services provided by local soil and plant-related microbial communities [39,40]. Positive effects via changing abiotic conditions in the soil may favor plant growth, while at the same time biochar-mediated changes in soil microbiota may cause negative effects [41]. The benefits of biochar application via abiotic changes may not be comparable to the negative effects on plant growth mediated by soil biota. When biochar addition stimulates plant pathogen pressure, negative plant–soil feedback is to be expected. However, since the pollutants and microbial mutualists were not quantified in this study, this remains speculative.
Currently, there are few studies reporting the returning and direct nutrient supply properties of biochar. A study reported that biochar addition increased nutrients (P and K) availability in soil [42]. The opposite trend was observed in the absorption of nutrients by A. modestum, which contradicts the result regarding the promotion of nutrient absorption by plants through biochar. Contradictory reports on changes in magnitude of plant nutrient element absorption following biochar amendment have been explained through multiple mechanisms. Biochar alters the root structure of plants and reduces nutrient acquisition [43].

4.3. Effect of Adding Biochar in SS-Amended Soil on the Absorption and Accumulation of PTEs in A. modestum

Contrary to previous studies [44,45,46], which highlighted the positive effects of biochar on soil conditions, plant growth characteristics, and defense mechanisms against PTE stress, our research findings presented contrasting results. In the majority of cases, we did not observe a significant decrease in PTE content following the addition of biochar. Notably, despite the reduced supply, there were no significant changes in Cu levels in plant tissues. In addition, in some treatments, the content of some PTEs significantly increased and PTEs accumulated in the plant. In our study, we found that the activity of antioxidant enzymes in plants with biochar application increased compared to those without biochar. That is to say, plants growing in substrate with biochar addition may show significant signs of PTEs (which may also contain other toxic elements) stress compared to plants in CK. The elevation of these enzymes was previously believed to combat free radicals, reduce cell membrane lipid peroxidation, and protect the plant body from harm [47].
The potential negative effects of biochar on plant uptake of PTEs in soil may not be consistent across all plant species. Previous studies have shown that the addition of biochar made from tea tree branches and leaves can increase the absorption of Cu, Mn, and Zn by tea trees [48]. There are several mechanisms that could explain this phenomenon. Firstly, the presence of high levels of PTEs in the biochar matrix will result in an increase in PTE content in plant tissues. Secondly, if the introduction of biochar enhances the pressure on plant pathogens, it leads to negative feedback between plants and soil as well as increased absorption of PTEs. Hence, it is crucial to meticulously choose the raw materials utilized in biochar production, considering the trade-off between achieving optimal adsorption performance and minimizing potential plant toxicity.

4.4. Challenges and Research Needs in the Application of Biochar Combined with Sludge in Urban Landscaping/Forestry

Clear evidence has been presented that the combination of biochar and SS may address several soil constraints to plant growth [13,49]. Our comprehensive results indicate that benefits may not necessarily extend to plant systems, as adding biochar to SS-amended soil showed overall negative effects on the growth of A. modestum (Table 1). This indicates that addressing these limitations with biochar varies depending on the type and amount of biochar, soil, and landscaping plants, and further clarification is needed.
(i)
Attention should be given to different plant types when considering the alleviation of phytotoxicity in SS-amended landscape soil through biochar addition. The response of plants to biochar addition may vary significantly depending on their adaptability. For instance, a study conducted by Gale et al. [23] observed contrasting growth responses in two different landscape plants in the SS-amended soil with the same biochar addition. Therefore, future research should explore the generalizability of the effects of biochar on plant growth.
(ii)
Attention needs to be paid to factors other than abiotic conditions. This study found that plant growth and the effectiveness of nutrients in soil physical properties induced by biochar are not the only mechanisms of biochar interactions. A reasonable assumption is that the changes in biological conditions induced by biochar may have a greater impact on plant growth compared to the changes in abiotic conditions, as previous reports indicated that biochar-initiated changes in microbial communities could continue beyond the short-lived abiotic changes due to density-dependent processes [50,51]. Therefore, it is imperative to study the effects of the effects of biochar amendments on soil physicochemical properties, pollutants, and microorganisms, as well as their interactions with multiple environmental factors prior to their widespread application.
(iii)
It is important to extend the test cycle. Similar to this study, most research on the effects of biochar on plant and soil characteristics has been conducted in the short term, while long-term studies are limited. Previous studies have shown that the increase in production caused by biochar becomes more complex due to occasional delayed reactions, initially producing negative or no effects in the first year but increasing production to varying degrees in subsequent years [52,53]. Another connected hypothesis is that as biochar ages or factors that hinder plant growth diminish, new patterns of plant growth may emerge. For instance, the decomposition of OM previously added in SS could lead to significant changes in the chemical forms of PTEs once the addition of SS ceases. This is because PTEs may precipitate as inorganic compounds as unstable substances degrade rapidly, subsequently forming stable compounds with inorganic salts [54], which could reduce the phytotoxicity of PTEs in SS. However, these patterns need to be verified through long-term experiments.

5. Conclusions

This study investigates the effects of sewage sludge (SS) biochar (SB), rice straw biochar (RB), and litter biochar (LB) on soil fertility, PTE fixation, and landscape plant growth of A. modestum in SS-amended soil in order to determine the feasibility of combining biochar and sludge utilization in landscape soil. As expected, the addition of biochar significantly increased soil fertility index and effectively reduced the availability of PTEs, although no significant changes were observed in some treatments. Unfortunately, these benefits did not extend to the landscape plant system, as the growth of A. modestum was inhibited to varying degrees in terms of indicators such as plant height, diameter, biomass, and root development. The concentration of PTEs in different tissues of A. modestum has increased to varying degrees. In addition, the significant increase in root physiological activities such as SOD, POD, CAT, and MDA confirms the toxic effects of pollutants on the plant. The TOPSIS result indicates that biochar has an overall negative effect on A. modestum growth except for 3.0% LB application. Overall, biochar application in the SS-amended soil might be an effective strategy for improving landscape soil properties, but the response of plants varied with landscape plant types and biochar feedstocks, which needs in-depth investigations at different levels, including plant adaptability, biochar toxicity, and the impact of biochar on soil microorganisms before final recommendations.

Supplementary Materials

The following supporting information can be downloaded at: https://www.mdpi.com/article/10.3390/f15071128/s1, Figure S1: Scanning electron microscopy images of SB (a), LB (b), and RB (c) which were produced at 500 °C temperature (scale for measuring scanning electron microscopy was 2.0 μm). SB = sewage sludge-derived biochar; LB = forest litter-derived biochar; and RB = rice straw-derived biochar; Table S1: The properties of soil, SS and biochar; Table S2: The representative meanings of each indicator; Table S3: The effects of biochar addition on SS-amended soil physical properties; Table S4: Calculate the weight of each indicator and obtain the target weight.

Author Contributions

S.C.: formal analysis and writing–original draft. M.X. and W.P.: data curation and investigation. F.L. and D.W.: investigation and data curation. D.H.: review and editing, S.Z.: writing—review and editing, supervision, and funding acquisition. All authors have read and agreed to the published version of the manuscript.

Funding

This work was financially supported by the National Natural Science Foundation of China (grant Nos. 42007335 and 31971629), the Natural Science Foundation of Guangdong Province (2021A1515012157), and the Forestry Science and Technology Innovation Project of Guangdong Province (2022KJCX015).

Data Availability Statement

The data that support the findings of this study are available from the corresponding author upon reasonable request.

Conflicts of Interest

The authors declare that they have no known competing financial interests or personal relationships that could have appeared to influence the work reported in this paper.

References

  1. Chu, S.; Jacobs, D.F.; Liao, D.; Liang, L.L.; Wu, D.; Chen, P.; Lai, C.; Zhong, F.; Zeng, S. Effects of landscape plant species and concentration of sewage sludge compost on plant growth, nutrient uptake, and heavy metal removal. Environ. Sci. Pollut. Res. 2018, 25, 35184–35199. [Google Scholar] [CrossRef] [PubMed]
  2. Wu, D.; Peng, W.; Bao, L.; Yu, X.; Dong, X.; Lai, M.; Liang, Z.; Xie, S.; Jacobs, D.F.; Zeng, S. Biochar alleviating heavy metals phytotoxicity in sludge-amended soil varies with plant adaptability. Environ. Res. 2022, 215, 114248. [Google Scholar] [CrossRef] [PubMed]
  3. Zhang, X.; Xie, H.; Liu, X.; Kong, D.; Zhang, S.; Wang, C. A novel green substrate made by sludge digestate and its biochar: Plant growth and greenhouse emission. Sci. Total Environ. 2021, 797, 149194. [Google Scholar] [CrossRef] [PubMed]
  4. Chu, S.; Yang, W.; Xia, D.; Liang, Z.; Su, S.; Zhao, N.; Wang, J.; Long, M.; Ouyang, J.; Liao, D.; et al. Changes in potentially toxic element concentration and potential ecological risk in topsoil caused by sewage sludge application on forestland: A 3-year field trial. For. Ecol. Manag. 2021, 500, 119657. [Google Scholar] [CrossRef]
  5. Chu, S.; Xian, L.; Lai, C.; Yang, W.; Wang, J.; Long, M.; Ouyang, J.; Liao, D.; Zeng, S. Migration and risks of potentially toxic elements from sewage sludge applied to acid forest soil. J. For. Res. 2023, 34, 2011–2026. [Google Scholar] [CrossRef]
  6. Chu, S.; Xian, L.; Zhao, N.; Lai, C.; Yang, W.; Wang, J.; Long, M.; Liao, D.; Ouyang, J.; Wang, Z.; et al. Combined addition of bagasse and zeolite stabilizes potentially toxic elements in sewage sludge compost and improves Eucalyptus urophylla seedling growth. For. Ecol. Manag. 2023, 539, 121003. [Google Scholar] [CrossRef]
  7. Chu, S.; Wu, D.; Liang, L.L.; Zhong, F.; Hu, Y.; Hu, X.; Lai, C.; Zeng, S. Municipal sewage sludge compost promotes Mangifera persiciforma tree growth with no risk of heavy metal contamination of soil. Sci. Rep. 2017, 7, 13408. [Google Scholar] [CrossRef] [PubMed]
  8. Urbaniak, M.; Wyrwicka, A.; Toloczko, W.; Serwecinska, L.; Zielinski, M. The effect of sewage sludge application on soil properties and willow (Salix sp.) cultivation. Sci. Total Environ. 2017, 586, 66–75. [Google Scholar] [CrossRef] [PubMed]
  9. Mansoor, S.; Kour, N.; Manhas, S.; Zahid, S.; Wani, O.A.; Sharma, V.; Wijaya, L.; Alyemeni, M.N.; Alsahli, A.A.; El-Serehy, H.A.; et al. Biochar as a tool for effective management of drought and heavy metal toxicity. Chemosphere 2021, 271, 129458. [Google Scholar] [CrossRef]
  10. Bogusz, A.; Oleszczuk, P. Sequential extraction of nickel and zinc in sewage sludge- or biochar/sewage sludge-amended soil. Sci. Total Environ. 2018, 636, 927–935. [Google Scholar] [CrossRef]
  11. Bogusz, A.; Oleszczuk, P. Effect of biochar addition to sewage sludge on cadmium, copper and lead speciation in sewage sludge-amended soil. Chemosphere 2020, 239, 124719. [Google Scholar] [CrossRef] [PubMed]
  12. Kończak, M.; Oleszczuk, P. Application of biochar to sewage sludge reduces toxicity and improve organisms growth in sewage sludge-amended soil in long term field experiment. Sci. Total Environ. 2018, 625, 8–15. [Google Scholar] [CrossRef]
  13. Stefaniuk, M.; Tsang DC, W.; Ok, Y.S.; Oleszczuk, P. A field study of bioavailable polycyclic aromatic hydrocarbons (PAHs) in sewage sludge and biochar amended soils. J. Hazard. Mater. 2018, 349, 27–34. [Google Scholar] [CrossRef] [PubMed]
  14. Khan, Z.; Fan, X.; Khan, M.N.; Khan, M.A.; Zhang, K.; Fu, Y.; Shen, H. The toxicity of heavy metals and plant signaling facilitated by biochar application: Implications for stress mitigation and crop production. Chemosphere 2022, 308, 136466. [Google Scholar] [CrossRef] [PubMed]
  15. Biederman, L.A.; Harpole, W.S. Biochar and its effects on plant productivity and nutrient cycling: A meta-analysis. GCB Bioenergy 2013, 5, 202–214. [Google Scholar] [CrossRef]
  16. Jeffery, S.; Verheijen FG, A.; van der Velde, M.; Bastos, A.C. A quantitative review of the effects of biochar application to soils on crop productivity using meta-analysis. Agric. Ecosyst. Environ. 2011, 144, 175–187. [Google Scholar] [CrossRef]
  17. Spokas, K.A.; Novak, J.M.; Stewart, C.E.; Cantrell, K.B.; Uchimiy, M.; DuSaire, M.G.; Ro, K.S. Qualitative analysis of volatile organic compounds on biochar. Chemosphere 2011, 85, 869–882. [Google Scholar] [CrossRef]
  18. Qiu, B.; Tao, X.; Wang, H.; Li, W.; Ding, X.; Chu, H. Biochar as a low-cost adsorbent for aqueous heavy metal removal: A review. J. Anal. Appl. Pyrolysis 2021, 155, 105081. [Google Scholar] [CrossRef]
  19. Cely, P.; Gascó, G.; Paz-Ferreiro, J.; Méndez, A. Agronomic properties of biochars from different manure wastes. J. Anal. Appl. Pyrolysis 2015, 111, 173–182. [Google Scholar] [CrossRef]
  20. Rigane, H.; Chtourou, M.; Ben Mahmoud, I.; Medhioub, K.; Ammar, E. Polyphenolic compounds progress during olive mill wastewater sludge and poultry manure co-composting, and humic substances building (Southeastern Tunisia). Waste Manag. Res. J. A Sustain. Circ. Econ. 2015, 33, 73–80. [Google Scholar] [CrossRef]
  21. Kammann, C.I.; Linsel, S.; Gößling, J.W.; Koyro, H. Influence of biochar on drought tolerance of Chenopodium quinoa Willd and on soil–plant relations. Plant Soil 2011, 345, 195–210. [Google Scholar] [CrossRef]
  22. Rajkovich, S.; Enders, A.; Hanley, K.; Hyland, C.; Zimmerman, A.R.; Lehmann, J. Corn growth and nitrogen nutrition after additions of biochars with varying properties to a temperate soil. Biol. Fertil. Soils 2012, 48, 271–284. [Google Scholar] [CrossRef]
  23. Gale, N.V.; Sackett, T.E.; Thomas, S.C. Thermal treatment and leaching of biochar alleviates plant growth inhibition from mobile organic compounds. PeerJ 2016, 4, e2385. [Google Scholar] [CrossRef] [PubMed]
  24. Zhang, Y.; Chen, C.; Mai, Z.; Lin, J.; Nie, L.; Maharachchikumbura, S.S.N.; You, C.; Xiang, M.; Hyde, K.D.; Manawasinghe, I.S. Co-infection of Fusarium aglaonematis sp. nov. and Fusarium elaeidis Causing Stem Rot in Aglaonema modestum in China. Front. Microbiol. 2022, 13, 930790. [Google Scholar] [CrossRef] [PubMed]
  25. Bao, S. Soil and Agro-Chemistry Analysis, 3rd ed.; China Agricultural Press: Beijing, China, 2000. [Google Scholar]
  26. Qu, F.; Zhang, Q.; Jiang, Z.; Zhang, C.; Zhang, Z.; Hu, X. Optimizing irrigation and fertilization frequency for greenhouse cucumber grown at different air temperatures using a comprehensive evaluation model. Agric. Water Manag. 2022, 273, 107876. [Google Scholar] [CrossRef]
  27. Omondi, M.O.; Xia, X.; Nahayo, A.; Liu, X.; Korai, P.K.; Pan, G. Quantification of biochar effects on soil hydrological properties using meta-analysis of literature data. Geoderma 2016, 274, 28–34. [Google Scholar] [CrossRef]
  28. Ahmad, A.; Chowdhary, P.; Khan, N.; Chaurasia, D.; Varjani, S.; Pandey, A.; Chaturvedi, P. Effect of sewage sludge biochar on the soil nutrient, microbial abundance, and plant biomass: A sustainable approach towards mitigation of solid waste. Chemosphere 2022, 287, 132112. [Google Scholar] [CrossRef] [PubMed]
  29. Hossain, M.Z.; Bahar, M.M.; Sarkar, B.; Donne, S.W.; Ok, Y.S.; Palansooriya, K.N.; Kirkham, M.B.; Chowdhury, S.; Bolan, N. Biochar and its importance on nutrient dynamics in soil and plant. Biochar 2020, 2, 379–420. [Google Scholar] [CrossRef]
  30. Karim, A.A.; Kumar, M.; Singh, E.; Kumar, A.; Kumar, S.; Ray, A.; Dhal, N.K. Enrichment of primary macronutrients in biochar for sustainable agriculture: A review. Crit. Rev. Environ. Sci. Technol. 2022, 52, 1449–1490. [Google Scholar] [CrossRef]
  31. Blanco-Canqui, H. Biochar and Soil Physical Properties. Soil Sci. Soc. Am. J. 2017, 81, 687–711. [Google Scholar] [CrossRef]
  32. Singh, H.; Northup, B.K.; Rice, C.W.; Prasad, P.V.V. Biochar applications influence soil physical and chemical properties, microbial diversity, and crop productivity: A meta-analysis. Biochar 2022, 4, 8. [Google Scholar] [CrossRef]
  33. Haider, F.U.; Wang, X.; Farooq, M.; Hussain, S.; Cheema, S.A.; Ain, N.U.; Virk, A.L.; Ejaz, M.; Janyshova, U.; Liqun, C. Biochar application for the remediation of trace metals in contaminated soils: Implications for stress tolerance and crop production. Ecotoxicol. Environ. Saf. 2022, 230, 113165. [Google Scholar] [CrossRef] [PubMed]
  34. Qian, S.; Zhou, X.; Fu, Y.; Song, B.; Yan, H.; Chen, Z.; Sun, Q.; Ye, H.; Qin, L.; Lai, C. Biochar-compost as a new option for soil improvement: Application in various problem soils. Sci. Total Environ. 2023, 870, 162024. [Google Scholar] [CrossRef] [PubMed]
  35. Mohamed, B.A.; Ellis, N.; Kim, C.S.; Bi, X.; Chen, W. Engineered biochars from catalytic microwave pyrolysis for reducing heavy metals phytotoxicity and increasing plant growth. Chemosphere 2021, 271, 129808. [Google Scholar] [CrossRef] [PubMed]
  36. Thomas, S.C.; Gale, N. Biochar and forest restoration: A review and meta-analysis of tree growth responses. New For. 2015, 46, 931–946. [Google Scholar] [CrossRef]
  37. Zou, Z.; Fan, L.; Li, X.; Dong, C.; Zhang, L.; Zhang, L.; Fu, J.; Han, W.; Yan, P. Response of Plant Root Growth to Biochar Amendment: A Meta-Analysis. Agronomy 2021, 11, 2442. [Google Scholar] [CrossRef]
  38. Hale, S.E.; Lehmann, J.; Rutherford, D.; Zimmerman, A.R.; Bachmann, R.T.; Shitumbanuma, V.; OToole, A.; Sundqvist, K.L.; Arp HP, H.; Cornelissen, G. Quantifying the Total and Bioavailable Polycyclic Aromatic Hydrocarbons and Dioxins in Biochars. Environ. Sci. Technol. 2012, 46, 2830–2838. [Google Scholar] [CrossRef] [PubMed]
  39. Dignam, B.E.A.; O’Callaghan, M.; Condron, L.M.; Raaijmakersc, J.M.; Kowalchukd, G.A.; Wakelin, S.A. Impacts of long-term plant residue management on soil organic matter quality, Pseudomonas community structure and disease suppressiveness. Soil Biol. Biochem. 2019, 135, 396–406. [Google Scholar] [CrossRef]
  40. Huang, X.; Liu, S.; Liu, X.; Zhang, S.; Li, L.; Zhao, H.; Zhao, J.; Zhang, J.; Cai, Z. Plant pathological condition is associated with fungal community succession triggered by root exudates in the plant-soil system. Soil Biol. Biochem. 2020, 151, 108046. [Google Scholar] [CrossRef]
  41. Hol, W.H.G.; Vestergård, M.; Ten Hooven, F.; Duyts, H.; van de Voorde, T.H.J.; Bezemer, T.M. Transient negative biochar effects on plant growth are strongest after microbial species loss. Soil Biol. Biochem. 2017, 115, 442–451. [Google Scholar] [CrossRef]
  42. Prendergast Miller, M.T.; Duvall, M.; Sohi, S.P. Biochar-root interactions are mediated by biochar nutrient content and impacts on soil nutrient availability. Eur. J. Soil Sci. 2014, 65, 173–185. [Google Scholar] [CrossRef]
  43. Rafique, M.; Ortas, I.; Rizwan, M.; Chaudhary, H.J.; Gurmani, A.R.; Munism, U.F.H. Residual effects of biochar and phosphorus on growth and nutrient accumulation by maize (Zea mays L.) amended with microbes in texturally different soils. Chemosphere 2020, 238, 124710. [Google Scholar]
  44. Huang, L.; Gu, M. Effects of Biochar on Container Substrate Properties and Growth of Plants—A Review. Horticulturae 2019, 5, 14. [Google Scholar] [CrossRef]
  45. Somerville, P.D.; Farrell, C.; May, P.B.; Livesley, S.J. Biochar and compost equally improve urban soil physical and biological properties and tree growth, with no added benefit in combinatio. Sci. Total Environ. 2020, 706, 135736. [Google Scholar] [CrossRef]
  46. Yoo, S.Y.; Kim, Y.J.; Yoo, G. Understanding the role of biochar in mitigating soil water stress in simulated urban roadside soil. Sci. Total Environ. 2020, 738, 139798. [Google Scholar] [CrossRef] [PubMed]
  47. Teodoro, M.; Clemente, R.; Ferrer-Bustins, E.; Martínez-Fernández, D.; Pilar Bernal, M.; Vítková, M.; Vítek, P.; Komárek, M. Nanoscale Zero-Valent Iron Has Minimum Toxicological Risk on the Germination and Early Growth of Two Grass Species with Potential for Phytostabilization. Nanomaterials 2020, 10, 1537. [Google Scholar] [CrossRef]
  48. Sarmah, M.; Borgohain, A.; Gogoi, B.B.; Yeasin, M.; Paul, R.K.; Malakar, H.; Handique, J.G.; Saikia, J.; Deka, D.; Khare, P.; et al. Insights into the effects of tea pruning litter biochar on major micronutrients (Cu, Mn, and Zn) pathway from soil to tea plant: An environmental armour. J. Hazard. Mater. 2023, 442, 129970. [Google Scholar] [CrossRef]
  49. Stefaniuk, M.; Oleszczuk, P. Addition of biochar to sewage sludge decreases freely dissolved PAHs content and toxicity of sewage sludge-amended soil. Environ. Pollut. 2016, 218, 242–251. [Google Scholar] [CrossRef]
  50. Mukherjee, A.; Zimmerman, A.R.; Hamdan, R.; Cooper, W.T. Physicochemical changes in pyrogenic organic matter (biochar) after 15 months of field aging. Solid Earth 2014, 5, 693–704. [Google Scholar] [CrossRef]
  51. Oram, N.J.; van de Voorde, T.F.J.; Ouwehand, G.; Bezemer, T.M.; Mommer, L.; Jeffery, S.; Groenigen, J.W.V. Soil amendment with biochar increases the competitive ability of legumes via increased potassium availability. Agric. Ecosyst. Environ. 2014, 191, 92–98. [Google Scholar] [CrossRef]
  52. Gaskin, J.W.; Speir, R.A.; Harris, K.; Das, K.C.; Lee, R.D.; Morris, L.A.; Fisher, D.S. Effect of Peanut Hull and Pine Chip Biochar on Soil Nutrients, Corn Nutrient Status, and Yield. Agron. J. 2010, 102, 623–633. [Google Scholar] [CrossRef]
  53. Major, J.; Lehmann, J.; Rondon, M.; Goodale, C. Fate of soil-applied black carbon: Downward migration, leaching and soil respiration. Glob. Change Biol. 2010, 16, 1366–1379. [Google Scholar] [CrossRef]
  54. Torri, S.I.; Lavado, R.S. Dynamics of Cd, Cu and Pb added to soil through different kinds of sewage sludge. Waste Manag. 2008, 28, 821–832. [Google Scholar] [CrossRef] [PubMed]
Figure 1. The effects of biochar addition on soil fertility index. Note: The value is the mean ± SE (n = 3). Different capital letters indicate significant differences between different application rates under the same biochar type conditions. Different lowercase letters indicate significant differences between different types of biochar under the same biochar application conditions (α = 0.05 by Tukey’s HSD test).
Forests 15 01128 g001
Figure 2. The effects of biochar addition on soil PTE content and fractionation. (A), conten of Cd. (B), conten of Pb. (C), conten of Cu. (D), conten of Zn. (E), conten of Ni. Note: The value is the mean ± SE (n = 3). Different capital letters indicate significant differences between different application rates under the same biochar type conditions. F1: exchangeable; F2: reducible; F3: oxidizable; F4: residual. Different lowercase letters indicate significant differences between different types of biochar under the same biochar application conditions (α = 0.05 by Tukey’s HSD test). F1: blue lower-case letters; F2: purple lower-case letters; F3: white lower-case letters; F4: red lower-case letters.
Forests 15 01128 g002
Figure 3. Plant height, root length, and biomass. (A), Plant height. (B), Total root height. (C), Dry weight. Note: The value is the mean ± SE (n = 3). Different capital letters indicate significant differences between different application rates under the same biochar type conditions. Different lowercase letters indicate significant differences between different types of biochar under the same biochar application conditions (α = 0.05 by Tukey’s HSD test). Root: green letter; Shoot: red letters; Total plant: black letters. The means with different upper-case letters are significantly different between treatments for the fresh/dry weight of the whole plant.
Forests 15 01128 g003
Figure 4. Nutrient element absorption. (AC), Shoot nutrient of N, P and K content. (DF), Root nutrient of N, P and K content. Note: Values are mean ± SE (n = 3). In the same type of biochar, different capital letters indicate significant differences between different application rates. At the same biochar application rate, different lowercase letters indicate significant differences between different types of biochar (α = 0.05 by Tukey’s HSD test).
Forests 15 01128 g004
Figure 5. The effects of biochar addition on root morphology. (A), Root activity. (B), Soluble protein. (C), SOD. (D), POD. (E), CAT. (F), MDA. Note: Values are mean ± SE (n = 3). In the same type of biochar, different capital letters indicate significant differences between different application rates. At the same biochar application rate, different lowercase letters indicate significant differences between different types of biochar (α = 0.05 by Tukey’s HSD test).
Forests 15 01128 g005
Figure 6. The effects of biochar addition on plant PTE content. (A), Shoot Cd content. (B), Root Cd content. (C), Shoot Pb content. (D), Root Pb content. (E), Shoot Cu content. (F), Root Cu content. (G), Shoot Zn content. (H), Root Zn content. (I), Shoot Ni content. (J), Root Ni content. Note: Values are mean ± SE (n = 3). In the same type of biochar, different capital letters indicate significant differences between different application rates. At the same biochar application rate, different lowercase letters indicate significant differences between different types of biochar (α = 0.05 by Tukey’s HSD test).
Forests 15 01128 g006
Figure 7. The effects of biochar addition on plant PTE accumulation. (A), Accumulation of Cd. (B), Accumulation of Pb. (C), Accumulation of Cu. (D), Accumulation of Zn. (E), Accumulation of Ni. Note: Values are mean ± SE (n = 3). In the same type of biochar, different capital letters indicate significant differences between different application rates. At the same biochar application rate, different lowercase letters indicate significant differences between different types of biochar (α = 0.05 by Tukey’s HSD test). Root: green letter; Shoot: red letters; Total plant: black letters.
Forests 15 01128 g007
Figure 8. Mantel test analysis revealing the linkages between plant growth and soil chemical properties. Note: The * indicate the significant differences at p < 0.05, ** indicate the significant differences at p < 0.01, and *** indicate the significant differences at p < 0.001.
Forests 15 01128 g008
Table 1. Ranking of A. modestum growth based on TOPSIS comprehensive evaluation.
Treatment D i + D i CiRanking Number
CK43.1366.800.612
SB1.574.4222.410.237
SB3.064.9935.390.354
SB4.567.8828.460.306
LB1.585.218.800.0910
LB3.066.9835.650.355
LB4.533.3171.410.681
RB1.580.0016.410.178
RB3.049.4641.630.463
RB4.585.319.960.109
Note: D i + and D i represent the positive and negative distances between each target value and the ideal value for each scheme, and the queuing indicator value Ci was calculated for each production area. The closer the value of Ci is to 1, the better the comprehensive evaluation.
Disclaimer/Publisher’s Note: The statements, opinions and data contained in all publications are solely those of the individual author(s) and contributor(s) and not of MDPI and/or the editor(s). MDPI and/or the editor(s) disclaim responsibility for any injury to people or property resulting from any ideas, methods, instructions or products referred to in the content.

