Analysis of Long-Term Vegetation Trends and Their Climatic Driving Factors in Equatorial Africa
Abstract
:1. Introduction
- (1)
- To investigate the spatiotemporal trends in vegetation and climate variables;
- (2)
- To analyze the main climatic drivers of vegetation variability in the EQA region. All the analyses were conducted in the EQA region from 1982 to 2021.
2. Materials and Methods
2.1. Study Area
2.2. Data Sources
2.2.1. NDVI
2.2.2. Climate Datasets (Precipitation and Temperature)
2.2.3. Land Use Land Cover
2.3. Methods
2.3.1. Data Processing
2.3.2. Statistical Analysis
3. Results
3.1. Seasonal Analysis of the NDVI
3.2. Long-Term Changes in NDVI and Climate Drivers
3.2.1. Spatial Trends in NDVI and Climate Drivers
3.2.2. Temporal Trends in NDVI and Climate Drivers
3.3. Abrupt Change Analysis of NDVI and Climate Drivers
3.4. Analysis of Factors That Drive NDVI Changes
Correlation Analysis of NDVI and Climate Drivers
4. Discussion
5. Conclusions
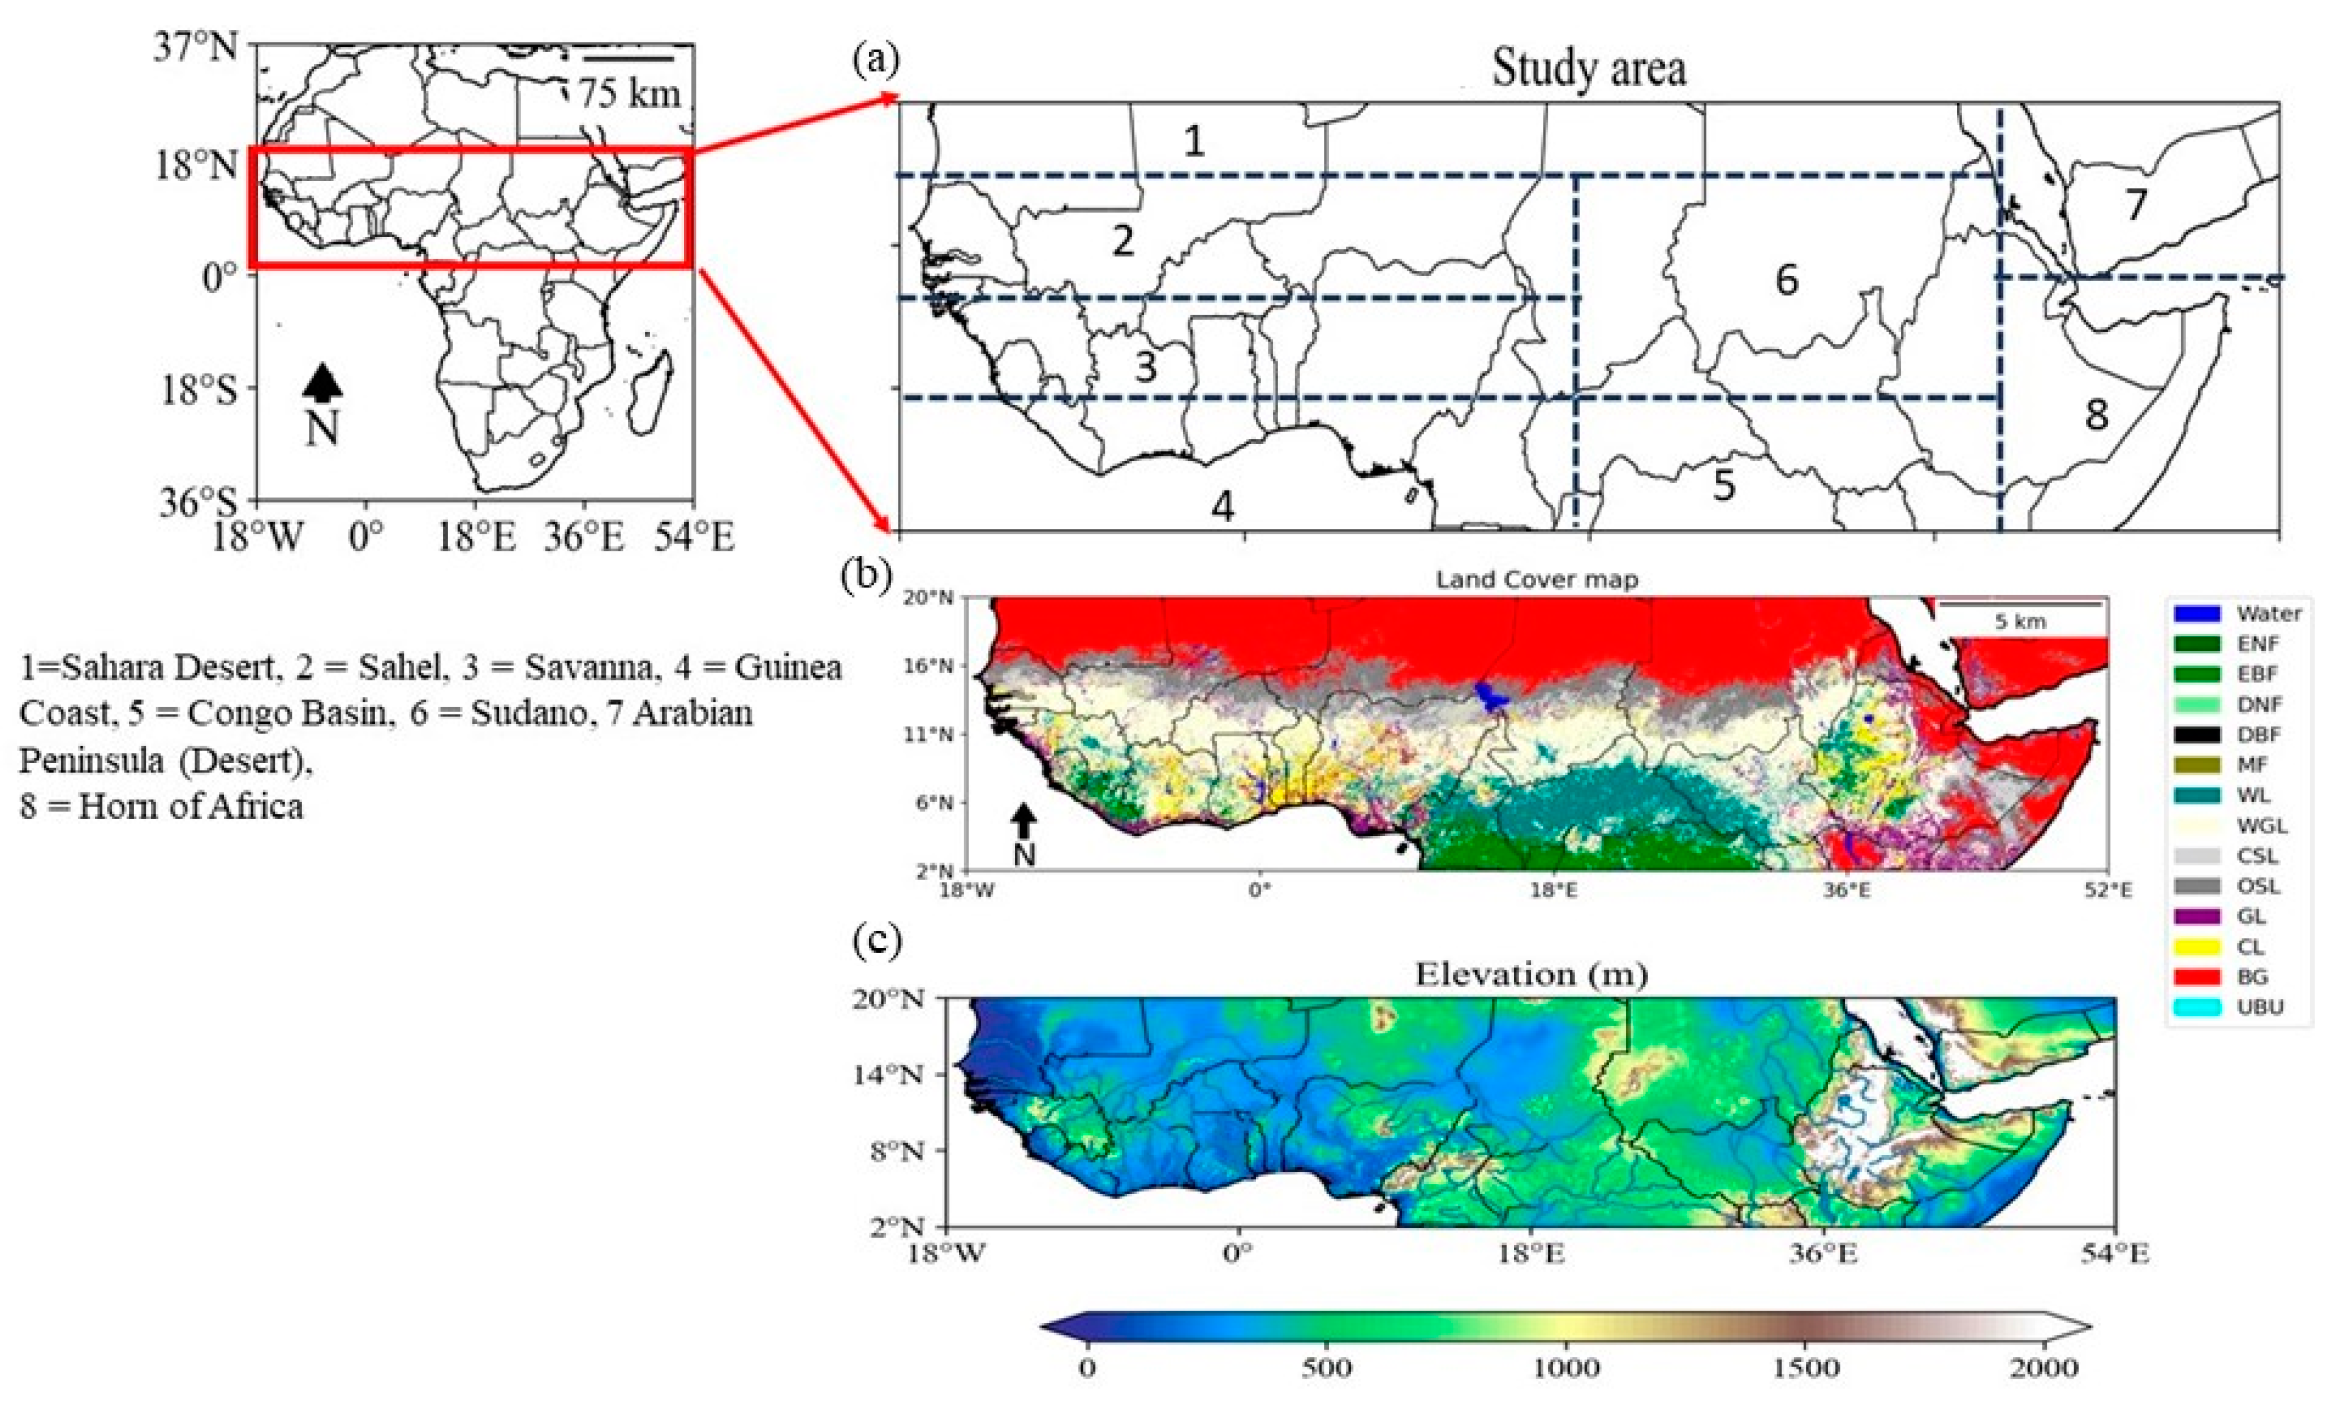
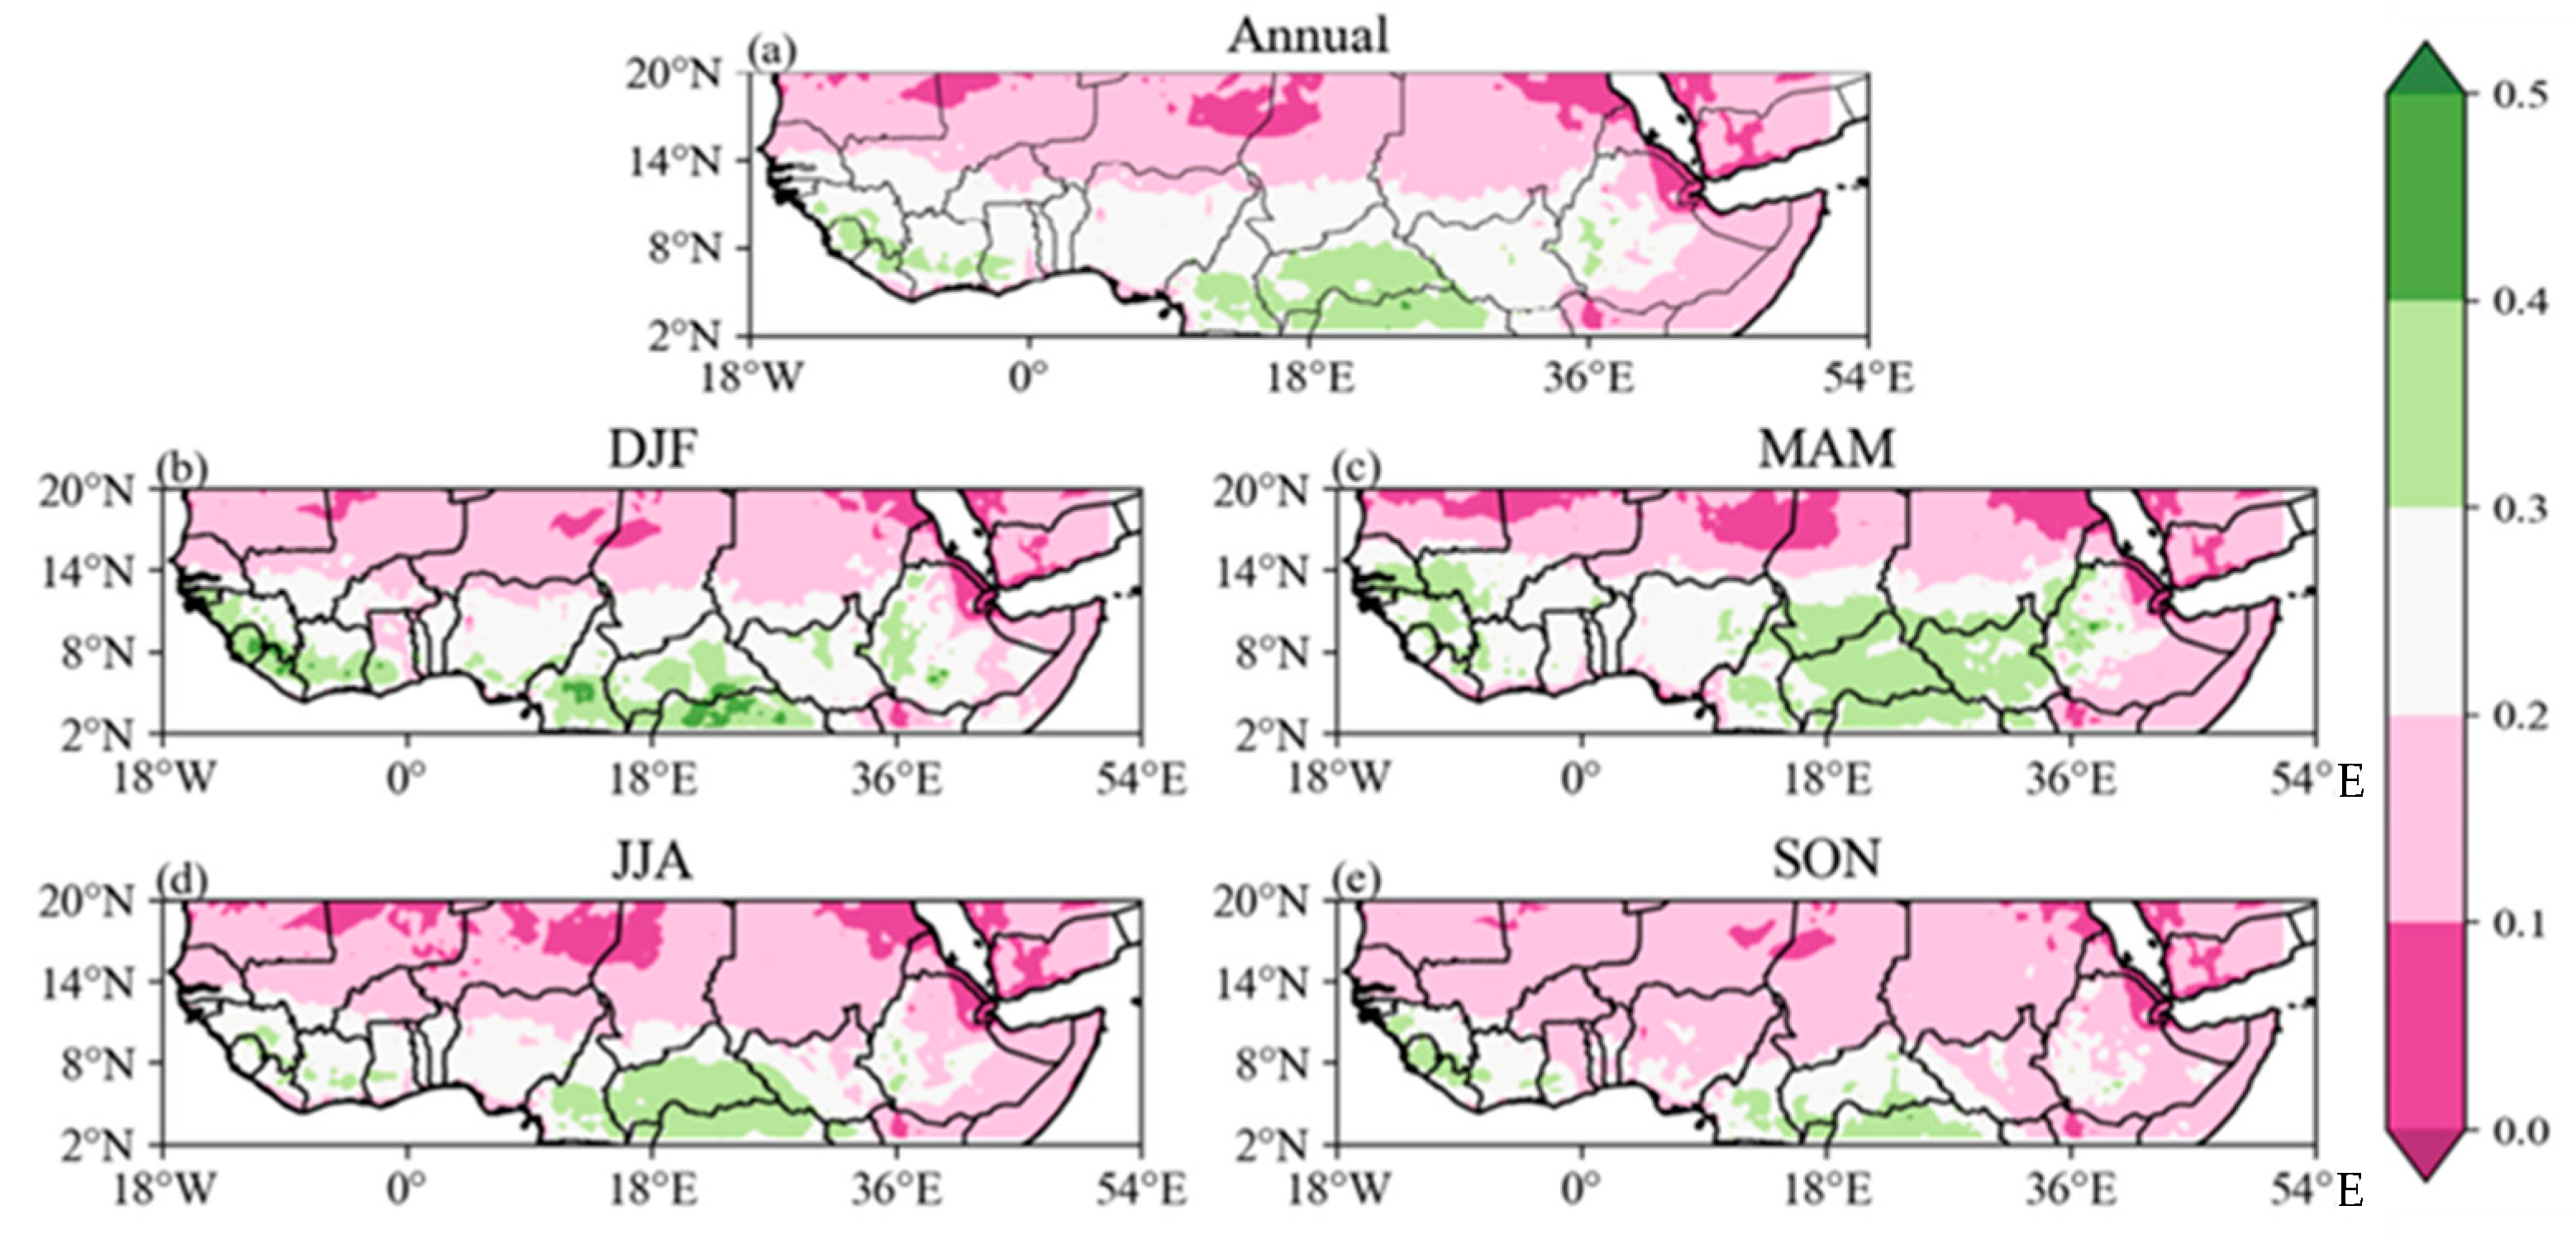
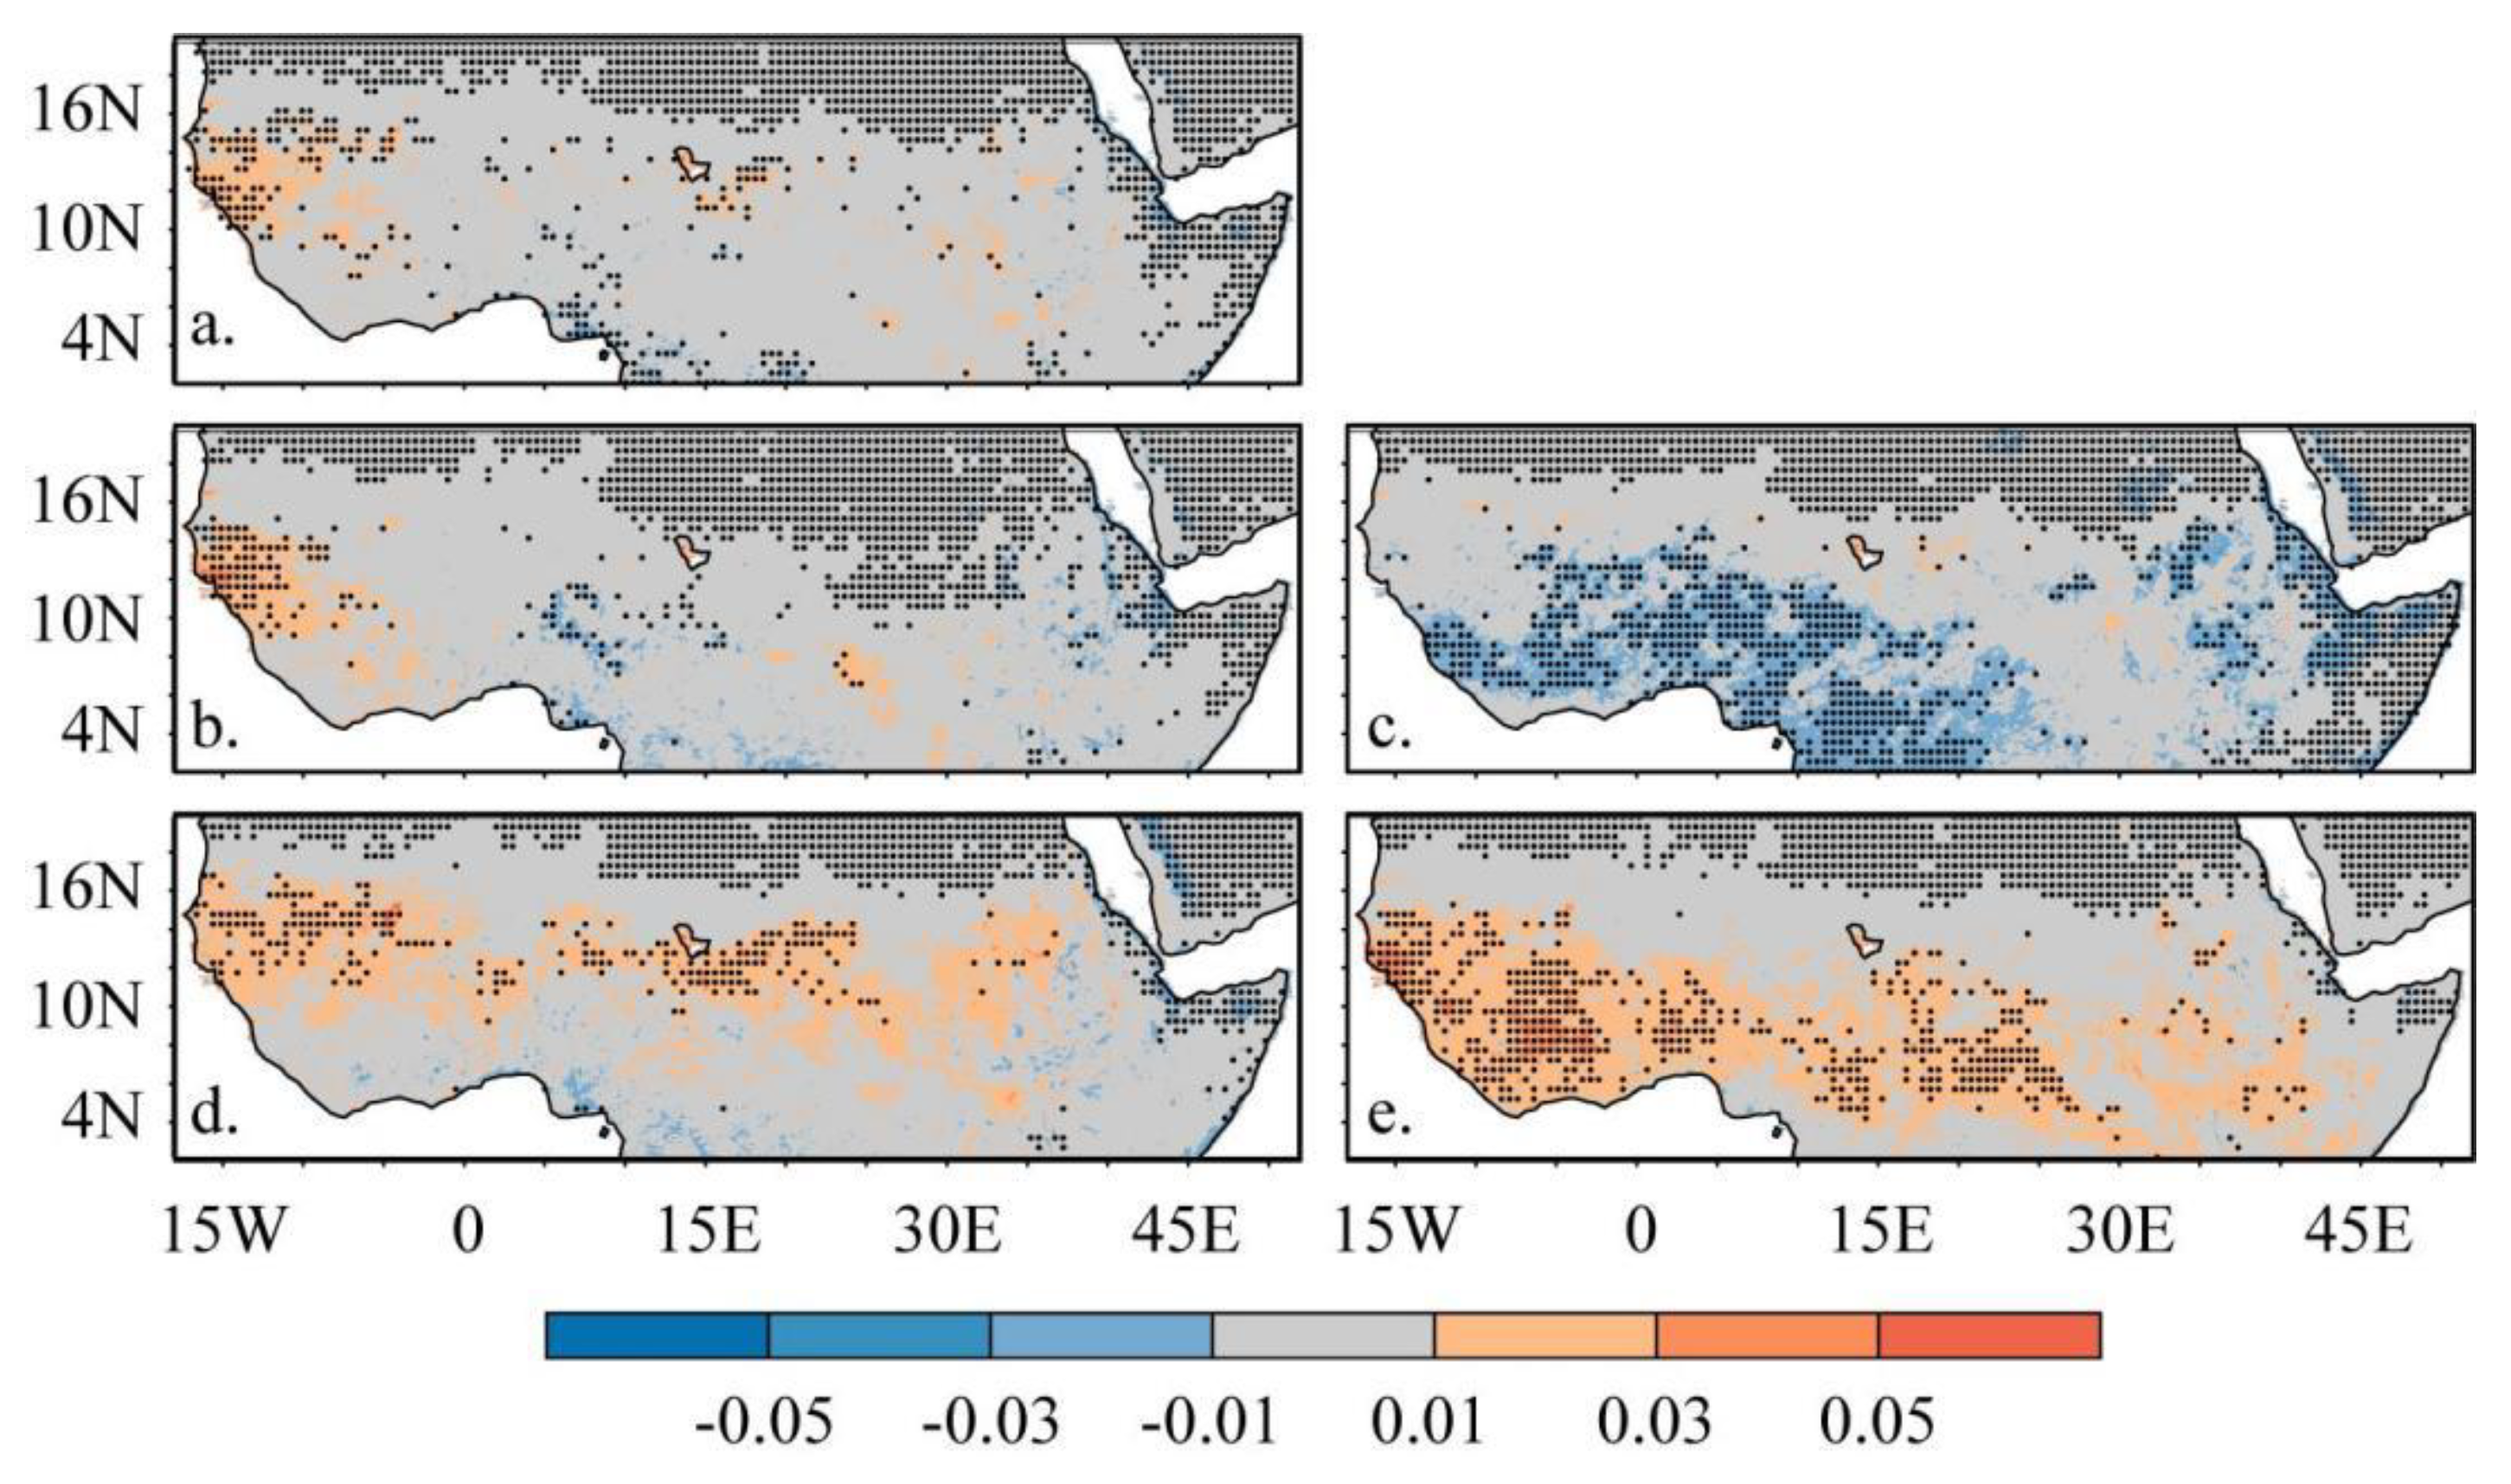
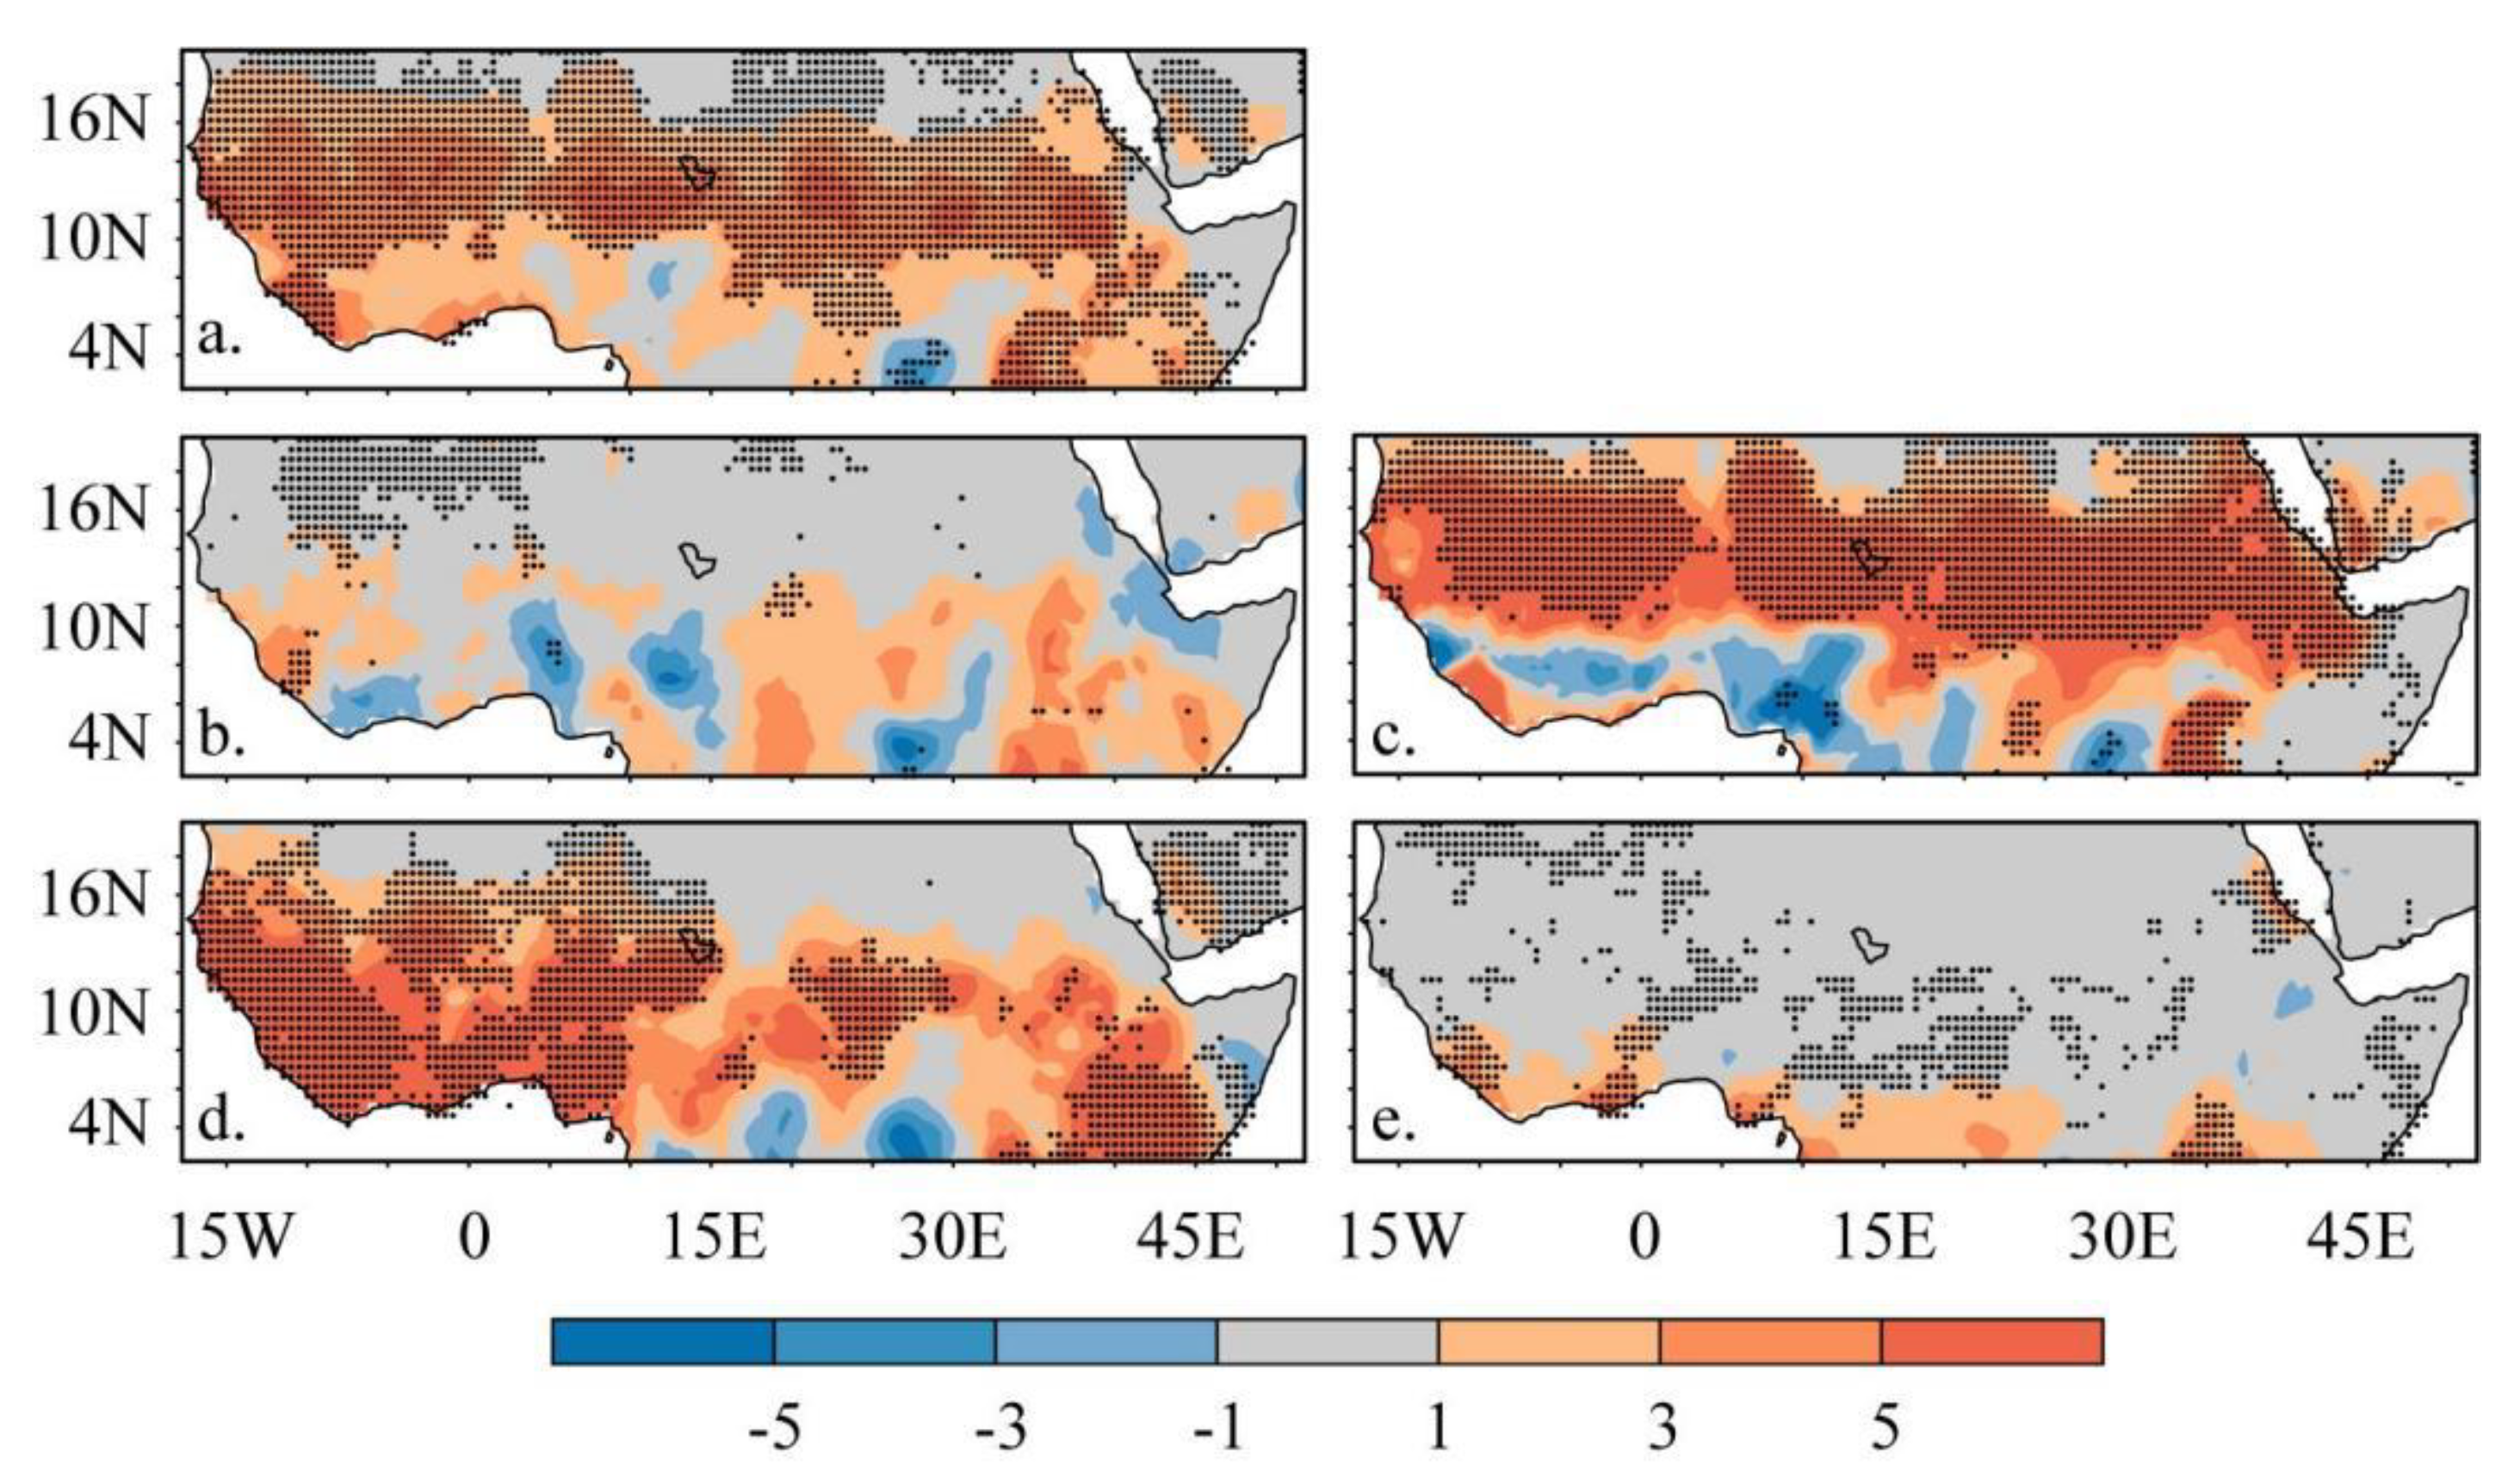
- The NDVI annual trends revealed a distinct spatial heterogeneity with obvious contrasting seasonal patterns in the Sahel, Savanna, Guinea Coast, Congo Basin, Sudano, Horn of Africa, Saharan Desert, and Arabian Peninsula at a rate of 0.5 per decade. Precipitation annual trends showed significant increasing trends in the Sahel, Savanna, Sudano, and western Guinea Coast at 0.1 mm per decade. Over the whole of the study area, the spatial patterns of the TMAX, TMIN, and TMEAN showed comparable positive trends at the annual rate of 0.2 °C per decade over the past 39 years;
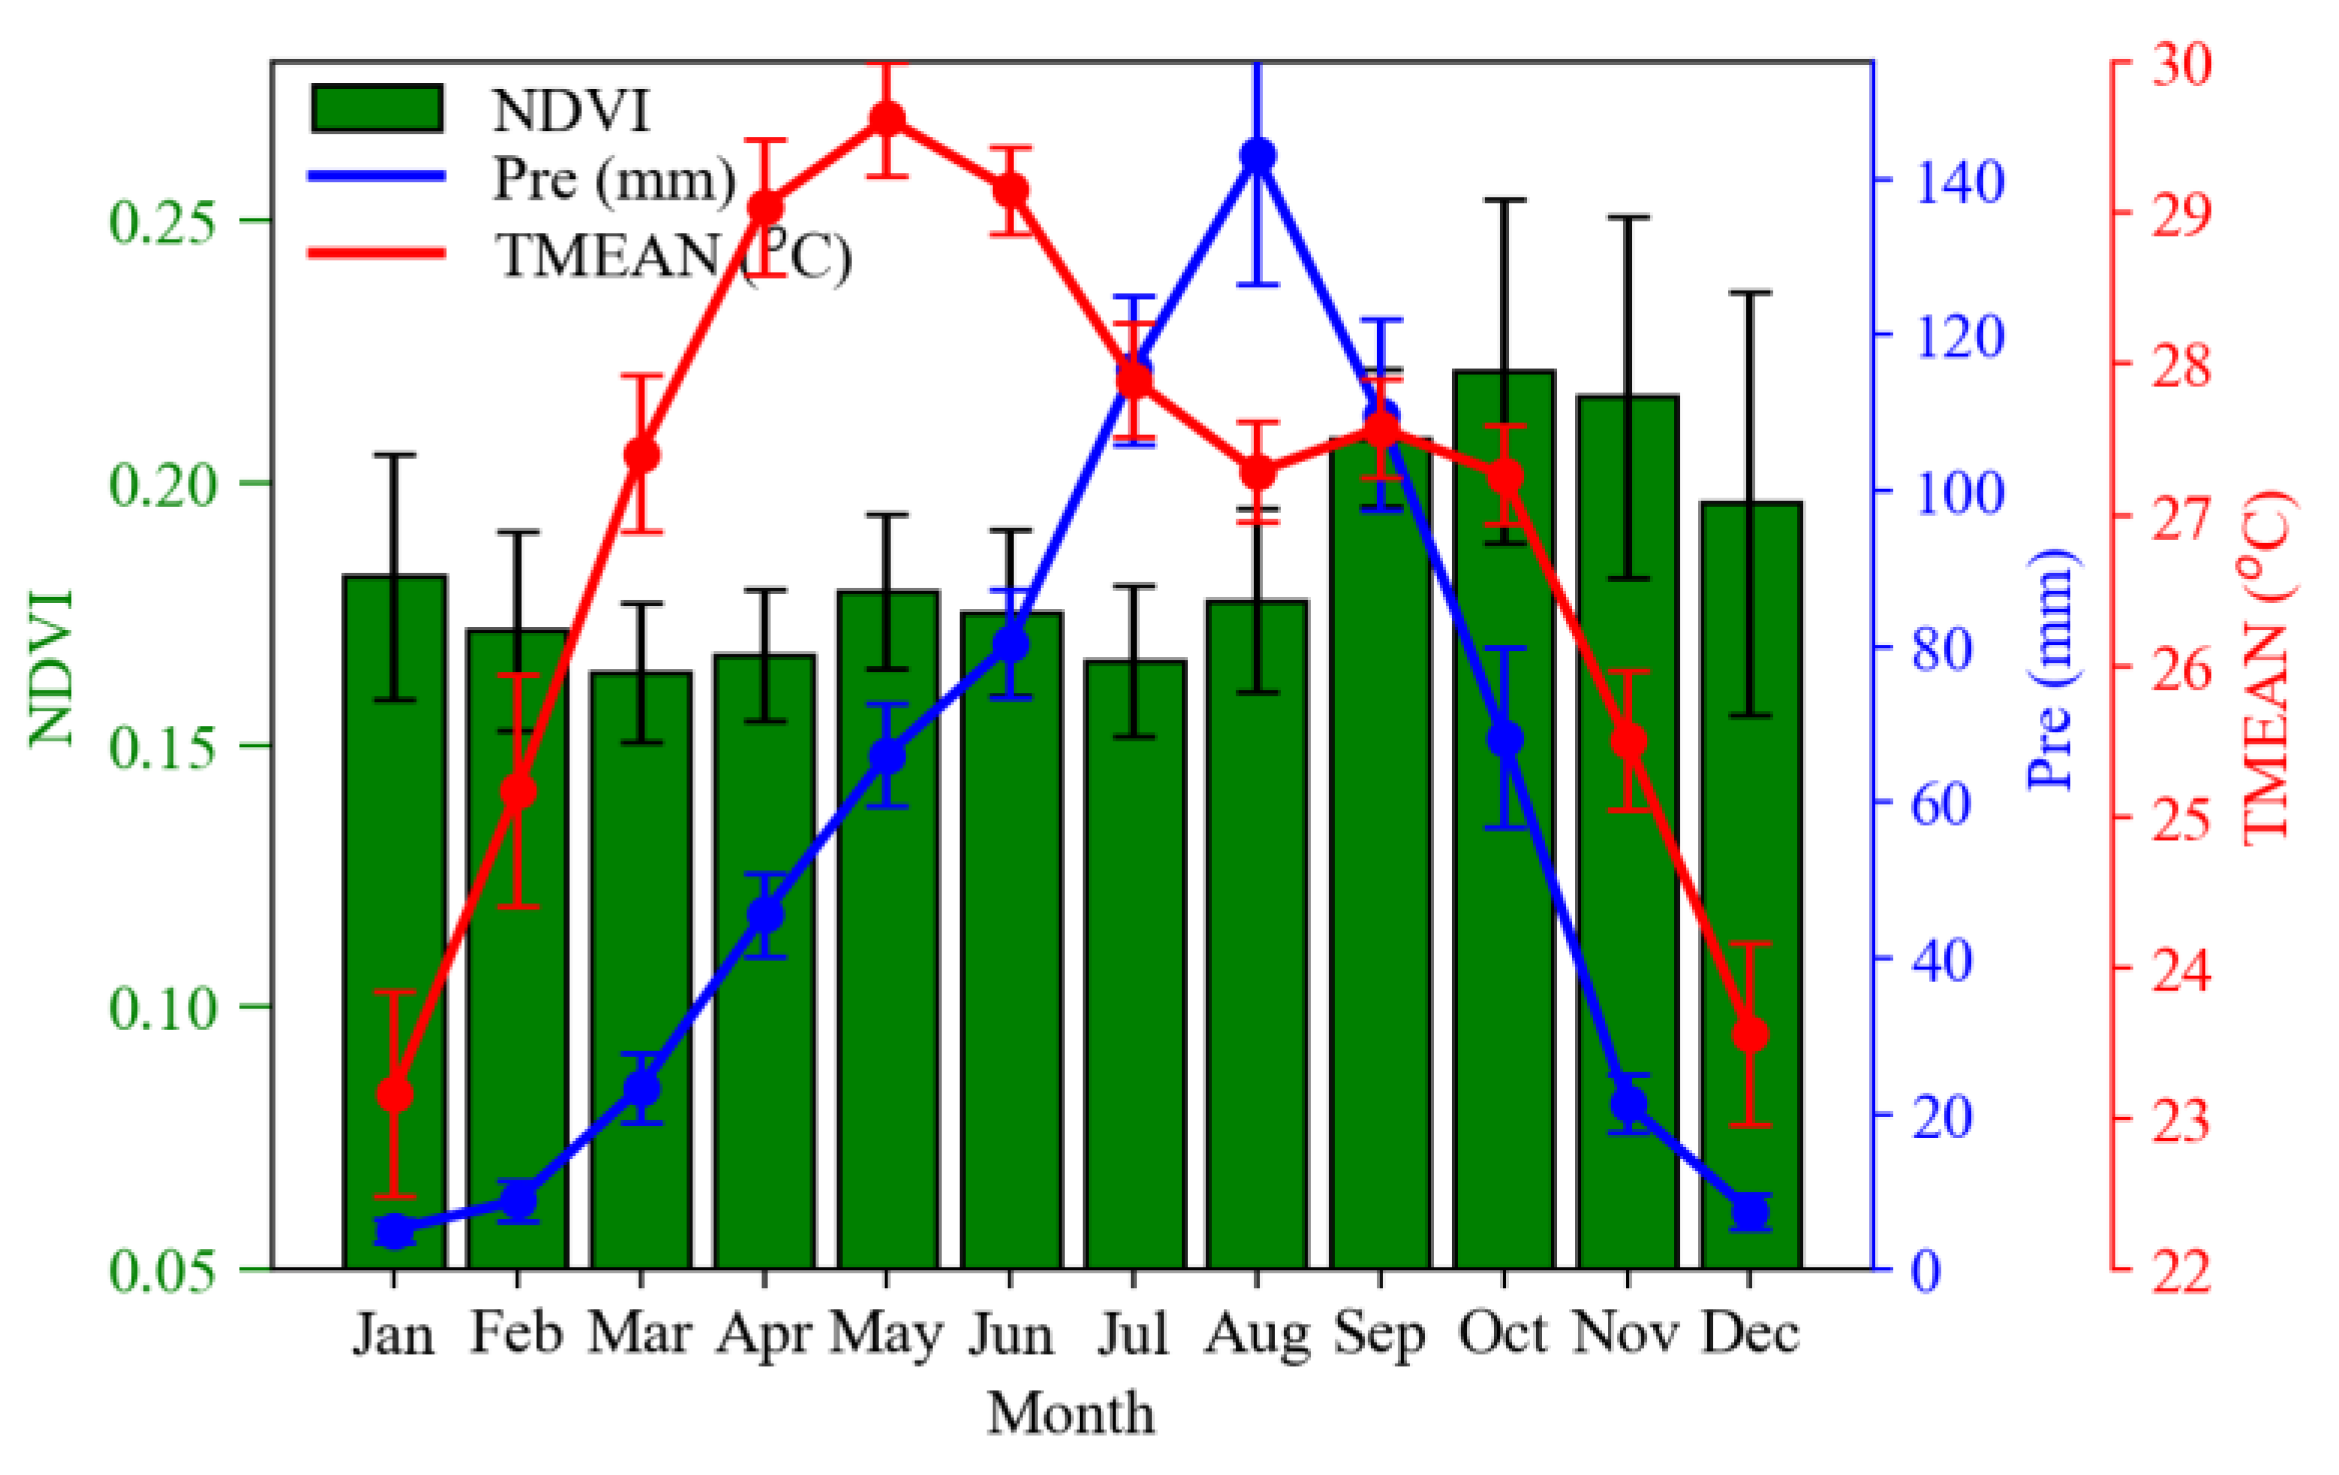
- The temporal NDVI trends decreased at an annual rate of −2.3 (×10−4) per decade, with trends decreasing in spring and summer and increasing in autumn and winter, i.e., −3.9 (×10−4) and −7.5 (×10−4); 3.3 (×10−4) and 1.4 (×10−4), respectively. Precipitation trends increased annually at a rate of 2.0 mm per decade and in all four seasons with rates of 4.5 mm10a−1, 3.5 mm10a−1, 0.9 mm10a−1, and 0.4 mm10a−1. The TMAX, TMIN, and TMEAN showed similar increasing annual trends at 0.2 °C (10a−1) and in all four seasons;
- The timing of the abrupt changes differed among the NDVI, P, and TMAX (i.e., 2009, 2002, and 2000), respectively, except for the TMIN and TMEAN in 2001. The NDVI breakpoints in spring and summer occurred in 2002 but differed in autumn (1994) and winter (1993). Seasonal P timing of abrupt changes differed in all four seasons (i.e., spring, summer, autumn, and spring), occurring in 2011, 2002, 1996, and 1998, respectively. The timing of abrupt changes between the TMAX and TMIN differed in spring (1997, 2000), summer and autumn (2000, 2001), and winter (1994, 2001), respectively, except in summer in 2001;
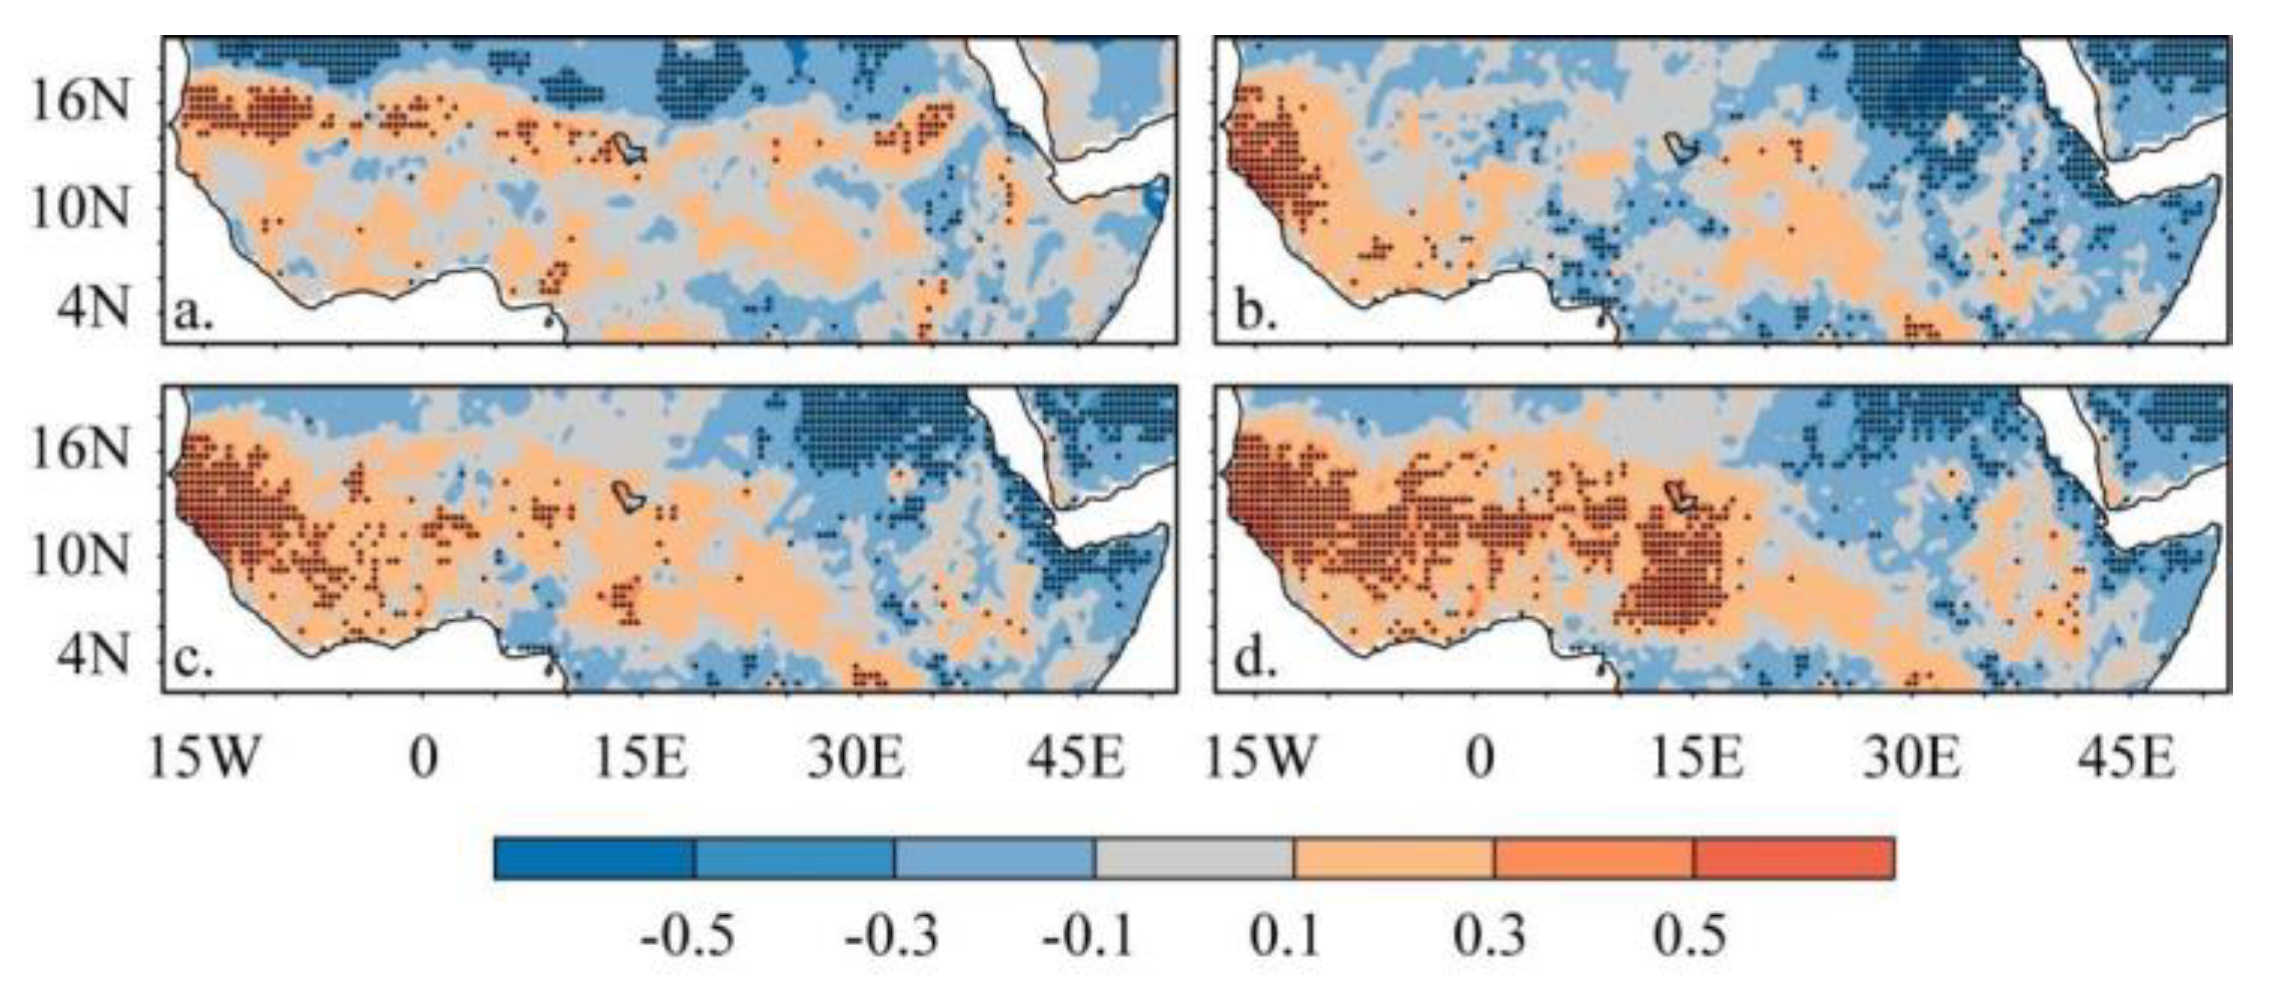
- The annual trend showed that areas with significant greening were consistent with stronger wetter and weaker warming trends and vice versa. Spatially, summer and winter showed seasonal reversals in vegetation greening and browning trends, respectively. The spring and autumn transition seasons showed similar spatial trend patterns;
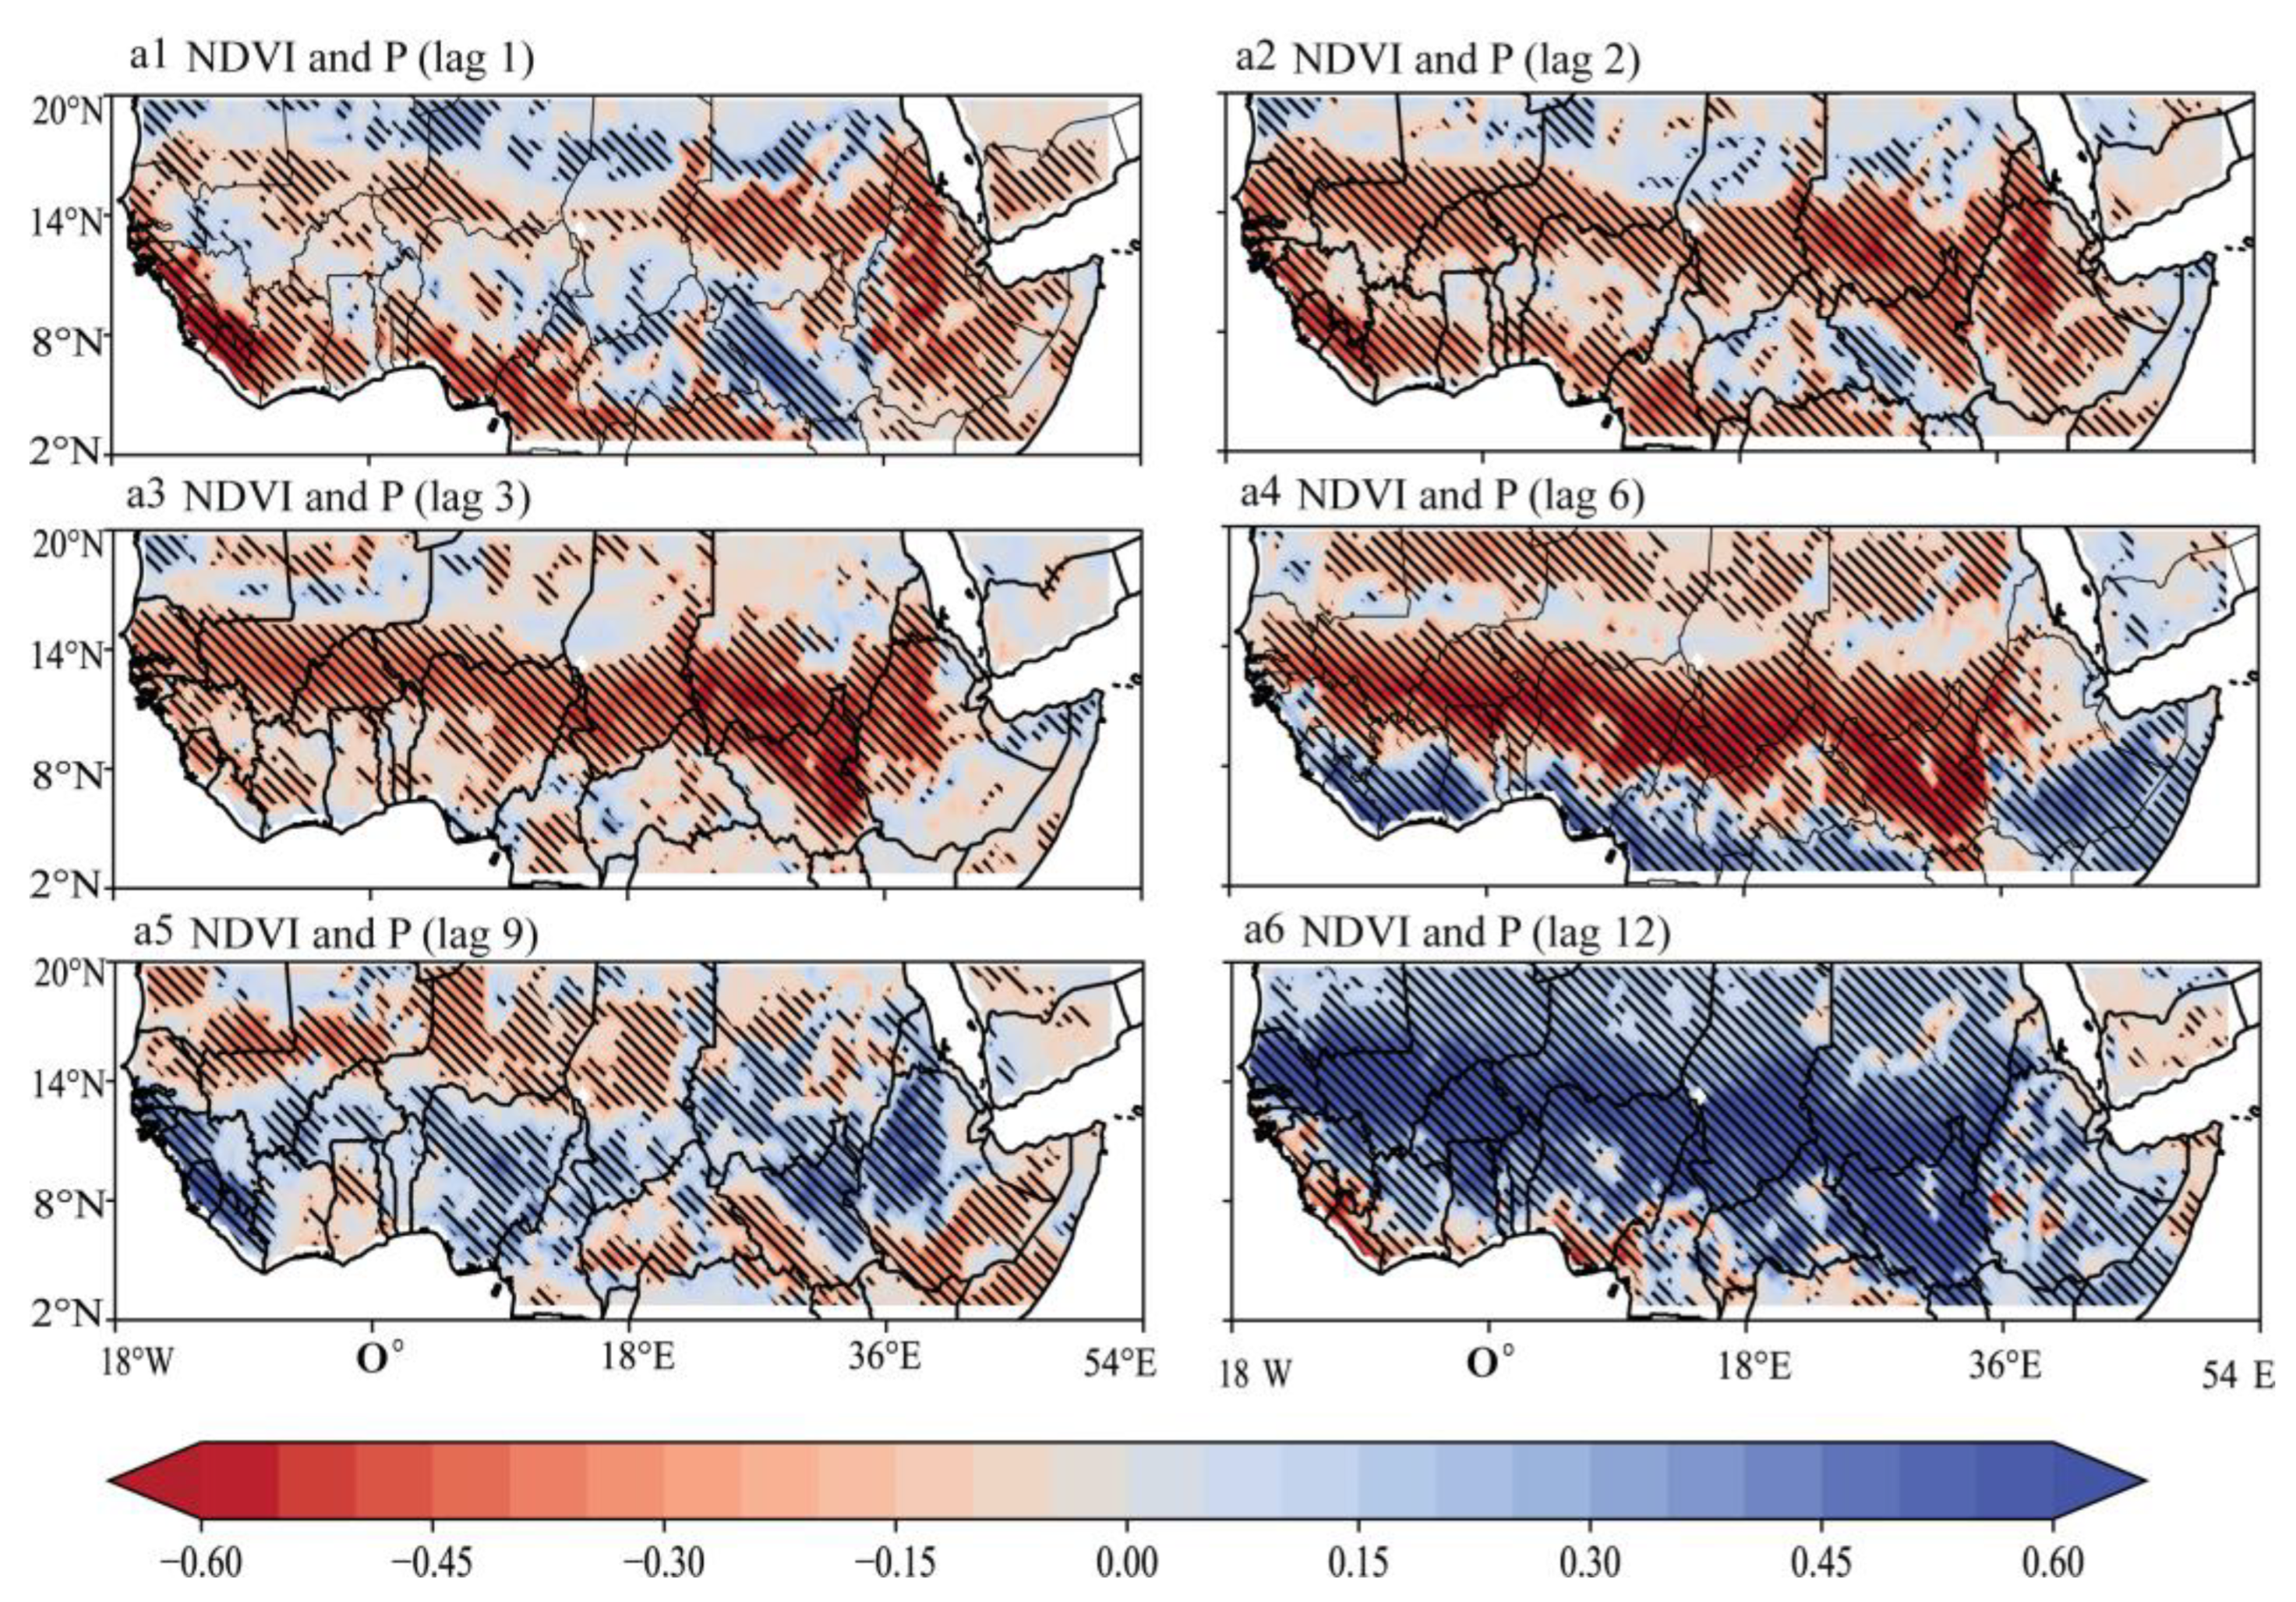
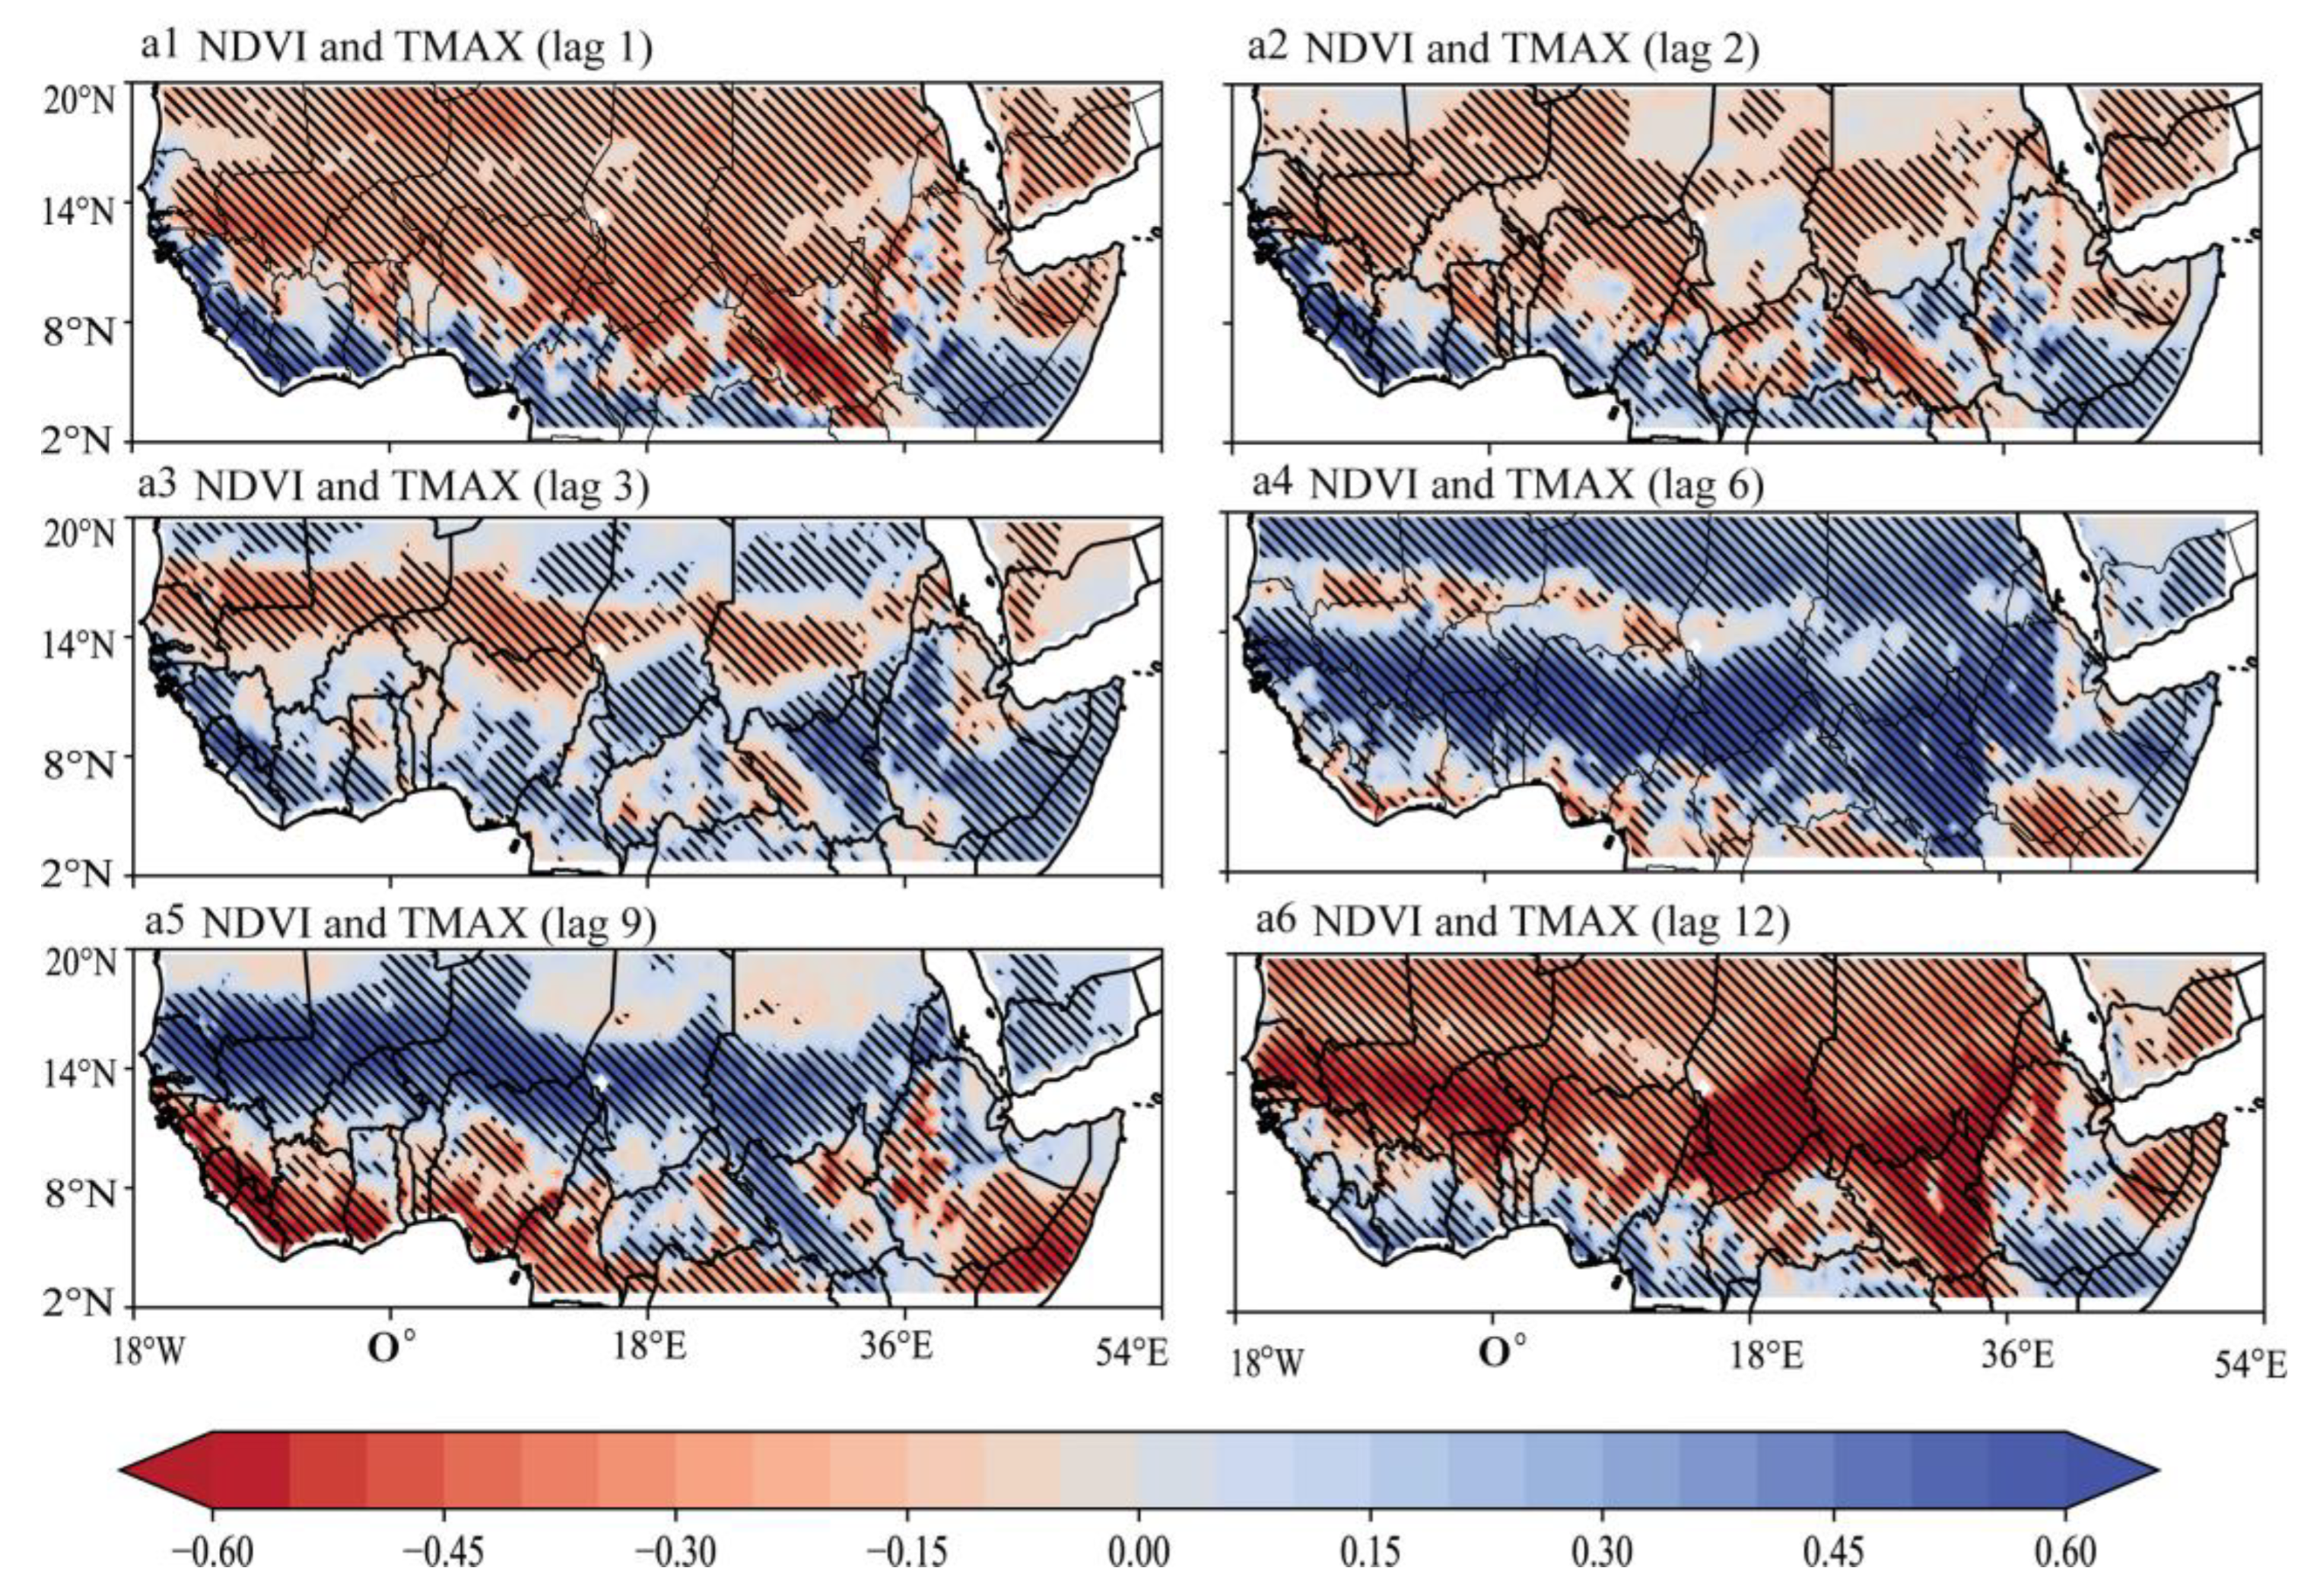
- The relationship between the NDVI and precipitation is significantly positive in the Sahel, western Savanna, and Guinea Coast and negative in the Congo Basin, Sudano, Horn of Africa, Saharan Desert, and Arabian Peninsula. Similarly, the NDVI and temperature trends showed a significant positive relationship with temperature values (TMIN, TMEAN, and TMAX) in most of the Sahel, Savanna, and Guinea Coast areas and a negative relationship with temperature in the Congo Basin, Sudano, Horn of Africa, Saharan Desert, and Arabian Peninsula. Across the study area, partial correlation analysis showed that vegetation growth response to climate variables was significant in precipitation and minimum temperature; however, the response was negative.
Supplementary Materials
Author Contributions
Funding
Data Availability Statement
Acknowledgments
Conflicts of Interest
Appendix A


References
- Zeng, J.; Zhang, Q.; Zhang, Y.; Yue, P.; Yang, Z.S.; Wang, S.; Zhang, L.; Li, H.Y. Enhanced Impact of Vegetation on Evapotranspiration in the Northern Drought-Prone Belt of China. Remote Sens. 2023, 15, 221. [Google Scholar] [CrossRef]
- Liu, X.; Sun, G.; Fu, Z.; Ciais, P.; Feng, X.; Li, J.; Fu, B. Compound droughts slow down the greening of the Earth. Glob. Chang. Biol. 2023, 29, 3072–3084. [Google Scholar] [CrossRef] [PubMed]
- Zhang, J.; Wu, H.Q.; Zhang, Z.; Zhang, L.L.; Luo, Y.C.; Han, J.C.; Tao, F.L. Asian Rice Calendar Dynamics Detected by Remote Sensing and Their Climate Drivers. Remote Sens. 2022, 14, 4189. [Google Scholar] [CrossRef]
- Terasaki Hart, D.E.; Yeo, S.; Almaraz, M.; Beillouin, D.; Cardinael, R.; Garcia, E.; Kay, S.; Lovell, S.T.; Rosenstock, T.S.; Sprenkle-Hyppolite, S.; et al. Priority science can accelerate agroforestry as a natural climate solution. Nat. Clim. Chang. 2023, 13, 1179–1190. [Google Scholar] [CrossRef]
- Thackeray, C.W.; Hall, A.; Norris, J.; Chen, D. Constraining the increased freqency of global precipitation extremes under warming. Nat. Clim. Chang. 2022, 12, 441–448. [Google Scholar] [CrossRef]
- Madakumbura, G.D.; Thackeray, C.W.; Norris, J.; Goldenson, N.; Hall, A. Anthropogenic influence on extreme precipitation over global land areas seen in multiple observational datasets. Nat. Commun. 2021, 12, 3944. [Google Scholar] [CrossRef]
- Qiao, L.; Zuo, Z.; Zhang, R.; Piao, S.; Xiao, D.; Zhang, K. Soil mositure-atmosphere coupling accelerates global warming. Nat. Commun. 2023, 14, 4908. [Google Scholar] [CrossRef]
- Fischer, E.; Sippel, S.; Knutti, R. Increasing probability of record634 shattering climate extremes. Nat. Clim. Chang. 2021, 11, 689–695. [Google Scholar] [CrossRef]
- Intergovernmental Panel on Climate Change. Technical Summary; Cambridge University Press: Cambridge, UK, 2022. [Google Scholar]
- Zhou, L.; Tian, Y.; Myneni, R.B.; Ciais, P.; Saatchi, S.; Liu, Y.Y.; Piao, S.; Chen, H.; vermote, E.F.; Song, C.; et al. Widespread decline of Congo rainforest greeness in the past decade. Nature 2014, 509, 86–90. [Google Scholar] [CrossRef]
- Boulton, C.A.; Lenton, T.M.; Boers, N. Pronounced loss of Amazon rainforest resilence since the early 200s. Nat. Clim. Chang. 2022, 12, 271–278. [Google Scholar] [CrossRef]
- Liang, L.; Wang, Q.; Guan, Q.; Du, Q.; Sun, Y.; Ni, F.; Lv, S.; Shan, Y. Assessing vegetation restoration prospects under different environmental elements in cold and arid mountainous region of China. CATENA 2023, 226, 107055. [Google Scholar] [CrossRef]
- Chen, C.; Park, T.; Wang, X.; Piao, S.; Xu, B.; Chaturvedi, R.K.; Fuchs, R.; Brovkin, V.; Ciais, P.; Fensholt, R.; et al. China and India Lead in greening of the world through land-use management. Nat. Sustain. 2019, 2, 122–129. [Google Scholar] [CrossRef] [PubMed]
- Yu, Y.; Notaro, M.; Wang, F.; Mao, J.; Shi, X.; Wei, Y. Observed positive vegetation-rainfall feedbacks in the Sahel dominated by a mositure recycling mechanism. Nat. Commun. 2017, 8, 1873. [Google Scholar] [CrossRef] [PubMed]
- Brandt, M.; Hiernaux, P.; Rasmussen, K.; Tucker, C.J.; Wigneron, J.; Diouf, A.A.; Herrmann, S.M.; Zhang, W.; Kergoat, L.; Mbow, C.; et al. Changes in rainfall distribution promote woody fiologe production in the Sahel. Commun. Biol. 2019, 2, 133. [Google Scholar] [CrossRef] [PubMed]
- Dardel, C.; Kergoat, L.; Hiernaux, P.; Mougin, E.; Grippa, M.; Tucker, C.J. Re-greening Sahel: 30 years of remote sensing data and field observations (Mali, Niger). Remote Sens. Environ. 2014, 140, 350–364. [Google Scholar] [CrossRef]
- Beck, H.E.; McVicar, T.R.; van Dijk, A.I.; Schellekens, J.; de Jeu, R.A.; Bruijnzeel, L.A. Global evaluation of four AVHRR–NDVI data sets: Intercomparison and assessment against Landsat imagery. Remote Sens. Environ. 2011, 115, 2547–2563. [Google Scholar] [CrossRef]
- Pinzon, J.E.; Pak, E.W.; Tucker, C.J.; Bhatt, U.S.; Frost, G.V.; Macander, M.J. Global Vegetation Greenness (NDVI) from AVHRR GIMMS-3G+, 1981–2022. Available online: https://daac.ornl.gov/VEGETATION/guides/Global_Veg_Greenness_GIMMS_3G.html (accessed on 10 June 2024).
- Tucker, C.J.; Pinzon, J.E.; Brown, M.E.; Slayback, D.A.; Pak, E.W.; Mahoney, R.; Vermote, E.F.; El Saleous, N. An extended AVHRR 8-km NDVI dataset compatible with MODIS and SPOT vegetation NDVI data. Int. J. Remote Sens. 2005, 26, 4485–4498. [Google Scholar] [CrossRef]
- Gessesse, A.A.; Melesse, A.M. Chapter 8—Temporal relationships between time series CHIRPS-rainfall estimation and eMODIS-NDVI satellite images in Amhara Region, Ethiopia. In Extreme Hydrology and Climate Variability; Melesse, A.M., Abtew, W., Senay, G., Eds.; Elsevier: Amsterdam, The Netherlands, 2019; pp. 81–92. [Google Scholar]
- Nicholson, S. On the question of the “recovery” of the rains in the West African Sahel. J. Arid Environ. 2005, 63, 615–641. [Google Scholar] [CrossRef]
- Sultan, B.; Janicot, S.; Drobinski, P. Characterization of the diurnal cycle of the West African Monsoon around the monsoon onset. J. Clim. 2007, 20, 4014–4032. [Google Scholar] [CrossRef]
- Lian, X.; Jeong, S.; Park, C.-E.; Xu, H.; Li, L.Z.X.; Wang, T.; Gentine, P.; Peñuelas, J.; Piao, S. Biophysical impacts of northern vegetation changes on seasonal warming patterns. Nat. Commun. 2022, 13, 3925. [Google Scholar] [CrossRef]
- Myneni, R.B.; Keeling, C.D.; Tucker, C.J.; Asrar, G.; Nemani, R.R. Increased plant growth in the northern high latitudes from 1981 to 1991. Nature 1997, 386, 698–702. [Google Scholar] [CrossRef]
- Ichii, K.; Kawabata, A.; Yamaguchi, Y. Global correlation analysis for NDVI and climatic variables and NDVI trends: 1982–1990. Int. J. Remote Sens. 2002, 23, 3873–3878. [Google Scholar] [CrossRef]
- Brown, M.; Pinzon, J.; Didan, K.; Morisette, J.; Tucker, C. Evaluation of the consistency of long-term NDVI time series derived from AVHRR, SPOT-vegetation, SeaWIFS, MODIS and LandSAT ETM+ sensors. IEEE Trans. Geosci. Remote Sens. 2006, 44, 1787–1793. [Google Scholar] [CrossRef]
- Zhu, Z.; Piao, S.; Myneni, R.B.; Huang, M.; Zeng, Z.; Canadell, J.G.; Ciais, P.; Sitch, S.; Friedlingstein, P.; Arneth, A.; et al. Greening of the Earth and its drivers. Nat. Clim. Chang. 2016, 6, 791–795. [Google Scholar] [CrossRef]
- Berdugo, M.; Delgado-Baquerizo, M.; Soliveres, S.; Hernandez-Clemente, R.; Zhao, Y.; Gaitan, J.J.; Gross, N.; Saiz, H.; Maire, V.; Lehman, A.; et al. Global ecosystem thresholds driven by aridity. Science 2020, 367, 787–790. [Google Scholar] [CrossRef] [PubMed]
- Lamchin, M.; Lee, W.K.; Jeon, S.W.; Wang, S.W.; Lim, C.H.; Song, C.; Sung, M. Long-term trend and correlation between vegetation greenness and climate variables in Asia based on satellite data. Sci. Total Environ. 2018, 618, 1089–1095. [Google Scholar] [CrossRef]
- Peteet, D. Sensitivity and rapidity of vegetational response to abrupt climate change. Proc. Natl. Acad. Sci. USA 2000, 97, 1359–1361. [Google Scholar] [CrossRef] [PubMed]
- Brandt, M.; Mbow, C.; Diouf, A.A.; Verger, A.; Samimi, C.; Fensholt, R. Ground- and satellite-based evidence of the biophysical mechanisms behind the greening Sahel. Glob. Chang. Biol. 2015, 21, 1610–1620. [Google Scholar] [CrossRef]
- Gentine, P.; Massmann, A.; Lintner, B.R.; Hamed Alemohammad, S.; Fu, R.; Green, J.K.; Kennedy, D.; Vilà-Guerau de Arellano, J. Land–atmosphere interactions in the tropics—A review. Hydrol. Earth Syst. Sci. 2019, 23, 4171–4197. [Google Scholar] [CrossRef]
- Ghebrezgabher, M.G.; Yang, T.; Yang, X.; Eyassu Sereke, T. Assessment of NDVI variations in responses to climate change in the Horn of Africa. Egypt. J. Remote Sens. Space Sci. 2020, 23, 249–261. [Google Scholar] [CrossRef]
- Hoscilo, A.; Balzter, H.; Bartholomé, E.; Boschetti, M.; Brivio, P.A.; Brink, A.; Clerici, M.; Pekel, J.F. A conceptual model for assessing rainfall and vegetation trends in sub-Saharan Africa from satellite data. Int. J. Climatol. 2015, 35, 3582–3592. [Google Scholar] [CrossRef]
- Seaquist, J.W.; Hickler, T.; Eklundh, L.; Ardö, J.; Heumann, B.W. Disentangling the effects of climate and people on Sahel vegetation dynamics. Biogeosciences 2009, 6, 469–477. [Google Scholar] [CrossRef]
- Hickler, T.; Eklundh, L.; Seaquist, J.W.; Smith, B.; Ardö, J.; Olsson, L.; Sykes, M.T.; Sjöström, M. Precipitation controls Sahel greening trend. Geophys. Res. Lett. 2005, 32, L21415. [Google Scholar] [CrossRef]
- Ogou, F.K.; Igbawua, T. Investigation of changes in vegetation cover associated with changes in its hydro-climatic drivers in recent decades over North Sub-Saharan Africa. Theor. Appl. Climatol. 2022, 149, 1135–1152. [Google Scholar] [CrossRef]
- Dirmeyer, P. The terrestrial segment of soil moisture-climate coupling. Geophys. Res. Lett. 2011, 38, L16702. [Google Scholar] [CrossRef]
- Koster, R.D.; Dirmeyer, P.A.; Guo, Z.; Bonan, G.; Chan, E.; Cox, P.; Gordon, C.T.; Kanae, S.; Kowalczyk, E.; Lawrence, D.; et al. The Second Phase of the Global Land–Atmosphere Coupling Experiment: Soil Moisture Contributions to Subseasonal Forecast Skill. J. Hydrometeorol. 2011, 12, 805–822. [Google Scholar] [CrossRef]
- Mahecha, M.; Bastos, A.; Bohn, F.; Eisenhauer, N.; Feilhauer, H.; Hickler, T.; Kalesse-Los, H.; Migliavacca, M.; Otto, F.; Peng, J.; et al. Biodiversity and climate extremes: Known interactions and research gaps. Earth Future 2023, 12, e2023EF003963. [Google Scholar] [CrossRef]
- Cox, D.T.C.; Maclean, I.M.D.; Gardner, A.S.; Gaston, K.J. Global variation in diurnal asymmetry in temperature, cloud cover, specific humidity and precipitation and its association with leaf area index. Glob. Chang. Biol. 2020, 26, 7099–7111. [Google Scholar] [CrossRef] [PubMed]
- Funk, C.; Hoell, A.; Shukla, S.; Husak, G.; Michaelsen, J. The East African Monsoon System: Seasonal Climatologies and Recent Variations. In The Monsoons and Climate Change: Observations and Modeling; de Carvalho, L.M.V., Jones, C., Eds.; Springer International Publishing: Cham, Switzerland, 2016; pp. 163–185. [Google Scholar]
- Sultan, B.; Janicot, S. Abrupt shift of the ITCZ over West Africa and intra-seasonal variability. Geophys. Res. Lett. 2000, 27, 3353–3356. [Google Scholar] [CrossRef]
- Harris, I.; Jones, P.; Osborn, T.; Lister, D. Updated high–resolution grids of monthly climatic observations–the CRU TS3.10 dataset. Int. J. Climatol. 2014, 34, 623–642. [Google Scholar] [CrossRef]
- Nooni, I.K.; Ogou, F.K.; Hagan, D.F.; Saidou Chaibou, A.A.; Prempeh, N.A.; Nakoty, F.M.; Jin, Z.; Lu, J. The Relationship between Changes in Hydro-Climate Factors and Maize Crop Production in the Equatorial African Region from 1980 to 2021. Atmosphere 2024, 15, 542. [Google Scholar] [CrossRef]
- Hansen, M.C.; Defries, R.S.; Townshend, J.R.G.; Sohlberg, R. Global land cover classification at 1 km spatial resolution using a classification tree approach. Int. J. Remote Sens. 2000, 21, 1331–1364. [Google Scholar] [CrossRef]
- de Jong, R.; de Bruin, S.; de Wit, A.; Schaepman, M.E.; Dent, D.L. Analysis of monotonic greening and browning trends from global NDVI time-series. Remote Sens. Environ. 2011, 115, 692–702. [Google Scholar] [CrossRef]
- Holben, B.N. Characteristics of maximum-value composite images from temporal AVHRR data. Int. J. Remote Sens. 1986, 7, 1417–1434. [Google Scholar] [CrossRef]
- Basak, D.; Bose, A.; Roy, S.; Chowdhury, I.R. Chapter 17—Understanding the forest cover dynamics and its health status using GIS-based analytical hierarchy process: A study from Alipurduar district, West Bengal, India. In Water, Land, and Forest Susceptibility and Sustainability; Chatterjee, U., Pradhan, B., Kumar, S., Saha, S., Zakwan, M., Fath, B.D., Fiscus, D., Eds.; Elsevier: Amsterdam, The Netherlands, 2023; Volume 1, pp. 475–508. [Google Scholar]
- Zeng, Y.; Hao, D.; Huete, A.; Dechant, B.; Berry, J.; Chen, J.M.; Joiner, J.; Frankenberg, C.; Bond-Lamberty, B.; Ryu, Y.; et al. Optical vegetation indices for monitoring terrestrial ecosystems globally. Nat. Rev. Earth Environ. 2022, 3, 477–493. [Google Scholar] [CrossRef]
- Mitchell, T.D.; Jones, P.D. An improved method of constructing a database of monthly climate observations and associated high-resolution grids. Int. J. Climatol. 2005, 25, 693–712. [Google Scholar] [CrossRef]
- New, M.; Hulme, M.; Jones, P.D. Representing twentieth century spaceetime climate variability. Part 2: Development of 1901e96 monthly grids of terrestrial surface climate. J. Clim. 2000, 13, 2217–2238. [Google Scholar] [CrossRef]
- Mann, H.B. Non-parametric tests against trend. Econometrica 1945, 13, 245–259. [Google Scholar] [CrossRef]
- Kendall, M. Rank Correlation Measures; Charles Griffin: London, UK, 1975; Volume 202. [Google Scholar]
- Sen, P.K. Estimates of the Regression Coefficient Based on Kendall’s Tau. J. Am. Stat. Assoc. 1968, 63, 1379–1389. [Google Scholar] [CrossRef]
- Pettitt, A.N. A non-parametric approach to the change-point problem. J. R. Stat. Soc. 1979, 28, 126–135. [Google Scholar] [CrossRef]
- Verstraeten, G.; Poesen, J.; Demaree, G.; Salles, C. Long-term (105 years) variability in rain erosivity as derived from 10-min rainfall depth data for Ukkel (Brussels, Belgium): Implications for assessing soil erosion rates. J. Geophys. Res. 2006, 111, D22109. [Google Scholar] [CrossRef]
- Adeyeri, O.E.; Ishola, K.A. Variability and Trends of Actual Evapotranspiration over West Africa: The Role of Environmental Drivers. Agric. For. Meteorol. 2021, 308–309, 108574. [Google Scholar] [CrossRef]
- Nooni, I.K.; Wang, G.; Hagan, D.F.T.; Lu, J.; Ullah, W.; Li, S. Evapotranspiration and its Components in the Nile River Basin Based on Long-Term Satellite Assimilation Product. Water 2019, 11, 1400. [Google Scholar] [CrossRef]
- Akimoto, F.; Matsunami, A.; Kamata, Y.; Kodama, I.; Kitagawa, K.; Arai, N.; Higuchi, T.; Itoh, A.; Haraguchi, H. Cross-Correlation Analysis of Atmospheric Trace Concentrations of N2O, CH4 and CO2 Determined by Continuous Gas-Chromatographic Monitoring. Energy 2005, 30, 299–311. [Google Scholar] [CrossRef]
- Biasutti, M. Rainfall trends in the African Sahel: Characteristics, processes, and causes. WIREs Clim. Chang. 2019, 10, e591. [Google Scholar] [CrossRef]
- Zhao, L.; Dai, A.; Dong, B. Changes in global vegetation activity and its driving factors during 1982–2013. Agric. For. Meteorol. 2018, 249, 198–209. [Google Scholar] [CrossRef]
- Wang, X.; Piao, S.; Ciais, P.; Li, J.; Friedlingstein, P.; Koven, C.; Chen, A. Spring temperature change and its implication in the change of vegetation growth in North America from 1982 to 2006. Proc. Natl. Acad. Sci. USA 2011, 108, 1240–1245. [Google Scholar] [CrossRef] [PubMed]
- Piao, S.L.; Wang, X.H.; Ciais, P.; Zhu, B.; Wang, T.; Liu, J. Changes in satellite-derived vegetation growth trend in temperate and boreal Eurasia from 1982 to 2006. Glob. Chang. Biol. 2011, 17, 3228–3239. [Google Scholar] [CrossRef]
- Meehl, G.A.; Stocker, T.F.; Collins, W.D.; Gaye, A.J.; Gregory, J.M.; Kitoh, A.; Knutti, R.; Murphy, J.M.; Noda, A.; Raper, S.C.B.; et al. Global Climate Projection; Cambridge University Press: Cambridge, UK; New York, NY, USA, 2007. [Google Scholar]
- Hatfield, J.L.; Prueger, J.H. Temperature extremes: Effect on plant growth and development. Weather Clim. Extrem. 2015, 10, 4–10. [Google Scholar] [CrossRef]
- Alfaro, E.T.; Gershunov, D.; Cayan, D. Prediction of summer maximum and minimum temperature over the central and western United States: The roles of soil moisture and sea surface temperature. J. Clim. 2006, 19, 1407–1421. [Google Scholar] [CrossRef]
- Verbesselt, J.; Hyndman, R.; Zeileis, A.; Culvenor, D. Phenological change detection while accounting for abrupt and gradual trends in satellite image time series. Remote Sens. Environ. 2010, 114, 2970–2980. [Google Scholar] [CrossRef]
- Fensholt, R.; Rasmussen, K. Analysis of trends in the Sahelian ‘rain-use efficiency’ using GIMMS NDVI, RFE and GPCP rainfall data. Remote Sens. Environ. 2011, 115, 438–451. [Google Scholar] [CrossRef]
- de Jong, R.; Verbesselt, J.; Schaepman, M.E.; de Bruin, S. Trend changes in global greening and browning: Contribution of short-term trends to longer-term change. Glob. Chang. Biol. 2012, 18, 642–655. [Google Scholar] [CrossRef]
- De Jong, R.; Verbesselt, J.; Zeileis, A.; Schaepman, M.E. Shifts in Global Vegetation Activity Trends. Remote Sens. 2013, 5, 1117–1133. [Google Scholar] [CrossRef]
- Zhao, M.; Running, S.W. Drought-induced reduction in global terrestrial net primary production from 2000 through 2009. Science 2010, 329, 940–943. [Google Scholar] [CrossRef] [PubMed]
- Mukherjee, S.; Mishra, A.K.; Zscheischler, J.; Entekhabi, D. Interaction between dry and hot extremes at a global scale using a cascade modeling framework. Nat. Commun. 2023, 14, 277. [Google Scholar] [CrossRef]
- Adepoju, K.; Adelabu, S.; Fashae, O. Vegetation Response to Recent Trends in Climate and Landuse Dynamics in a Typical Humid and Dry Tropical Region under Global Change. Adv. Meteorol. 2019, 2019, 4946127. [Google Scholar] [CrossRef]
- Piao, S.; Wang, X.; Park, T.; Chen, C.; Lian, X.; He, Y.; Bjerke, J.W.; Chen, A.; Ciais, P.; Tømmervik, H.; et al. Characteristics, drivers and feedbacks of global greening. Nat. Rev. Earth Environ. 2020, 1, 14–27. [Google Scholar] [CrossRef]
- Zaitchik, B.F.; Rodell, M.; Biasutti, M.; Seneviratne, S.I. Wetting and drying trends under climate change. Nat. Water 2023, 1, 502–513. [Google Scholar] [CrossRef]
- Xiong, J.; Guo, S.; Abhishek; Chen, J.; Yin, J. Global evaluation of the “dry gets drier, and wet gets wetter” paradigm from a terrestrial water storage change perspective. Hydrol. Earth Syst. Sci. 2022, 26, 6457–6476. [Google Scholar] [CrossRef]
- Zhou, L.; Tucker, C.J.; Kaufmann, R.K.; Slayback, D.; Shabanov, N.V.; Myneni, R.B. Variations in northern vegetation activity inferred from satellite data of vegetation index during 1981 to 1999. J. Geophys. Res. Atmos. 2001, 106, 20069–20083. [Google Scholar] [CrossRef]
- Seneviratne, S.I.; Lüthi, D.; Litschi, M.; Schär, C. Land–atmosphere coupling and climate change in Europe. Nature 2006, 443, 205–209. [Google Scholar] [CrossRef] [PubMed]
- Vicente-Serrano, S.M.; Gouveia, C.; Camarero, J.J. Response of vegetation to drought time-scales across global land biomes. Proc. Natl. Acad. Sci. USA 2012, 110, 52–57. [Google Scholar] [CrossRef] [PubMed]
- Anderson, L.O.; Malhi, Y.; Aragão, L.E.O.C.; Ladle, R.; Arai, E.; Barbier, N.; Phillips, O.L. Remote sensing detection of droughts in Amazonian forest canopies. New Phytol. 2010, 187, 733–750. [Google Scholar] [CrossRef] [PubMed]

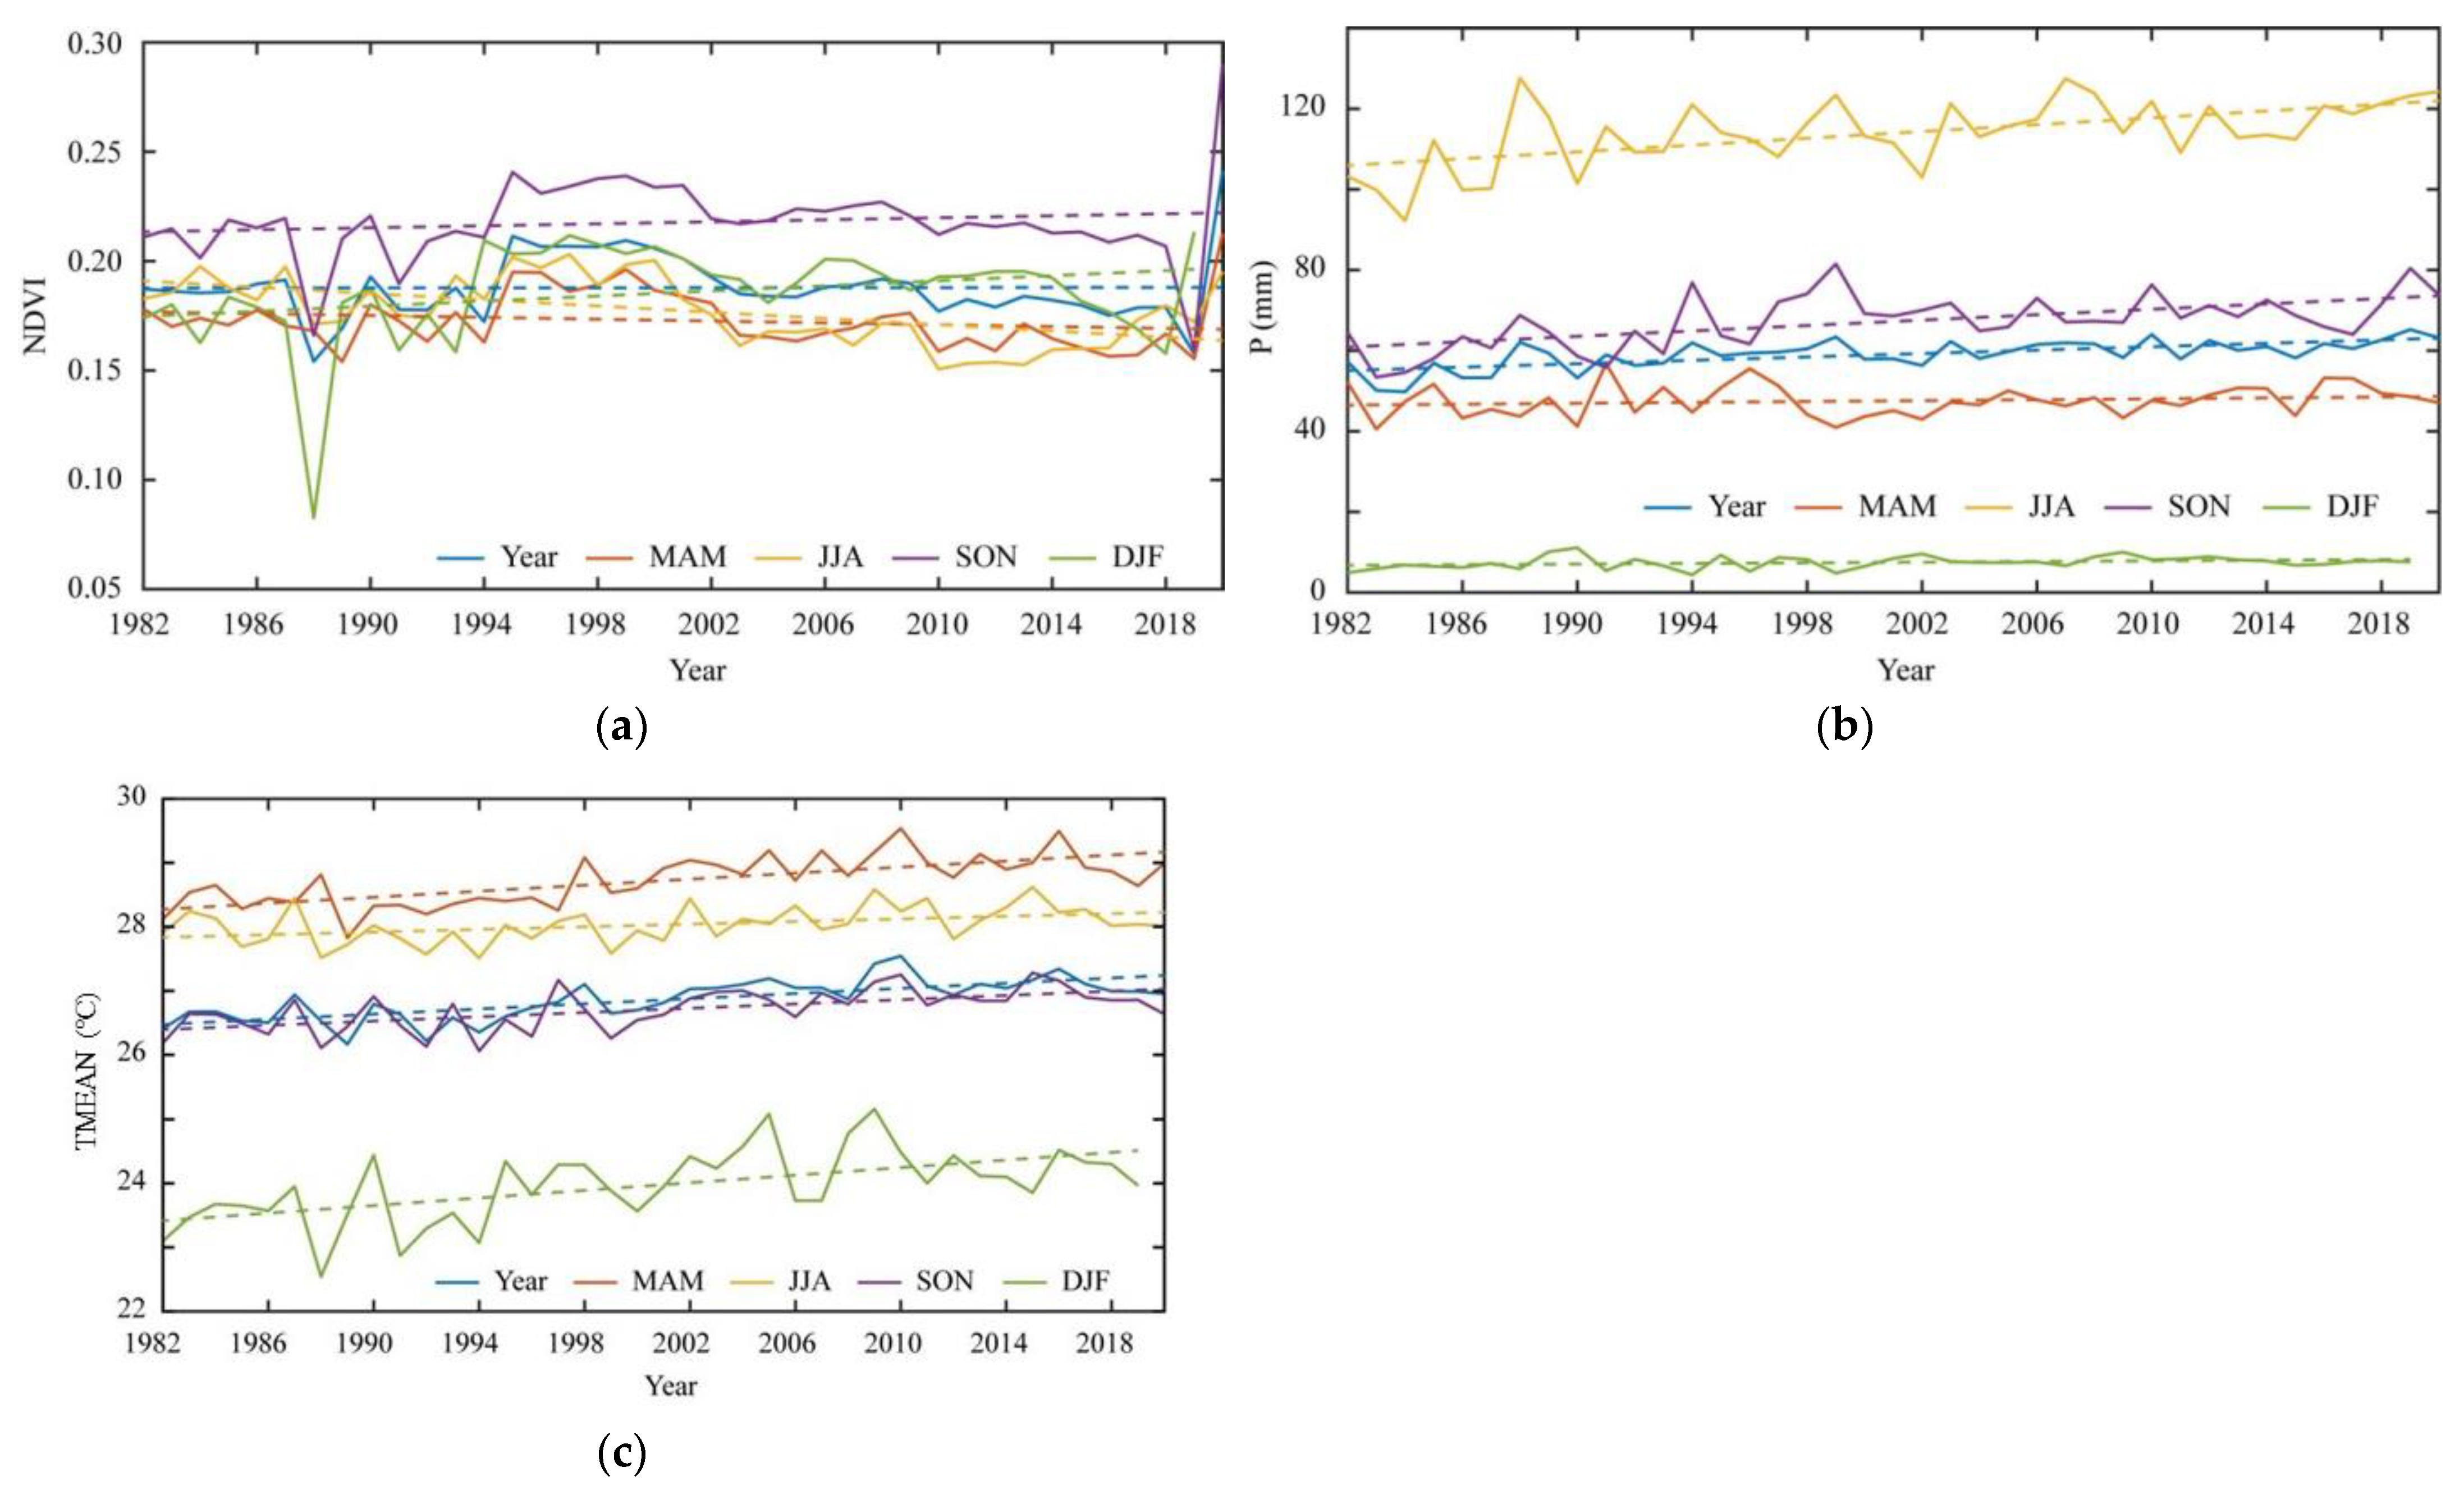

| Variable | Time Scales | ||||
|---|---|---|---|---|---|
| Annual | MAM | JJA | SON | DJF | |
| NDVI | m = −2.3 × 10⁻⁴, c = 0.19, (α = 0.097) | m = −3.9 × 10⁻⁴, c = 0.18, (α = 0.259) | m = −7.5 × 10⁻⁴, c = 0.19, (α = 0.001) | m = 1.4 × 10⁻⁵, c = 0.22, (α = 0.478) | m = 3.3 × 10⁻⁴, c = 0.18, (α = 0.076) |
| P | m = 0.20, c = 55.44, (α = 0.000) | m = 0.09, c = 45.00, (α = 0.032) | m = 0.45, c = 104.66, (α = 0.000) | m = 0.34, c = 58.91, (α = 0.000) | m = 0.04, c = 6.50, (α = 0.000) |
| TMEAN | m = 0.02, c = 26.46, (α = 0.000) | m = 0.02, c = 28.18, (α = 0.000) | m = 0.01, c = 27.79, (α = 0.008) | m = 0.02, c = 26.32, (α = 0.000) | m = 0.03, c = 23.42, (α = 0.001) |
| TMAX | m = 0.02, c = 33.14, (α = 0.000) | m = 0.03, c = 35.17, (α = 0.000) | m = 0.01, c = 33.40, (α = 0.043) | m = 0.01, c = 32.89, (α = 0.001) | m = 0.03, c = 31.08, (α = 0.001) |
| TMIN | m = 0.02, c = 19.90 (α = 0.000) | m = 0.02, c = 21.36, (α = 0.000) | m = 0.01, c = 22.27, (α = 0.000) | m = 0.02, c = 19.95, (α = 0.000) | m = 0.02, c = 15.82. (α = 0.001) |
| Variable | Years of Abrupt Changes | ||||
|---|---|---|---|---|---|
| Annual | MAM | JJA | SON | DJF | |
| NDVI | 2009 | 2002 | 2002 | 1994 | 1993 |
| P | 2002 | 2011 | 2002 | 1996 | 1988 |
| TMEAN | 2001 | 1997 | 2001 | 2001 | 1994 |
| TMIN | 2001 | 2000 | 2001 | 2001 | 2001 |
| TMAX | 2000 | 1997 | 2001 | 2000 | 1994 |
| Trends before Abrupt Changes | |||||
| Variable | Annual | MAM | JJA | SON | DJF |
| NDVI | 0.005 | 0011 * | 0.0005 | −0.0006 | −0.0018 |
| P | 0.3645 * | −0.0339 | 0.7566 * | 0.5653 | 0.4220 |
| TMEAN | 0.0114 | −0.0021 | −0.0060 | 0.0053 | −0.0009 |
| TMIN | 0.0065 | 0.0058 | −0.0063 | 0.0055 | 0.0193 |
| TMAX | 0.0151 | 0.0026 | −0.0057 | 0.0029 | −0.0033 |
| Trends after Abrupt Changes | |||||
| Variable | Annual | MAM | JJA | SON | DJF |
| NDVI | −0.0013 | 0.0006 | 0.0006 | 0.0009 * | 0.0015 * |
| P | 0.4830 * | 1.6933 | 0.9599 * | 0.5658 * | 0.0835 * |
| TMEAN | 0.0114 | 0.0033 | −0.0060 | 0.0055 | 0.0394 * |
| TMIN | 0.0065 | −0.0066 | −0.0063 | 0.0053 | 0.0193 |
| TMAX | 0.0186 | 0.0044 | −0.0057 | 0.0079 | 0.0476 * |
| Time Lag | Lag-Corr (NDVI, TMIN) | Lag-Corr (NDVI, TMEAN) | Lag-Corr (NDVI, TMAX) | Lag-Corr (NDVI, P) |
|---|---|---|---|---|
| 1 | −0.27 | −0.27 | −0.27 | −0.21 |
| 2 | −0.43 | −0.42 | −0.34 | −0.33 |
| 3 | −0.43 | −0.39 | −0.27 | −0.35 |
| 6 | −0.006 | +0.11 | 0.28 | −0.23 |
| 9 | −0.32 | +0.29 | +0.20 | +0.27 |
| 12 | +0.14 | +0.06 | −0.07 | +0.29 |
| Climate Factors | NDVI |
|---|---|
| P | −0.19 * |
| TMIN | −0.45 * |
| TMAX | +0.31 |
Disclaimer/Publisher’s Note: The statements, opinions and data contained in all publications are solely those of the individual author(s) and contributor(s) and not of MDPI and/or the editor(s). MDPI and/or the editor(s) disclaim responsibility for any injury to people or property resulting from any ideas, methods, instructions or products referred to in the content. |
© 2024 by the authors. Licensee MDPI, Basel, Switzerland. This article is an open access article distributed under the terms and conditions of the Creative Commons Attribution (CC BY) license (https://creativecommons.org/licenses/by/4.0/).
Share and Cite
Nooni, I.K.; Ogou, F.K.; Prempeh, N.A.; Saidou Chaibou, A.A.; Hagan, D.F.T.; Jin, Z.; Lu, J. Analysis of Long-Term Vegetation Trends and Their Climatic Driving Factors in Equatorial Africa. Forests 2024, 15, 1129. https://doi.org/10.3390/f15071129
Nooni IK, Ogou FK, Prempeh NA, Saidou Chaibou AA, Hagan DFT, Jin Z, Lu J. Analysis of Long-Term Vegetation Trends and Their Climatic Driving Factors in Equatorial Africa. Forests. 2024; 15(7):1129. https://doi.org/10.3390/f15071129
Chicago/Turabian StyleNooni, Isaac Kwesi, Faustin Katchele Ogou, Nana Agyemang Prempeh, Abdoul Aziz Saidou Chaibou, Daniel Fiifi Tawiah Hagan, Zhongfang Jin, and Jiao Lu. 2024. "Analysis of Long-Term Vegetation Trends and Their Climatic Driving Factors in Equatorial Africa" Forests 15, no. 7: 1129. https://doi.org/10.3390/f15071129
APA StyleNooni, I. K., Ogou, F. K., Prempeh, N. A., Saidou Chaibou, A. A., Hagan, D. F. T., Jin, Z., & Lu, J. (2024). Analysis of Long-Term Vegetation Trends and Their Climatic Driving Factors in Equatorial Africa. Forests, 15(7), 1129. https://doi.org/10.3390/f15071129


