Article

Physiological Response to Low-Temperature Stress and Cold Resistance Evaluation of Ziziphus jujuba var. spinosa Clones from Different Provenances

by
Biao Li
1,
Yuncheng Zhang
2,
Ying Kang
1,
Yijin Wang
1,
Ruilin Liu
1,
Qingbai Liu
1,* and
Shengjun Dong
1,*
1
College of Forestry, Shenyang Agricultural University, Shenyang 110866, China
2
Forestry and Grassland Bureau of Karaqin Left Wing Mongolian Autonomous County, Kazuo, Chaoyang 122300, China
*
Authors to whom correspondence should be addressed.
Forests 2024, 15(7), 1130; https://doi.org/10.3390/f15071130
Submission received: 9 June 2024 / Revised: 26 June 2024 / Accepted: 27 June 2024 / Published: 28 June 2024
(This article belongs to the Special Issue Abiotic and Biotic Stress Responses in Trees Species)

Abstract

:
To investigate the low-temperature adaptability of different provenances of Ziziphus jujuba var. spinosa, we used 21 clones from seven provenances as experimental materials and observed the changes in physiological and biochemical indicators and the characteristics of anatomical structures under low-temperature stress. A comprehensive evaluation of their cold resistance was conducted using the membership function method. As the temperature decreased, the relative electrical conductivity (REC) of clone 89 became stable and had the lowest LT50 value (−44.04 °C). The cold-resistant Z. jujuba var. spinosa had a higher bound water/free water (BW/FW) ratio and antioxidant enzyme activity and accumulated large quantities of osmotic regulatory substances. Higher xylem, phloem, and xylem–cortex ratios and greater conduit density enhanced the cold resistance of Z. jujuba var. spinosa. The membership function values of clones 89, 90, 91, 604, and 612 were greater than 0.6, indicating that they could be evaluated as resources with the potential for low-temperature resistance. The cold resistance rankings for the different provenances were as follows: Kazuo, Liaoning > Jiaxian, Shaanxi > Fuxing, Heibei > Changqing, Shandong > Neiqiu, Heibei > Yanchuan, Shaanxi > Xiaxian, Shanxi. These results provide a scientific basis for the rapid and accurate identification of cold resistance in Z. jujuba var. spinosa resources and the breeding and cultivation of new cold-resistant varieties of this subspecies.

1. Introduction

Ziziphus jujuba var. spinosa (Bunge) Peng, Li, and Li is a small deciduous shrub of the family Rhamnaceae, also known as wild thorn and mountain jujube [1]. It is primarily distributed in Shanxi, Hebei, Henan, Shaanxi, and other regions of China. Numerous studies have shown that Z. jujuba var. spinosa has high economic and medicinal value. The fruit flesh is enriched with nutrients such as vitamin C, with benefits such as lipid-lowering abilities and gastrointestinal protection. Ziziphus jujuba var. spinosa kernels tonify the liver, relax the heart, and calm the mind. Ziziphus jujuba var. spinosa leaves have various health benefits such as anti-inflammatory properties and the promotion of bile acid synthesis [2]. Additionally, Z. jujuba var. spinosa has strong resistance to adverse environmental conditions and plays an important role as a wind break, in reducing sand displacement, and in soil and water conservation.
Low temperature is an abiotic stressor that limits the geographical distribution, growth, and development of plants [3]. Plants improve their cold tolerance by modifying their morphological and physiological adaptations to regulate metabolic processes [4]. Sustained low temperatures can damage plant cell membranes and increase plasma membrane permeability, resulting in increased relative electrical conductivity (REC) [5]. The half-lethal temperature (LT50), calculated using a logistic equation fitted with the REC, accurately represents the cold resistance of plants. This method has been widely used to assess cold resistance in various plant species [6,7,8]. Research on the different varieties of jujube trees using the electrical conductivity method revealed that their LT50 is between −19.53 °C and −40 °C [9,10]. Furthermore, low-temperature stress can easily induce an imbalance in reactive oxygen species (ROS), causing membrane lipid peroxidation reactions and resulting in the formation of large quantities of malondialdehyde (MDA) in branches [11]. Therefore, the maintenance of a dynamic ROS balance is crucial for plant survival under adverse conditions. Plants have antioxidant systems that include both enzymatic and non-enzymatic chemicals that protect them from oxidative harm [12]. Among these, superoxide dismutase (SOD) and peroxidase (POD) are important protective enzymes that inhibit ROS free radicals [13]. Apples [14] and pomegranates [15] clear ROS by increasing SOD and POD activities under low-temperature stress. Osmotic regulation is another mechanism by which plants resist cold damage and includes the utilization of soluble sugars (SSs), soluble proteins (SPs), and proline (Pro). Increased levels of osmotic regulators may effectively reduce plant water loss, balance the cellular osmotic pressure, and alleviate low-temperature damage [16,17,18,19]. Cold resistance is not only related to physiological and biochemical activities within plants but is also influenced by differences in plant anatomical structures. Therefore, anatomical structure becomes a key indicator for evaluating plant cold resistance [20]. Living cortical cells in branched structures are prone to freezing and can damage or even rupture the cell membrane at low temperatures [21]. The medullary cell gap is obvious and permeable, weakening the cold air barrier effects [22] and reducing plant resistance to low temperatures. The well-developed phloem and large number of vessels and vessel densities of a plant give it improved metabolic ability and water transportation efficiency, which enhances its adaptability to adverse conditions [23,24]. Plant xylem mainly consists of dead cell vessel molecules and hard, thick cell walls, which can help protect the cell membrane from damage at low temperatures [25].
Research on the cold resistance of Z. jujuba var. spinosa has mostly focused on physiological and biochemical characteristics under low-temperature stress [26,27]. However, there is a lack of studies that have examined a combination of physiological and biochemical indexes along with the morpho-anatomical structure of Z. jujuba var. spinosa under low-temperature stress. Therefore, we used 1-year-old branches of 21 Z. jujuba var. spinosa from seven different provenances as experimental materials and comprehensively evaluated the differences in their physiological and biochemical indices and anatomical structures under low-temperature stress. We conducted correlation and cluster analyses and used the membership function method to explore the physiological responses of different Z. jujuba var. spinosa plants at low temperatures and their mechanisms of cold resistance. This is important for the early and rapid selection and identification of superior cold-resistant parents of Z. jujuba var. spinosa, preservation, and the utilization of cold-resistant germplasm resources of Z. jujuba var. spinosa. The findings provide a material basis for the selection and industrial development of Z. jujuba var. spinosa.

2. Materials and Methods

2.1. Experimental Materials

A total of 21 Z. jujuba var. spinosa plants from different provenances were planted at the Shenyang Agricultural University Z. jujuba var. spinosa national forest germplasm resource repository (41°02′59″ N, 119°51′26″ E). The plants were from the provenances of Kazuo, Liaoning (LK); Xiaxian, Shanxi (SX); Jiaxian, Shaanxi (SJ); Yanchuan, Shaanxi (SY); Fuxing, Heibei (HF); Neiqiu, Heibei (HN); and Changqing, Shandong (SC). Spikes of superior Z. jujuba var. spinosa trees were gathered from different provenances in December 2021 and grafted onto 2-year-old Z. jujuba var. spinosa rootstocks in the field by split grafting in May 2022 (Figure 1). The grafted plants were then planted in a north–south direction with a spacing of 2.0 × 3.0 m. The plants grew well, without pests or diseases. The specific conditions are listed in Table 1.

2.2. Experimental Treatment

In November 2022, sample trees with robust and uniform growth for each clone were selected and 1-year-old branches were collected. After washing with distilled water, the cut ends were sealed with wax, and the samples were returned to the laboratory. The samples were subjected to low-temperature stress in an MDF-U5412N high–low-temperature test chamber (PHCBI, Sakata, Japan). A total of 6 low-temperature gradients were set at 4 °C, −20 °C, −25 °C, −30 °C, −35 °C, and −40 °C, with 4 °C as the control. The temperature control accuracy was ±1 °C and, after reaching the set temperature, it was maintained for 12 h. The rate of decrease in freezing temperature and the rate of increase in thawing temperature were both 4 °C·h−1. Subsequently, the samples were placed in a 4 °C refrigerator for thawing for 12 h. After completion of the low-temperature stress exposure, the branches were cut into approximately 0.5~1 cm thick sections (avoiding bud positions). A portion of these segments was used to determine REC and water content. Another portion was rapidly frozen in liquid nitrogen and stored in a −80 °C ultra-low-temperature freezer for the measurement of physiological and biochemical indicators. Each stress temperature and measurement parameter was replicated three times.

2.3. Experimental Methods

2.3.1. Measurements of Physiological Indices

For the measurement of relative electrical conductivity [28], branches, post-stress, were cut into approximately 0.5 cm pieces. The cut pieces (0.5 g) were weighed and placed in centrifuge tubes containing 20 mL of deionized water. The samples were then soaked for 30 min. After a predetermined time period, the conductivity of the solution was measured at room temperature (R1). Subsequently, the samples were boiled in a water bath for 20 min and cooled to room temperature to measure their final conductivities (R2). The REC was calculated as follows:
REC = (R1/R2) × 100%
The REC was fitted into the logistic regression equation, y = 100/(1 + ae−bt), where y represents the REC and a and b are the function parameters [29].
The total water content of the branches was determined using the drying method [30]. Free water content was measured using an Abbe refractometer [30]. MDA content was determined using the thiobarbituric acid method [31]. The soluble sugar and starch contents were quantified using the anthrone colorimetric method [32]. The soluble protein content was determined by measuring Coomassie Brilliant Blue G-250 [33]. Proline content was determined using the ninhydrin colorimetric method [34]. The SOD activity was determined using the nitro blue tetrazolium chloride method [33]. The POD was determined using the guaiacol method [33].

2.3.2. Observation of Anatomical Structure

Randomly selected branches from each clone were washed under 4 °C conditions. A 1 cm stem segment from the middle part of each branch was placed in a fixative (FAA: formaldehyde, alcohol, and acetic acid). Sections were obtained using a hand microtome with a thickness of 6–8 μm and stained using the safranine/solid green method. Cross-sections of each slice were observed using a Stemi 2000-C stereo microscope (ZEISS, Oberkochen, Germany), photographed with an AxioCam ICc 5 microscope camera (ZEISS, Oberkochen, Germany), and analyzed for anatomical tissue structure using Zen software. For every image, a 200 × 200 pixel square was constructed, and the vessel density was determined by counting the number of vessels in the frame. Three slices were selected for each clone, with four fields of view observed per slice, resulting in 12 replicates.
Ratio of xylem (%) = (Thickness of xylem/Radius of branch) × 100
Ratio of cortex (%) = (Thickness of cortex/Radius of branch) × 100
Xylem–cortex ratio = (Thickness of xylem/Thickness of cortex)

2.4. Statistical Analyses

We used SPSS 26.0 (IBM, Armonk, NY, USA) and Microsoft Excel 2016 (Microsoft, Redmond, Washington, DC, USA) for data analysis and chart creation, with data presented as the mean ± standard deviation. A comprehensive evaluation of the data was conducted using membership function, cluster analysis, and correlation analysis. Origin 9.0 (EA, Northampton, MA, USA) was used for visualization. A comprehensive analysis and evaluation of the cold resistance of Z. jujuba var. spinosa were conducted using the membership function [35] and the following equations:
U(Xij) = (Xij − Xjmin)/(Xjmax − Xjmin)
U(Xij) = 1 − (Xij − Xjmin)/(Xjmax − Xjmin)
where i represents a specific clone, j represents a specific index, Xij denotes the index j testing the value of clone i, Xjmin denotes the index j minimum value for all clones, Xjmax denotes the index j maximum value for all clones, Uij denotes the value of clone i, and index j is associated with cold-hardiness.

3. Results

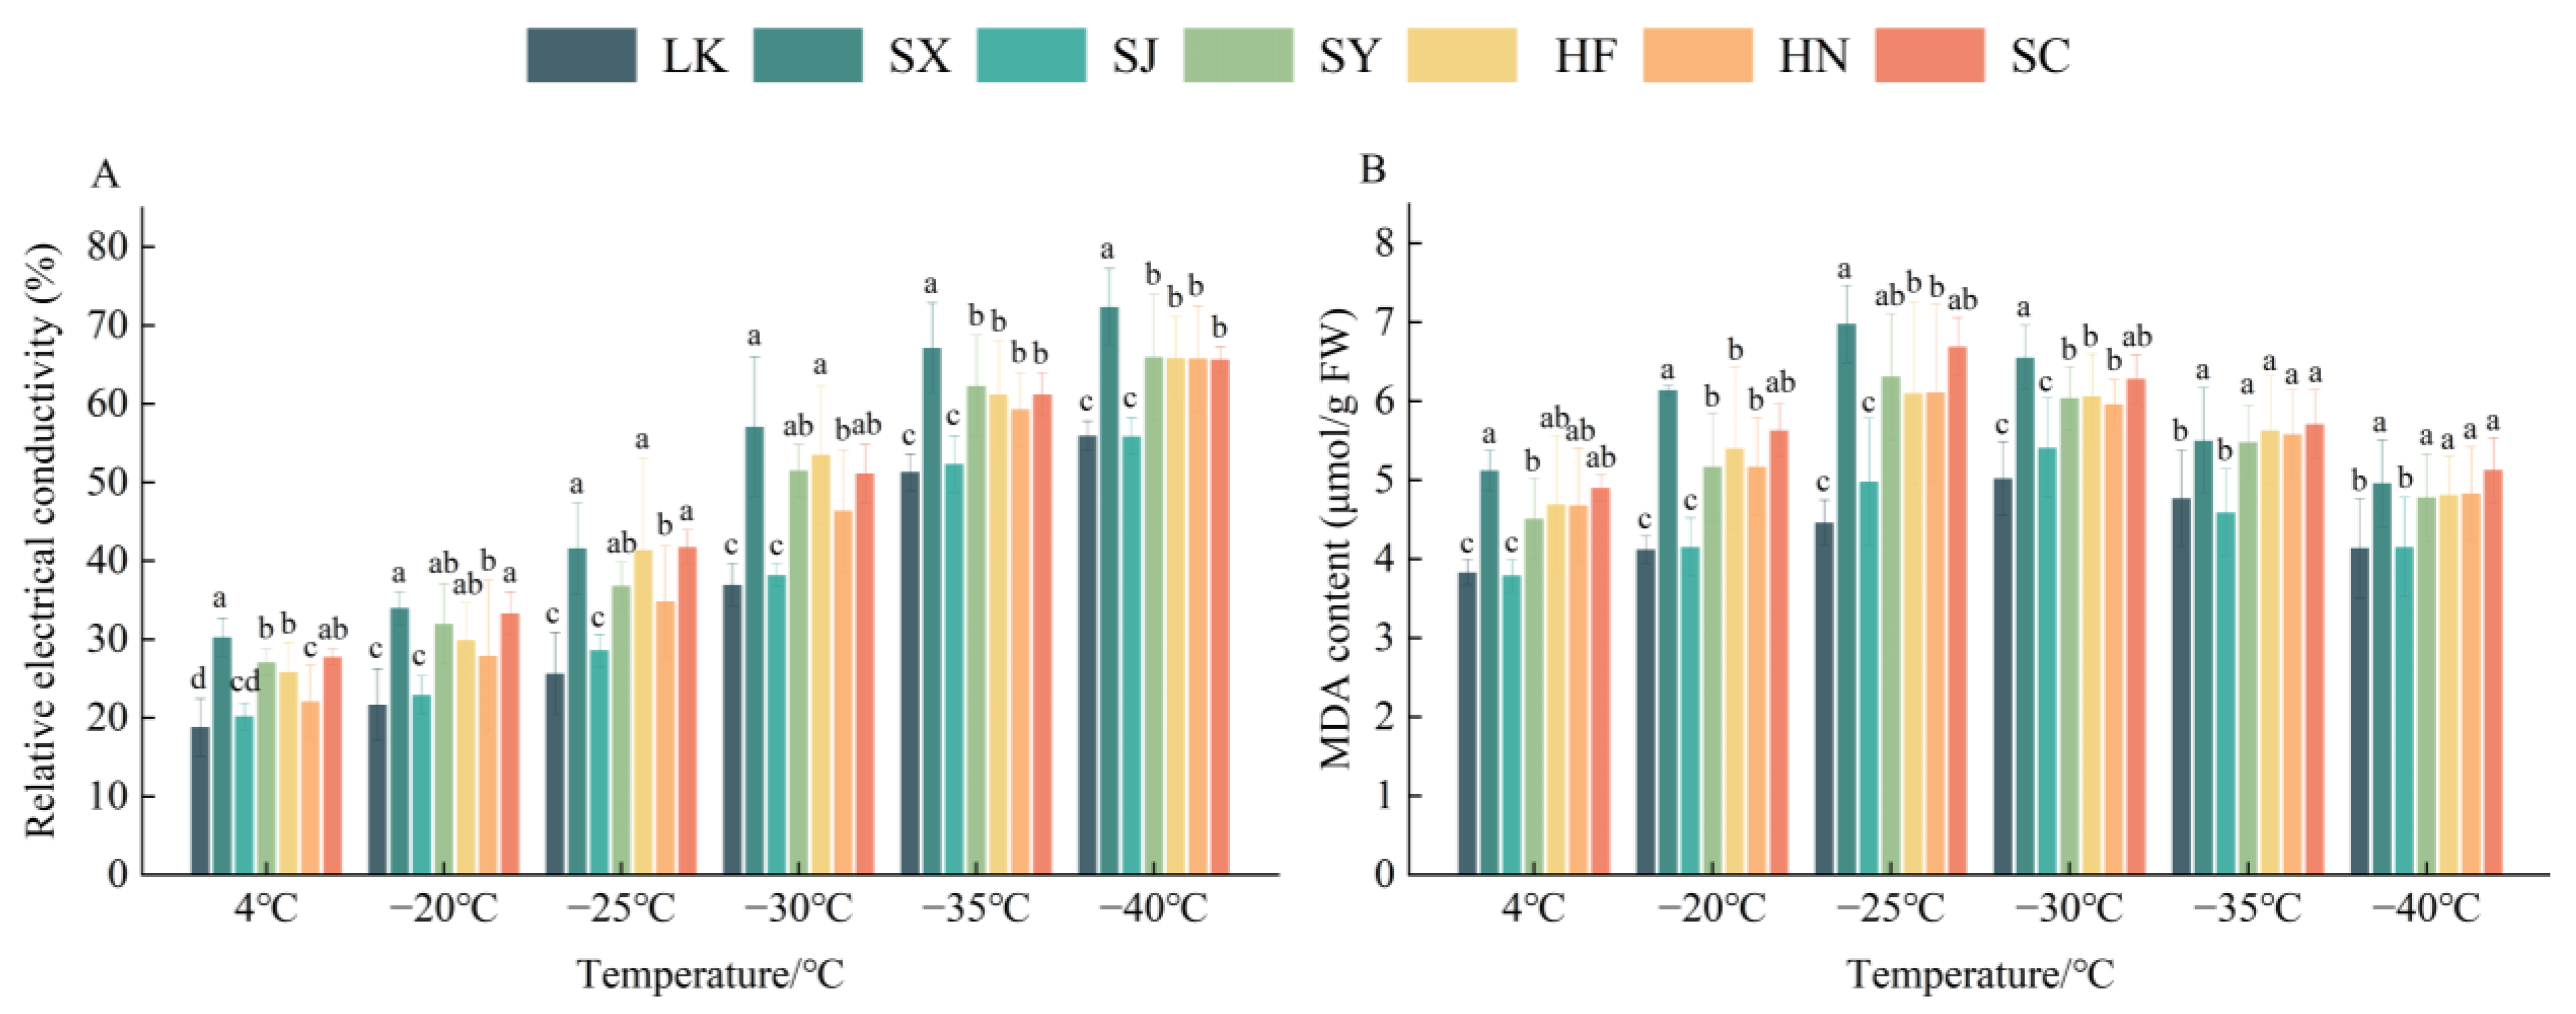
3.1. Response of Branch Membrane Stability to Low-Temperature Stress

3.1.1. Relative Electrical Conductivity

With decreasing temperature, the REC of Z. jujuba var. spinosa showed a gradually increasing trend (Supplementary Data Table S1), and the stress temperature and REC followed an “S”-shaped type curve. The REC of all clones reached a maximum at −40 °C and was significantly higher than at the other treatment temperatures. Clones 530 and 645 exhibited significantly higher REC values compared to the other clones. Throughout the low-temperature stress process, clone 89 had the lowest mean REC value (30.98%), whereas clone 530 had the highest (55.50%). The REC of Z. jujuba var. spinosa branches from different provenances (Figure 2A) all peaked at −40 °C, with LK and SJ being significantly lower than other provenances. Throughout the entire low-temperature stress period, the provenances from LK had the lowest average REC value (35.05%).
The REC was used to fit the logistic equation to calculate the inflection point half-lethal temperature (LT50), which was negatively correlated with plant cold resistance. This suggested that a lower LT50 indicated stronger cold resistance in plants. As shown in Table 2, the R2 ranged from 0.65 to 0.89 and the fitting results were considered reliable. These results indicated that the LT50 values of Z. jujuba var. spinosa clone cultivars ranged from −18.92 °C to −44.04 °C. Clone 89 exhibited the lowest LT50, while clone 530 had the highest, resulting in a temperature difference of −25.12 °C between the two clones. The LT50 of Z. jujuba var. spinosa from different provenances ranged from −23.83 °C to −41.60 °C, with LK having the lowest LT50. The cold resistance ranking of Z. jujuba var. spinosa branches from the different provenances was as follows: LK > SJ > HN > SY > HF > SC > SX. The LT50 values of plants from different provenances decreased with increasing latitude, whereas their cold resistance increased with increasing latitude. This indicated that materials from higher-latitude regions have more stable cold resistance [36,37].

3.1.2. Malondialdehyde Content

The MDA content of Z. jujuba var. spinosa clones increased and then decreased with decreasing temperature (Supplementary Data Table S2). Among them, the MDA content of branches of clone 89 reached their peak at −35 °C, and was significantly higher than at other stress temperatures, except −30 °C. The MDA content of eight clones, including clones 90, 91, and 604, peaked at −30 °C, and the rest of the clones peaked at −25 °C stress. The lowest mean value of MDA content in the branches of clone 604 was 3.87 μmol/g during the treatment range from 4 °C to −40 °C. As shown in Figure 2B, during the 4 °C to −25 °C treatment stages, the MDA content of branches from the different provenances rapidly increased under low-temperature influence. The branches from five provenances reached their peak MDA content at −25 °C, whereas those of LK and SJ peaked at −30 °C, and were significantly different (p < 0.05) from those of other provenances throughout the whole stress process.

3.2. Response of Branch Water Content to Low-Temperature Stress

3.2.1. Total Water Content

As the stress temperature decreased, the total water content (Supplementary Data Table S3) of Z. jujuba var. spinosa clones exhibited a decreasing trend. At 4 °C, the total water content in branches of clones 89, 90, 604, 614, and 753 was significantly higher (p < 0.05) than that of other clones. By −40 °C, the total water content in branches of all clones decreased to the lowest, showing significant differences compared to the control (4 °C). Among them, clone 709 exhibited the smallest decrease (8.33%) in branch total water content. The mean total water content of the branches of clones 89, 90, 604, 614, and 753 was >25.00% throughout the stress treatment. The total water content of Z. jujuba var. spinosa clones from different provenances (Figure 3A) gradually declined with decreasing temperature, reaching its lowest point at −40 °C. Except at 4 °C, branches from LK, SJ, and HN showed significantly higher total water contents than those from other provenances during the remaining low-temperature stress conditions.

3.2.2. Bound Water/Free Water Ratio

The BW/FW ratio of Z. jujuba var. spinosa clones exhibited an increasing trend with decreasing temperature, reaching the maximum value at −40 °C (Supplementary Data Table S4). All of these values were significantly higher than those for the other stress temperatures, among which, clone 89 increased the most, reaching 15.73. Throughout the stress process, the average BW/FW ratio of clone 89 was the highest (5.45), followed by clone 90 (4.74), with clone 530 having the lowest ratio (0.84). As illustrated in Figure 3B, the BW/FW ratio in branches of each provenance increased rapidly between the −20 °C and −30 °C treatments, with the highest increase in those from LK. By −40 °C, the BW/FW ratio in branches of Z. jujuba var. spinosa of various provenances reached a maximum, with the LK and SJ provenances having significantly higher ratios than the other provenances.

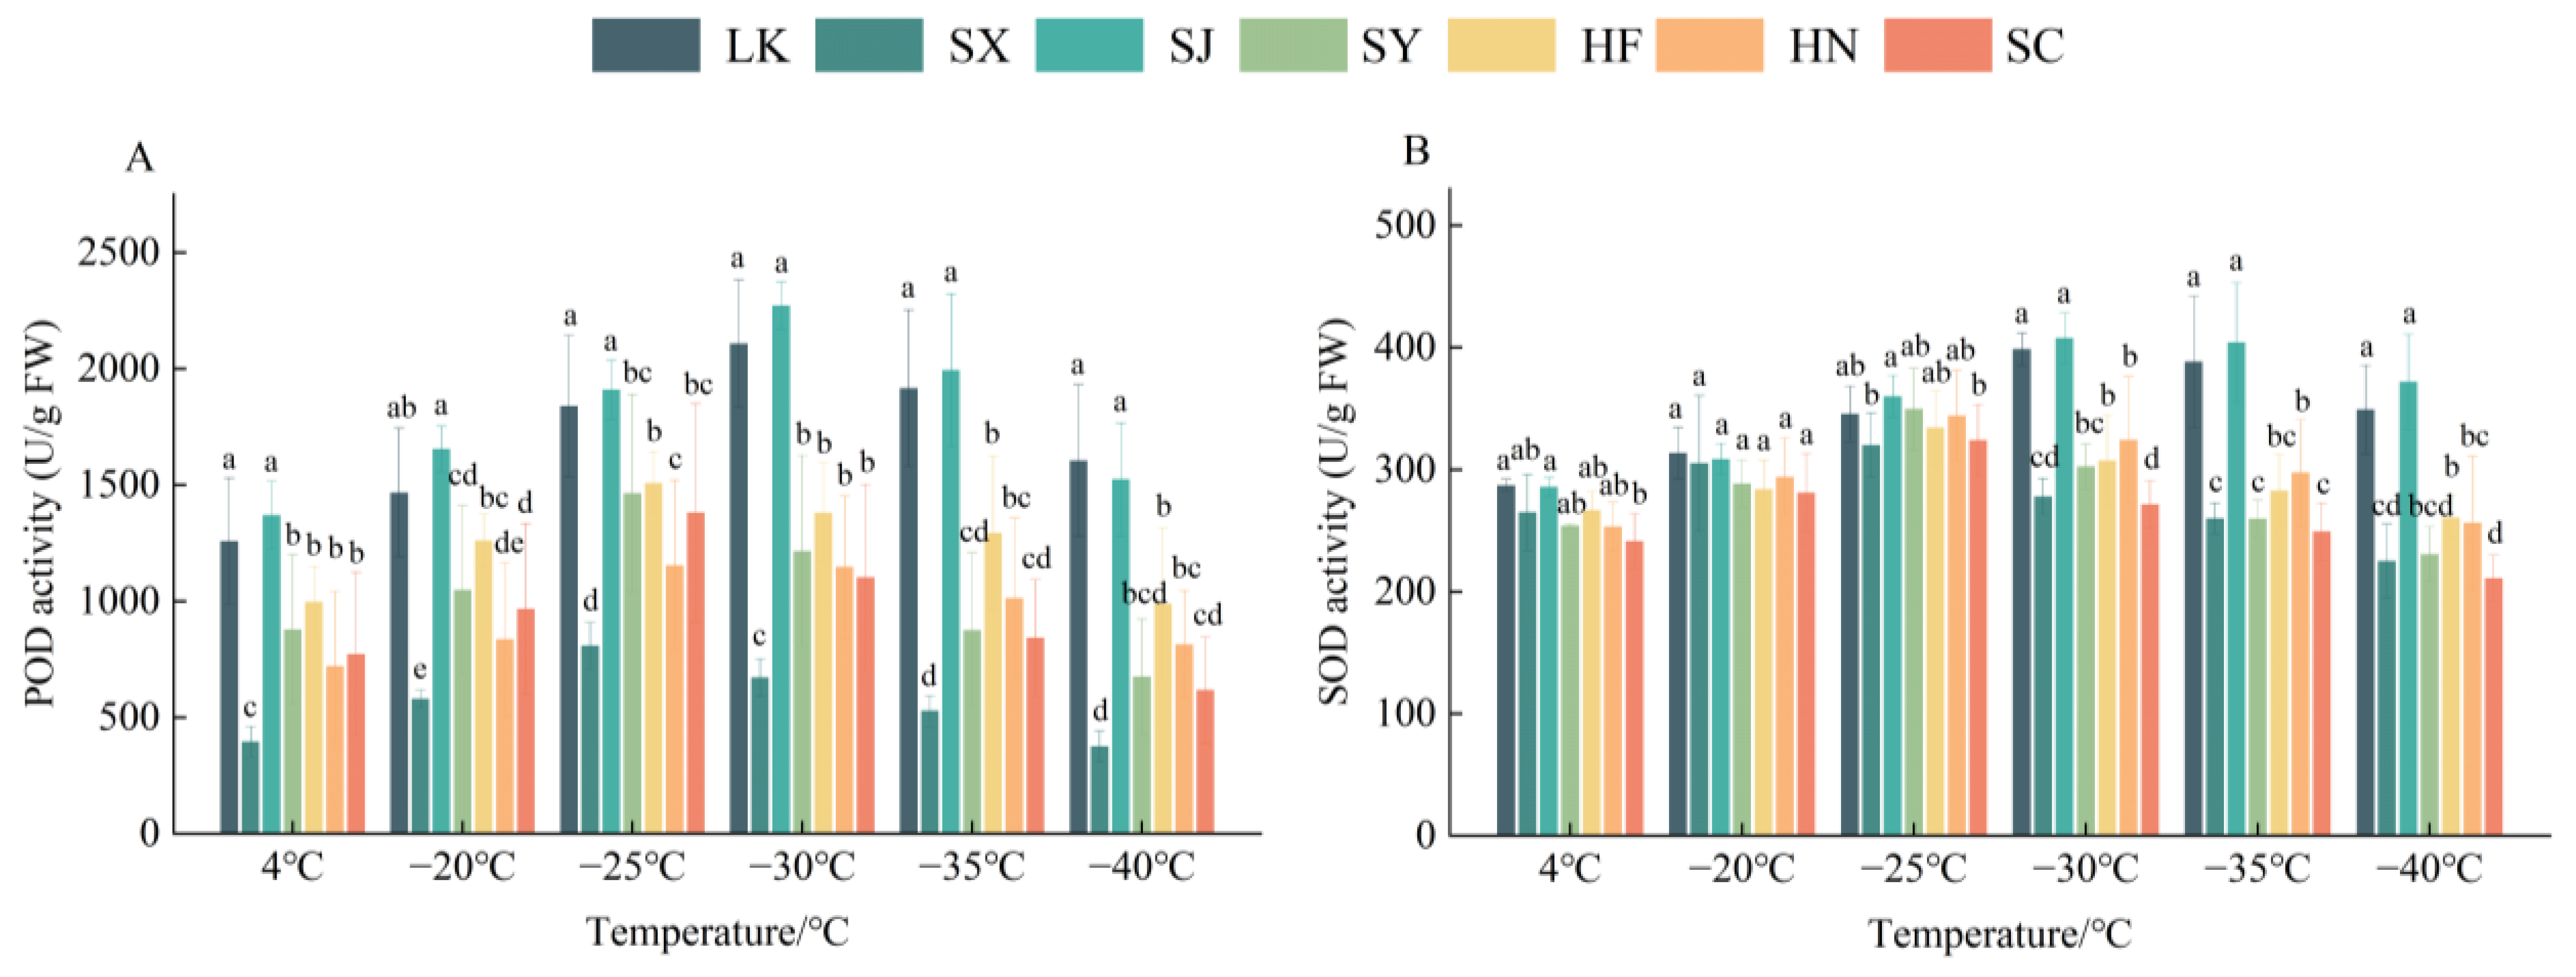
3.3. Response of Antioxidant Enzyme Activities of Branches to Low-Temperature Stress

3.3.1. POD Activity

POD activity in Z. jujuba var. spinosa clones showed a single-peak curve that first increased and then decreased with decreasing temperature (Supplementary Data Table S5). At −25 °C, the POD activities of 13 clones of Z. jujuba var. spinosa rapidly increased, reached a peak, and were significantly higher (p < 0.05) than at the other stress temperatures. At −30 °C, the POD activities of clones 90, 91, 604, 612, 709, and 753 reached a peak, and clone 90 had the largest increase (82.63%). The POD activities of only two clones, 89 and 614, reached a peak at −35 °C and were significantly higher than those of the other clones. During stress from 4 °C to −40 °C, the POD activity of the branches of clone 89 was significantly greater than that of the other clones and had the highest mean value of 2173.46 U/g, followed by clone 614 (1939.57 U/g). As shown in Figure 4A, the POD activities of the branches of the five provenances peaked at −25 °C, except for LK and SJ, in which the POD activity of SX increased further but was still significantly lower than that of the other provenances. The POD activities of LK and SJ peaked at −30 °C. Except for −20 °C, the POD activity of LK and SJ during the temperature stress process was significantly higher than for other provenances.

3.3.2. SOD Activity

With a decrease in the stress temperature, the SOD activity of Z. jujuba var. spinosa clones generally showed a pattern of first rising and then falling, and different clones appeared to peak at different temperatures (Supplementary Data Table S6). The SOD activity of clone 89’s branches peaked at −35 °C and was significantly greater (p < 0.05) than that of the other clones, except for clone 614. It increased by 56.89% compared to the control temperature of 4 °C. Throughout the low-temperature stress period, clone 614 had the highest mean SOD activity (374.38 U/g), followed by clone 89 (369.78 U/g). As shown in Figure 4B, the SOD activities of all five provenances except LK and SJ peaked at −25 °C, with SX and SC being significantly lower than the SJ provenance, but not significantly different from the other provenances. The SOD activities of the branches from LK and SJ also peaked at −30 °C, and the SOD activity of SJ increased the most (42.60%) during the whole stress process.

3.4. Response of Osmotic Regulatory Substances of Branches to Low-Temperature Stress

3.4.1. Soluble Protein Content

As the stress temperature decreased, the SP content of Z. jujuba var. spinosa clones initially increased and then decreased (Supplementary Data Table S7). At −20 °C, the SP content of clone 530’s branches increased rapidly and reached the peak value, which was significantly higher (p < 0.05) than that at other stress temperatures. The SP content of clones 89, 604, and 612 reached a peak value at −35 °C, which was significantly higher than that of the other clones. Clone 612 showed the greatest increase of 57.06%, followed by clone 89 (51.62%), during the entire stress process. The SP content of Z. jujuba var. spinosa branches from various provenances increased rapidly at −25 °C, with SC having the largest increase (Figure 5A). The SP content of Z. jujuba var. spinosa branches from the LK and SJ provenances peaked at −30 °C and −35 °C, respectively, and was significantly higher than other provenances during the −30 °C ~ −40 °C treatment stage. Under low-temperature stress, the average SP content of Z. jujuba var. spinosa branches from SJ was the highest, followed by those from LK.

3.4.2. Soluble Sugar Content

As the stress temperature decreased, the SS content of the branches of Z. jujuba var. spinosa clones first showed an increasing trend and then a decreasing trend (Supplementary Data Table S8). Clones 89, 91, and 612 reached a peak SS content of the branches at −35 °C and exhibited a significant difference from the other clones, of which clone 612 had the greatest increase (47.02%). Clones 90, 604, 614, and 753 also peaked at −30 °C and, except for clone 753, showed a significant difference from the other clones (p < 0.05). Throughout the low-temperature stress treatment, the average SS contents of six clones (89, 90, 91, 604, 612, and 614) exceeded 60.00 mg/g. Clone 530 had the lowest average value of 44.19 mg/g. The SS content of Z. jujuba var. spinosa branches from the LK and SJ provenances peaked at −35 °C and −30 °C, respectively. The SS content of the remaining five provenances peaked at −25 °C (Figure 5B). During the whole low-temperature stress process, except for −20 °C and −25 °C, the SS content of branches of the LK and SJ provenances was significantly higher than the other provenances, among which, the average SS content of LK was the highest (64.65 mg/g).

3.4.3. Proline Content

During low-temperature stress, Pro content in Z. jujuba var. spinosa clones first increased and then decreased (Supplementary Data Table S9). Clones 89 and 612 reached a peak Pro content at −35 °C, significantly higher (p < 0.05) than at other treatment temperatures, with increases of 45.54% and 47.57%, respectively. During the whole stress process, the Pro contents of clones 89, 90, and 612 were maintained at a generally high level, with their average values reaching 740.71 μg/g, 747.37 μg/g, and 768.39 μg/g, respectively. Clone 530 had the lowest average value (299.48 μg/g). As shown in Figure 5C, except for LK and SJ, the Pro content of Z. jujuba var. spinosa branches of the other five provenances peaked at −25 °C, with SX being significantly lower than that of the other provenances. The provenances of LK and SJ also peaked at −30 °C, and their Pro content was significantly higher than that of the other provenances during the stress process.

3.4.4. Starch Content

The starch content of Z. jujuba var. spinosa clones under low-temperature stress (Supplementary Data Table S10) varied from 8.88 mg/g to 25.57 mg/g, with an overall decreasing and then increasing trend. The starch content of clones 530, 531, and 643 decreased to the lowest levels at −25 °C, which was 33.97%, 30.19%, and 24.96% lower than that of the control (4 °C), respectively. The starch content of clones 89, 91, 614, 750, and 753 decreased to the lowest at −35 °C stress. During the low-temperature treatment from 4 °C to −40 °C, clone 90 had the highest average starch content (20.41 mg/g), followed by clone 89 (19.93 mg/g). The starch content of Z. jujuba var. spinosa clones from different provenances showed a decreasing trend, which increased with decreasing temperatures (Figure 5D). The starch content of Z. jujuba var. spinosa branches from different provenances decreased to the lowest levels at −30 °C, among which, branches from SX, HN, and SC had significantly lower contents (p < 0.05) than branches from the other four provenances. The starch content of branches from LK and SJ was significantly higher than that of branches from the other provenances throughout the low-temperature stress period.

3.5. Branch Anatomical Structure

The anatomical structures of branches of each Z. jujuba var. spinosa clone investigated were pith, xylem, phloem, cortex, pericarp, and epidermis, from inside to outside. Based on Figure 6 and Supplementary Data Table S11, except for clone 90, the thickness of the phloem and vessel densities of clone 89 were significantly larger (p < 0.05) than those of the other clones. The xylem thickness of clone 90 was significantly larger than that of the other clones, with the difference ranging from 37.51 μm to 652.22 μm. Clone 530 had the largest pith radius and cortex thickness, and, except for clone 862, its periderm thickness was significantly greater than that of the other clones, measuring 117.73 μm. The branch radii and vessel diameters of clone 862 were significantly larger than those of the other clones, measuring 2297.75 μm and 54.02 μm, respectively. The xylem thickness, phloem thickness, and conduit density of the branches of LK were significantly greater than those of branches from the other provenances. The branch radius and vessel diameter of plants from SC were significantly larger than those from the other provenances.
Regarding the anatomical structure proportions of branches from each clone (Supplementary Data Table S12), the pith and cortex ratios of clone 531 were significantly higher than those of the other clones, reaching 42.34% and 6.26%, respectively. The xylem and phloem ratios of clones 89, 90, 91, 612, and 614 were significantly higher than those of other clones. Clone 91 had the largest xylem ratio of 57.60%, and its xylem–cortex ratio was significantly higher than that of the other clones. Clone 89 had the highest phloem ratio, whereas clone 531 had significantly lower xylem and xylem–cortex ratios. The xylem, phloem, and xylem–cortex ratios of the branches from LK were significantly higher than those from other provenances. The pith and cortex ratios of the branches from SX were significantly higher than those of the branches from the other provenances, at 38.93% and 5.83%, respectively.

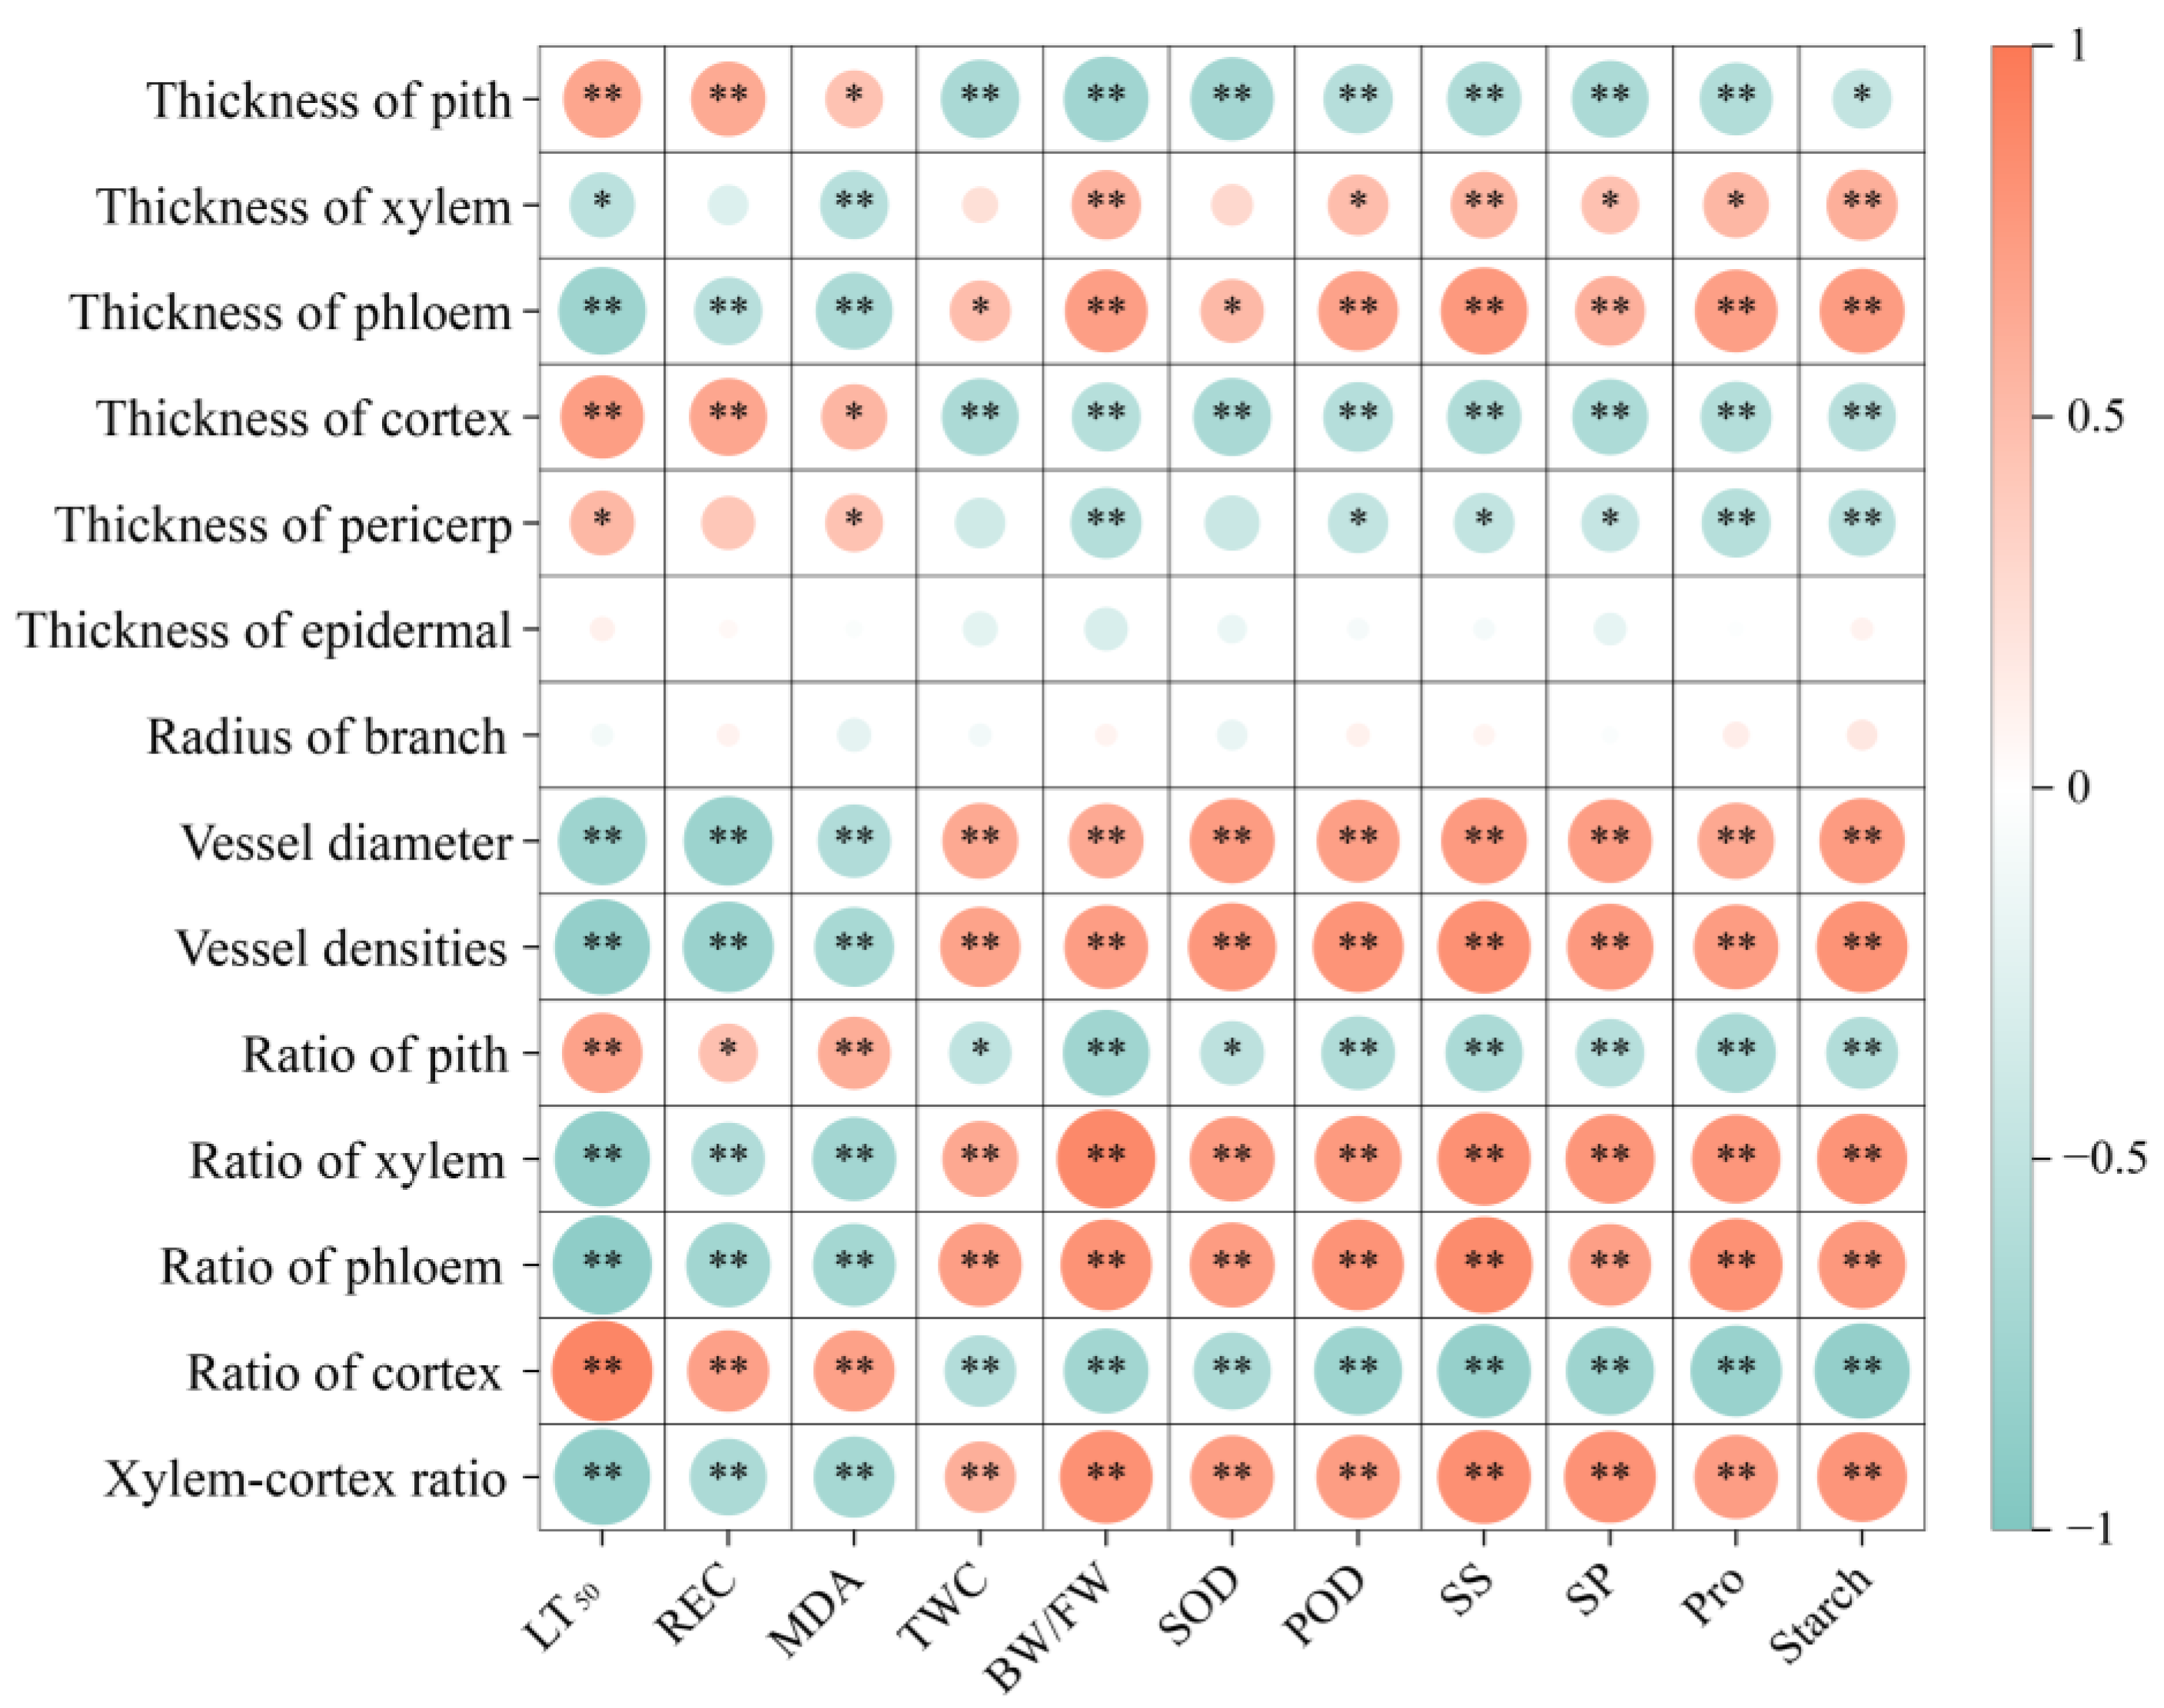
3.6. Comprehensive Evaluation of Cold Resistance

3.6.1. Correlation Analysis

Correlation analysis showed that there was a high correlation between physiological and biochemical indices and anatomical structures (Figure 7). Vessel diameter, vessel density, xylem ratio, phloem ratio, and xylem–cortex ratio showed significant positive correlations with different enzymes and non-enzymatic substances and significant negative correlations with LT50, REC, and MDA. The largest correlation coefficient was observed between LT50 and the phloem ratio (r = −0.89). Pith and cortex ratios showed significant negative correlations (p < 0.01) with various enzymes and non-enzymatic substances and significant positive correlations with LT50, REC, and MDA. Epidermal thickness and branch radius were correlated with various physiological indices, but not significantly.

3.6.2. Membership Function Analysis

The cold resistance of plants is affected and constrained by various factors, and it was not possible to evaluate this using a single index. Thus, it was more reliable to utilize the membership function method to synthesize multiple indicators to evaluate the cold-hardiness of plants. Liu et al. [14] utilized the membership function method to evaluate the cold resistance of apple rootstock branches and found that the larger the average membership value, the greater the cold-hardiness. As shown in Supplementary Data Table S13, clone 89 had the highest average membership function value (0.75), whereas clone 530 had the lowest value (0.31). The ranking of cold resistance in Z. jujuba var. spinosa clones by the average membership function value was 89 > 90 > 604 > 91 > 612 > 614 > 709 > 753 > 637 > 706 > 853 > 859 > 862 > 645 > 535 > 643 > 750 > 531 > 702 > 752 > 530. The overall ranking of cold resistance among the provenances was as follows: LK > SJ > HF > SC > HN > SY > SX.

3.6.3. Cluster Heat Map Analysis

Systematic cluster analysis was performed using membership function values for each index of Z. jujuba var. spinosa clones. As shown in Figure 8, each clone was divided into four classes based on cold resistance. Cluster I had the highest average membership value (0.66) and included clones 89, 90, 91, 604, 612, and 614, which could be regarded as the clones with the greatest potential for low-temperature tolerance. Cluster II had an average membership value of 0.51, including clones 637, 706, 709, and 753. Cluster III had an average membership value of 0.38, including clones 535, 643, 645, 750, 752, 853, 859, and 862. Cluster IV had the lowest average membership value (0.34), including clones 530, 531, 702, and 752, indicating that it was more sensitive to low temperatures and demonstrated poor cold resistance.

4. Discussion

The cell membrane is an important component of plant cells with important physiological functions such as maintaining intracellular stability, material exchange, and information transfer, which are closely related to temperature [38]. Calculating the LT50 of plants by fitting a logistic equation using REC can accurately reflect the cold-hardiness of plants; the lower the LT50, the stronger the cold resistance of the plant [8,11,29,39]. In this study, 14.29% of Z. jujuba var. spinosa clones had an LT50 lower than −40 °C, among which, clone 89 had the lowest LT50, indicating that it had a strong cold-resistant ability, and can be used as an object of introduction. At the same time, it can be used as a breeding parent to cultivate new cold-resistant varieties. The principal locus of plant responses to low temperatures is the cell membrane system. Low-temperature stress causes cell membranes to break, leading to increased membrane permeability [40]. Conductivity is an important parameter used to evaluate the stability of plant membrane systems [11,39]. In the present study, we found that the REC of Z. jujuba var. spinosa clones showed an “S” curve, which increased sharply during stress at −25 °C ~ −35 °C. The REC of clones with weak cold resistance was higher and increased further, which may have been due to severe damage to the plant biofilm system caused by low-temperature stress, leading to a large quantity of electrolyte exudation [41]. At −40 °C, the REC of all Z. jujuba var. spinosa clones tended to stabilize, presumably because most plant cells were severely traumatized and irreversibly damaged [39]. The cold resistance of Z. jujuba var. spinosa clones gradually increased with increasing latitude of the seed source location, and cold resistance was positively correlated with latitude, suggesting that latitude is also one of the factors influencing cold resistance in plants [36,37]. Membrane lipid peroxidation produces MDA, and the amount accumulated under stress conditions reflects the injury level of the plant [42]. In the present study, the MDA content of Z. jujuba var. spinosa clones with strong cold resistance was generally lower and fluctuated stably, which was consistent with the REC, indicating that the lower the REC and MDA content, the stronger the cold resistance [8,43]. MDA is not only affected by ROS but is also associated with the activity of antioxidant enzymes; if the rate of ROS production is much higher than the scavenging ability of the antioxidant enzyme system, it will eventually lead to a large accumulation of MDA [44,45].
Cellular water content and its state of existence are important factors that affect the metabolic intensity, growth rate, and resistance of plants. Low temperatures can easily cause intercellular water to freeze and evaporate, resulting in the weakening of plant resistance to low temperatures [46]. The total water content of clone 530 decreased the most under low-temperature stress conditions. This may be because low temperatures cause water in the intercellular spaces to freeze, leading to severe dehydration and shrinkage of the cells and resulting in mechanical damage to the cell membranes [47]. In contrast, the increase in the BW/FW ratio was greater in the cold-resistant Z. jujuba var. spinosa clones, indicating that the branches of the cold-resistant clones had less cellular damage and stronger water retention capacity. This suggests that a higher BW/FW ratio enhances the ability of a plant to withstand low temperatures [30,48].
Low-temperature stress easily leads to an increase in ROS, and the large accumulation of ROS induces ROS scavenging by the antioxidant defense system to preserve the stability of the membrane structure [15,49]. As important components of the antioxidant system, antioxidant enzymes such as SOD and POD are essential for plants to maintain the dynamic balance of ROS under adverse conditions [50]. Studies have found that higher antioxidant enzyme activity can attenuate oxidative damage and lipid peroxidation and enhance plant defense mechanisms against low temperatures [51]. The SOD and POD activities in Z. jujuba var. spinosa clones showed an increasing and then a decreasing trend, and the enzyme activities of clones 89, 90, and 604 were higher and reached a peak at lower temperatures, which may have been due to their different adaptabilities to low-temperature environments. This indicates that the protective enzyme system of the plants was able to react to low-temperature stress in time to mitigate the damage caused by this stress by improving enzymatic activity [52]. However, as the stress intensified, the activities of SOD and POD began to decrease, which may be attributed to the fact that the ROS content exceeded the capacity of the protective enzyme system, damaging the antioxidant enzyme system and leading to a decrease in its activity [11,50].
Osmotic regulation is an important physiological mechanism by which plants withstand stress. Plants participate in the regulation of cellular osmotic balance through the accumulation of osmotic regulators such as SP, SS, and Pro, thereby resisting biotic and abiotic stresses [53,54]. Studies have indicated that under low-temperature stress, plants enhance their resistance to low temperatures by accumulating large quantities of SP and SS [55]. We found that the SS and SP contents of Z. jujuba var. spinosa clones exhibited a trend of first increasing and then decreasing with decreasing temperature. The SS and SP contents of the cold-resistant clones were significantly higher than those of the other clones and peaked at lower temperatures. This indicates that high levels of sugars and proteins can enhance the concentration of cellular fluids and the water-holding capability of cells, thereby lowering their freezing point and enhancing cell membrane stability [56,57]. Pro is an important osmotic regulator in plants that maintains osmotic balance and stabilizes the cell structure under abiotic stress, acting as a non-enzymatic antioxidant to remove ROS generated under adverse conditions and enhance cold resistance [58]. We found that low-temperature stress significantly increased the Pro content in various Z. jujuba var. spinosa clones, with a larger increase observed in cold-resistant clones such as 89 and 90. This indicates that plants can enhance their adaptability to low temperatures by accumulating large quantities of Pro to reduce ROS and increase their cellular osmotic potential [59]. Research on the cold resistance of grape rootstocks has shown that grapes accumulate large quantities of Pro and exhibit high antioxidant enzyme activity under low-temperature stress [43]. Starch indirectly influences the cold resistance of plants by interconverting with SS and other substances [60]. In the present study, we observed that starch content first decreased and then increased under low-temperature stress, indicating that plants resist low temperatures by converting starch into sugar, resulting in a decline in starch levels [61]. However, as the low-temperature stress intensified, the SP, SS, and Pro contents of each clone peaked and then began to decline, whereas the starch content began to increase. This could have been due to the disruption of the osmotic regulatory metabolic system at persistently low temperatures, which may have reduced the plant’s starch conversion capabilities and blocked the corresponding enzymatic synthesis, thereby diminishing its protective capacity [14].
The cold resistance of plants is not only related to physiological and biochemical activities but also varies owing to differences in anatomical structure [50]. Influenced by genetic characteristics, plant branches with different proportions of anatomical structures have different levels of cold resistance [24,62]. Xylem vessels play a crucial role in transporting water and their density is related to cold resistance. Furthermore, there is a positive correlation between the xylem proportion and cold resistance [50,63]. In the present study, we found that branch xylem thickness, proportion, and vessel density of the cold-resistant Z. jujuba var. spinosa clones, such as 89 and 90, were significantly greater than those of the other clones, which may be because the branches had a high degree of lignification and vessel density, which enhanced the plants’ water transport capacity, thereby strengthening their adaptation to low temperatures [46,64]. Thin-walled phloem cells typically contain starch and other substances that serve as osmotic protectants, preventing cell membrane damage caused by dehydration or low temperatures [65,66]. In the present study, strongly cold-resistant clones demonstrated higher phloem ratios and resistance to low-temperature stress by accumulating more soluble sugars. It is tentatively inferred that the thicker a plant’s phloem layer, the higher the content of phloem fibers, which makes it more flexible and enhances its ability to withstand low temperatures [46]. The cortex is composed mostly of living cells and is significantly influenced by the external environmental conditions [46]. We found that the cortex ratio of clone 91 was significantly lower than that of the other clones, whereas its xylem–cortex ratio was significantly higher than that of the other clones. It can be preliminarily inferred that a lower cortex and higher xylem–cortex ratios are conducive to enhancing a plant’s ability to resist low temperatures. Studies on the anatomical structure of peach branches have also revealed that cold-resistant peach varieties have higher xylem and lower cortical ratios [67].
A comprehensive identification approach can accurately reflect the cold resistance of a plant, which is influenced by multiple elements [62]. Currently, correlation, membership function, and cluster analyses are primarily used in related studies to comprehensively evaluate plant cold resistance [51,68,69]. Correlation analysis revealed a strong correlation between physiological and biochemical indices and anatomical structures. Notably, the LT50, REC, and MDA showed significant negative correlations with most anatomical structures. This indicates that membrane lipid peroxidation, resulting from low-temperature stress, is the main cause of severe freezing damage in plants [51]. SOD, SS, Pro, and starch exhibited high correlation coefficients with the proportion of various anatomical structures, implying that plants enhance their low-temperature resistance by increasing the activity of antioxidant enzymes and accumulating osmotic regulatory substances. In the present study, a comprehensive evaluation of the membership function revealed that the cold resistances of branches from LK and SJ and Z. jujuba var. spinosa clones 89, 90, and 604 were relatively strong. This result was primarily consistent with the cold resistance results obtained from the LT50 values, indicating that the membership function method can accurately evaluate plant cold resistance [59].

5. Conclusions

We compared the physiological and biochemical changes and anatomical structures of Z. jujuba var. spinosa clones from different provenances under low-temperature stress. Additionally, we comprehensively evaluated their cold resistance by analyzing membership functions. Cold-resistant clones had a more stable membrane lipid structure, higher antioxidant enzyme activity, and resisted low temperatures by accumulating large quantities of osmotic regulatory substances. Higher xylem, phloem, and xylem–cortex ratios; greater vessel density; and smaller vessel diameter and cortex ratios could enhance the cold resistance of Z. jujuba var. spinosa. A comprehensive evaluation revealed that clones 89, 90, 91, 604, 612, and 614 exhibited the strongest cold resistance. Among the different provenances, the cold resistance of the clones from LK was the strongest, followed by that of clones from SJ. These results provide a theoretical basis for the discovery of cold-resistant germplasm resources of Z. jujuba var. spinosa, the early and rapid selection of superior-line parents, and the selection of cold-resistant varieties.

Supplementary Materials

The following supporting information can be downloaded at: https://www.mdpi.com/article/10.3390/f15071130/s1, Table S1. Relative electrical conductivity in branches of Ziziphus jujuba var. spinosa clones under different low-temperature treatments; Table S2. MDA content in branches of Ziziphus jujuba var. spinosa clones under different low-temperature treatments; Table S3. Total water content in branches of Ziziphus jujuba var. spinosa clones under different low-temperature treatments; Table S4. BW / FW ratio in branches of Ziziphus jujuba var. spinosa clones under different low-temperature treatments; Table S5. POD activity in branches of Ziziphus jujuba var. spinosa clones under different low-temperature treatments; Table S6. SOD activity in branches of Ziziphus jujuba var. spinosa clones under different low-temperature treatments; Table S7. Soluble protein content in branches of Ziziphus jujuba var. spinosa clones under different low-temperature treatments; Table S8. Soluble sugar content in branches of Ziziphus jujuba var. spinosa clones under different low-temperature treatments; Table S9. Proline content in branches of Ziziphus jujuba var. spinosa clones under different low-temperature treatments; Table S10. Starch content in branches of Ziziphus jujuba var. spinosa clones under different low-temperature treatments; Table S11 Anatomical structure indices of branches of different Ziziphus jujuba var. spinosa clones; Table S12. Anatomical structure indices of one-year-old branches of different Ziziphus jujuba var. spinosa clones; Table S13. Membership function values of cold resistance indexes of Ziziphus jujuba var. spinosa clones.

Author Contributions

Conceptualization, writing—review and editing, supervision, funding acquisition, project administration, Q.L. and S.D.; resources, methodology, validation, Y.Z.; formal analysis, investigation, Y.K., Y.W. and R.L.; writing—original draft preparation, visualization, software, data curation, B.L. All authors have read and agreed to the published version of the manuscript.

Funding

This research was funded by Shenyang Agricultural University Ziziphus jujuba var. spinosa National Forest Germplasm Resource Repository Subsidy Program (GLC-SN-2023-1011).

Data Availability Statement

Upon request, the corresponding author will provide the data used to support the findings of this study.

Acknowledgments

We are grateful to the National Forest Germplasm Resource Repository for Ziziphus jujuba var. Spinosa at Shenyang Agricultural University for providing test materials. We thank the other team members for their assistance with the experiments.

Conflicts of Interest

The authors declare no conflicts of interest.

References

  1. Li, H.J.; Li, P.; Yu, G.D. Advance of research and prospect of development of Zizyphus jujuba var. spinosa (Bunge) Hu ex HF Chow. Chin. Wild Plant Resour. 1999, 18, 17–21. [Google Scholar]
  2. Zhang, Y.; Guo, S.; Zhu, S.Q.; Xu, L.; Yan, H.; Qian, D.W.; Duan, J.A. Effect of different drying methods on nucleoside, amino acids and flavonoids in the leaves of Ziziphus jujuba var. spinosa. Sci. Technol. Food Ind. 2016, 37, 296–303. [Google Scholar]
  3. Theocharis, A.; Clément, C.; Barka, E.A. Physiological and molecular changes in plants grown at low temperatures. Planta 2012, 235, 1091–1105. [Google Scholar] [CrossRef]
  4. Ritonga, F.N.; Chen, S. Physiological and molecular mechanism involved in cold stress tolerance in plants. Plants 2020, 9, 560. [Google Scholar] [CrossRef] [PubMed]
  5. Wang, H.B.; Gong, M.; Xin, H.; Tang, L.Z.; Dai, D.Q.; Gao, Y.; Liu, C. Effects of chilling stress on the accumulation of soluble sugars and their key enzymes in Jatropha curcas seedlings. Physiol. Mol. Biol. Plants 2018, 24, 857–865. [Google Scholar] [CrossRef]
  6. Sun, S.H.; Qi, X.J.; Wang, R.; Lin, M.M.; Fang, J.B. Evaluation of freezing tolerance in Actinidia germplasm based on relative electrolyte leakage. Hortic. Environ. Biotechnol. 2020, 61, 755–765. [Google Scholar] [CrossRef]
  7. Karami, H.; Rezaei, M.; Sarkhosh, A.; Rahemi, M.; Jafari, M. Cold hardiness assessment in seven commercial fig cultivars (Ficus carica L.). Gesunde Pflanz. 2018, 70, 195–203. [Google Scholar] [CrossRef]
  8. Wang, Y.X.; Hu, Y.; Chen, B.H.; Zhu, Y.F.; Dawuda, M.M.; Svetla, S. Physiological mechanisms of resistance to cold stress associated with 10 elite apple rootstocks. J. Integr. Agric. 2018, 17, 857–866. [Google Scholar] [CrossRef]
  9. Wang, C.Z.; Gao, J.C.; Li, X.G.; Gao, W.H.; Xin, W.J.; Wu, P. Study on cold hardiness of major jujube cultivars in northwestern China. J. Fruit. Sci. 2011, 28, 898–902. [Google Scholar]
  10. Gao, M.X.; Tian, X.W.; Zong, J.Y. Research on the Cold Resistance of Different Varietal Jujubes. North. Hortic. 2009, 12, 102–104. [Google Scholar]
  11. Zhang, Z.P.; Gu, Y.Y.; Mao, Q.X.; Wang, J. Physiological Response to Low Temperature of Four Genotypes of Cyclocarya paliurus and Their Preliminary Evaluation to Cold Resistance. Forests 2023, 14, 1680. [Google Scholar] [CrossRef]
  12. Apel, K.; Hirt, H. Reactive Oxygen Species: Metabolism, Oxidative Stress, and Signal Transduction. Annu. Rev. Plant Biol. 2004, 55, 373–399. [Google Scholar] [CrossRef] [PubMed]
  13. Mishra, N.; Jiang, C.K.; Chen, L.; Paul, A.; Chatterjee, A.; Shen, G.X. Achieving abiotic stress tolerance in plants through antioxidative defense mechanisms. Front. Plant Sci. 2023, 14, 1110622. [Google Scholar] [CrossRef] [PubMed]
  14. Liu, X.L.; Wang, H.P.; Sun, W.T.; Dong, T.; Niu, J.Q.; Ma, M. Cold resistance evaluation of the shoots of 5 apple rootstocks. J. Fruit. Sci. 2021, 38, 1264–1274. [Google Scholar]
  15. Lei, M.Y.; Gao, X.F.; Bai, Q.M.; Deng, K.; Zuo, W.F.; Li, Y.Y. Evaluation of Cold Resistance of Pomegranate Branches from Different Varieties. J. Henan Agric. Sci. 2023, 52, 120–130. [Google Scholar]
  16. Ghosh, U.K.; Islam, M.N.; Siddiqui, M.N.; Cao, X.; Khan, M.A.R. Proline, a multifaceted signalling molecule in plant responses to abiotic stress: Understanding the physiological mechanisms. Plant Biol. 2022, 24, 227–239. [Google Scholar] [CrossRef] [PubMed]
  17. Seydel, C.; Kitashova, A.; Fürtauer, L.; Nägele, T. Temperature-induced dynamics of plant carbohydrate metabolism. Physiol. Plant 2022, 174, e13602. [Google Scholar] [CrossRef] [PubMed]
  18. Janmohammadi, M.; Zolla, L.; Rinalducci, S. Low temperature tolerance in plants: Changes at the protein level. Phytochemistry 2015, 117, 76–89. [Google Scholar] [CrossRef] [PubMed]
  19. Kang, C.H.; Lee, Y.M.; Park, J.H.; Nawkar, G.M.; Oh, H.T.; Kim, M.G.; Lee, S.I.; Kim, W.Y.; Yun, D.J.; Lee, S.Y. Ribosomal P3 protein AtP3B of Arabidopsis acts as both protein and RNA chaperone to increase tolerance of heat and cold stresses. Plant Cell Environ. 2016, 39, 1631–1642. [Google Scholar] [CrossRef] [PubMed]
  20. Buchner, O.; Neuner, G. Winter frost resistance of Pinus cembra measured in situ at the alpine timberline as affected by temperature conditions. Tree Physiol. 2011, 31, 1217–1227. [Google Scholar] [CrossRef]
  21. Cheng, J.Y.; Zheng, J.J.; Dou, T.X.; Deng, X.Z.; Wang, W. Summary of Physiological Characteristics of Plant Cold Resistance. Hubei For. Sci. Technol. 2017, 46, 16–20. [Google Scholar]
  22. Guo, X.M.; Liu, J.Z.; Zhai, J.T.; Xiao, X.; Lv, Y.M.; Li, D.D.; Pei, S.M.; Zhang, L.B. Relationship between leaf anatomical structure and trunk cold resistance of 16 peach cultivars. Sci. Silvae Sin. 2015, 51, 33–43. [Google Scholar]
  23. Tang, L.H.; Zhao, X.M.; Chai, Y.; Zhao, R.P.; Yang, X.L. Study on the relationship between stem structure and cold resistance of different species of Paeonia rockii. North. Hortic. 2016, 12, 62–64. [Google Scholar]
  24. Wang, H.; Zhang, J.Z.; Xie, Z.S.; Qi, Y.S. Morphological observation on root vessel elements of different cold resistance grape cultivars. Chin. Agric. Sci. Bull. 2013, 28, 110–114. [Google Scholar]
  25. Macdonald, M.T.; Lada, R.R.; Veitch, R.S.; Thiagarajan, A.; Adams, A.D. Postharvest needle abscission resistance of balsam fir (Abies balsamea) is modified by harvest date. Can. J. For. Res. 2014, 44, 1394–1401. [Google Scholar] [CrossRef]
  26. Xu, L.; Tang, Y.; Wang, X.J. Cold Resistance Experiment on Ziziphus jujuba var. spinosa Seedlings with Different Provenances, Tree Ages and Plant Types. Hubei Agric. Sci. 2013, 52, 1325–1329. [Google Scholar]
  27. Zheng, Q.Q.; Li, P.C.; Chen, Q.L.; Wang, J.J. Comprehensive evaluation of physiological indicators of resistance in Zizphus spinosus Hu from different origins under natural cooling conditions. Jiangsu Agric. Sci. 2019, 47, 154–158. [Google Scholar]
  28. Zhou, W.J.; Leul, M. Uniconazole-induced alleviation of freezing injury in relation to changes in hormonal balance, enzyme activities and lipid peroxidation in winter rape. Plant Growth Regul. 1998, 26, 41–47. [Google Scholar] [CrossRef]
  29. Lu, Y.Z.; Hu, Y.G.; Li, P.P. Consistency of electrical and physiological properties of tea leaves on indicating critical cold temperature. Biosyst. Eng. 2017, 159, 89–96. [Google Scholar] [CrossRef]
  30. Chen, B.H.; Zhang, B.; Mao, J.; Hao, Y.; Yang, R.; Cai, X.H.; Qi, S.Y. The Relationship between the Changing of Water Content and the Cold Resistance of Grape Branches. Plant Physiol. J. 2014, 50, 535–541. [Google Scholar]
  31. Hodges, D.M.; DeLong, J.M.; Forney, C.F.; Prange, R.K. Improving the thiobarbituric acid-reactive-substances assay for estimating lipid peroxidation in plant tissues containing anthocyanin and other interfering compounds. Planta 1999, 207, 604–611. [Google Scholar] [CrossRef]
  32. Yemm, E.W.; Willis, A.J. The estimation of carbohydrates in plant extracts by anthrone. Biochem. J. 1954, 57, 508–514. [Google Scholar] [CrossRef]
  33. Bradford, M.M. A rapid and sensitive method for the quantitation of microgram quantities of protein utilizing the principle of protein-dye binding. Anal. Biochem. 1976, 72, 248–254. [Google Scholar] [CrossRef]
  34. Bates, L.S.; Waldren, R.P.; Teare, I.D. Rapid determination of free proline for water-stress studies. Plant Soil 1973, 39, 205–207. [Google Scholar] [CrossRef]
  35. Xiu, W.Y.; Zhu, Y.; Chen, B.; Hu, Y.; Dawuda, M.M. Effects of paclobutrazol on the physiological characteristics of Malus halliana Koehne Seedlings under drought stress via principal component analysis and membership function analysis. Arid. Land. Res. Manag. 2019, 33, 97–113. [Google Scholar] [CrossRef]
  36. Chen, M.H.; Feng, Y.Q.; Jing, S.C.; Fan, J.B.; Yan, X.B. Evaluation of Semi-lethal Temperature and Cold Toleranceof Bermudagrass (Cynodon dactylon) on Latitude and Longitude Gradients. Chin. J. Grassl. 2022, 44, 49–57. [Google Scholar]
  37. Yang, Z.X.; Wang, S.Z.; Han, Y.L. Cold Tolerance Variation of Populus cathayana Clones from Different Populations. Forest Res. 1996, 5, 36–41. [Google Scholar]
  38. Polle, A.; Otter, T.; Seifert, F. Apoplastic peroxidases and lignification in needles of Norway spruce (Picea abies L.). Plant Physiol. 1994, 106, 53–60. [Google Scholar] [CrossRef]
  39. Zhang, Y.T.; Zhu, Q.Y.; Zhang, M.; Guo, Z.H.; Yang, J.J.; Mo, J.X.; Cui, J.B.; Hu, H.L.; Xu, J. Individual Cryptomeria fortunei Hooibrenk Clones Show Varying Degrees of Chilling Stress Resistance. Forests 2020, 11, 189. [Google Scholar] [CrossRef]
  40. Chen, L.J.; Xiang, H.Z.; Miao, Y.; Zhang, L.; Guo, Z.F.; Zhao, X.H.; Lin, J.W.; Li, T.L. An Overview of Cold Resistance in plants. J. Agron. Crop Sci. 2014, 200, 237–245. [Google Scholar] [CrossRef]
  41. Punia Bangar, S.; Trif, M.; Ozogul, F.; Kumar, M.; Chaudhary, V.; Vukic, M.; Tomar, M.; Changan, S. Recent developments in cold plasma-based enzyme activity (browning, cell wall degradation, and antioxidant) in fruits and vegetables. Compr. Rev. Food Sci. Food Saf. 2022, 21, 1958–1978. [Google Scholar] [CrossRef] [PubMed]
  42. Chen, S.Y. Injury of Membrane Lipid Peroxidation to Plant Cell. Plant Physiol. Commun. 1991, 2, 84–90. [Google Scholar]
  43. Guo, Y.L.; Mu, D.S.; Zhao, L.X.; Zhang, Z.M.; Zhang, L.N.; Ma, Z.H. Evaluation of cold resistance of 18 wine grape clones introduced from abroad. J. Arid. Land. Resour. Environ. 2023, 37, 161–168. [Google Scholar]
  44. Gu, K.; Hou, S.; Chen, J.; Guo, J.; Wang, F.; He, C.; Zou, C.; Xie, X. The physiological response of different tobacco varieties to chilling stress during the vigorous growing period. Sci. Rep. 2021, 11, 22136. [Google Scholar] [CrossRef] [PubMed]
  45. Le Gall, H.; Philippe, F.; Domon, J.M.; Gillet, F.; Pelloux, J.; Rayon, C. Cell Wall Metabolism in Response to Abiotic Stress. Plants 2015, 4, 112–166. [Google Scholar] [CrossRef]
  46. Chang, F.Y.; Zhang, L.Y.; Dong, Q.L.; Luan, H.A.; Jia, P.; Qi, G.H.; Guo, S.P.; Zhang, X.M. The anatomical structure character of raspberry stems is a key factor affecting its cold resistance. Flora 2023, 298, 152196. [Google Scholar] [CrossRef]
  47. Xu, Y.; Xue, L.; Qu, M. Physiological and Ecological Mechanisms of Plant Adaptation to Low Temperature. Sci. Silvae Sin. 2007, 4, 88–94. [Google Scholar]
  48. Wang, Z.Y.; Tian, Q.H.; Chang, R.F.; Liu, G.J.; Chen, H.; Li, Y.H. Physiological response and evaluation of different peach varieties under low temperature stress. J. China Agric. Uni. 2022, 27, 66–77. [Google Scholar]
  49. Devireddy, A.R.; Tschaplinski, T.J.; Tuskan, G.A.; Muchero, W.; Chen, J.G. Role of Reactive Oxygen Species and Hormones in Plant Responses to Temperature Changes. Int. J. Mol. Sci. 2021, 22, 8843. [Google Scholar] [CrossRef]
  50. Xu, G.X.; He, M.Q.; Zhao, D.Y.; Lyu, D.G.; Qin, S.J. Physiological and Structural Changes in Apple Tree Branches of Different Varieties during Dormancy. Horticulturae 2023, 9, 947. [Google Scholar] [CrossRef]
  51. Dey, S.; Biswas, A.; Huang, S.Q.; Li, D.F.; Liu, L.L.; Deng, Y.; Xiao, A.P.; Birhanie, Z.M.; Zhang, J.J.; Li, J.J.; et al. Low Temperature Effect on Different Varieties of Corchorus capsularis and Corchorus olitorius at Seedling Stage. Agronomy 2021, 11, 2547. [Google Scholar] [CrossRef]
  52. Tang, H.X.; Yang, X.M.; Feng, L.J.; Zhu, F.; Zhou, J.L.; Yin, Y.L. Analysis of Freezing Tolerances and Physiological Differences of Three Pomegranate Cultivars During the Overwintering. Acta Hortic. Sin. 2023, 50, 1563–1573. [Google Scholar]
  53. Li, M.H.; Jiang, Y.; Wang, A.; Li, X.B.; Zhu, W.; Yan, C.F.; Du, Z.; Shi, Z.; Lei, J.P.; Schönbeck, L.; et al. Active Summer Carbon Storage for Winter Persistence in Trees at the Cold Alpine Treeline. Tree Physiol. 2018, 38, 1345–1355. [Google Scholar] [CrossRef] [PubMed]
  54. Zhang, B.Q.; Yang, L.T.; Li, Y.R. Physiological and Biochemical Characteristics Related to Cold Resistance in Sugarcane. Sugar Technol. 2015, 17, 49–58. [Google Scholar] [CrossRef]
  55. Li, Q.Y.; Lu, B.; Zhao, J.W.; Li, H.; Li, Y.; Miao, S.Y.; Lu, B.S. Physiological response and cold resistance evaluation of different Pyrus calleryan varieties under low temperature stress. J. Northwest A F Univ. 2020, 48, 86–94, 110. [Google Scholar]
  56. Liu, Z.Y.; Liu, J.L.; Zhu, Y.Y.; Yang, Y.S.; Chen, L.Y.; Zhang, X.M.; Qi, G.H. Research Progress on the Response Mechanism of Woody Plants to low Temperature. J. Northwest For. Univ. 2022, 37, 157–163. [Google Scholar]
  57. Keunen, E.; Peshev, D.; Vangronsveld, J.; Van Den Ende, W.; Cuypers, A. Plant sugars are crucial players in the oxidative challenge during abiotic stress: Extending the traditional concept. Plant Cell Environ. 2013, 36, 1242–1255. [Google Scholar] [CrossRef] [PubMed]
  58. Kaur, G.; Asthir, B. Proline: A key player in plant abiotic stress tolerance. Biol. Plant 2015, 59, 609–619. [Google Scholar] [CrossRef]
  59. Liu, B.B.; Chen, L.N.; Niu, J.; Li, H.X.; Zhang, J.; Cao, S.Y. Selection of methods for evaluation on cold tolerance of six pomegranate varieties. J. Fruit. Sci. 2018, 35, 66–73. [Google Scholar]
  60. Wang, H.N. Studies on Cold Resistance and Its Related Factor of Young Apple Trees on the SH40 Dwarfing Interstocks. Master’s Thesis, Hebei Agricultural University, Baoding, China, 2014. [Google Scholar]
  61. Jing, J.L.; Liu, M.X.; Wei, X.; Xu, J.Z.; Li, Z.Y.; Zhang, X.Y.; Zhou, S.S. Evaluation of cold hardiness of several apple interstocks. J. Fruit. Sci. 2022, 39, 970–981. [Google Scholar]
  62. Zhang, X.X.; Lu, J.G.; Zhu, Y.L. Study on the shoot tissue structure of Chimonanthus varieties in relation to cold resistance. Forest. Ecol. Sci. 2012, 27, 432–434. [Google Scholar]
  63. Amrina, S.; Vivek, D.; Tejpal, G.; Singh, A.P.; Yelam, S.; Pandey, G.K. Simultaneous over-expression of PaSOD and RaAPX in transgenic Arabidopsis thaliana confers cold stress tolerance through increase in vascular lignifications. PLoS ONE 2014, 9, e110302. [Google Scholar]
  64. García-Cervigón, A.I.; Fajardo, A.; Caetano-Sánchez, C.; Camarero, J.J.; Olano, J.M. Xylem anatomy needs to change, so that conductivity can stay the same: Xylem adjustments across elevation and latitude in Nothofagus pumilio. Ann. Bot. 2020, 125, 1101–1112. [Google Scholar] [CrossRef]
  65. Shalaev, E.Y.; Steponkus, P.L. Phase behavior and glass transition of 1, 2-dioleoylphosphatidylethanolamine (DOPE) dehydrated in the presence of sucrose. Biochim. Biophys. Acta 2001, 1514, 100–116. [Google Scholar] [CrossRef]
  66. Hongbo, S.; Zongsuo, L.; Mingan, S. Osmotic regulation of 10 wheat (Triticum aestivum L.) genotypes at soil water deficits. Colloids Surf. B Biointerfaces 2006, 47, 132–139. [Google Scholar] [CrossRef]
  67. Wang, Z.Y.; Zhang, L.S.; Chang, R.F.; Liu, G.J.; Han, J.C.; Chen, H. Study on the relationship between tissue structure and cold resistance of peach branches. J. Hebei Agric. Sci. 2014, 18, 29–33. [Google Scholar]
  68. Liu, R.L.; Miao, Y.; Zhang, Y.C.; Chen, J.H.; Dong, S.J. Cold resistance of introduced Prunus armeniaca var. ansu clones and families. Non-Wood For. Res. 2023, 41, 137–149. [Google Scholar]
  69. He, Q.F.; Cao, Y.Y.; Peng, Y.H.; Huang, Z.L.; Hao, H.K.; Tan, C.Q. Comprehensive evaluation of cold resistance of individual plants of different Acacia species. Chin. J. Ecol. 2019, 38, 1339–1345. [Google Scholar]
Figure 1. Growth status of experimental plants. (A) Images taken in August. (B) Images taken prior to sample collection.
Forests 15 01130 g001
Figure 2. Relative electrical conductivity and MDA content in branches of Ziziphus jujuba var. spinosa clones from different provenances under low-temperature treatments. (A) The REC of Z. jujuba var. spinosa branches from different provenances, (B). The MDA content of branches from the different provenances. Letters indicate comparisons between different clones at the same temperature (p < 0.05). LK: Kazuo, Liaoning; SX: Xiaxian, Shanxi; SJ: Jiaxian, Shaanxi; SY: Yanchuan, Shaanxi; HF: Fuxing, Heibei; HN: Neiqiu, Heibei; SC: Changqing, Shandong.
Forests 15 01130 g002
Figure 3. Water content in branches of Ziziphus jujuba var. spinosa clones from different provenances under low-temperature treatments. (A). The total water content of Z. jujuba var. spinosa clones from different provenances, (B). The BW/FW ratio in branches of each provenance. Letters indicate comparisons between different clones at the same temperature (p < 0.05). LK: Kazuo, Liaoning; SX: Xiaxian, Shanxi; SJ: Jiaxian, Shaanxi; SY: Yanchuan, Shaanxi; HF: Fuxing, Heibei; HN: Neiqiu, Heibei; SC: Changqing, Shandong.
Forests 15 01130 g003
Figure 4. POD and SOD activity in branches of Ziziphus jujuba var. spinosa clones from different provenances under low-temperature treatments. (A). The POD activities of the branches of the five provenances, (B) The SOD activities of all five provenances. Letters indicate comparisons between different clones at the same temperature (p < 0.05). LK: Kazuo, Liaoning; SX: Xiaxian, Shanxi; SJ: Jiaxian, Shaanxi; SY: Yanchuan, Shaanxi; HF: Fuxing, Heibei; HN: Neiqiu, Heibei; SC: Changqing, Shandong.
Forests 15 01130 g004
Figure 5. Osmotic regulation content in branches of Ziziphus jujuba var. spinosa clones from different provenances under low-temperature treatments. (A). The SP content of Z. jujuba var. spinosa branches from various provenances, (B). The SS content of the remaining five provenances, (C). The Pro content of Z. jujuba var. spinosa branches of the other five provenances, (D). The starch content of Z. jujuba var. spinosa clones from different provenances. Letters indicate comparisons between different clones at the same temperature (p < 0.05). LK: Kazuo, Liaoning; SX: Xiaxian, Shanxi; SJ: Jiaxian, Shaanxi; SY: Yanchuan, Shaanxi; HF: Fuxing, Heibei; HN: Neiqiu, Heibei; SC: Changqing, Shandong.
Forests 15 01130 g005
Figure 6. Anatomical structure indices of annual branches of Ziziphus jujuba var. spinosa clones from different provenances: (A) clone 89 (LK); (B) clone 531 (SX); (C) clone 614 (SJ); (D) clone 643 (SY); (E) clone 702 (HF); (F) clone 753 (HN); (G) clone 853 (SC). a: pith; b: vessel; c: xylem; d: pith ray; e: phloem; f: cortex; g: pericerp; h: epidermal.
Forests 15 01130 g006
Figure 7. Correlation analysis of different physiological indices and anatomical structure. Red represents a positive correlation and blue represents a negative correlation. The size of the circle is proportional to the correlation coefficient. The following are the levels of significance: * p < 0.05; ** p < 0.01.
Forests 15 01130 g007
Figure 8. Cluster analysis of cold resistance of different Ziziphus jujuba var. spinosa clones.
Forests 15 01130 g008
Table 1. Information of the origins of the Ziziphus jujuba var. spinosa clones tested.
ClonesProvenancesAverage Seeding Height
/cm
Average Diameter
/mm
Longitude
/E
Latitude
/N
Mean Altitude (m)Annual Average Temperature/°C
89, 90, 91Kazuo, Liaoning
(LK)
74.719.79119°50′41°24′407.308.70
530, 531, 535Xiaxian, Shanxi
(SX)
91.1611.42111°12′35°50′539.6712.90
604, 612, 614Jiaxian, Shaanxi
(SJ)
89.9111.38110°29′38°40′507.1710.00
637, 643, 645Yanchuan, Shaanxi
(SY)
83.859.14110°19′36°52′561.0010.80
702, 706, 709Fuxing, Heibei
(HF)
90.8211.02114°18′36°34′180.6213.50
750, 752, 753Neiqiu, Heibe
(HN)
71.4410.29114°22′37°14′168.1311.50
853, 859, 862Changqing, Shandong
(SC)
85.079.99116°52′36°29′112.3613.80
Table 2. Semi-lethal low temperature (LT50) of branches of Ziziphus jujuba var. spinosa clones under different low-temperature treatments.
ClonesLogistic EquationR2LT50/°C
89y = 100/(1 + 7.6845e−0.0454t)0.71−44.04
90y = 100/(1 + 4.4696e−0.0380t)0.76−39.25
91y = 100/(1 + 4.1272e−0.0327t)0.75−40.39
LKy = 100/(1 + 5.1074e−0.0392t)0.74−41.60
530y = 100/(1 + 2.4562e−0.0475t)0.73−18.92
531y = 100/(1 + 2.7210e−0.0355t)0.86−24.97
535y = 100/(1 + 2.9868e−0.0356t)0.65−28.42
SXy = 100/(1 + 2.7012e−0.0417t)0.76−23.83
604y = 100/(1 + 4.1148e−0.0321t)0.75−39.74
612y = 100/(1 + 4.3929e−0.0319t)0.76−41.33
614y = 100/(1 + 5.3228e−0.0431t)0.74−39.71
SJy = 100/(1 + 4.5814e−0.0375t)0.75−40.59
637y = 100/(1 + 2.7584e−0.030t)0.82−32.03
643y = 100/(1 + 2.6461e−0.0317t)0.86−29.26
645y = 100/(1 + 4.0342e−0.0509t)0.68−26.57
SYy = 100/(1 + 3.0716e−0.0388t)0.78−28.92
702y = 100/(1 + 3.2482e−0.0554t)0.83−22.27
706y = 100/(1 + 2.4900e−0.0299t)0.79−29.91
709y = 100/(1 + 4.1103e−0.0361t)0.73−35.60
HFy = 100/(1 + 3.1782e−0.0406t)0.82−28.48
750y = 100/(1 + 4.3649e−0.0477t)0.77−30.89
752y = 100/(1 + 2.7007e−0.0395t)0.89−24.71
753y = 100/(1 + 6.0515e−0.0438t)0.71−37.20
HNy = 100/(1 + 3.9932e−0.0435t)0.81−31.83
853y = 100/(1 + 2.7569e−0.0367t)0.87−27.41
859y = 100/(1 + 2.8537e−0.0307t)0.80−29.37
862y = 100/(1 + 2.8637e−0.0280t)0.82−27.05
SCy = 100/(1 + 2.8474e−0.0373t)0.83−28.05
LK: Kazuo, Liaoning; SX: Xiaxian, Shanxi; SJ: Jiaxian, Shaanxi; SY: Yanchuan, Shaanxi; HF: Fuxing, Heibei; HN: Neiqiu, Heibei; SC: Changqing, Shandong.
Disclaimer/Publisher’s Note: The statements, opinions and data contained in all publications are solely those of the individual author(s) and contributor(s) and not of MDPI and/or the editor(s). MDPI and/or the editor(s) disclaim responsibility for any injury to people or property resulting from any ideas, methods, instructions or products referred to in the content.

