Article

Assessing the Trade-off between Ecological Conservation and Local Development in Wuyishan National Park: A Production–Living–Ecological Space Perspective

1
School of Transportation and Geomatics Engineering, Shenyang Jianzhu University, Shenyang 110168, China
2
College of Economic and Management, Shenyang Agricultural University, Shenyang 110866, China
3
Shandong No. 3 Exploration Institute of Geology and Mineral Resources, Yantai 264000, China
*
Author to whom correspondence should be addressed.
Forests 2024, 15(7), 1152; https://doi.org/10.3390/f15071152
Submission received: 22 May 2024 / Revised: 25 June 2024 / Accepted: 1 July 2024 / Published: 3 July 2024
(This article belongs to the Section Forest Ecology and Management)

Abstract

:
China’s national park establishment aims to achieve a balance between ecological conservation and regional development. This study adopts a production–living–ecological (PLE) space perspective to evaluate the park’s impact. By quantifying changes and employing a combination of geographic detector and coupling coordination degree analyses, this research explores the dynamics of habitat quality and PLE space within the Wuyishan region, alongside their interrelationships. The national park’s influence on the surrounding area exhibits spatial heterogeneity, evident both within and beyond park boundaries, as well as across different counties. Despite the concentration of PLE changes in the park’s vicinity, particularly in densely populated urban areas, the influence of the national park on the local area is random and primarily at a low level. Importantly, the ecological space exhibits substantial changes, mirroring improvements in habitat quality. Furthermore, the coupling coordination between habitat quality changes and PLE space changes exhibits remarkable spatial variations. The complex interrelationships among PLE space necessitate a coordinated approach to their development for effective national park management. Ultimately, this investigation provides a novel perspective for the assessment of Wuyishan National Park’s conservation effectiveness, contributing practical value for future endeavors.

1. Introduction

Anthropogenic activities have had a profound impact on the global environment and natural ecosystems, leading to a significant decline in biodiversity [1,2,3]. In response to this environmental challenge, national parks have emerged as a crucial mechanism for preserving natural areas worldwide. The adoption of national parks as a strategic approach for nature conservation and wilderness protection has gained widespread international recognition [4]. As of 2021, national parks constitute a significant portion of globally protected areas, encompassing roughly 23% of the total [5].
National parks are designated areas aimed at conserving natural landscapes, protecting biodiversity, and preserving ecosystem integrity. Nowadays, national parks have evolved to encompass both conservation and socio-economic development objectives, striving to reconcile the dichotomy between societal demands and environmental concerns while promoting a more harmonious relationship between society and nature [6]. A growing body of research across the globe, such as in Thailand and Ireland, demonstrates the pivotal role national parks play in driving regional development, contributing to the progress of rural areas and acting as catalysts for economic growth [7]. Furthermore, these parks demonstrate strong synergies with the United Nations’ Agenda 2030 and its associated Sustainable Development Goals [8]. The establishment of national parks not only influences landscape patterns and habitat quality but also brings about changes in local production and livelihood practices [9,10], leading to changes in the space functions. National parks are increasingly being integrated into broader regional and local development processes, emphasizing the connection between protected areas and their economic and social environments [11,12,13]. Therefore, understanding these transformations is crucial for analyzing the influence of national parks.
In a significant development, China is currently in the process of establishing the world’s largest national park system by 2035 [14,15]. National parks, which are considered as the fundamental building blocks of China’s nature reserve system, aim to strike a balance between scientific conservation and the rational utilization of natural resources [16,17]. The National Park System Pilot Plan, initiated in 2017, exemplifies China’s dedication to this balance [18]. The plan seeks to establish a model for reconciling conservation endeavors with sustainable development, with Wuyishan being one of the designated pilot sites [19]. Following years of meticulous planning and construction, five national parks, including Wuyishan, were officially established in 2021, marking a significant milestone in China’s conservation strategy [20]. This accomplishment reflects China’s commitment to enhancing the value of national parks and strengthening the connection between people and nature, recognizing the importance of these protected areas in fostering harmonious coexistence and promoting sustainable development [21].
Currently, there is no universally accepted framework for evaluating the efficacy of conservation efforts of national parks [14]. Understanding the intricate interplay between ecological conservation and socio-economic development within and around national parks is vital for ensuring their long-term sustainability and effectiveness, thereby fostering harmonious coexistence between humans and nature [22]. The establishment of national parks initiates a multifaceted transformation of surrounding communities, encompassing changes in social, political, institutional, economic, and environmental spheres, which can have far-reaching consequences for local populations [8,23]. Despite their significance, national parks have been beset by conflicts with adjacent populations since the inception of the first national park establishment. Consequently, the effective management of these parks necessitates the cultivation of intricate relationships with local communities to mitigate conflicts and promote sustainable development [24].
To comprehensively evaluate the complex relationships within national park areas, a holistic approach that considers both ecological and socio-economic factors is essential. Habitat quality refers to the suitability of an environment for individuals or populations to survive in an ecosystem [14,25]. When evaluating the far-reaching consequences of establishing national parks, it is essential to consider the complex interplay between changes in habitat quality and local socio-ecological development, as well as any potential trade-offs or synergies that may arise. Studies have highlighted the importance of assessing the degree of harmony between humanity and nature within national parks to achieve sustainable coexistence [16]. By integrating national parks into wider regional and local development processes, parks can become more closely connected to their economic and social environments, fostering a culture of sustainability and promoting mutually beneficial relationships between humans and the natural world [26].
In the context of China’s endeavors towards creating a “Beautiful China”, the emphasis on establishing harmonious functional spaces for production, living, and ecology (PLE) offers a novel perspective for investigating national park management effectiveness [27]. This framework allows for a comprehensive understanding of the interplay between human activities and the ecological environment within national park areas [22]. By analyzing the dynamics of regional PLE space, researchers can study land use transitions and their eco-environmental effects, providing insights into the balance between human activities and nature conservation [28,29]. Studies in China have explored how PLE space’ evolution affects ecological factors, highlighting key influences on habitat quality [16,30]. Optimizing PLE space is crucial for sustainable land resource use and regional socio-economic development, emphasizing the need for the coordinated development of PLE space [31,32,33]. The identification and optimization of PLE space are considered essential for guiding the protection, utilization, and restoration of regional territorial space [34,35]. Furthermore, the spatiotemporal evolution of PLE space in different regions has been analyzed to understand the coupling coordination level and functional trade-offs within these spaces [36].
Human activities have a significant impact on habitat quality [14,19,30]. PLE space constitute the fundamental arena for the scope of human socio-spatial activity, serving as the primary carrier of economic and social development [37]. This interconnectedness is crucial for supporting human development while ensuring ecological and social system security [19]. In this context, it is imperative to conduct in-depth analysis and research on the relationship, coupling, and coordination among habitat quality and ecology, production, and living within national park areas.
Researchers have drawn upon both qualitative and quantitative identification methods to assess PLE space within the frameworks of land use [38,39] and ecological landscapes [32]. Qualitative methods typically leverage national land classification standards, identifying PLE space through the aggregation of land use types [40]. Conversely, quantitative methods rely on indicator systems that incorporate entropy methods, GIS spatial analysis, and the Coupling Coordination Degree Model (CCDM) for functional assessment and identification [31,39]. Notably, Point-of-Interest (POI) data have emerged as a valuable tool for delineating PLE space [34,41].
In summary, this study employs a comprehensive approach that combines spatial statistics, geographical detector analysis, and coupling coordination analysis to investigate three key research questions: (1) the spatiotemporal dynamics of habitat quality within national park areas; (2) the spatial variation in PLE space within these areas; and (3) the inherent relationships between habitat quality and PLE space. Through the exploration of these research questions, this study seeks to shed light on the dynamic transformations in human–nature interactions that have occurred following the establishment of Wuyishan National Park and provide insights for regional sustainable development.

2. Materials and Methods

2.1. Study Area

Wuyishan National Park encompasses a total area of 13,567.46 km2, referring to four county-level administrative units in Fujian Province, Wuyishan City, Jianyang District, Guangze County, and Shaowu City, as well as Yanshan County, Jiangxi Province (Figure 1). Wuyishan National Park harbors the most representative native subtropical forest ecosystems in the Zhejiang–Fujian coastal mountains of China and the most typical pristine subtropical forest ecosystems at the same latitude worldwide. Renowned as a repository of species genes and a source of biological model specimens, the park stands as a testament to the region’s rich biodiversity and ecological significance [42,43,44].
The national park occupies approximately 9.43% of the study area, with varying proportions within each administrative district (Table 1). Notably, Wuyishan contains the largest area of national park, followed by Yanshan, Guangze, Jianyang, and Shaowu. The surrounding counties and cities have a total population of 1,480,500 individuals (according to the 2023 Statistical Yearbooks of Shangrao City and Nanping City), with Yanshan boasting the largest population. This highlights the considerable pressure posed by the human population on the conservation efforts of Wuyishan National Park [14,21].
The establishment of Wuyishan National Park has precipitated a complex interplay between ecological conservation and local economic development, posing both challenges and opportunities for the districts within its boundaries [20]. In recognition of this dynamic interplay, this study focuses on the five districts involved in the design of Wuyishan National Park as its research area, intending to comprehensively analyze the far-reaching impact of the national park on the region.

2.2. Methods

This study focuses on the interplay between human activities and habitat quality, necessitating a thorough understanding of the former to effectively categorize PLE space [32,34,41]. Notably, land use and land cover (LULC) emerge as the primary influence on habitat quality [45], highlighting the imperative need to integrate PLE space in any thorough examination of habitat quality and its dynamics.
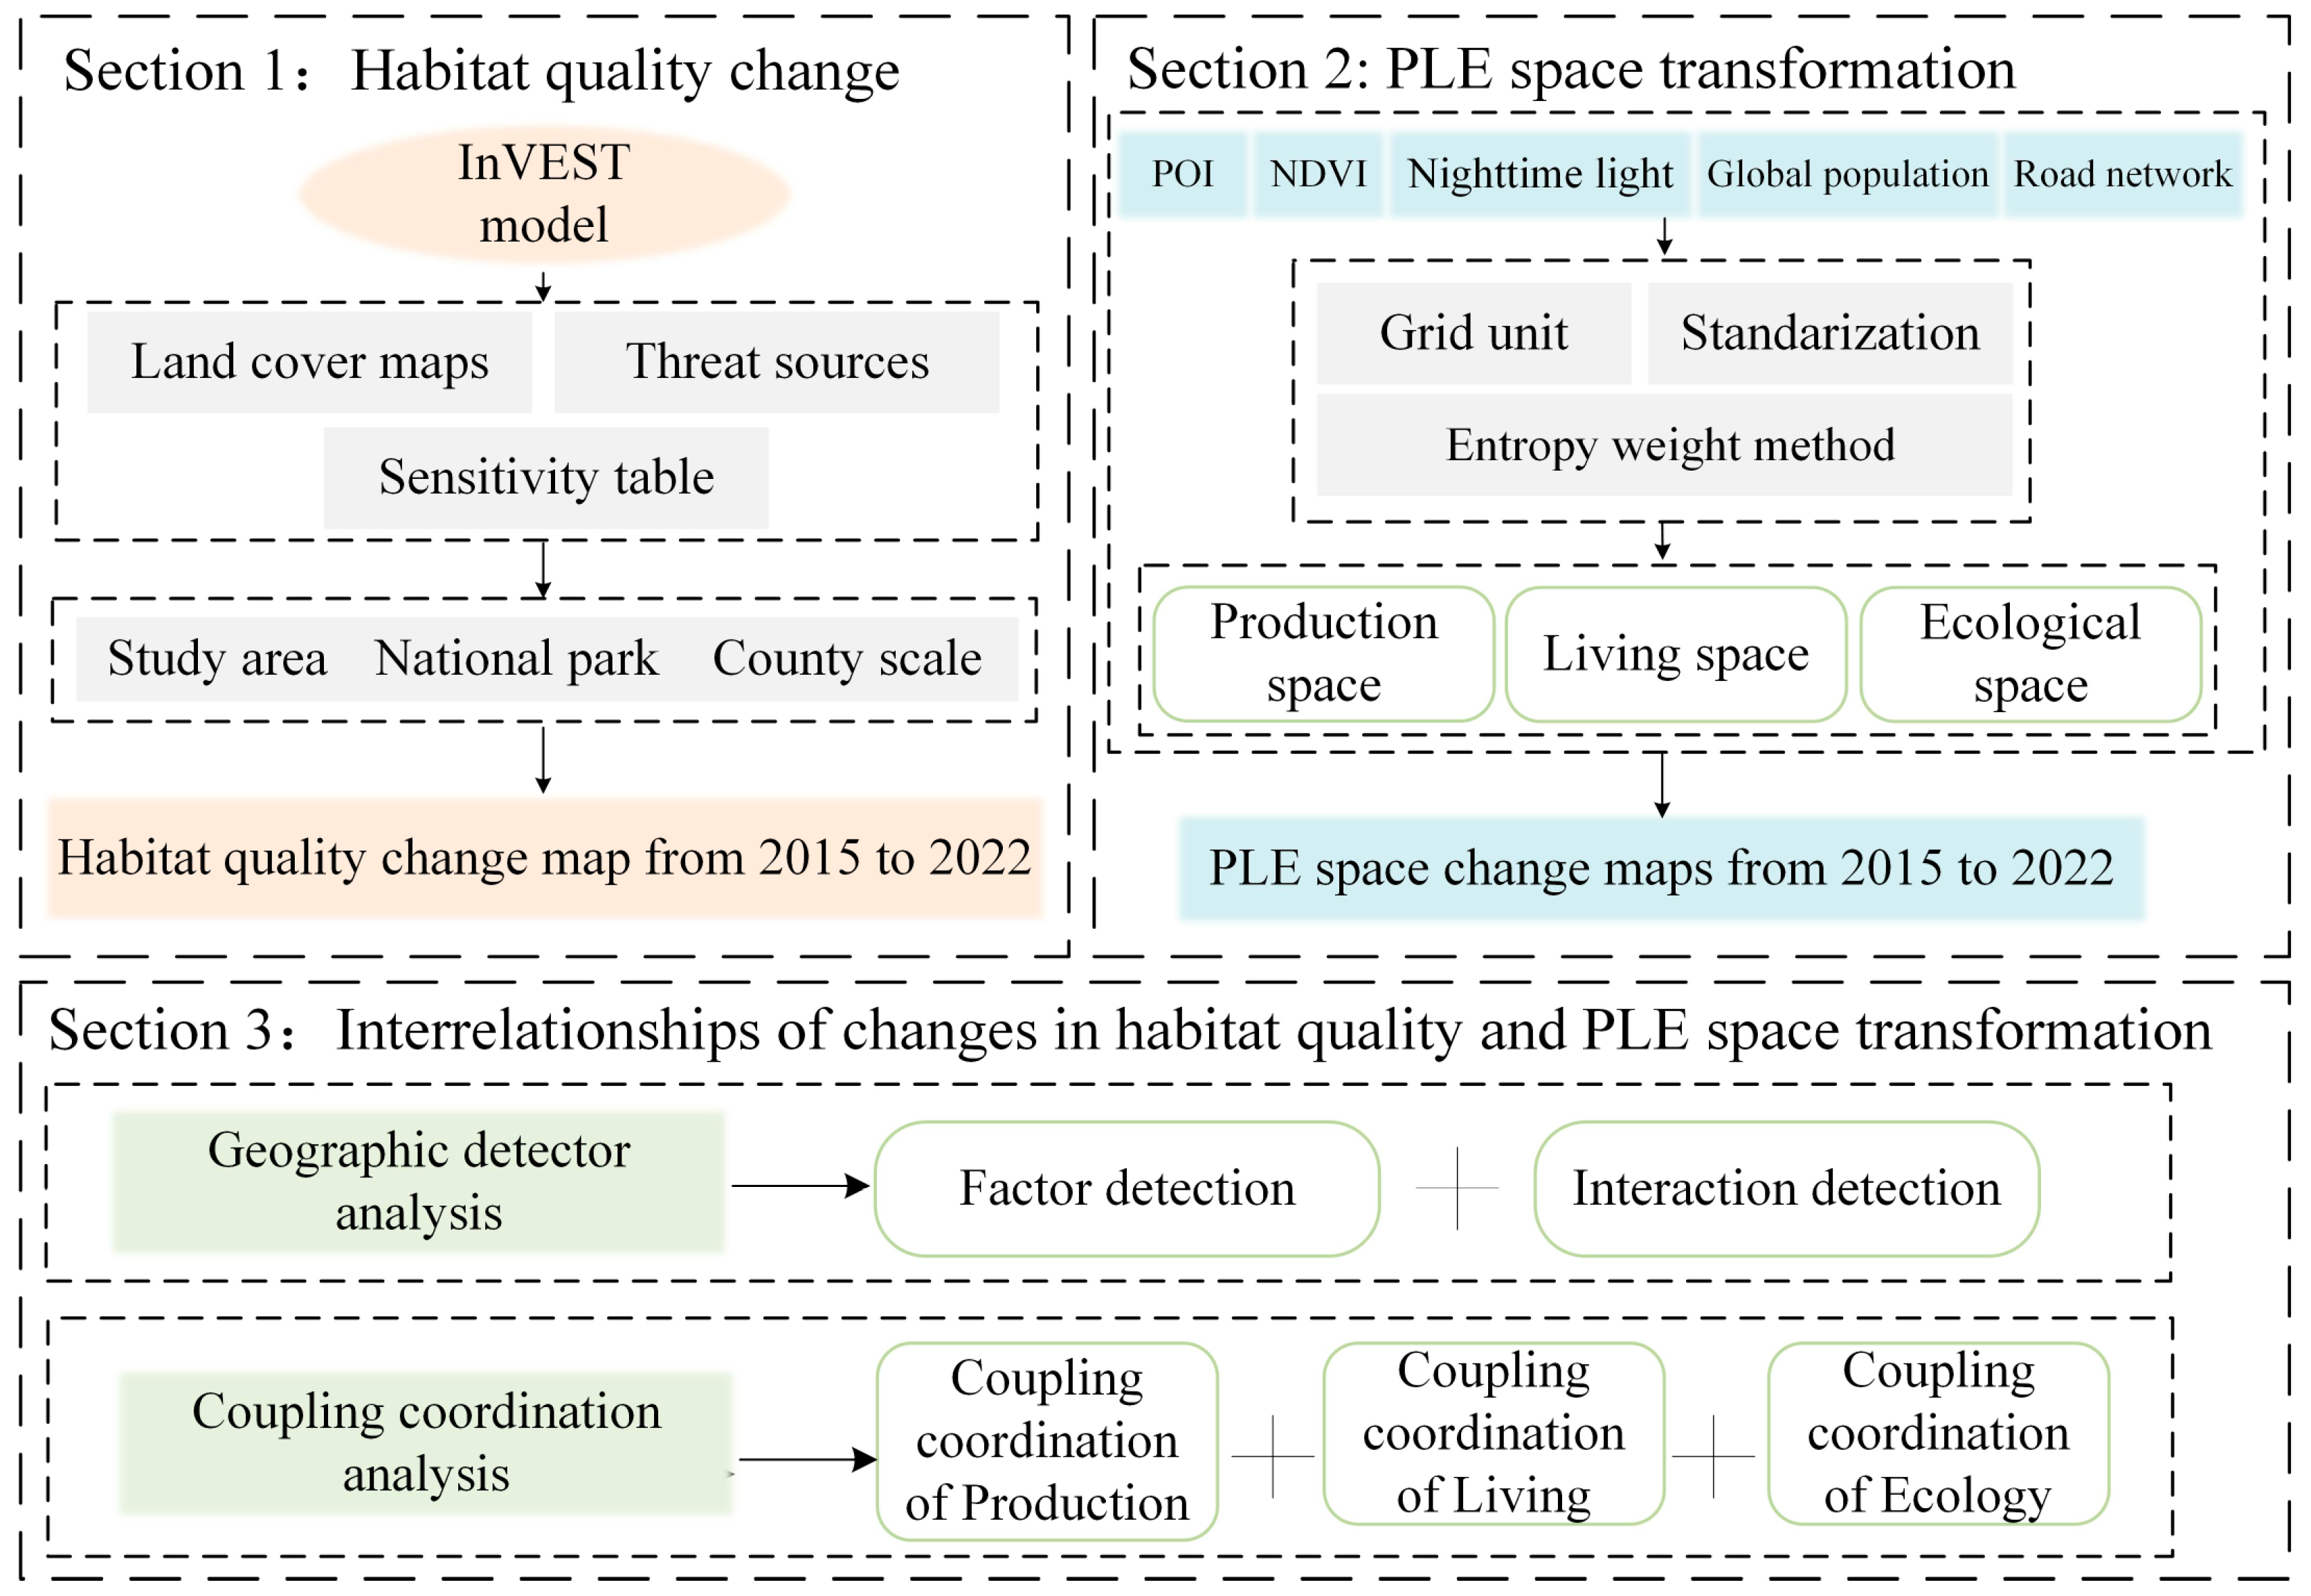
This study employs a multi-stage analytical approach, visualized in Figure 2. Section 1 utilizes the InVEST habitat quality model to quantify changes in habitat quality between 2015 and 2022. Subsequent variation analysis reveals differences across various spatial scales. Section 2 then employs the entropy weight method (EWM) to assign weights to PLE space indicators, followed by the identification of their transformation. Variation analysis, which uncovers differences across different spatial scales, is conducted here as well. Section 3 utilizes geographic detector and coupling coordination analyses to explore the interrelationships between these changes in habitat quality and PLE space.

2.2.1. Habitat Quality Model

The habitat quality model within InVEST 3.11 combines information on LULC and threats to biodiversity, yielding habitat quality maps that provide a quantitative assessment of ecological integrity. This model is primarily driven by LULC data, stress factors, species sensitivity to these factors, and other relevant parameters. Habitat quality was assessed using a 0-to-1 value range, where higher values (closer to 1) indicate superior habitat quality and lower values (closer to 0) signify lower habitat quality [25].

2.2.2. Calculating Indicator Weights to Identify PLE Space

This study utilized the EWM to calculate the weights of each indicator according to the information size of each indicator [28,46]. The entropy weight reflects the uncertainty associated with the system status; the greater the amount of useful information an indicator provides, the higher its corresponding weight will be. As an objective weight method, the EWM mitigates bias caused by subjective influence to a certain extent [38,47]. It is essential to acknowledge that various datasets exhibit distinct magnitudes and measurement units. Notably, each indicator forming PLE space demonstrates a positive correlation. To mitigate these influences, raw data must be standardized by employing the maximum normalization method, whose formula is as follows:
Y i j = 1 α + α X i j X m i n j X m a x j X m i n j
where Y i j denotes the standardized value; X i j represents the original value of the j t h indicator in grid i ; X m a x j and X m i n j signify the maximum and minimum values of the j th indicator, respectively; and α is typically set to 1. Subsequently, the EWM was employed to determine the weights of each indicator within the PLE space framework.

2.2.3. Landscape Pattern Calculation

Landscape metrics are algorithms that quantify specific spatial characteristics of patches and classes of patches [48,49]. Specifically, the connectance index reflects the functional linkages between landscape components. A well-structured landscape enhances these connections, resulting in a higher proportion of interconnected functional patches. This, in turn, facilitates the flow of ecological processes, including matter, energy, and information, across the landscape mosaic. The connectance index is calculated as follows [48]:
C O N N E C T = j = k n c i j k n i n i 1 2 × 100
c i j k = joining between patch j and k (0 = unjoined, 1 = joined) of the corresponding patch type ( i ), based on a user-specified threshold distance. n i = number of patches in the landscape of the corresponding class type. The CONNECT ranges from 0 to 100, with higher values indicating greater patch connectivity.

2.2.4. Geographical Detector Model

The geographical detector model is a widely used technique for spatial stratified heterogeneity analysis [50,51], enabling the exploration of its underlying driving mechanisms. Prior studies have relied on experience-based approaches to determine spatial data discretization and scale effects, lacking quantitative accuracy [25,52]. To address this issue, an optimal parameter-based geographical detector (OPGD) model was developed for more accurate spatial analysis [53]. Furthermore, an open-source software package, “GD 10.3” in R studio, was designed to facilitate the systematic computation and visualization of the OPGD model. In this study, the interaction and factor detectors were used to explore the factors affecting the spatial heterogeneity of habitat quality.
The factor detector employs a q statistic to quantify the relative importance of explanatory variables, where the q value compares the dispersion variances between observations in the entire study area and strata defined by the variables. Specifically, the q value for a potential variable υ is computed as follows:
q v = 1 1 N v 1 σ v 2 j = 1 M N v , j 1 σ v , j 2
where N v and σ v 2 are the number of and variance in observations within the entire study area, and N v , j and σ v , j 2 are the number of and variance in observations within the j th j = 1 , , M subregion of variable υ . The range of the q value is (0,1); a large q value means the relatively high importance of the explanatory variable. Furthermore, the F test is utilized to determine whether the variances of observations and stratified observations are significantly different.
The interaction detector identifies the interactive impacts of two spatially overlapped variables by analyzing the relative importance of interactions computed using Q values generated by the factor detector. A spatial interaction is defined as the overlay of two spatial explanatory variables. The interaction detector explores each interaction by comparing the q values of the interaction to those of its constituent single variables, thereby determining whether the combined effects are weakened, enhanced, or independent. The interaction detector explores five distinct interactions, including nonlinear weakening, uni-variable weakening, bi-variable enhancement, independence, and nonlinear enhancement [25,51]. Consequently, the interaction detector’s output includes both q values of interactions and the types of interaction effects.

2.2.5. Coupling Coordination Degree Model

The Coupling Coordination Degree model (CCDM) has emerged as a prominent tool within ecological environmental research in recent years. Its particular strength lies in evaluating the complex interactions between ecological, economic, and social systems. In this context, the CCDM offers unique advantages over other methods [28,54].
This study employs the CCDM to quantify the interrelationships between habitat quality and PLE space, examining the coupling coordination degree between any two of these variables. The formula for calculating this degree can be expressed as follows:
C 1 i = 2 H i · P i H i + P i 2 1 / 2 T 1 i = α 1 H i + α 2 P i C 2 i = 2 H i · L i H i + L i 2 1 2 T 2 i = α 1 H i + α 3 L i C 3 i = 2 H i · E i H i + E i 2 1 / 2 T 3 i = α 1 H i + α 3 E i
where H i represents the variation value of the habitat quality i , P i represents the variation value of production space i , L i represents the variation value of living space i , and E i represents the variation value of ecological space i . Then, C represents the coupling degrees between habitat quality and production space, habitat quality and living space, and habitat quality and ecological space, respectively. To quantify the coordination among the three pairwise, we introduce the coordination degree T . This study assumes that habitat quality and PLE space are equally important in the coupling and coordinating development process, hence it adopts the coefficient values of α 1 = α 2 = α 3 = 1 / 2 , as previously suggested [28].
The coupling and coordination degree D among habitat quality and PLE space is represented by the following:
D = C × T

2.3. Data Source and Pre-Processing

This study focuses on the pre- and post-establishment phases of the national park, conducting a comparative analysis between 2015 and 2022. This study extracted Point-of-Interest (POI) data from the Amap service in 2015 and 2022. Leveraging the POI classification system employed by Amap, we identified relevant data pertaining to PLE space, which encompass ten categories: company and factory, accommodation service, daily life service, education service, healthcare service, shopping service, restaurant service, residential district, leisure service, and tourism service. The number of POIs within these categories exhibits a significant increase from 28,263 in 2015 to 41,494 in 2022. Although data discrepancies may arise due to variations in collection techniques and methods, this trend suggests the dynamic evolution of human activities within the region.
This study prioritizes the examination of three interrelated dimensions to conceptualize and evaluate the quality of PLE space, thereby establishing a theoretical framework: Firstly, we consider production space as a function of intensive input and efficient output, highlighting the crucial role of resource allocation in facilitating productive activities. Secondly, living space are evaluated based on factors such as comfort, convenience, safety, and healthiness, acknowledging the importance of these aspects in supporting human well-being. Lastly, ecological green space is examined to understand their contribution to environmental sustainability.
To effectively characterize the spatiotemporal dynamics of PLE space, while acknowledging the limitations imposed by data availability constraints, this research employs a multi-source dataset, comprising POI information, Normalized Difference Vegetation Index (NDVI), nighttime light, OpenStreetMap (OSM) road network, and LandScan Global population. This study employs the entropy weight method to determine the relative importance of each indicator, thereby enabling the calculation of robust and informative values of PLE space (Table 2). Within this framework, POIs are analyzed using kernel density estimation. The data are then standardized, and thematic maps are generated to visualize the spatial distribution of POIs.
Habitat quality was assessed using the GLC_FCS30D dataset [58]. This dataset represents the first global product offering fine-scale land cover dynamics at a 30-meter resolution. It utilizes a continuous change detection approach and incorporates a refined classification system encompassing 35 land cover categories. The dataset covers a comprehensive timeframe, spanning from 1985 to 2022. The annexes in Appendix A (Table A1 and Table A2) provide information on threat sources and habitat sensitivity parameters which were used in the module of InVEST habitat quality [25].
This study used ArcGIS pro 3.0 to process vector data values of multi-source datasets in 2015 and 2022. Focused on changes over time, we performed raster minus calculation to elucidate the spatial–temporal character of habitat quality and PLE space. To accommodate varying spatial resolutions, a 1 km × 1 km vector grid was made to cover the entire study area and divide the spatial data into grid units [59]. For each 1 km × 1 km vector grid unit, we quantified the variation in habitat quality, as well as production, living, and ecological space values. Maps illustrating the spatial patterns of these variations were then generated.

3. Results

3.1. Variation Analysis of Habitat Quality

Using the habitat quality model from InVEST, this study assessed habitat quality in the study area for the years 2015 and 2022, generating habitat quality distribution and variance maps (Figure 3). As illustrated in Figure 3a,b, the habitat quality surrounding Wuyishan National Park showed a significant improvement between 2015 and 2022, particularly in densely populated areas. This change is further highlighted by the difference in habitat quality between the two years (Figure 3c). As shown in the figures, habitat quality has markedly improved in most of the Wuyishan region, with stable habitat quality observed within the national park and its adjacent northern area. Areas exhibiting declining habitat quality are scattered throughout due to potential impacts from related construction activities.
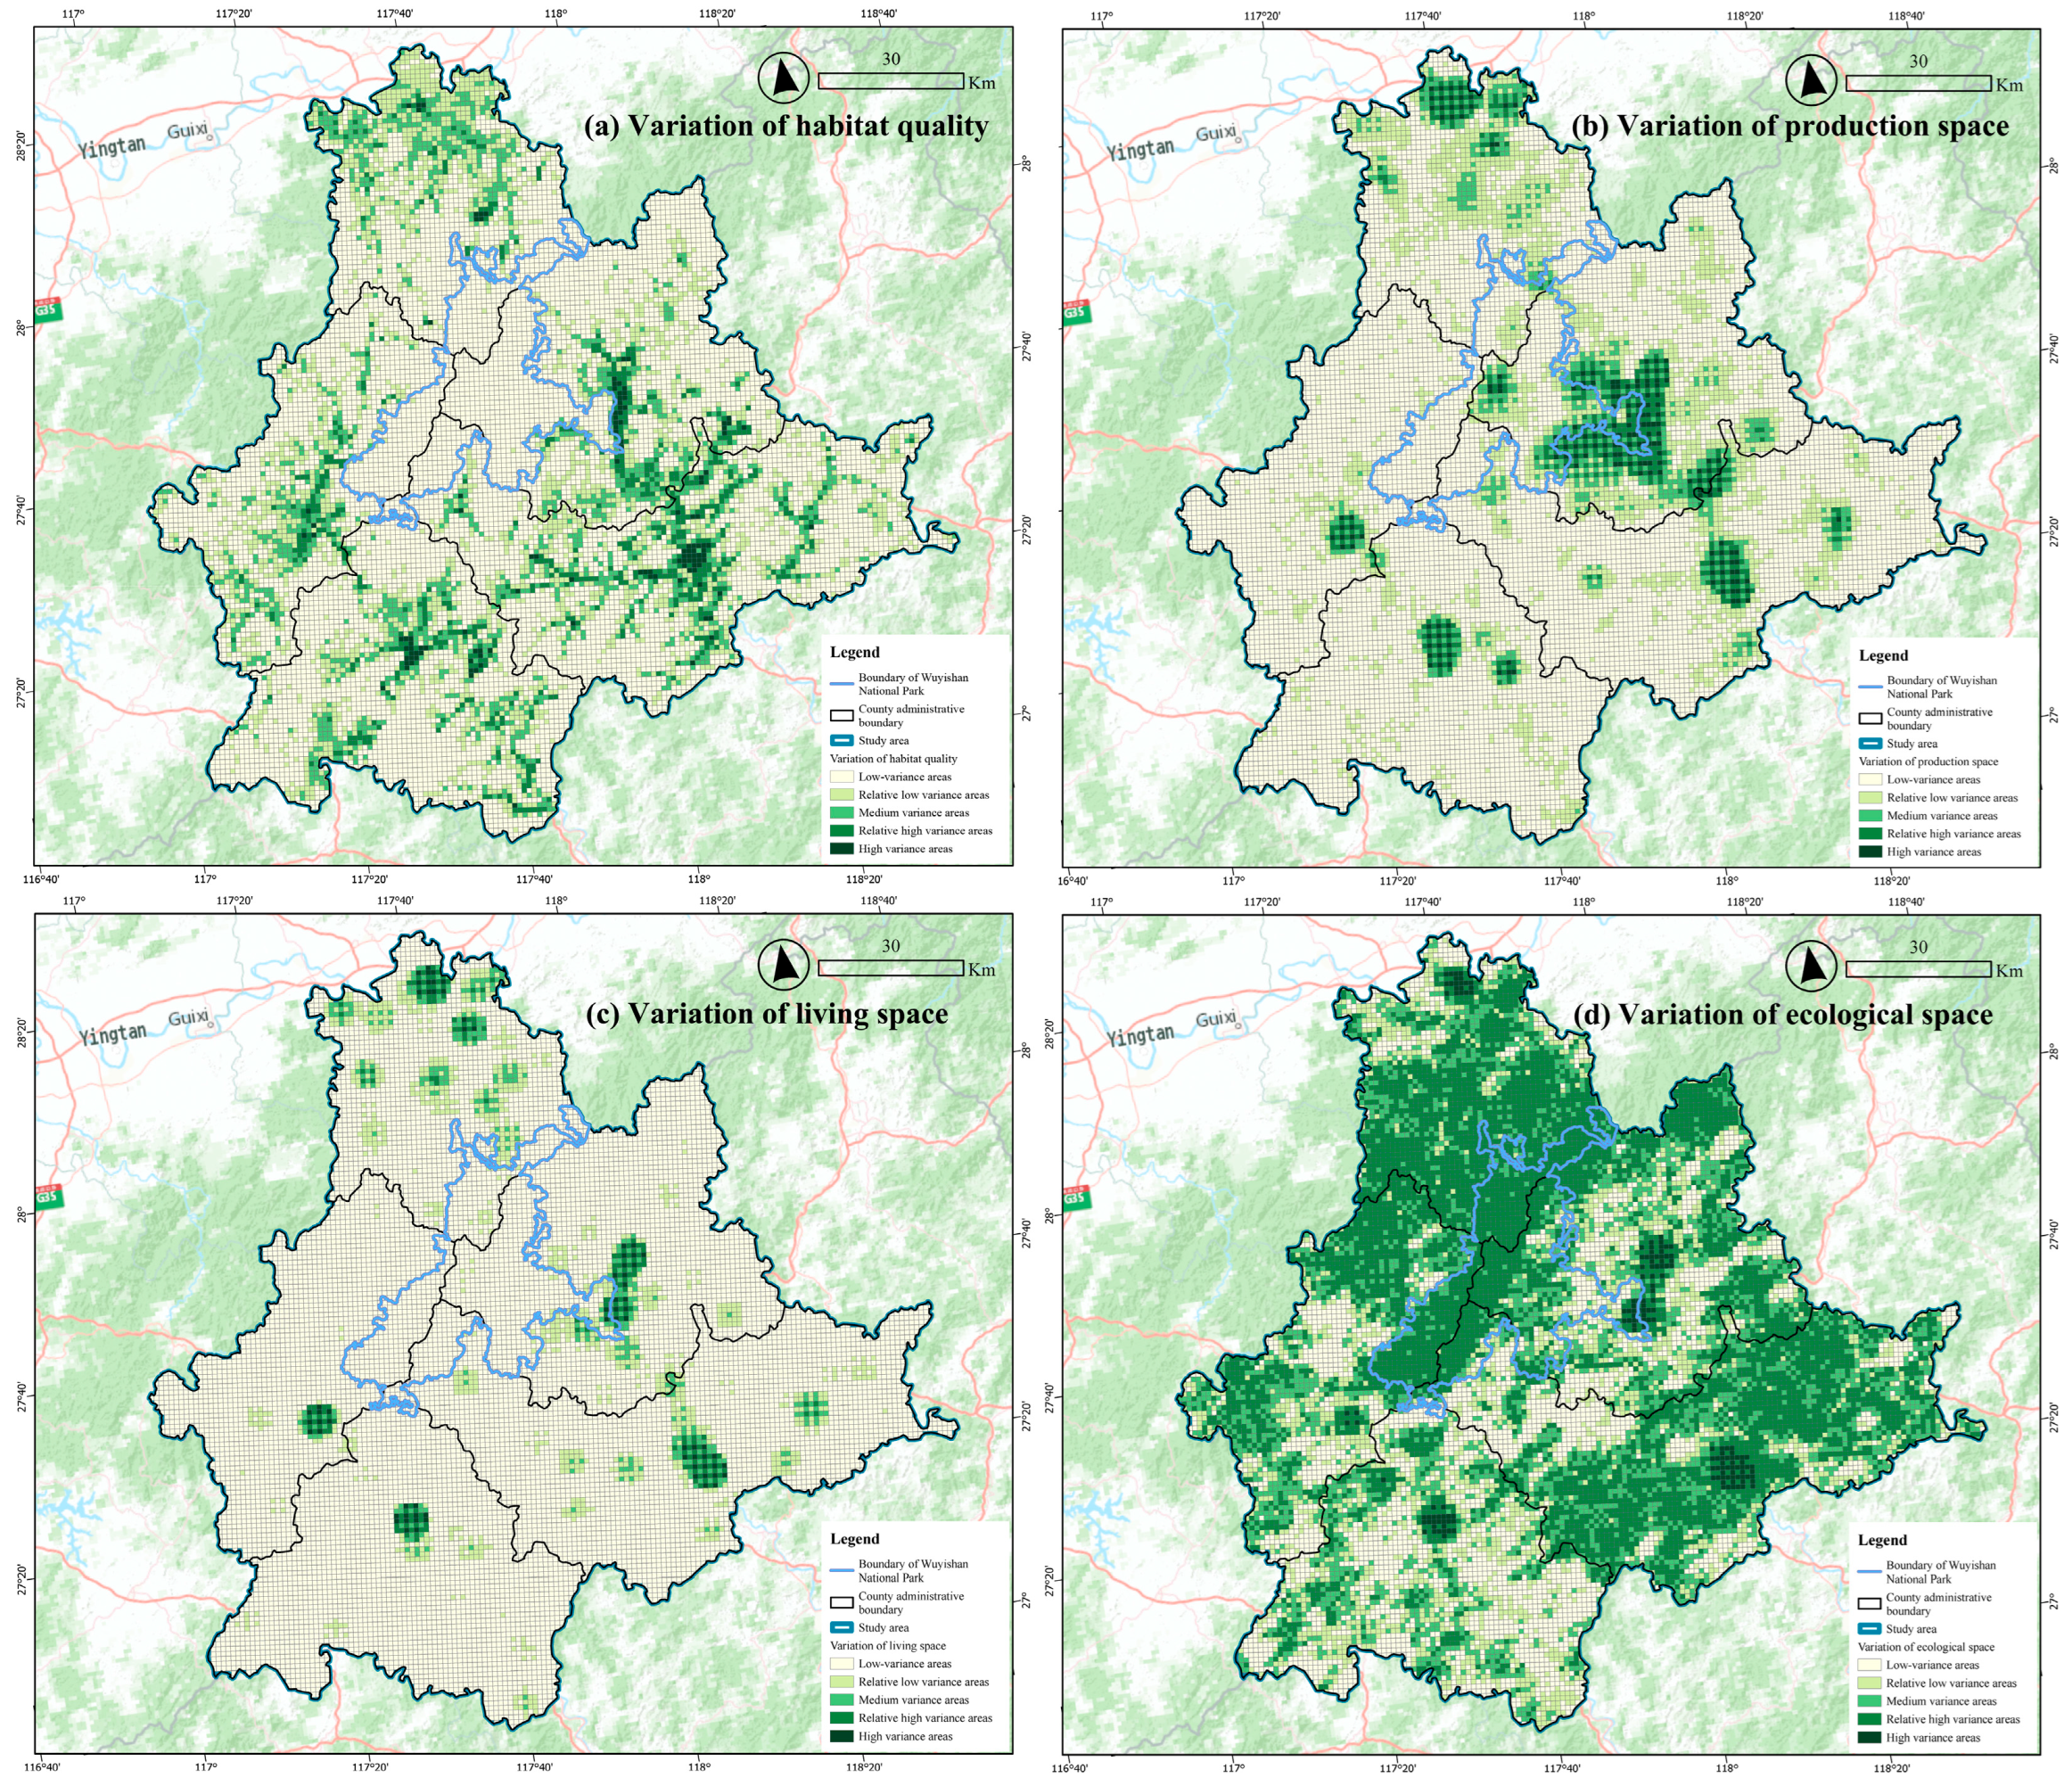
To further examine the extent of habitat quality changes and understand the ecological impact of the national park, this study used a 1 km × 1 km grid and normalized the changes for each category. By applying the natural breaks method, the changes were divided into five categories, creating a habitat quality change map (Figure 4a). The magnitude of change within the national park was generally low. Most changes occurred in densely populated areas, where government initiatives like urban greening and ecological restoration have greatly enhanced environmental quality. These efforts are in line with the “Beautiful China” strategy.
To better understand the spatial distribution of habitat quality changes, this study calculated the proportion of changes within the entire study area, within individual counties, and both inside and outside the national park. Figure 5a reveals that a substantial portion (62.81%) of the study area exhibited low variance in habitat quality changes. This was followed by relatively low-variance (20.89%), medium-variance (10.84%), and significantly lower proportions of relatively high-variance (4.54%) and high-variance (0.91%) areas.
Habitat quality changes significantly differed between areas inside and outside the national park. Changes were predominantly concentrated outside the park, with a substantial decrease in the proportion of low-variance areas (12.46%) and a near absence of other variance categories (relatively low: 0.35%; medium: 0.07%) within the park.
County-level variations were also evident. Jianyang displayed the highest proportions across all change categories, likely due to its larger administrative area. Conversely, Guangze and Shaowu had lower proportions. High-variance areas were primarily concentrated in Jianyang (41.13%), Wuyishan (24.19%), and Shaowu (23.39%). Most counties, except Yanshan (8.58%) and Guangze (13.27%), exhibited a higher prevalence of relatively high-variance areas. Spatial variations in other change categories were less pronounced.

3.2. Variation Analysis of Production-Living-Ecological Space

To uncover spatial changes in PLE space, this study integrated multiple indicator layers and employed the entropy weight method to construct and identify the change characteristics of each functional space. Additionally, we analyzed the spatiotemporal patterns, spatial scales, and landscape pattern characteristics of the changes in PLE space.

3.2.1. Spatial Analysis of PLE Space Variation

This spatial analysis used a differential comparison of the layers of PLE space from 2015 and 2022 to produce maps showing the changes across the Wuyishan region. As revealed by Figure 4b, changes in production space are predominantly of low value. High-value areas are concentrated in county administrative centers, particularly in Wuyishan. This pattern aligns with the region’s dominance in the tea industry and its well-developed tourism sector, both of which are concentrated in Wuyishan. The agglomeration of these industries has intensified following the establishment and increased prominence of the national park. Notably, substantial changes are observed within the national park’s development zones, especially along its eastern fringes.
An examination of the map (Figure 4c) reveals that areas with high living space change values are primarily distributed within urban areas, exhibiting a dispersed pattern. Yanshan displays a higher concentration of high-value areas compared to other counties. Similar to production space, the northeastern fringe of the national park exhibits elevated living space change values. Driven by factors such as population relocation, industrial clustering, and tourism development, this region has experienced an intensification of living space, which could potentially impact the protection of the national park and necessitate appropriate regulation.
Spatial analysis of the data (Figure 4d) reveals that ecological space has undergone significant changes. High-value ecological areas exhibit a substantial proportion and a concentrated distribution. Notably, the establishment of the national park has not only enhanced protection efforts within its boundaries but has also demonstrably improved the ecological environment of surrounding regions. This improvement has resulted in a continuous expansion of recreational and leisure space for the population.

3.2.2. Multiple Scale Analysis of PLE Space Variation

To delve deeper into the spatial distribution of these variations, this study conducts a more detailed analysis of their quantitative variations. Additionally, it calculates the proportion of changes in PLE space across the entire study area, within individual counties, and both inside and outside the national park.
As illustrated in Figure 5b, the detailed analysis of statistical results for production space changes reveals a general correspondence with the ranking of habitat quality changes. Specifically, areas with low variance exhibit the highest degree of change in production space, while areas with high variance exhibit the lowest degree of change. The production space within the Wuyishan region is primarily composed of low-variance areas (69.41%) and relatively low-variance areas (19.94%), with the smallest proportion being high-variance areas (1.46%). Production space changes within and outside the national park exhibit significant differences, with the majority of changes occurring outside the park. Marked variations in production changes are observed across different counties. The distribution of low-variance areas is relatively even, while the distribution of other categories shows greater disparity. Excluding low-variance areas, Wuyishan displays the greatest magnitude of change across all remaining categories. Conversely, Guangze exhibits a minimal level of change. Shaowu and Guangze have the lowest proportions of medium-, relatively high-, and high-variance areas.
Similarly, this study calculated the proportion of changes in living space at multiple scales (Figure 5c). The detailed analysis of the statistical results for living space changes indicates that low-value areas account for most changes (87.38%). Consistent with the ranking observed for habitat quality and production space, these changes are ordered from low-variance areas to high-variance areas. Living space changes within and outside the national park exhibit significant differences, with the proportion of each change category within the park consistently below 10%. Moreover, statistical results at the county level reveal significant variations across counties. Notably, the distribution of relatively low-variance areas and medium-variance areas shows considerable disparity, with Shaowu and Guangze exhibiting proportions below 10% for both categories.
Furthermore, this study quantified the proportion of ecological space changes at multiple scales (Figure 5d). Analysis of the statistical results reveals a dominant pattern in ecological space changes. Relatively high-variance areas constitute the largest proportion (37.17%), followed by medium-variance areas (24.78%), low-variance (20.03%), and relatively low-variance areas (17.58%), with high-variance areas (1.16%) being the least prevalent. In addition, the distribution within the national park is limited, with only medium-variance areas exceeding 10% (14.56%). The remaining categories hover around 5%, suggesting a concentration of significant ecological changes outside the park boundaries. Significant variations are observed at the county level. Wuyishan (36.54%) and Jianyang (31.40%) exhibit the highest proportions of high-variance areas. Relatively high-variance areas are concentrated in Jianyang (30.95%) and Yanshan (24.93%). The distribution of medium-variance areas is relatively even across counties, with Jianyang again holding the highest proportion (28.38%). Shaowu demonstrates the highest proportions for both low-variance areas (39.37%) and relatively low-variance areas (31.37%). Interestingly, Shaowu also has the lowest proportion of relatively high-variance areas (6.53%), and Guangze exhibits the lowest proportion of high-variance areas (2.56%). Yanshan has the lowest proportion of low-variance areas (6.56%).

3.2.3. Connectivity Analysis of PLE Space Variation

This study evaluated the spatial continuity of the national park’s impact on Wuyishan’s landscape using the connectance index (CONNECT) (Figure 6). The analysis revealed significant spatial heterogeneity in connectivity, with variations across the entire study area, individual counties, and within versus outside the national park boundaries.
Across the entire study area, landscape connectivity for production space variation remains consistently low, with all change levels exhibiting values below 0.6% (Figure 6a). Spatially, CONNECT is demonstrably higher outside of the national park, exceeding 1% for all levels except the low-variation areas. This suggests a more pronounced transformation of production space outside the park’s boundaries. Examining county-level variations, Shaowu and Guangze display significantly higher connectivity values for relatively high-variance areas (6.20% and 13.04%, respectively). Conversely, Wuyishan, Jianyang, and Yanshan exhibit consistently low connectivity values across all levels. This inconsistency highlights a divergence between the extent of production change and landscape connectivity. A larger area of variance does not necessarily translate to higher connectivity, implying a dispersed distribution of these changes.
As illustrated in Figure 6b, the CONNECT of living space variance remained below 1% for all levels except for the relatively high-variance areas. Connectivity values for living space were generally higher outside the national park, particularly in the medium- and relatively high-variance areas, both of which were at 33.33%. However, the connectivity value in the high-variance areas was 0, indicating a lack of continuity in areas experiencing intense change. At the county level, Shaowu and Guangze again exhibited high connectivity, with Shaowu’s relatively high connectivity reaching 14.29%. Guangze’s connectivity in the high-variance areas was also 0. Notably, living space changes within the study area were concentrated outside the park and exhibited continuity across counties, resulting in higher overall connectivity values compared to county-level results.
An examination of CONNECT for ecological space changes (Figure 6c) reveals generally low values, with only the high-variance areas exceeding 1% (2.24%). Interestingly, this pattern of low connectivity value is particularly pronounced within the national park. Conversely, outside the park, where ecological improvements are most significant, the connectivity value of high-variance areas reaches 25.45%. This spatial heterogeneity is further emphasized by county-level variations. Shaowu and Yanshan exhibit high connectivity values for the high-variance areas, at 15.08% and 20.53%, respectively. Guangze, on the other hand, displays the least extensive landscape connectance for ecological space changes.

3.3. Geographic Detector Analysis of Habitat Quality Change and PLE Space Transformations

To investigate the interplay between habitat quality changes and PLE space transformations, this study employed the OPGD model. Habitat quality change was treated as the dependent variable, while each dimension of PLE space change was considered an independent variable. Through factor detection analysis within the OPGD framework, this study identified a significant positive association between all PLE space dimensions and habitat quality changes, although the effect sizes were relatively weak (Table 3). Notably, changes in production space exhibited the strongest influence on habitat quality change compared to the other PLE dimensions.
To gain a more comprehensive understanding of how interactions between the various dimensions affect habitat quality changes, interaction detection analysis was utilized. Analyses indicated that PLE space dimensions interact to influence habitat quality changes in a synergistic manner. The interaction between production and living space exhibited the strongest effect (0.28), followed by living and ecological space (0.27) and production and ecological space (0.23).

3.4. Coupling Coordination Analysis of Habitat Quality Change and PLE Space Transformations

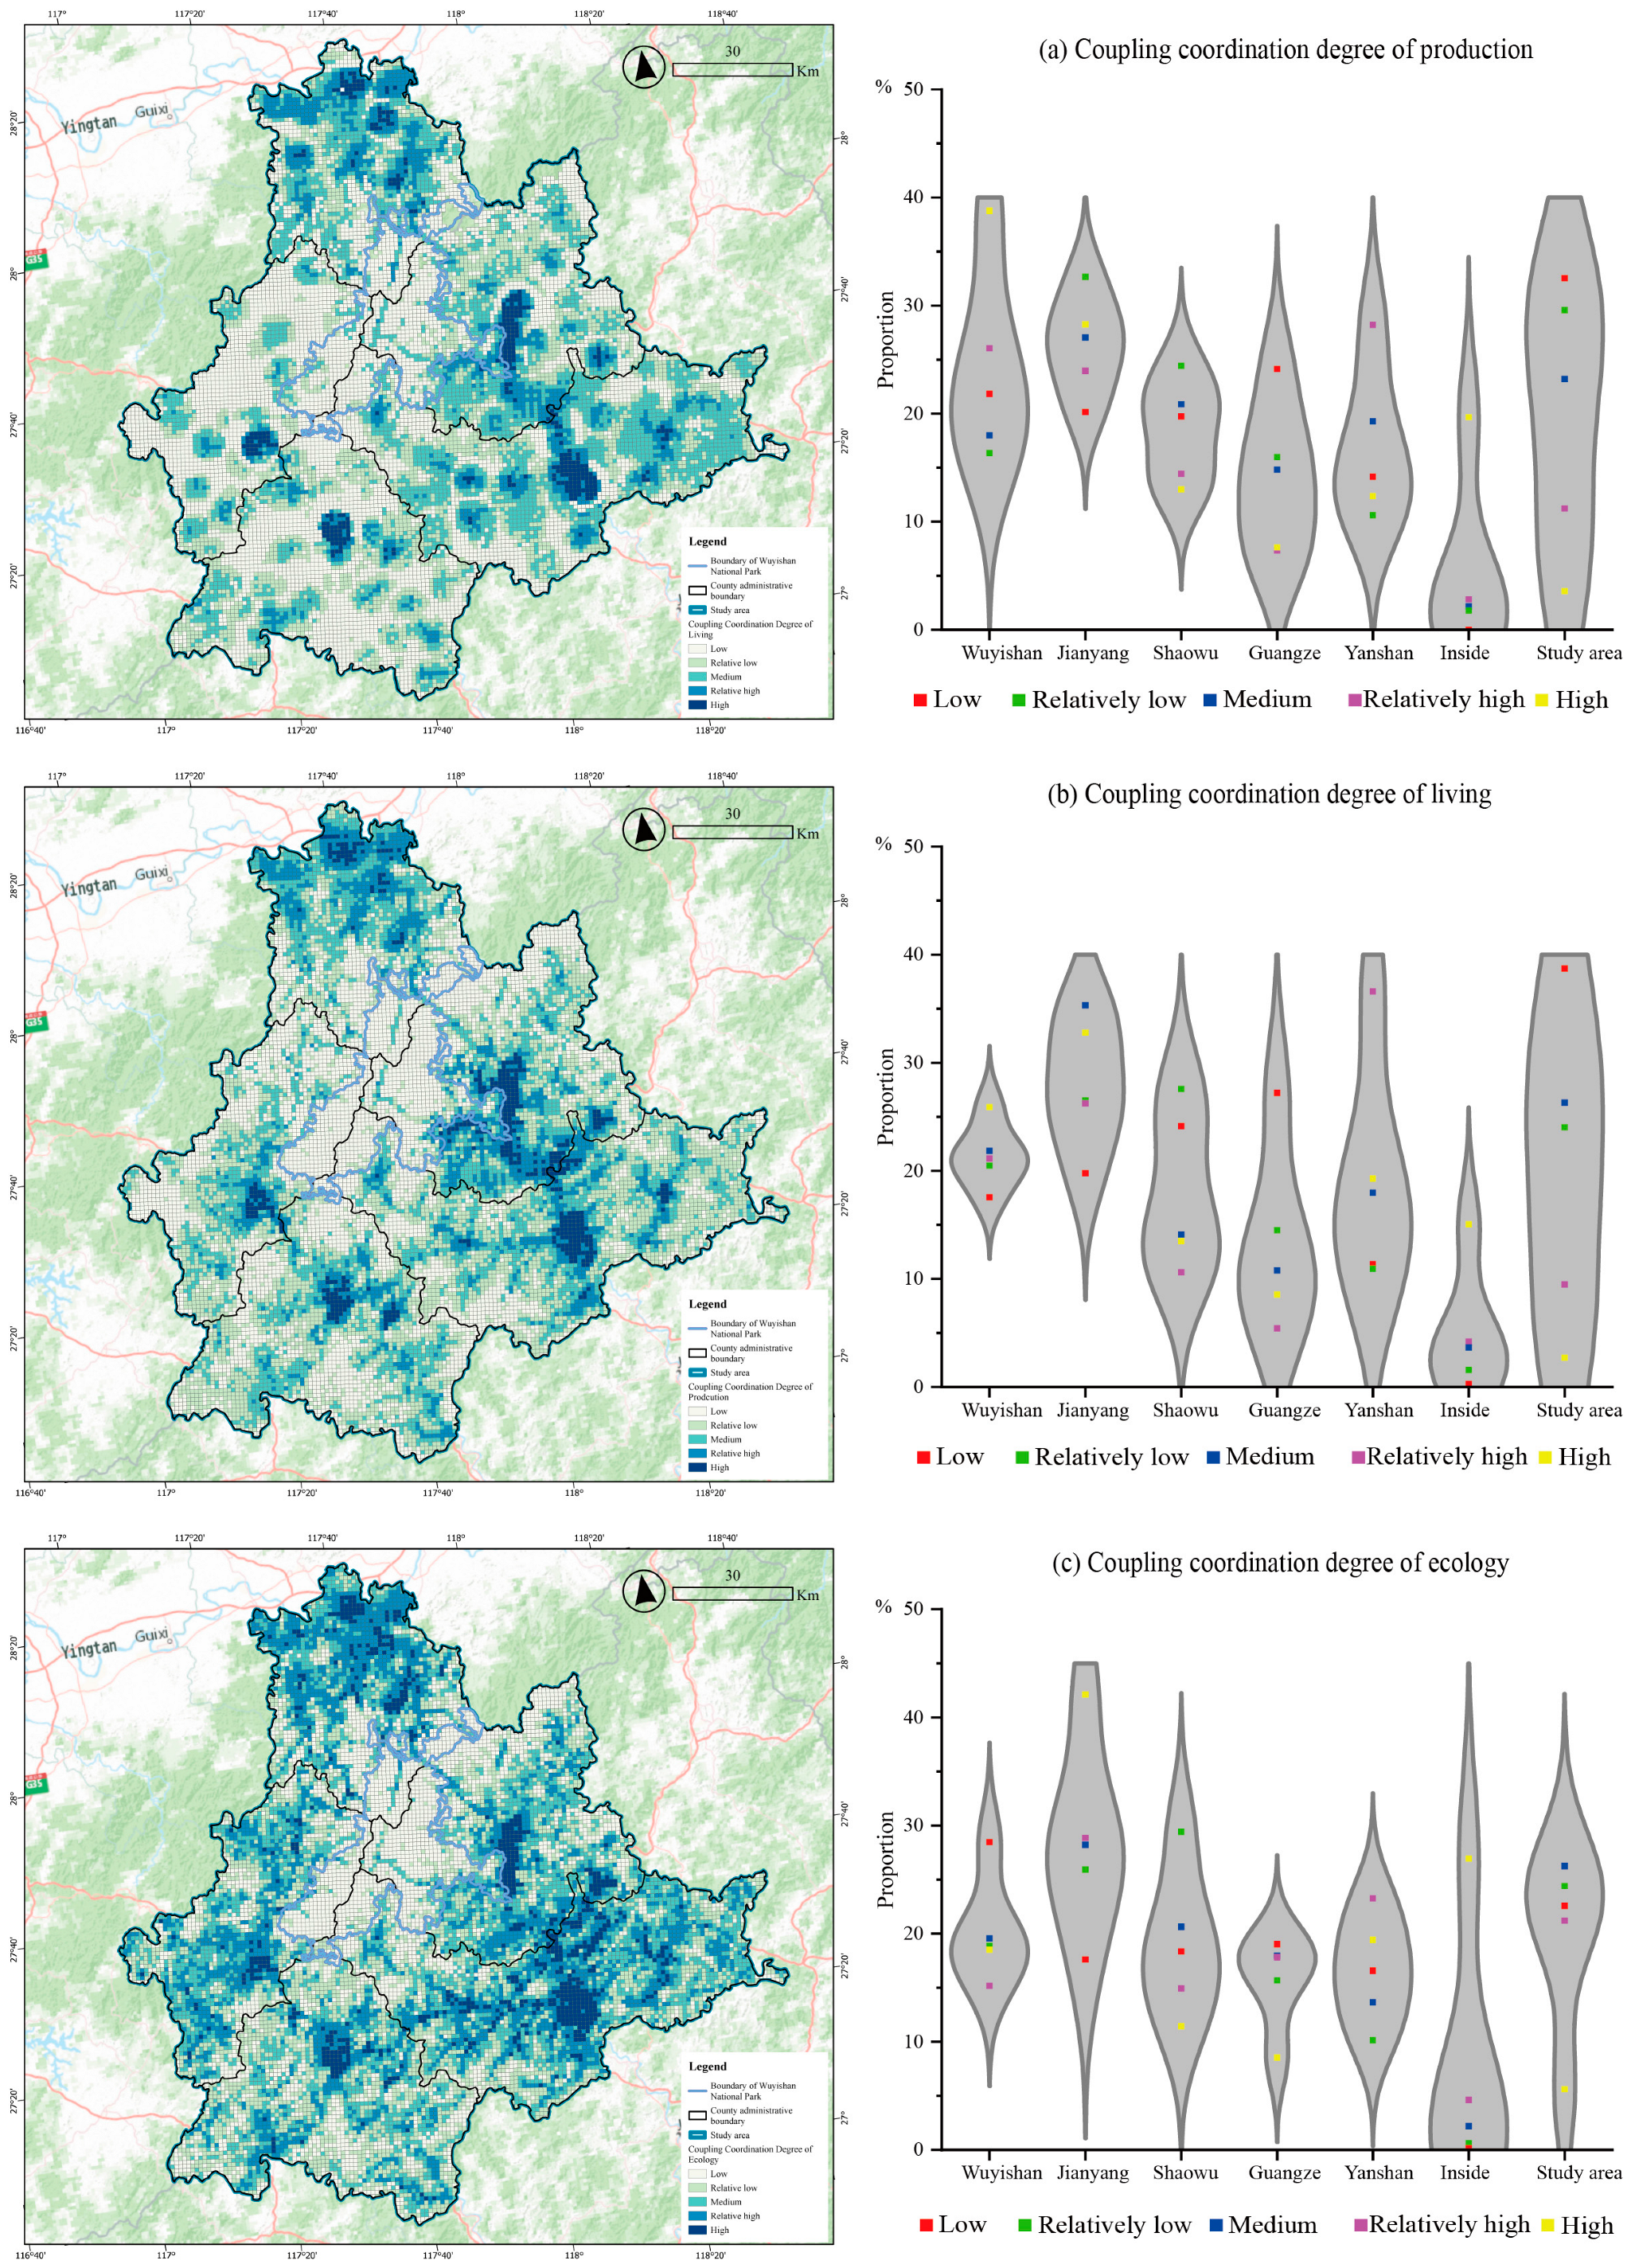
National parks are established to achieve harmony between humans and nature, enhance ecological protection within them, and simultaneously elevate the social, economic, and ecological well-being of surrounding communities. To comprehensively assess the overall impact of Wuyishan National Park on regional development, this study employs a novel approach by measuring the coordination coupling degree between habitat quality changes and PLE space transformations (Figure 7).

3.4.1. Coupling Coordination Degree of Production

To reveal the spatial heterogeneity of the coupling coordination of production, this study utilized the natural breaks method to categorize the coupling coordination degree into five classes: high, relatively high, medium, relatively low, and low (Figure 7a).
The figure illustrates the spatial distribution of the coupling coordination of production. High-value zones (exceeding 0.5) are concentrated around Wuyishan National Park, particularly within the urban areas of Wuyishan and Jianyang, which aligns with the broader goal of national parks to foster socio-economic development in surrounding areas. The lower coordination degree within the park likely reflects the prioritization of strict conservation measures. Additionally, the statistical result presents the coupling coordination degrees of production in the Wuyishan region. The percentages exhibit a clear decreasing trend, with the highest value (32.52%) belonging to the “low” category. Notably, the proportions of relatively high and high coordination degrees are minimal. A significant disparity exists in coordination degrees between the park and surrounding areas. The national park is dominated by the low category (around 20%), with all other categories falling below 5% and concentrated primarily outside of the park. This spatial distribution aligns perfectly with the core principles of national park establishment. Examining county-level data reveals minimal variation in coupling coordination degrees. Wuyishan exhibits the largest proportion of high coupling coordination degrees (38.76%), while Guangze shows the lowest proportions for both the relatively high and high categories (both below 8%).

3.4.2. Coupling Coordination Degree of Living

Building upon the analysis of coupling coordination with production space, this study produced a coupling coordination degree map illustrating the relationship between habitat quality changes and living space changes (Figure 7b). The high-value areas of coupling coordination display a discrete, point-like distribution that corresponds with population distribution. This pattern indicates, to some extent, that the establishment of national parks has contributed to improving residents’ well-being.
An analysis of the statistical result reveals limited high-value (2.7%) and relatively high-value (9.48%) zones for the coupling coordination of living within the Wuyishan region, highlighting the need for improvement. Furthermore, apart from the low coupling coordination category, all other categories within the park fall below 5%, possibly due to the concentration of residents outside the park boundaries. In addition, the county-level distribution shows relative uniformity, with Guangze exhibiting the lowest proportions for both relatively high and high categories (both < 10%). Jianyang leads in high coupling coordination (32.78%), while Yanshan tops the relatively high category (36.61%).

3.4.3. Coupling Coordination Degree of Ecology

Building upon the previous analysis, Figure 7c illustrates the relationship between habitat quality changes and living space changes. The figure reveals a relatively uniform distribution of coupling coordination for ecological space, with a notable pattern around the national park. This spatial distribution suggests that the establishment of the park has positively impacted the ecological environment in adjacent areas, potentially leading to improved coupling coordination. Conversely, high-coupling-coordination zones are concentrated in urban areas, likely due to the higher intensity of human activity that can influence ecological space. Within the park boundaries, the lower human activity translates to a predominance of low coupling coordination.
As shown in the figure, the coupling coordination degree of ecology across most categories exhibits a spatially balanced distribution at over 20%, with the exception of the high-coordination category (5.6%). However, a distinct spatial pattern emerges when considering the park boundaries. Low coupling coordination dominates within the park (26.93%), while all other categories fall below 5%. Conversely, the county-level analysis reveals a generally balanced distribution of coupling coordination. The key spatial variation lies in the high-coupling-coordination zones, with Jianyang boasting the highest proportion (42.13%) and Guangze exhibiting the lowest (8.53%).

4. Discussion

The establishment of national parks has various consequences for the surrounding areas, with the regulation of human activities playing a crucial role [17,60,61,62]. This regulation not only affects the quality of habitats but also influences the structure of production, living, and ecological space. Wuyishan National Park, situated in a region with high human activity levels, has undergone significant changes [21,27,63].
To comprehensively evaluate the national park’s impacts on the Wuyishan region in terms of mechanisms and spatial extent, this study takes a PLE space perspective. By analyzing multi-source data, this study examined the spatial characteristics of variations in habitat quality and PLE space across the Wuyishan region. Additionally, through the integration of geographical detection and coupling coordination analysis, this study investigated the inherent connections and levels of coupling coordination between changes in habitat quality and transformations of the PLE space.

4.1. Habitat Quality Change

This study reveals a significant impact of national park establishment on Wuyishan’s habitat quality, with a distinct spatial pattern. The changes are most pronounced in areas surrounding the park. Overall, the improvement in habitat quality across the Wuyishan region is primarily characterized by low-variance areas. Additionally, densely populated areas, particularly urban districts, exhibit predominantly high levels of improvement. Furthermore, substantial variations are observed among different counties, highlighting the county-level heterogeneity in the impact of national park establishment on habitat quality. These findings corroborate previous research indicating the positive influence of national parks on habitat conservation [14,30]. However, the spatial heterogeneity of these impacts underscores the importance of considering human activities and local socio-economic factors when evaluating the effectiveness of national park establishment in promoting habitat quality improvement [4,19].

4.2. PLE Space Transformations

This study further elucidates the complex relationship between human activities and national parks by analyzing three functional spaces that reflect human activities, namely production, living, and ecological spaces [35,39]. The regulation of human activities by national parks has influenced the spatial pattern of PLE space, manifesting as its spatial transformation. This study employed the entropy weight method to construct PLE space layers by integrating multiple factor indicators. Analysis of the characteristics of PLE space changes revealed that these changes were primarily concentrated outside the national park.
The study of changes in PLE space further elucidates the spatial pattern of the impact of national parks. Through the analysis of spatial change patterns, multi-scale assessments, and landscape characteristics, this research consistently confirms the spatial heterogeneity of national park impacts. This heterogeneity is evident both within and outside the national park, as well as among different county-level administrative regions, with changes in these functional spaces being relatively minor and predominantly at low levels. Changes in ecological space are the most uniform, while production and living spaces are concentrated in low-variance areas. The establishment of the national park has significantly enhanced the ecological space in the Wuyishan region, with particularly notable changes observed in areas surrounding the park. Habitat quality results corroborate this pattern, highlighting the most pronounced ecological changes. Substantial variations are also observed at the county level and between the park’s interior and exterior. In addition, the influence of the national park primarily radiates toward the northern and eastern regions.
The analysis of connectance in the variations reconfirmed the significant spatial heterogeneity of the impact of Wuyishan National Park on the local area at various scales. Additionally, the results of landscape connectivity indicated that the connectance levels of different variation levels were generally low, highlighting spatial heterogeneity both within and outside the national park, as well as among various county-level administrative regions. Despite some counties experiencing substantial changes in area, their connectivity did not significantly exceed that of other counties. For example, the low connectivity observed in Wuyishan suggests a somewhat random influence of the national park on the local area. The low landscape connectivity observed in the changes across production, living, and ecological spaces implies a dispersed pattern of transformation. This suggests that the influence of Wuyishan National Park on surrounding areas is not spatially concentrated but rather exhibits a degree of randomness.
Human activities heavily influence changes in production and living spaces, predominantly showing low levels of alterations, with high-value areas mainly found in urban areas and other human-concentrated regions. The impact of the national park is primarily focused on the northern and eastern regions, aligned with the development zones for tourism and tea cultivation activities [19], for instance, the eastern section of the national park, encompassing the Wuyishan Scenic Area developed for tourism purposes [27,64]. Similarly, the transformation of living space is primarily concentrated within the urban areas of each county. Following the establishment of the national park, human settlement has become more concentrated through relocation efforts. Urban areas are now able to provide better public services, thereby enhancing residents’ well-being [21,45]. This poses a certain level of pressure on the protection of the national park, requiring careful attention. Significant variations in living space transformations are observed at the county scale, attributable to the differing levels of human activity concentration. With the continuous growth in the national park’s influence, the surrounding areas may experience further intensification of human settlements. Governments can enhance the resilience of local socio-economic systems by implementing measures such as ecological compensation and industrial regulation [20,42].

4.3. Interrelationships of Changes in Habitat Quality and PLE Space Transformations

Building upon the preceding research, this study employs a geographic detector model to unravel the inherent relationship between habitat quality changes and PLE space transformations. Factor detection analysis reveals a weak positive correlation between the various dimensions of PLE space changes and habitat quality alterations. Moreover, interaction detection analysis uncovers a mutually reinforcing relationship among production, living, and ecological spaces in influencing habitat quality changes.
Furthermore, this study employs coupling coordination analysis to evaluate the relationship between habitat quality changes and PLE space transformations, providing a comprehensive assessment of Wuyishan National Park’s impact on regional development. The national park is strictly protected, resulting in relatively low coupling coordination degrees across all dimensions. Analysis of the coupling coordination of production reveals that high-value areas are concentrated around the national park, primarily within the urban areas of Wuyishan and Jianyang. Variations in the coupling coordination degree at the county level are relatively small. Notably, Wuyishan exhibits the largest proportion of high-coupling-coordination areas, while Guangze has the smallest. These findings suggest the need for tailored measures following the establishment of the national park. Adjusting and optimizing industrial structures could enhance coupling coordination degrees across counties, ultimately achieving sustainable protection and high-quality development. In addition, analysis of the coupling coordination of ecology reveals an even distribution of high-coupling-coordination areas around the national park.
Variations in the coupling coordination degree at the county scale indicate that the national park’s influence is primarily directed towards the eastern region, which aligns with the direction of the municipal administrative center. In pursuit of sustainable development, Nanping has formulated the Wuyishan National Park Development Zone Planning, implementing various measures to regulate development in the park’s vicinity, thereby transforming the socio-economic landscape of the Wuyishan region. However, the northern portion of Wuyishan National Park lies within Shangrao, leading to a lack of coordination in the development of surrounding areas with Nanping. This incongruity is a significant factor contributing to the observed disparities at the county scale.

5. Conclusions

This study conducts a thorough analysis of PLE space and habitat quality change to elucidate the diverse impact of Wuyishan National Park. The results offer valuable policy insights for overseeing and managing the development of the Wuyishan region. It is disclosed that the establishment of the national park has notably enhanced habitat quality in the Wuyishan region. Simultaneously, alterations in PLE space have taken place, albeit mostly at a minimal scale and focused in areas of high human activity. Substantial distinctions are noted between areas within and outside the national park, a contrast that is also apparent at the county level. The findings suggest that careful monitoring and management are crucial to ensure the sustainable development of the Wuyishan region. It is imperative to strike a balance between economic activities and environmental conservation efforts. Further research is needed to assess the long-term effects of these changes and to inform future decision-making processes. Furthermore, government policies should be enhanced to regulate the magnitude and insensitivity of human activities. Overall, this study underscores the importance of holistic approaches to regional development that prioritize both ecological integrity and human well-being.
This study acknowledges several limitations. Firstly, the varying quality of multi-source data spanning from 2015 to 2022 may introduce some degree of uncertainty into the findings. Secondly, this study’s focus on human activities in analyzing changes in PLE space may highlight certain deficiencies in the evolution of PLE space. Secondly, this study’s reliance on secondary data sources may have limited the depth of analysis available. Future research directions could involve scenario simulations of relevant industrial policy factors to forecast the impacts of changes. Further exploration into the intricacies of PLE space dynamics and potential interactions with other environmental and societal factors could provide a more comprehensive understanding of the topic.

Author Contributions

Conceptualization, X.D. and Z.W.; methodology, X.D.; writing—original draft preparation and review, X.D., Z.W., X.L. and J.W. All authors have read and agreed to the published version of the manuscript.

Funding

This work was supported by the National Natural Science Foundation of China (Grant No. 42101294), the Foundation of the Educational Department of Liaoning Province (Grant No. LJKMR20221067), Liaoning Federation of Social Science project (Grant No.20221slqnrcwtkt-50), and Shenyang philosophy social science planning project (Grant No. SY20230316Q).

Data Availability Statement

All data that support the findings of this study are available from the corresponding author upon reasonable request.

Acknowledgments

The authors thank the anonymous reviewers for their insightful comments and helpful suggestions that helped improve the quality of our manuscript.

Conflicts of Interest

The authors declare no conflicts of interest.

Appendix A

Table A1. Weights of the threat data.
Threat Factor Maximum Influence
Distance/km
WeightDecay Type
Rainfed cropland10.5Linear decay
Irrigated cropland30.7Linear decay
Impervious surfaces land81Exponential decay
Shrubland30.3Exponential decay
Grassland10.2Exponential decay
Table A2. Sensitivities of the habitat types to each threat.
Land Use Type Habitat
Suitability
Rainfed CroplandIrrigated CroplandImpervious SurfacesShrublandGrassland
Rainfed cropland0.500.900.30.3
Irrigated cropland0.30.9000.40.4
Evergreen broadleaved forest10.60.80.90.50.6
Deciduous broadleaved forest10.60.80.90.50.6
Needle-leaved forest10.60.80.90.50.6
Shrubland0.70.30.40.700.5
Grassland0.70.30.40.70.50
Wetland10.40.50.70.50.5
Impervious surfaces000000
Water body10.50.50.80.60.7

References

  1. Newbold, T.; Hudson, L.N.; Hill, S.L.L.; Contu, S.; Lysenko, I.; Senior, R.A.; Börger, L.; Bennett, D.J.; Choimes, A.; Collen, B.; et al. Global Effects of Land Use on Local Terrestrial Biodiversity. Nature 2015, 520, 45–50. [Google Scholar] [CrossRef] [PubMed]
  2. Jaung, W.; Carrasco, L.R. A Big-Data Analysis of Human-Nature Relations in Newspaper Coverage. Geoforum 2022, 128, 11–20. [Google Scholar] [CrossRef]
  3. Sandbrook, C.; Fisher, J.A.; Holmes, G.; Luque-Lora, R.; Keane, A. The Global Conservation Movement Is Diverse but Not Divided. Nat. Sustain. 2019, 2, 316–323. [Google Scholar] [CrossRef]
  4. Weng, A.; Liao, L.; Cao, Y.; Carver, S.; Lin, L.; Shen, S.; Xu, Z.; Dong, J.; Lan, S.; Yang, R. Different People, Different Wild: Comparing and Mapping Wilderness Representation in Wuyishan National Park, China. Geogr. Sustain. 2024, 5, 144–156. [Google Scholar] [CrossRef]
  5. Wassihun, A.N.; Feleke, F.B.; Bayeh, G.A.; Nega, Y.M. Smallholder Households’ Willingness to Pay for Conservation of Ecosystem Services of Altash National Park of Ethiopia. Int. J. Geoheritage Parks 2021, 9, 405–414. [Google Scholar] [CrossRef]
  6. Bell, J.; Stockdale, A. Evolving National Park Models: The Emergence of an Economic Imperative and Its Effect on the Contested Nature of the ‘National’ Park Concept in Northern Ireland. Land Use Policy 2015, 49, 213–226. [Google Scholar] [CrossRef]
  7. Phongchiewboon, A.; Farrelly, T.; Hytten, K.; Holland, J. Political ecology, privation and sustainable livelihoods in northern Thailand’s national parks. J. Political Ecol. 2020, 27, 360–377. [Google Scholar] [CrossRef]
  8. Musakwa, W.; Gumbo, T.; Paradza, G.; Mpofu, E.; Nyathi, N.A.; Selamolela, N.B. Partnerships and Stakeholder Participation in the Management of National Parks: Experiences of the Gonarezhou National Park in Zimbabwe. Land 2020, 9, 399. [Google Scholar] [CrossRef]
  9. Musakwa, W.; Mpofu, E.; Nyathi, N.A. Local Community Perceptions on Landscape Change, Ecosystem Services, Climate Change, and Livelihoods in Gonarezhou National Park, Zimbabwe. Sustainability 2020, 12, 4610. [Google Scholar] [CrossRef]
  10. Schelhas, J.; Sherman, R.E.; Fahey, T.J.; Lassoie, J.P. Linking Community and National Park Development: A Case from the Dominican Republic. Nat. Resour. Forum 2002, 26, 140–149. [Google Scholar] [CrossRef]
  11. Hiwasaki, L. Toward Sustainable Management of National Parks in Japan: Securing Local Community and Stakeholder Participation. Environ. Manag. 2005, 35, 753–764. [Google Scholar] [CrossRef] [PubMed]
  12. Mayer, M.; Müller, M.; Woltering, M.; Arnegger, J.; Job, H. The Economic Impact of Tourism in Six German National Parks. Landsc. Urban. Plan. 2010, 97, 73–82. [Google Scholar] [CrossRef]
  13. Mika, M.; Zawilińska, B.; Pawlusiński, R. Exploring the Economic Impact of National Parks on the Local Economy: Functional Approach in the Context of Poland’s Transition Economy. Hum. Geogr. 2016, 10, 5–21. [Google Scholar]
  14. Zhang, X.; Liao, L.; Huang, Y.; Fang, Q.; Lan, S.; Chi, M. Conservation Outcome Assessment of Wuyishan Protected Areas Based on InVEST and Propensity Score Matching. Glob. Ecol. Conserv. 2023, 45, e02516. [Google Scholar] [CrossRef]
  15. Feng, Y.; Li, G.; Li, J.; Sun, X.; Wu, D. Community Stewardship of China’s National Parks. Science 2021, 374, 268–269. [Google Scholar] [CrossRef] [PubMed]
  16. Guo, Y.; Liu, X.; Liu, X.; Zhang, J.; Zhang, H.; Fan, J.; Khan, N.; Ma, J. Quantitative Assessment of the Degree of Harmony between Humanity and Nature for National Parks in China: A Case Study of the Three-River-Source National Park. Front. Ecol. Evol. 2023, 11, 1121189. [Google Scholar] [CrossRef]
  17. Dong, Q.; Zhang, B.; Cai, X.; Morrison, A.M. Do Local Residents Support the Development of a National Park? A Study from Nanling National Park Based on Social Impact Assessment (SIA). Land 2021, 10, 1019. [Google Scholar] [CrossRef]
  18. Sheng, G.; Chen, H.; Ferretti-Gallon, K.; Innes, J.L.; Wang, Z.; Zhang, Y.; Wang, G. Moving toward a Greener China: Is China’s National Park Pilot Program a Solution? Land 2020, 9, 489. [Google Scholar] [CrossRef]
  19. Wang, B.; He, S.; Min, Q.; Yang, X. Conflict or Coexistence? Synergies between Nature Conservation and Traditional Tea Industry Development in Wuyishan National Park, China. Front. Sustain. Food Syst. 2023, 6, 991847. [Google Scholar] [CrossRef]
  20. Chen, S.; Sun, X.; Su, S. A Study of the Mechanism of Community Participation in Resilient Governance of National Parks: With Wuyishan National Park as a Case. Sustainability 2021, 13, 10090. [Google Scholar] [CrossRef]
  21. He, S.; Gallagher, L.; Min, Q. Examining Linkages among Livelihood Strategies, Ecosystem Services, and Social Well-Being to Improve National Park Management. Land 2021, 10, 823. [Google Scholar] [CrossRef]
  22. Wei, Y.; He, S.; Li, G.; Chen, X.; Shi, L.; Lei, G.; Su, Y. Identifying Nature–Community Nexuses for Sustainably Managing Social and Ecological Systems: A Case Study of the Qianjiangyuan National Park Pilot Area. Sustainability 2019, 11, 6182. [Google Scholar] [CrossRef]
  23. Schelhas, J.; Pfeffer, M.J. When Global Environmentalism Meets Local Livelihoods: Policy and Management Lessons. Conserv. Lett. 2009, 2, 278–285. [Google Scholar] [CrossRef]
  24. Job, H.; Bittlingmaier, S.; Mayer, M.; von Ruschkowski, E.; Woltering, M. Park–People Relationships: The Socioeconomic Monitoring of National Parks in Bavaria, Germany. Sustainability 2021, 13, 8984. [Google Scholar] [CrossRef]
  25. Zhang, X.; Liao, L.; Xu, Z.; Zhang, J.; Chi, M.; Lan, S.; Gan, Q. Interactive Effects on Habitat Quality Using InVEST and GeoDetector Models in Wenzhou, China. Land 2022, 11, 630. [Google Scholar] [CrossRef]
  26. Puhakka, R.; Saarinen, J. New Role of Tourism in National Park Planning in Finland. J. Environ. Dev. 2013, 22, 411–434. [Google Scholar] [CrossRef]
  27. Wang, K.; Wang, M.; Gan, C.; Chen, Q.; Voda, M. Tourism Economic Network Structural Characteristics of National Parks in the Central Region of China. Sustainability 2021, 13, 4805. [Google Scholar] [CrossRef]
  28. Yang, Y.; Bao, W.; Liu, Y. Coupling Coordination Analysis of Rural Production-Living-Ecological Space in the Beijing-Tianjin-Hebei Region. Ecol. Indic. 2020, 117, 106512. [Google Scholar] [CrossRef]
  29. Zhang, X.; Xu, Z. Functional Coupling Degree and Human Activity Intensity of Production–Living–Ecological Space in Underdeveloped Regions in China: Case Study of Guizhou Province. Land 2021, 10, 56. [Google Scholar] [CrossRef]
  30. Chen, X.; Yu, L.; Cao, Y.; Xu, Y.; Zhao, Z.; Zhuang, Y.; Liu, X.; Du, Z.; Liu, T.; Yang, B.; et al. Habitat Quality Dynamics in China’s First Group of National Parks in Recent Four Decades: Evidence from Land Use and Land Cover Changes. J. Environ. Manag. 2023, 325, 116505. [Google Scholar] [CrossRef]
  31. Li, J.; Sun, W.; Li, M. Linlin Meng Coupling Coordination Degree of Production, Living and Ecological Spaces and Its Influencing Factors in the Yellow River Basin. J. Clean. Prod. 2021, 298, 126803. [Google Scholar] [CrossRef]
  32. Liang, T.; Yang, F.; Huang, D.; Luo, Y.; Wu, Y.; Wen, C. Land-Use Transformation and Landscape Ecological Risk Assessment in the Three Gorges Reservoir Region Based on the “Production–Living–Ecological Space” Perspective. Land 2022, 11, 1234. [Google Scholar] [CrossRef]
  33. Duan, Y.; Wang, H.; Huang, A.; Xu, Y.; Lu, L.; Ji, Z. Identification and Spatial-Temporal Evolution of Rural “Production-Living-Ecological” Space from the Perspective of Villagers’ Behavior—A Case Study of Ertai Town, Zhangjiakou City. Land Use Policy 2021, 106, 105457. [Google Scholar] [CrossRef]
  34. Fu, C.; Tu, X.; Huang, A. Identification and Characterization of Production–Living–Ecological Space in a Central Urban Area Based on POI Data: A Case Study for Wuhan, China. Sustainability 2021, 13, 7691. [Google Scholar] [CrossRef]
  35. Lin, G.; Jiang, D.; Fu, J.; Zhao, Y. A Review on the Overall Optimization of Production–Living–Ecological Space: Theoretical Basis and Conceptual Framework. Land 2022, 11, 345. [Google Scholar] [CrossRef]
  36. Li, H.; Fang, C.; Xia, Y.; Liu, Z.; Wang, W. Multi-Scenario Simulation of Production-Living-Ecological Space in the Poyang Lake Area Based on Remote Sensing and RF-Markov-FLUS Model. Remote Sens. 2022, 14, 2830. [Google Scholar] [CrossRef]
  37. Liu, C.; Wang, Y.; He, R.; Wang, C. An Analysis Framework for Identifying and Optimizing Ecological-Production-Living Space Based on Resident Behavior. J. Nat. Resour. 2019, 34, 2113. [Google Scholar] [CrossRef]
  38. Shi, T.; Yang, S.; Zhang, W.; Zhou, Q. Coupling Coordination Degree Measurement and Spatiotemporal Heterogeneity between Economic Development and Ecological Environment—Empirical Evidence from Tropical and Subtropical Regions of China. J. Clean. Prod. 2020, 244, 118739. [Google Scholar] [CrossRef]
  39. Yang, D.; Yang, Q.; Tong, Z.; Du, W.; Zhang, J. Coupling Coordination Analysis of Production, Living, and Ecological Spaces in Wetlands: A Case Study of Xianghai Wetland Nature Reserve, China. Ecol. Indic. 2024, 158, 111578. [Google Scholar] [CrossRef]
  40. Liao, G.; He, P.; Gao, X.; Deng, L.; Zhang, H.; Feng, N.; Zhou, W.; Deng, O. The Production–Living–Ecological Land Classification System and Its Characteristics in the Hilly Area of Sichuan Province, Southwest China Based on Identification of the Main Functions. Sustainability 2019, 11, 1600. [Google Scholar] [CrossRef]
  41. Tian, F.; Li, M.; Han, X.; Liu, H.; Mo, B. A Production–Living–Ecological Space Model for Land-Use Optimisation: A Case Study of the Core Tumen River Region in China. Ecol. Model. 2020, 437, 109310. [Google Scholar] [CrossRef]
  42. Chang, Y.; Zou, T.; Yoshino, K.; Luo, S.; Zhou, S. Ecological Policy Benefit Valuation Based on Public Feedback: Forest Ecosystem Services in Wuyishan Nature Reserve, China. Sci. Total Environ. 2019, 673, 622–630. [Google Scholar] [CrossRef] [PubMed]
  43. Liu, G.; Yang, Z.; Chen, B.; Zhang, L.; Zhang, Y.; Su, M. An Ecological Network Perspective in Improving Reserve Design and Connectivity: A Case Study of Wuyishan Nature Reserve in China. Ecol. Model. 2015, 306, 185–194. [Google Scholar] [CrossRef]
  44. Lin, S.; Hu, X.; Chen, H.; Wu, C.; Hong, W. Spatio-Temporal Variation of Ecosystem Service Values Adjusted by Vegetation Cover: A Case Study of Wuyishan National Park Pilot, China. J. For. Res. 2022, 33, 851–863. [Google Scholar] [CrossRef]
  45. Qi, T.; Li, Y.; Huang, M.; Luo, B.; Peng, Z.; Wang, W.; Li, S.; Degen, A.A.; Shang, Z. Land Intensification Use Scenarios Based on Urban Land Suitability Assessment of the National Park. Sustain. Cities Soc. 2024, 102, 105229. [Google Scholar] [CrossRef]
  46. Tang, Z. An Integrated Approach to Evaluating the Coupling Coordination between Tourism and the Environment. Tour. Manag. 2015, 46, 11–19. [Google Scholar] [CrossRef]
  47. Zhou, H.; Wu, X.; Nie, H.; Wang, X.; Zang, S. Coupling Coordination Analysis and Obstacle Factors Identification of Rural Living-Production-Ecological Functions in a Farming-Pastoral Ecotone. Ecol. Indic. 2024, 158, 111398. [Google Scholar] [CrossRef]
  48. McGarigal, K.S.; Cushman, S.; Neel, M.; Ene, E. FRAGSTATS V4: Spatial Pattern Analysis Program for Categorical Maps. Fragstats. 2021. Available online: https://fragstats.org/ (accessed on 2 April 2024).
  49. Haines-Young, R.; Chopping, M. Quantifying Landscape Structure: A Review of Landscape Indices and Their Application to Forested Landscapes. Prog. Phys. Geogr. Earth Environ. 1996, 20, 418–445. [Google Scholar] [CrossRef]
  50. Wang, J.-F.; Zhang, T.-L.; Fu, B.-J. A Measure of Spatial Stratified Heterogeneity. Ecol. Indic. 2016, 67, 250–256. [Google Scholar] [CrossRef]
  51. Wang, J.; Haining, R.; Zhang, T.; Xu, C.; Hu, M.; Yin, Q.; Li, L.; Zhou, C.; Li, G.; Chen, H. Statistical Modeling of Spatially Stratified Heterogeneous Data. Ann. Am. Assoc. Geogr. 2024, 114, 499–519. [Google Scholar] [CrossRef]
  52. Hu, Y.; Xu, E.; Dong, N.; Tian, G.; Kim, G.; Song, P.; Ge, S.; Liu, S. Driving Mechanism of Habitat Quality at Different Grid-Scales in a Metropolitan City. Forests 2022, 13, 248. [Google Scholar] [CrossRef]
  53. Song, Y.; Wang, J.; Ge, Y.; Xu, C. An Optimal Parameters-Based Geographical Detector Model Enhances Geographic Characteristics of Explanatory Variables for Spatial Heterogeneity Analysis: Cases with Different Types of Spatial Data. GIScience Remote Sens. 2020, 57, 593–610. [Google Scholar] [CrossRef]
  54. Zhou, D.; Xu, J.; Lin, Z. Conflict or Coordination? Assessing Land Use Multi-Functionalization Using Production-Living-Ecology Analysis. Sci. Total Environ. 2017, 577, 136–147. [Google Scholar] [CrossRef]
  55. Dobson, J.; Bright, E.; Coleman, P.; Durfee, R.; Worley, B. LandScan: A Global Population Database for Estimating Populations at Risk. Photogramm. Eng. Remote Sens. 2000, 66, 849–857. [Google Scholar]
  56. Wu, Y.; Shi, K.; Chen, Z.; Liu, S.; Chang, Z. An Improved Time-Series DMSP-OLS-like Data (1992–2023) in China by Integrating DMSP-OLS and SNPP-VIIRS. 2021. Available online: https://dataverse.harvard.edu/dataset.xhtml?persistentId=doi:10.7910/DVN/GIYGJU (accessed on 2 April 2024).
  57. Gao, J.; Shi, Y.; Zhang, H.; Chen, X.; Zhang, G.; Shen, W.; Xiao, T.; Zhang, Y. China Regional 250 m Fractional Vegetation Cover Data Set (2000–2022); National Tibetan Plateau Data Center: Beijing, China, 2023. [Google Scholar]
  58. Zhang, X.; Liu, L.; Zhao, T.; Chen, X.; Lin, S.; Wang, J.; Mi, J.; Liu, W. GWL_FCS30: A Global 30 m Wetland Map with a Fine Classification System Using Multi-Sourced and Time-Series Remote Sensing Imagery in 2020. Earth Syst. Sci. Data 2023, 15, 265–293. [Google Scholar] [CrossRef]
  59. Deng, Y.; Yang, R. Influence Mechanism of Production-Living-Ecological Space Changes in the Urbanization Process of Guangdong Province, China. Land 2021, 10, 1357. [Google Scholar] [CrossRef]
  60. He, S.; Yang, L.; Min, Q. Community Participation in Nature Conservation: The Chinese Experience and Its Implication to National Park Management. Sustainability 2020, 12, 4760. [Google Scholar] [CrossRef]
  61. Song, T. The Exploration of China’s National Park System Pilot Project: Taking Northeast China Tiger and Leopard National Park System Pilot Area as an Example. Int. J. Geoheritage Parks 2020, 8, 203–209. [Google Scholar] [CrossRef]
  62. Zhou, D.Q.; Edward Grumbine, R. National Parks in China: Experiments with Protecting Nature and Human Livelihoods in Yunnan Province, Peoples’ Republic of China (PRC). Biol. Conserv. 2011, 144, 1314–1321. [Google Scholar] [CrossRef]
  63. He, S.; Jiao, W. Conservation-Compatible Livelihoods: An Approach to Rural Development in Protected Areas of Developing Countries. Environ. Dev. 2023, 45, 100797. [Google Scholar] [CrossRef]
  64. Wang, B.; He, S.; Sun, Y.; Min, Q. Giving Voice to Tourists: Improving the Governance of Protected Areas through Tourists’ Perceptions and Expectations. Forests 2022, 13, 1523. [Google Scholar] [CrossRef]
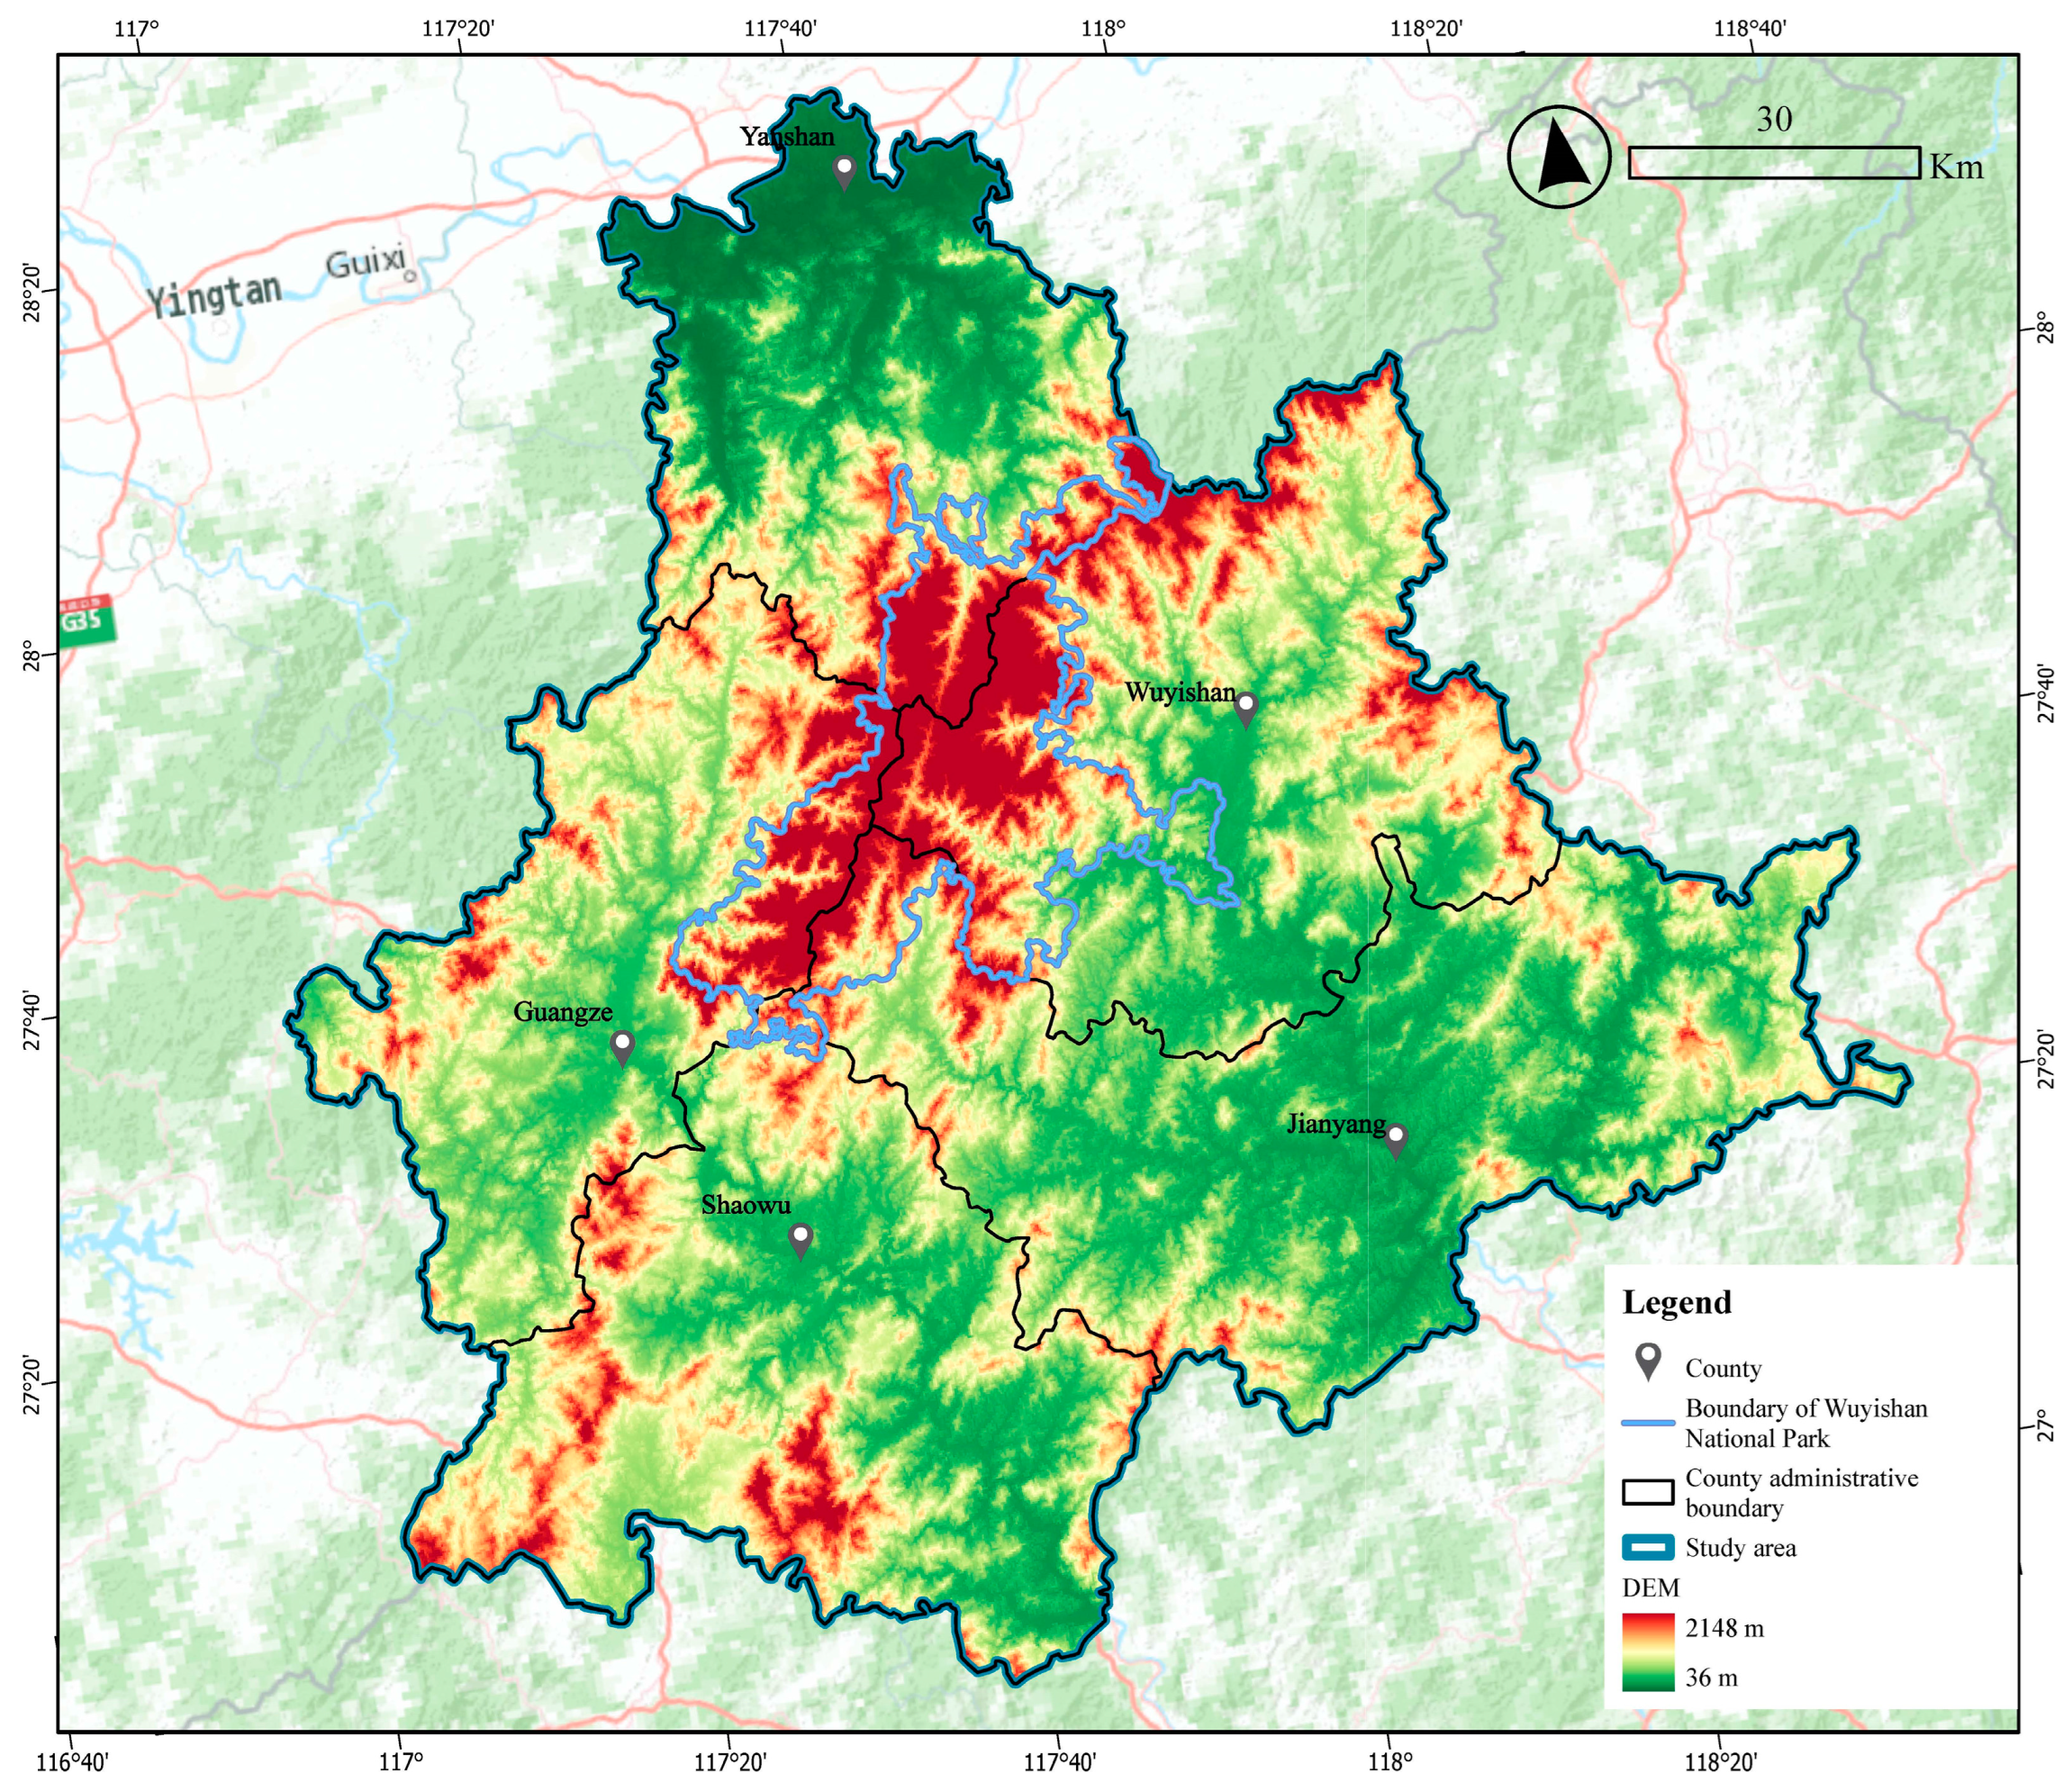
Figure 1. Study area of Wuyishan National Park.
Forests 15 01152 g001
Figure 2. Flowchart of this research.
Forests 15 01152 g002
Figure 3. Spatiotemporal change in habitat quality from 2015 to 2022.
Forests 15 01152 g003
Figure 4. Changes in habitat quality and production–living–ecological (PLE) space between 2015 and 2022.
Forests 15 01152 g004
Figure 5. Violin plot of the variance levels of habitat quality and PLE space at different administrative units.
Forests 15 01152 g005
Figure 6. Violin plot of the CONNECT index for the variance levels of PLE space in different administrative units.
Forests 15 01152 g006
Figure 7. Spatial distribution map and violin plot of coupling coordination degree of PLE.
Forests 15 01152 g007
Table 1. Statistics of each county related to Wuyishan National Park.
County-Level
Administrative District
Area Designated as National Park (km2)Proportion of the National Park Area (%)Proportion of the Administrative
Region Area (%)
Population (10,000)
Wuyishan City593.5646.421.126.1
Jianyang District129.1710.13.834.4
Shaowu City26.542.10.927.1
Guangze County252.0219.711.312.7
Yanshan County278.5321.812.848.05
Table 2. Indicator framework of production–living–ecological (PLE) space and the weights.
DimensionsIndicatorsPropertiesData SourceWeights
Production spacePopulation activityPopulation densityLandscan Global [55]0.085
Nighttime lightIntensity of
human activities
Improved time-series DMSP-OLS-like data
(1992–2023) in China [56]
0.043
Road networkKernel densityOSM
(https://openmaptiles.org/)
0.040
Company and factoryPOI of Amap (https://ditu.amap.com/)0.658
Accommodation service0.174
Living
space
Daily life serviceKernel densityPOI of Amap (https://ditu.amap.com/)0.126
Education service0.196
Healthcare service0.179
Shopping service0.118
Restaurant service0.157
Residential district0.224
Ecological spaceLeisure serviceKernel densityPOI of Amap (https://ditu.amap.com/)0.476
Tourism service0.477
NDVIGreenery coverageChina regional 250 m fractional vegetation cover dataset (2000–2022) [57]0.047
Table 3. Results of factor detection analysis.
Variableq-ValueSig
Production space0.22***
Living space0.19***
Ecological space0.09***
Note: *** p < 0.01.
Disclaimer/Publisher’s Note: The statements, opinions and data contained in all publications are solely those of the individual author(s) and contributor(s) and not of MDPI and/or the editor(s). MDPI and/or the editor(s) disclaim responsibility for any injury to people or property resulting from any ideas, methods, instructions or products referred to in the content.