Article

Complete Chloroplast Genome Sequences of Endangered Tropical Fosbergia Species (Family: Rubiaceae)

1
Key Laboratory of Ecology of Rare and Endangered Species and Environmental Protection (Ministry of Education), Guangxi Normal University, Guilin 541004, China
2
Southwest Research Center for Landscape Architecture Engineering, National Forestry and Grassland Administration, Southwest Forestry University, Kunming 650224, China
3
The Chongzuo White-Headed Langur Field Observation and Research Station of Guangxi, Guangxi Normal University, Guilin 541004, China
*
Authors to whom correspondence should be addressed.
Forests 2024, 15(7), 1150; https://doi.org/10.3390/f15071150
Submission received: 28 May 2024 / Revised: 24 June 2024 / Accepted: 26 June 2024 / Published: 3 July 2024
(This article belongs to the Special Issue Forest-Tree Comparative Genomics and Adaptive Evolution)

Abstract

:
Fosbergia shweliensis (Anth.) Tirveng. & Sastre, Fosbergia petelotii Merr. ex Tirveng. & Sastre, and Fosbergia thailandica Tirveng. & Sastre are reported as in extremely small populations in China. The three tree species all belong to the Forbergia of Rubiaceae, and little is known about the structural and evolutionary features of Fosbergia chloroplast genomes. In this study, four chloroplast genomes from three Fosbergia species were assembled, subjected to comparative genomics, and phylogenetically analyzed. The complete chloroplast genomes of Fosbergia showed highly conserved structures and were 154,623–154,730 bp in size, with a GC content of 37.6%. A total of 130 genes were annotated, comprising 85 protein-coding genes, 37 tRNA genes, and 8 rRNA genes. There are 119–128 long repeats and 39–42 SSRs in four chloroplast genomes. Highly variable loci trnS-trnG and psaA-ycf3 were detected as candidate markers for species identification in Fosbergia. Using 31 complete chloroplast genomes, the phylogenetic relationships among three Fosbergia species were investigated by constructing phylogenetic trees. Fosbergia and Gardenia are sister clades, and F. petelotii is more closely related to F. shweliensis than to F. thailandica. This study provided more molecular data to illuminate the genus Fosbergia evoltution in Rubiaceae.

1. Introduction

Fosbergia (Fosbergia Tirveng. & Sastre), a member of the Rubiaceae family, is found in southeastern Asia, including regions of China, Vietnam, northern Myanmar, and northern Thailand. Fosbergia shweliensis, a species endemic to Yunnan, is distributed in the western slopes and watershed of the southern Gaoligong Mountains. In 2007, Fosbergia petelotii was reported as a new discovery in China; the leaves are glabrous on the top, but hairy below the veins, the main nerve and lateral nerves are prominent on both surfaces, and there is a dense villus on the leaf axils [1]. Fosbergia thailandica is similar to F. petelotii, except that its leaf axils are without hairs and it has a smooth exocarp [1,2].
Fosbergia is a potential horticultural economic species because of its large yellowish-white flowers, giant fruits, and tall plants, which are extremely ornamental [3,4]. Currently, the advancement of Fosbergia research at the DNA molecular level has been limited. In 2011, Dao et al. screened 10 microsatellite marker loci to aid population genetics studies on F. shweliensis [3]. The chloroplast is one of the most important organelles in plants. The chloroplast genome has a relatively independent genome and genetic sequence, which has a set of genes related to photosynthesis, energy metabolism, and protein synthesis. Unlike the nuclear genome, its gene sequence is conserved, and it generally has complex repeat sequences, and the variation sites in the spacer region are abundant. The appropriate evolutionary rate can provide reliable information for the study of different levels of genetic relationships, phylogenetic relationships, and the genetic diversity of plants. With the rapid development of sequencing technology in recent years, a large number of complete chloroplast sequences of Rubiaceae have been discovered, and their phylogenetic relationships have been thoroughly studied [5,6,7]. In 2020, the first complete chloroplast genome of F. shweliensis was published by the NCBI, where the phylogenetic tree construction showed that the species is the sister of Coffea L. [8]. Two years later, Gong et al. revealed, for the first time, in a phylogenetic analysis of Gardenia jasminoides J. Ellis that it is more closely related to F. shweliensis, relative to Coffea [9]. However, the limited number of disclosed complete chloroplast and mitochondrial genomes of Fosbergia restricts in-depth studies on the species’ evolutionary relationships. In this study, we obtained whole chloroplast genomes of Fosbergia plants and characterized the structure and gene content of their genomes. Then, we investigated their repeat sequences, microstructural mutations, sequence differences, mutation hotspot regions, and codon usage frequencies. Finally, a phylogenetic tree was reestablished by combining the plastid genome sequences of other Gentianales Juss. ex Bercht. & J. Presl species to elucidate the genealogical relationships of Fosbergia. Our results will further elucidate the phylogenetic relationships of the species and genera of Fosbergia. Moreover, the disclosure of new genome sequence data will enrich the Fosbergia plastid genome database, aiding future research efforts to conserve this endangered species.

2. Materials and Methods

2.1. Material Sampling and DNA Sequencing

All four individuals of three Fosbergia species were collected in Yunnan, China. One F.shwelinesis individual (specimen number: 36691) was collected from Baihualing, one F.petelotii individual (specimen number: 33157) was collected from Maguan, and two F.thailandica individuals (specimen numbers: 34848 and 34791) were collected from Mengsong. The specimens were preserved in the Herbarium of the Xishuangbanna Tropical Botanical Garden (HITBC). Genomic DNA was extracted from leaf samples, followed by sequencing conducted by Novogene Bioinformatics Technology Co., Ltd. (Tianjin, China). Over 2.5 GB of raw data was obtained, with Fastp (version 0.23.2) used to assess quality and remove ambiguous and low-quality reads [10].

2.2. Chloroplast Genome Assembly and Annotation

After the removal of inferior-quality reads, the circular chloroplast genome was assembled through the application of GetOrganelle (version 1.7.1) software [11]. Subsequently, the four chloroplast genomes underwent annotation with the CPGAVAS2 tool, which was accessed via the provided web address (http://47.96.249.172:16019/analyzer/home, accessed on 3 October 2023) [12]. The annotation process utilized the complete chloroplast genome of F. shweliensis (GenBank accession No. MT180075) as a benchmark. The outcomes of the annotation were refined using Geneious Prime (version 2023.2.1) [13]. The final step involved mapping the annotated ring structure of the full genome accomplished with the OGDRAW tool (https://chlorobox.mpimp-golm.mpg.de/OGDraw.html, accessed on 3 October 2023) [14].

2.3. SSRs and Identification of Repeats

Long sequence repeats were identified for each of the four chloroplast genomes using the REPuter online tool (https://bibiserv.cebitec.uni-bielefeld.de/reputer, accessed on 15 January 2024) [15]. The detection included various types of repeats, such as forward, reverse, palindromic, and complementary, with the parameters of a minimum repeat length of 25 bp and a Hamming distance of 3. Additionally, the MISA tool (https://webblast.ipk-gatersleben.de/misa/, accessed on 20 October 2023) was utilized to screen for simple sequence repeats (SSRs) within the chloroplast genome [16]. The criteria for identifying SSRs were set with a minimum repeat count for mononucleotides at 10, dinucleotides at 5, trinucleotides at 4, tetranucleotides at 3, pentanucleotides at 3, and hexanucleotides also at 3.

2.4. Comparative Chloroplast Genome and Codon Preference Analysis

In order to identify microstructural mutations among the four Fosbergia chloroplast genomes, MAFFT (version 7) software (https://mafft.cbrc.jp/alignment/server/, accessed on 3 October 2023) [17] was used for comparison. The results were then checked and adjusted using Bio Edit (version 7.1.3) software [18]. The chloroplast genome of F. thailandica (SY9674) was employed as a reference, with manual examination conducted to identify any indel and single-nucleotide polymorphism (SNP) events.We conducted an analysis of nucleotide polymorphisms (Pi) using DnaSP software (version 6) [19] to evaluate the variability in chloroplast genomes by π. The analysis parameters included a window length of 600 bp and a step increment of 200 bp. Relative synonymous codon usage (RSCU) was examined with Codon W software (version 2.4.1) [20]. The visualization of the contraction and expansion of the IR boundaries in the four chloroplast genomes was accomplished using CPJSdraw (version 1.0.0) software (http://cloud.genepioneer.com:9929/#/tool/alltool/detail/335, accessed on 30 October 2023) [21].

2.5. Phylogenetic Analysis

To ascertain the phylogenetic placement of Fosbergia within the order Gentianales, we constructed phylogenetic trees employing both maximum likelihood (ML) and Bayesian inference (BI) approaches. The analysis encompassed 31 chloroplast genomes from Gentianales, which included four Fosbergia chloroplast genomes and an additional 27 Gentianales genomes sourced from the GenBank of the NCBI (Table S1). The complete chloroplast genomes were initially aligned using MAFFT (version 7) software, and subsequent refinements were manually made using BioEdit (version 7.1.3) software. The ML phylogenetic tree was assembled using the optimal model, “GTR + F + R4”, identified by IQ-TREE software (version 2) [22], with a process involving 1000 iterations. For the BI analysis, MrBayes (version 3.2) [23] was utilized, running for 1 million generations with samples taken every 1000 generations. The most suitable DNA substitution model was determined based on the Bayesian information criterion (BIC) through the use of ModelFinder [24]. The visualization of all phylogenetic analyses was accomplished with FigTree version 1.4.4 (http://tree.bio.ed.ac.uk/software/figtree/, accessed on 6 December 2023) [7].

3. Results

3.1. Characteristics of the Chloroplast Genomes of Fosbergia

The chloroplast genomes of F. thailandica, measuring 154,628 bp (SY9674) and 154,623 bp (SY9590), are slightly shorter than those of F. petelotii (154,730 bp) and F. shweliensis (154,717 bp). All four Fosbergia chloroplast genomes feature a pair of inverted repeats (IRs) of 25,870 bp, separated by a large single copy (LSC) ranging from 84,662 (F. thailandica) to 84,769 bp (F. petelotii) in length, and a small single copy (SSC) region of 18,221 bp in both F. thailandica and in F. petelotii, and 18,230 bp in F. shweliensis (Table 1). In the quartet of chloroplast genomes, the GC content is recorded at 37.6%, with the LSC regions showing a GC content of 35.5% and the SSC regions showing 31.4%. In contrast, the IR regions across the three species display a notably higher GC content, reaching 43.2%. The chloroplast genomes of Fosbergia encompass a collective of 130 genes, categorized into 85 protein-coding genes (PCGs), 37 transfer RNA (tRNA) genes, and 8 ribosomal RNA (rRNA) genes (Figure 1). Among these 130 genes, 17 are duplicated in the IR regions, comprising 4 rRNA genes, 7 tRNA genes, and 6 PCGs (Table S2).

3.2. Repeat Sequence Analysis

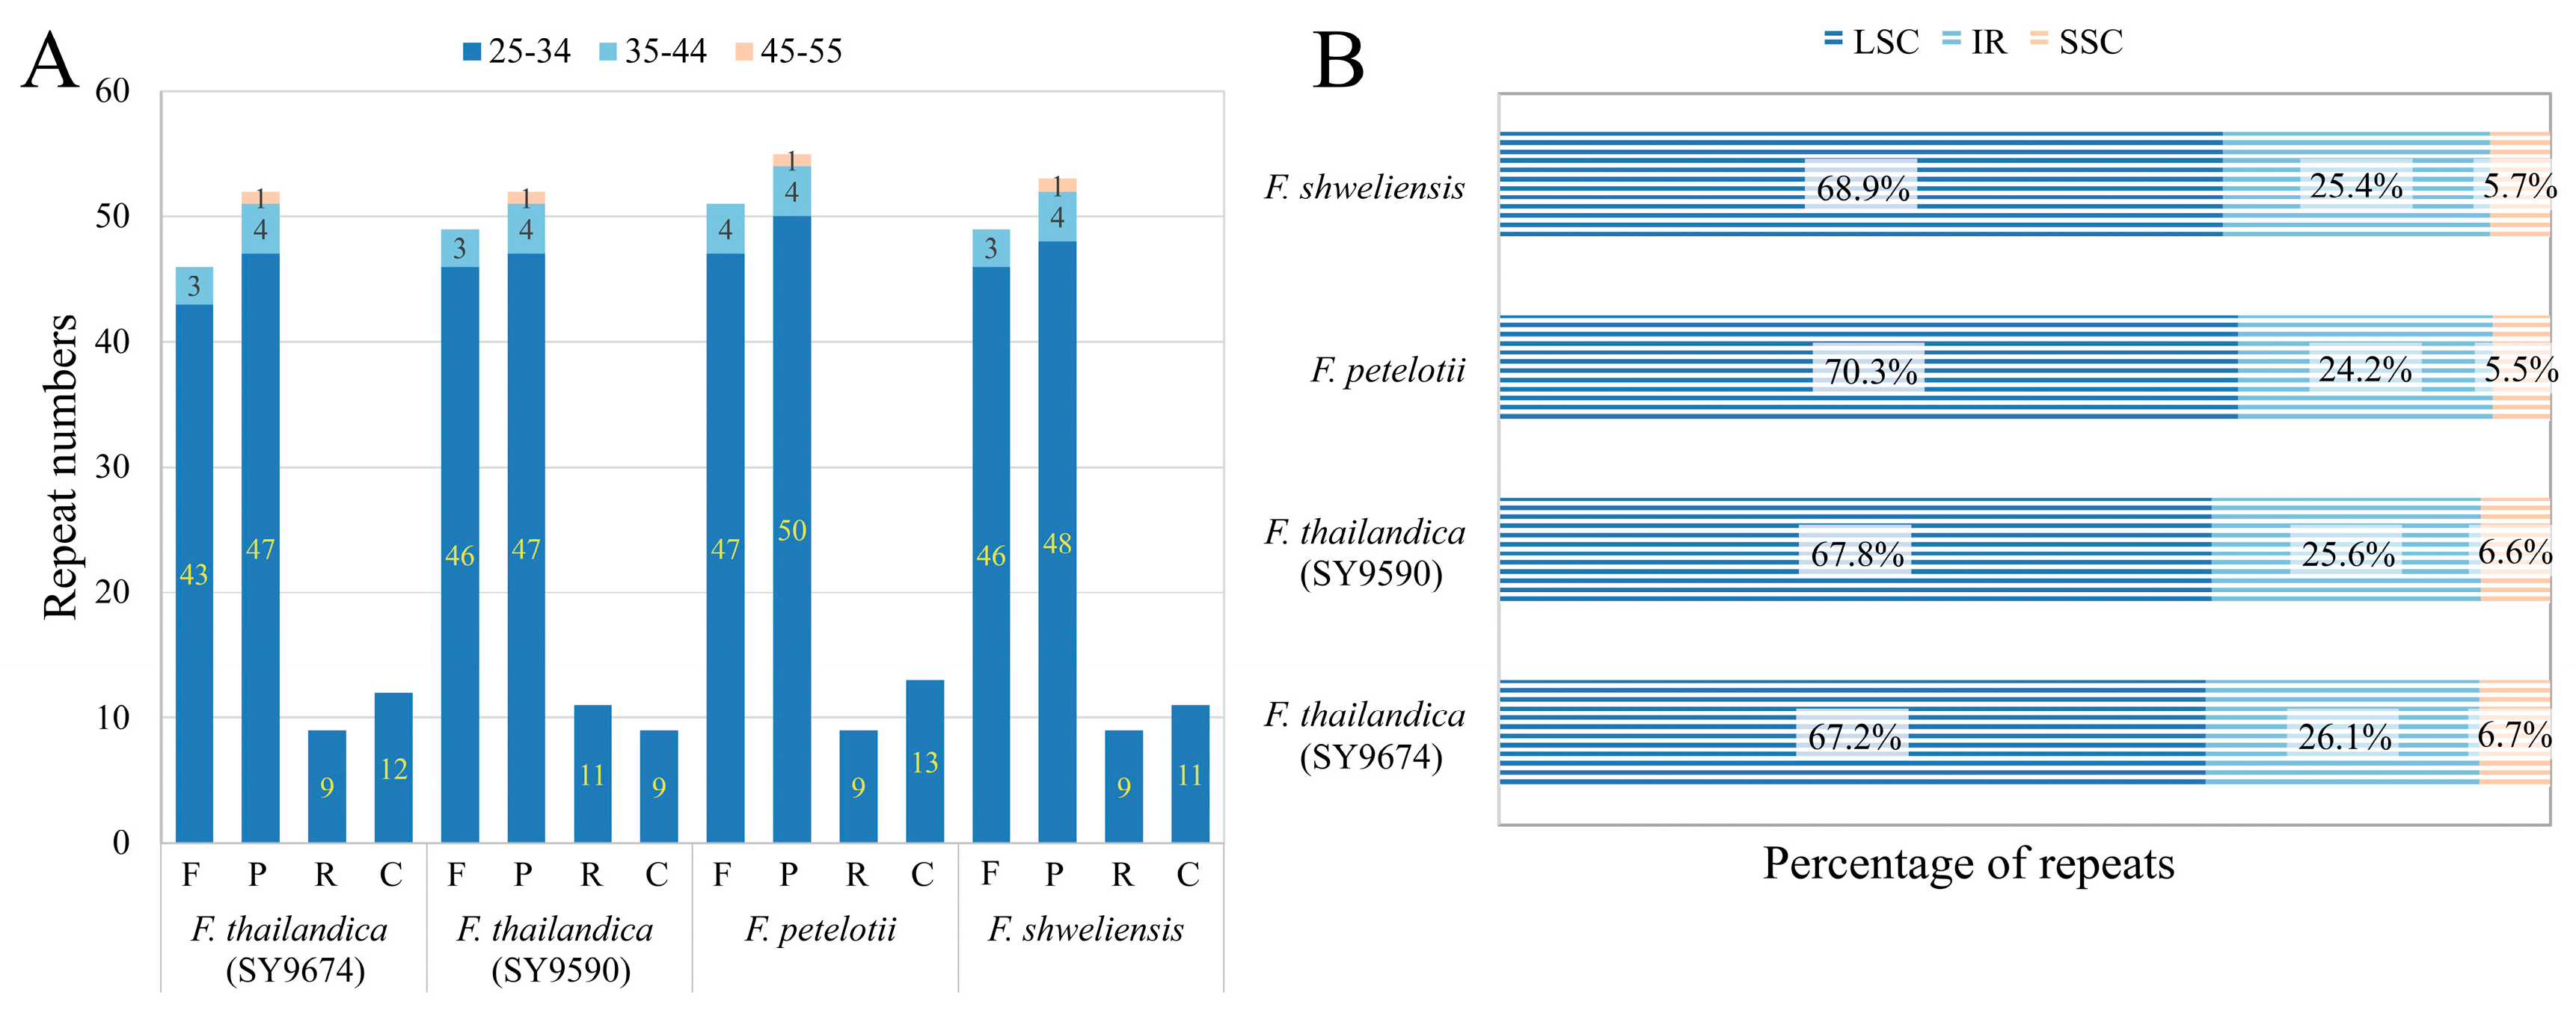
Potential sites of mutation were pinpointed in the form of 119–128 repeats across the four chloroplast sequences: specifically, 119/121 repeats in the two F. thailandica chloroplast genomes, 128 repeats in F. petelotii, and 122 repeats in F. shweliensis (Figure 2A). Predominantly, these repeats are categorized as forward (F) and palindromic (P) types, with counts of 52–55 for palindromic (P), 46–51 for forward (F), 9–11 for reverse (R), and 9–13 for complement (C) types. The majority of these repeats measure between 25 and 34 bp in length, with longer repeats of 34 bp being exclusive to palindromic and forward types. Furthermore, a higher proportion of repeats are situated in the LSC region, compared to the SSC and IR regions (Figure 2B).
The MISA analysis of the four chloroplast sequences from Fosbergia revealed the existence of various SSR loci. In the genus Fosbergia, we identified six categories of SSRs: mononucleotide, dinucleotide, trinucleotide, tetranucleotide, pentanucleotide, and hexanucleotide. Specifically, F. shweliensis contained 42 SSRs, whereas F. thailandica (SY9674), F. thailandica (SY9590), and F. petelotii contained 39, 40, and 41 SSRs, respectively (Figure 3A). Mononucleotide repeats were the most prevalent, succeeded by tetranucleotide, dinucleotide, trinucleotide, pentanucleotide, and hexanucleotide repeats. In each of the four chloroplast genomes, A and T mononucleotides were prevalent, while C repeats were rare and exclusive to F. shweliensis. Additionally, dinucleotide repeats were predominantly composed of TA and AT motifs. A deeper analysis indicated that the majority of microsatellites were concentrated in the LSC region, with a smaller number distributed in the SSC and IR regions (Figure 3B).

3.3. Number and Forms of Microstructural Mutations

In an effort to identify variable sites in the genus Fosbergia, a comparison of indel mutations across the chloroplast genomes of F. shweliensis, F. thailandica, and F. petelotii was undertaken. A total of 39 indels were identified in gene spacer regions, complemented by eight indels found in introns. These indels were further categorized into two groups: 25 SSR indels (Table 2) and 22 non-SSR indels (Table S3). Among the SSR indels, there are 20 instances of single nucleotide repeats of A/T, with lengths varying from 5 to 17 bp, three instances of single nucleotide repeats of C ranging from 3 to 10 bp, one double-nucleotide repeat of TA, and one six-nucleotide repeat of TTAGAA spanning 12 to 18 bp located within the intron of atpF. The majority of non-SSR indels were sized between 1 and 11 bp, with exceptions in the trnQ-psbK, psbM-trnD, and trnT-psbD gene spacer sequences, which were 19, 22, and 25 bp in length, respectively. It was observed that 89.36% of all indel events occurred in the LSC regions, while 10.64% were situated in the SSC regions. Additionally, seven micro-inversion events, each involving 2 to 4 bp, were identified within gene spacer sequences, and a single inversion event of 9 bp was detected within the intron of petD (Table S4).
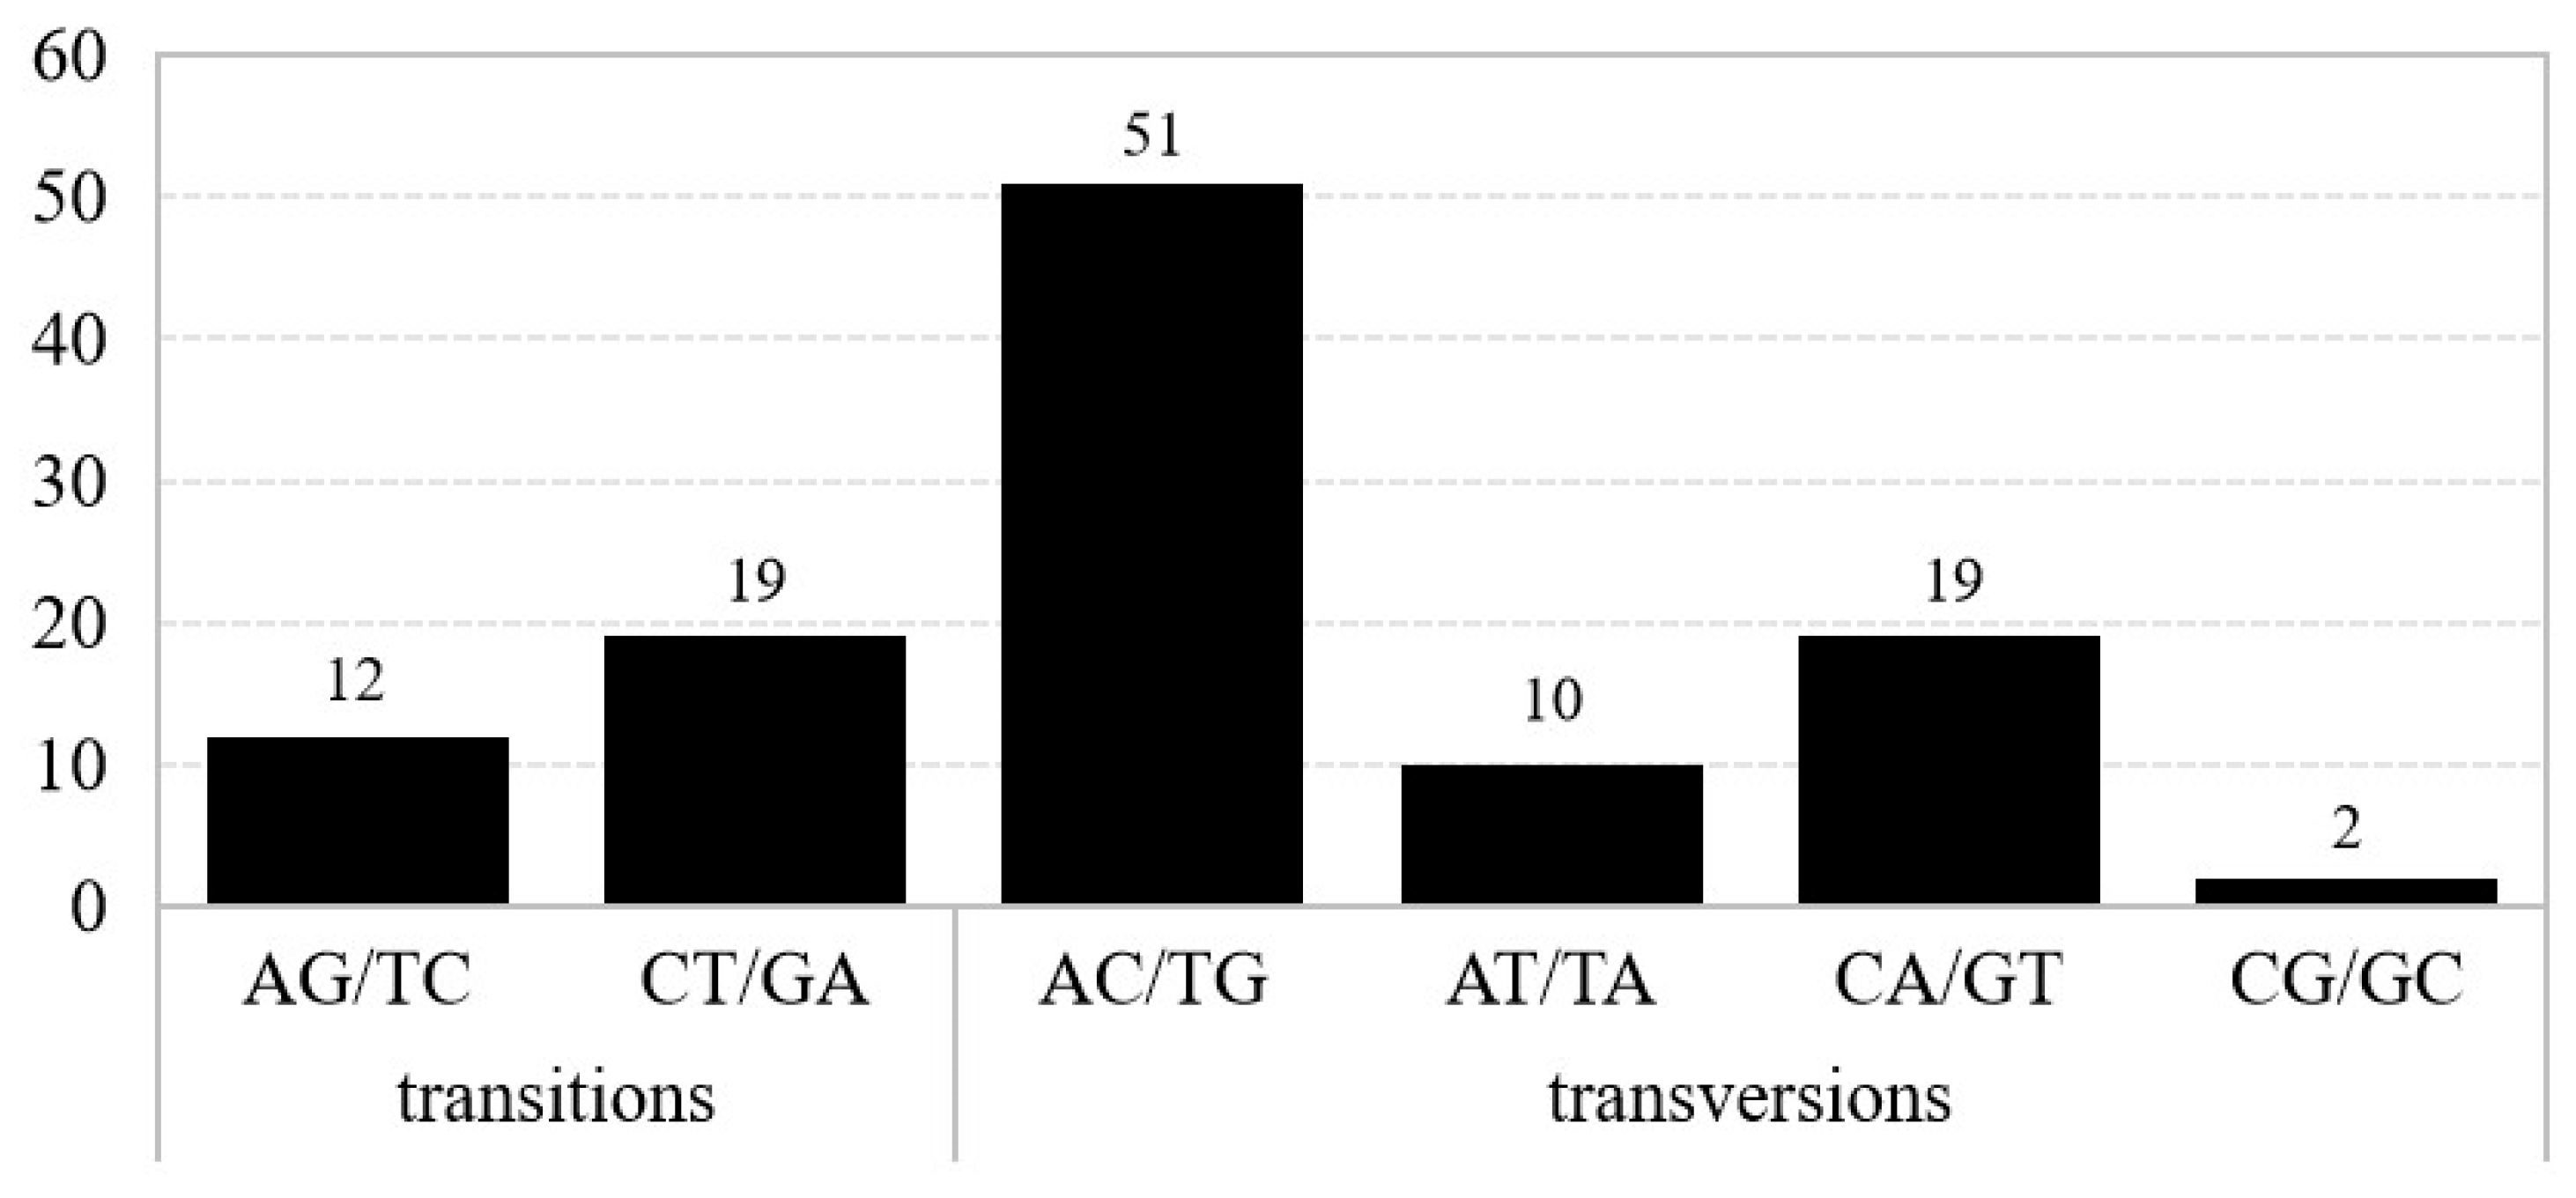
During our analysis, we identified 58 SNPs in coding sequences (CDSs), comprising 17 transitions (Ts) and 41 transversions (Tv) (Table S5). In the non-coding regions, 55 SNPs were observed, with 14 Ts and 41 Tv. Among the Tv events, 10 involved changes between T and A, 2 occurred between C and G, and the remaining 70 were associated with alterations in GC content (Figure 4). Within the gene coding regions, there were 25 non-synonymous and 14 synonymous substitutions. Furthermore, 18 of the 85 genes contained sites of non-synonymous substitutions. Notably, the ycf1 gene demonstrated a higher evolutionary rate, characterized by a higher frequency of non-synonymous substitutions relative to synonymous ones. In terms of the distribution of SNP sites, 70.80% were found in the LSC regions, 23.89% in the LSC SSC regions, and 5.31% in the IR regions.

3.4. Comparative Analysis of the Four Fosbergia Chloroplast Sequences

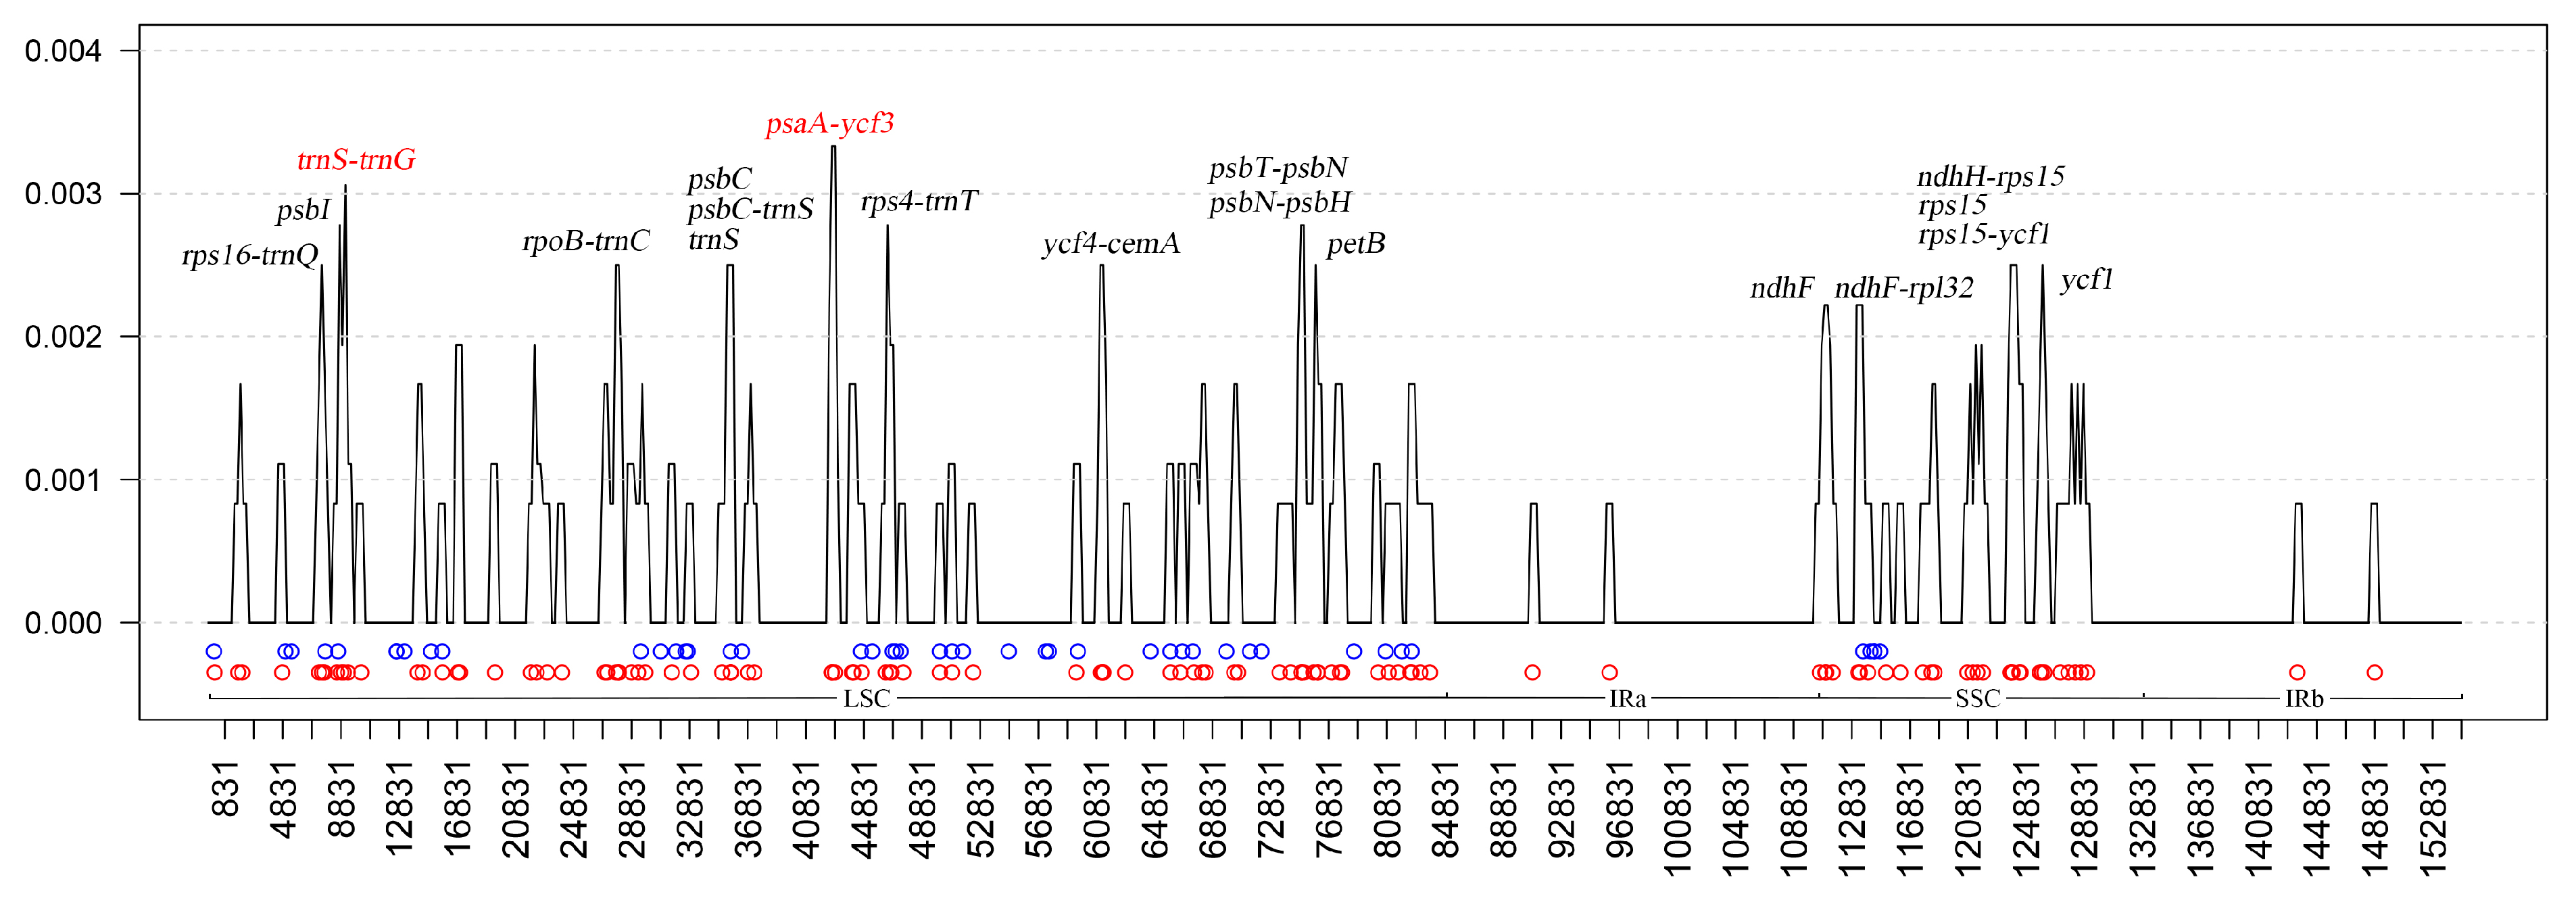
A sliding window analysis with DnaSP detected highly variable regions in the four Fosbergia chloroplast genomes. The nucleotide variability (Pi) was calculated to quantify the divergence at the sequence level among the sequenced genomes (Figure 5). Pi values ranged from 0 to 0.00333, with an average of 0.00039, indicating high sequence similarity among these genomes. However, 19 highly variable loci (Pi > 0.002), including 12 in gene spacer regions, 1 in intron, and 6 in the CDS, were precisely located. A total of 13 of these loci are in the LSC region, and 6 are in the SSC region. Among the four Fosbergia chloroplast genomes, the two highly variable loci, including trnS-trnG with a Pi value of 0.00306, and psaA-ycf3 with a Pi value of 0.00333, were in the LSC region. Compared to the LSC and SSC regions, the IR regions showed greater conservation. A comparison of the IR/SC boundary regions of four complete Fosbergia chloroplast genomes showed that the junction position is highly conserved (Figure S1).

3.5. Codon Bias Analysis

A study of codon usage preferences was undertaken for the four chloroplast genomes of Fosbergia. The investigation identified 64 codons that are responsible for 20 distinct amino acids (Figure 6). In F. petelotii, 32 codons had an RSCU > 1, whereas in F. thailandica and F. shweliensis, 34 codons had an RSCU > 1, signaling a codon preference within the Fosbergia chloroplast genomes. In the chloroplast genomes of F. petelotii, there is a preference for A and U at the third position of codons, occurring 13 and 16 times, respectively. Conversely, in the chloroplast genomes of both F. thailandica and F. shweliensis, there is an observed preference for A, U, and G at the third codon position, with occurrences of 13, 10, and 10, respectively. Furthermore, among the F. petelotii chloroplast genome, the codon GCU (Ala) exhibited the highest RSCU value at 1.82, whereas AGC (Ser) had the lowest at 0.35. In contrast, AGA (Arg) had the highest RSCU value of 1.75/1.74, and CGU (Arg) had the lowest at 0.3 in the F. thailandica and F. shweliensis chloroplast genomes.

3.6. Phylogenetic Analysis

To determine the phylogenetic positions of the three Fosbergia species, the matrix of complete chloroplast genomes was used to reconstruct a phylogenetic tree of 25 Gentianales plant taxa (12 Rubiaceae and 13 Apocynaceae Juss.), with six species of Gentianaceae Juss. serving as the outgroup (Figure 7). The phylogenetic relationships between the main clades and most genera have strong internal support in BI and ML analyses of complete chloroplast sequences. The ML and BI phylogenetic trees had very similar topologies, with only one small branch displaying an 80%/1 support rate, whereas all other branches presented a 100%/1 support rate. Gentianales was divided into two groups: the Rubiaceae group (PP = 1, BS = 100%), which included Fosbergia, Gardenia J. Ellis, Coffea, Mitragyna Korth., and Morinda L, and the Apocynaceae group (PP = 1, BS = 100%), which included Cynanchum L., Asclepias L., Oncinotis Benth., Echites P. Browne, Pentalinon Voigt, Nerium L., Carissa L., Rhazya Decne., and Catharanthus G. Don. The result shows that the three Fosbergia species, belonging to the subfamily Ixoroideae, cluster together on one branch and are identified as sister species to Gardenia jasminoides and Gardenia stenophylla Merr., with 100% bootstrap support (BS). These phylogenetic findings align with the traditional classification of the Rubiaceae family.

4. Discussion

4.1. Characteristics of the Chloroplast Genomes of Fosbergia

According to the records at NCBI, up to the year 2020, there has been only one reported complete chloroplast genome of the genus Fosbergia, specifically for the species F. shweliensis [8]. Consequently, this study sequenced four complete chloroplast genomes of Fosbergia species. The sizes of the four sequenced genomes are quite similar, ranging from 154,623 bp to 154,730 bp, which are smaller than the three Coffea chloroplast genomes (Coffea canephora Pierre ex A. Froehner, GenBank number KU500324: 154,751 bp; Coffea arabica L., GenBank number KY085909: 155,188 bp; and Coffea arabica, GenBank number EF044213: 155,189 bp), the two Gardenia chloroplast genomes (Gardenia stenophylla, GenBank number OL517769: 155,109 bp; and Gardenia jasminoides, GenBank number MW160432: 155,247 bp), and Mitragyna speciosa Korth. (GenBank number KY085908: 155,600 bp), but larger than those of Morinda citrifolia L. (GenBank number MN699649: 153,113 bp) and Morinda officinalis F. C. How (GenBank number KR869730: 153,398 bp). The gene order and content of the Fosbergia chloroplast genomes, with a pair of IRs (25,870 bp) separating the LSC (84,662–84,769 bp) and SSC (18,221–18,230 bp) regions, are identical to most sequenced angiosperm chloroplast genomes. This emphasizes the highly conserved nature of chloroplast genomes in these land plants [25]. The overall GC content of the four analyzed Fosbergia chloroplast genomes was approximately 37.6%, aligning with previously reported chloroplast genomes from other Rubiaceae species, including Mitragyna speciosa (37%) [5] and Gardenia jasminoides (37.49%) [9]. The GC contents of the LSC and SSC regions were substantially lower than those of the IR regions. This observation is consistent with previously published chloroplast genomes results of many angiosperms, such as Salvia miltiorrhiza Bunge [26] and Neocinnamomum H. Liu [27], due to a lower count of AT nucleotides in rRNA genes present in the IR regions [28].

4.2. Repeats and SSRs

Previous studies have demonstrated that repeat sequences play crucial roles in the rearrangement and stabilization of chloroplast genomes [29]. Long repetitive sequences also provide assistance in the development of marker studies for plant evolution and phylogenetics [30]. This study identified palindromic, forward, inverted, and complement repeats across the four Fosbergia chloroplast genomes, which showed that the number and distribution of the four repeat types in these chloroplast genomes were conserved. Similar to what has been reported for the Rubiaceae genera Gardenia [6,9,31], this study found palindromic repeats to be the most abundant, followed by forward repeats, while the other two types of repeats were less common. Many angiosperm lineages, including Dodecadenia grandiflora Nees [32] and Brassaiopsis angustifolia K. M. Feng [33], were found to have most of the repeats distributed in the LSC region, and the three Fosbergia genera in this study also share a consistent profile. SSR loci in the chloroplast are generally highly polymorphic and can be used widely in studies of genetics and evolution [34]. Upon examining four chloroplast genomes for SSR sites, unlike the Rubiaceae species Gardenia jasminoides, where only four types of SSRs (mononucleotide, dinucleotide, trinucleotide, and tetranucleotide repeats) were detected [9], Fosbergia exhibited pentanucleotide and hexanucleotide repeats in addition to the four types previously mentioned. The A/T mononucleotide repeats were the most prevalent, constituting the highest percentage among all SSR categories. In addition, the content of AT was significantly high in the other types of SSR as well. This is in line with previous reports that SSRs in chloroplast genomes are typically composed of short polyadenine (polyA) or polythymine (polyT) [7,35]. Consistent with Scyphiphora hydrophyllacea C. F. Gaertn., Coffea arabica [36], Gardenia jasminoides [6], and most other Rubiaceae plants, the majority of SSRs was located in the LSC region compared to the SSC and IR regions. Newly detected SSRs in the Fosbergia chloroplast genome have variability and can be used as potential molecular markers for genetic identification [37].

4.3. Indels and SNPs

Previous studies have shown that slip-strand mismatches or illegal recombination in surrounding sequences may lead to the generation of indels [38,39]. By comparing the four Fosbergia plastid sequences, totals of 47 indels and 113 SNPs were identified. We detected most microstructural mutations were located in the LSC region, with 70.80% in SNP sites and 89.36% in indel sites. Furthermore, all indel events occurred in the LSC/SSC region, demonstrating that variations in chloroplast genome size among the four Fosbergia plastids arise from changes in these regions. SNPs and indels are valuable for studying species delimitation and phylogenetics [40]. In addition, eight micro-inversions were detected between the four Fosbergia chloroplast genomes. Micro-inversions represent common evolutionary phenomena within the chloroplast genomes of land plants [41]. It has been shown that inversions are an important factor in the formation of intermolecular recombination [42,43]. Short inverted repeats are often present at both ends of the micro-inversion site, and the inverted repeat and micro-inversion sequence form a stem structure and a loop, respectively [44].

4.4. Comparative Analysis

The entire mutational dynamic, including SNPs and indels, has created highly variable regions in the genome. In this study, the chloroplast genomes of three Fosbergia species were found to be highly similar, with only a few regions exhibiting high mutation rates. The coding regions showed more consistency in differences compared to the non-coding regions, with sequences being more conserved in the IR areas than in the LSC and SSC regions, mirroring the findings for other angiosperms, such as Phlomis fruticosa L. [45] and Persea americana Mill. [46]. Analysis using DnaSP identified two major mutation hotspots, trnS-trnG and psaA-ycf3, across the four Fosbergia chloroplast genomes. The trnS-trnG region was identified as highly variable in Prunus persica (L.) Batsch [47] and Carya illinoinensis (Wangenh.) K. Koch [48], as reported in previous studies. Furthermore, a rarely reported highly variable locus, psaA-ycf3, was present in Fosbergia chloroplast genomes. All of these highly variable regions will be useful for phylogenetic studies on Fosbergia. In addition, the four Fosbergia chloroplast genomes exhibit a high degree of similarity, with their mean Pi value (0.00039) significantly lower than that of the nine Uncaria Schreb. species in the Rubiaceae family (0.004525) [49].
Changes in the position of the IR/SC junction often result from the contraction or expansion of the IR region, reflecting a common evolutionary occurrence in plants. Certain species of Rubiaceae, including Gardenia jasminoides [9] and Galium L. [36], have been reported to exhibit lower variability in the IR/SC boundary region within their genera [5]. Compared to the variable expansion/contraction of IRs in these reported Rubiaceae species, the four Fosbergia chloroplast genomes had IR regions of identical sizes, and their IR/SC boundary regions were highly conserved. Furthermore, the variation in chloroplast genome size among the four Fosbergia plastids was not due to deletions or duplications in the IR regions, but rather to changes in the SSC and LSC regions. A similar situation has been observed in documented plant species within Gentianales [37].

4.5. Codon Usage Bias

Codon usage bias refers to differences in the frequency of synonymous codon usage [50]. Studies on various multicellular eukaryotic organisms have indicated that both mutational bias and selective forces impact codon usage [51]. As an important indicator base in genomics research, the RSCU value range is of great significance for understanding the characteristics and functions of a genome [52]. There were differences in the types and numbers of codon usage bias among difference plants, and this may be related to their evolutionary relationship and living environment [51]. In our study, a comparison of four sequenced genomes revealed the presence of 23 protein-coding genes with SNPs, which play a pivotal role in shaping interspecific differences in codon usage bias [50]. The majority of codons with RSCU values > 1 showed a high A/T bias in their third codon usage. There were similarities in the types and numbers of codon usage bias between F. shweliensis and F. thailandica, while F. petelotii showed a slight difference. Based on the distribution of the three Foserbgia species, as reported, we speculate that these differences may be relevant to the relative role of environmental factors and geographical position (latitude and longitude).

4.6. Phylogenetic Relationships

The chloroplast genome offers several advantages over the nuclear genome, including haploid nature and maternal inheritance. With the development of DNA sequencing technology in recent years, the chloroplast genome has been widely used for phylogenetic analyses among plant species [7,32,35]. The topology of F. shweliensis and its close genera was strongly supported in previous phylogenetic studies based on the complete chloroplast genome [8]. However, the phylogenetic relationships among species of Fosbergia have not been clarified due to the lack of chloroplast gene sequencing data for the individual specie. To clarify the phylogenetic relationships of F. thailandica, F. petelotii, and F. shweliensis, this study constructed a phylogenetic tree using the complete chloroplast genomes of these three Fosbergia species and 14 other genera within Gentianales, employing both BI and ML methods. The results show that the phylogenetic tree is divided into two branches outside of the outgroup, which are Rubiaceae and Apocynaceae, supporting previous studies on Gentianales phylogeny [37]. In 2020, Geng et al. conducted phylogenetic analyses of the only publicly available chloroplast gene of Fosbergia, and showed that it is more closely related to Coffea [8]. After two years, another reported phylogenetic tree of Rubiaceae showed different results, with Fosbergia being more closely related to Gardenia compared to Coffea [9]. Both BI and ML trees in this study indicated that these four individuals from three Fosbergia species clustered in the same branch, with Gardenia forming a sister branch with high support, revealing a close affinity between the two. This supports the results of later-published phylogenetic studies involving Fosbergia [7]. In addition, F. petelotii is more closely related to F. shweliensis than to F. thailandica. Phylogenetic studies based on the chloroplast genome have increased our understanding of the interspecific evolutionary relationships of Fosbergia.

5. Conclusions

In this study, four complete chloroplast genomes from three Fosbergia species were sequenced and assembled, and the complete chloroplast genomes of F. thailandica and F. petelotii are reported for the first time. The chloroplast genome of Fosbergia forms a quadripartite molecular structure, a common phenomenon in angiosperms. Through the comparative analysis of four chloroplast genome sequences, two highly variable regions (trnS-trnG and psaA-ycf3) were developed as DNA marker loci, which can be used for further studies on species identification, and phylogenetic relationships. Phylogenetic analysis revealed that Fosbergia and Gardenia form sister groups, with F. petelotii being more closely related to F. shweliensis than to F. thailandica. The data and results presented in this paper will contribute to the study of the genomic and evolutionary relationships of this potentially endangered species.

Supplementary Materials

The following supporting information can be downloaded at: https://www.mdpi.com/article/10.3390/f15071150/s1, Figure S1: Comparison of IR/SC boundaries of the four Fosbergia chloroplast genomes; Table S1: GenBank accession numbers; Table S2: Annotated genes of four Fosbergia Chloroplast genomes; Table S3: Forms and numbers of non-SSR indel events in the plastome among F. petelotii, F. thailandica, and F. shweliensis; Table S4: Forms and numbers of inversion events in the plastome among F. petelotii, F. thailandica, and F. shweliensis; Table S5: Comparisons of mutational changes. Number of transitions (Ts) and transversions (Tv), synonymous (S), and non-synonymous (N) substitutions in gene coding regions among F. thailandica, F. petelotii, and F. shweliensis.

Author Contributions

Conceptualization, Y.S. and H.L.; Methodology, L.C. and W.Z.; Software, W.Z.; Validation, W.Z.; Formal analysis, L.C. and W.Z.; Resources, Y.S. and H.L.; Writing—original draft, L.C.; Writing—review & editing, L.C., W.Z., Y.S., Q.Z. and H.L.; Supervision, Y.S., Q.Z. and H.L.; Project administration, H.L.; Funding acquisition, Q.Z. and H.L. All authors have read and agreed to the published version of the manuscript.

Funding

This work was supported by the Key Laboratory of Ecology of Rare and Endangered Species and Environmental Protection (Ministry of Education), and the Chongzuo White-Headed Langur Field Observation and Research Station of Guangxi, Guangxi Normal University. The APC for this work was also covered by these supporters.

Data Availability Statement

The complete chloroplast genome sequences from four individuals of three Fosbergia species will be submitted via the revision process to the LCGDB (https://lcgdb.wordpress.com, accessed on 15 June 2024).

Conflicts of Interest

The authors declare no conflicts of interest.

References

  1. Zhang, M.D.; Chen, W.H.; Shui, Y.M. Miscellaneous notes on the tribe Gardenieae (Rubiaceae) from China and Vietnam. Acta Phytotaxon. Sin. 2007, 45, 90–93. [Google Scholar]
  2. Li, H.; Dao, Z.L.; Li, R. Reappraisal of Fosbergia shweliensis (Rubiaceae), a species endemic to the Gaoligong Mountains, Western Yunnan, China. Acta Phytotaxon. Sin. 2006, 44, 707–711. [Google Scholar] [CrossRef]
  3. Dao, Z.L.; Ji, Y.H.; Liu, T.; Liu, K.M.; Li, H. Development of ten polymorphic microsatellite loci for Fosbergia shweliensis (Rubiaceae), a potentially crisis endangered tree. Am. J. Bot. 2011, 98, e161–e163. [Google Scholar] [CrossRef] [PubMed]
  4. Li, A.H.; Yang, J.; He, H.J.; Yang, X.Y. Seed desiccation tolerance and germination of a potentially threatened Chinese species, Fosbergia shweliensis. Seed Sci. Technol. 2013, 41, 479–482. [Google Scholar] [CrossRef]
  5. Ly, S.N.; Garavito, A.; De Block, P.; Asselman, P.; Guyeux, C.; Charr, J.-C.; Janssens, S.; Mouly, A.; Hamon, P.; Guyot, R. Chloroplast genomes of Rubiaceae: Comparative genomics and molecular phylogeny in subfamily Ixoroideae. PLoS ONE 2020, 15, e0232295. [Google Scholar] [CrossRef]
  6. Wang, W.C.; Shao, F.Q.; Deng, X.; Liu, Y.W.; Chen, S.Y.; Li, Y.Q.; Guo, W.; Jiang, Q.B.; Liang, H.; Zhang, X.Z. Genome surveying reveals the complete chloroplast genome and nuclear genomic features of the crocin-producing plant Gardenia jasminoides Ellis. Genet. Resour. Crop Evol. 2020, 68, 1165–1180. [Google Scholar] [CrossRef]
  7. Saldaña, C.L.; Rodriguez-Grados, P.; Chávez-Galarza, J.C.; Feijoo, S.; Guerrero-Abad, J.C.; Vásquez, H.V.; Maicelo, J.L.; Jhoncon, J.H.; Arbizu, C.I. Unlocking the complete chloroplast genome of a native tree species from the amazon basin, capirona (calycophyllum spruceanum, rubiaceae), and its comparative analysis with other Ixoroideae species. Genes 2022, 13, 113. [Google Scholar] [CrossRef] [PubMed]
  8. Geng, Y.F.; Li, Y.Q.; Yuan, X.L.; Luo, T.; Wang, Y. The complete chloroplast genome sequence of Fosbergia shweliensis, an endemic species to Yunnan of China. Mitochondrial DNA Part B 2020, 5, 1796–1797. [Google Scholar] [CrossRef]
  9. Gong, S.F.; Miao, B.L.; Dong, X.X. Comparative analysis of complete chloroplast genomes of Gardenia jasminoides and contribution to the phylogeny and adaptive evolution. J. Am. Soc. Hortic. Sci. 2022, 147, 260–269. [Google Scholar] [CrossRef]
  10. Chen, S.; Zhou, Y.; Chen, Y.; Gu, J. Fastp: An ultra-fast all-in-one FASTQ preprocessor. Bioinformatics 2018, 34, i884–i890. [Google Scholar] [CrossRef] [PubMed]
  11. Jin, J.J.; Yu, W.B.; Yang, J.B.; Song, Y.; de Pamphilis, C.W.; Yi, T.S.; Li, D.Z. GetOrganelle: A fast and versatile toolkit for accurate de novo assembly of organelle genomes. Genome Biol. 2020, 21, 241. [Google Scholar] [CrossRef] [PubMed]
  12. Liu, C.; Shi, L.; Zhu, Y.; Chen, H.; Zhang, J.; Lin, X.; Guan, X. CpGAVAS, an integrated web server for the annotation, visualization, analysis, and GenBank submission of completely sequenced chloroplast genome sequences. BMC Genom. 2012, 13, 715. [Google Scholar] [CrossRef] [PubMed]
  13. Kearse, M.; Moir, R.; Wilson, A.; Stones-Havas, S.; Cheung, M.; Sturrock, S.; Buxton, S.; Cooper, A.; Markowitz, S.; Duran, C.; et al. Geneious Basic: An integrated and extendable desktop software platform for the organization and analysis of sequence data. Bioinformatics 2012, 28, 1647–1649. [Google Scholar] [CrossRef] [PubMed]
  14. Lohse, M.; Drechsel, O.; Kahlau, S.; Bock, R. OrganellarGenomeDRAW—A suite of tools for generating physical maps of plastid and mitochondrial genomes and visualizing expression data sets. Nucleic Acids Res. 2013, 41, W575–W581. [Google Scholar] [CrossRef]
  15. Kurtz, S.; Choudhuri, J.V.; Ohlebusch, E.; Schleiermacher, C.; Stoye, J.; Giegerich, R. REPuter: The manifold applications of repeat analysis on a genomic scale. Nucleic Acids Res. 2001, 29, 4633–4642. [Google Scholar] [CrossRef]
  16. Beier, S.; Thiel, T.; Münch, T.; Scholz, U.; Mascher, M. MISA-web: A web server for microsatellite prediction. Bioinformatics 2017, 33, 2583–2585. [Google Scholar] [CrossRef]
  17. Katoh, K.; Standley, D.M. MAFFT multiple sequence alignment software version 7: Improvements in performance and usability. Mol. Biol. Evol. 2013, 30, 772–780. [Google Scholar] [CrossRef] [PubMed]
  18. Hall, T.A. BioEdit: A user-friendly biological sequence alignment editor and analysis program for Windows 95/98/NT. Nuclc Acids Symp. Ser. 1999, 41, 95–98. [Google Scholar] [CrossRef]
  19. Rozas, J.; Ferrer-Mata, A.; Sánchez-DelBarrio, J.C.; Guirao-Rico, S.; Librado, P.; Ramos-Onsins, S.E.; Sánchez-Gracia, A. DnaSP 6: DNA sequence polymorphism analysis of large data sets. Mol. Biol. Evol. 2017, 34, 3299–3302. [Google Scholar] [CrossRef] [PubMed]
  20. Sharp, P.R.; Li, W.W. The codon Adaptation Index-a measure of directional synonymous codon usage bias, and its potential applications. Nucleic Acids Res. 1987, 15, 1281–1295. [Google Scholar] [CrossRef]
  21. Li, H.; Guo, Q.Q.; Xu, L.; Gao, H.D.; Liu, L.; Zhou, X.Y. CPJSdraw: Analysis and visualization of junction sites of chloroplast genomes. PeerJ 2023, 11, e15326. [Google Scholar] [CrossRef] [PubMed]
  22. Minh, B.Q.; Schmidt, H.A.; Chernomor, O.; Schrempf, D.; Woodhams, M.D.; von Haeseler, A.; Lanfear, R. IQ-TREE 2: New models and efficient methods for phylogenetic inference in the genomic era. Mol. Biol. Evol. 2020, 37, 1530–1534. [Google Scholar] [CrossRef] [PubMed]
  23. Ronquist, F.; Teslenko, M.; van der Mark, P.; Ayres, D.L.; Darling, A.; Höhna, S.; Larget, B.; Liu, L.; Suchard, M.A.; Huelsenbeck, J.P. MrBayes 3.2: Efficient bayesian phylogenetic inference and model choice across a large model space. Syst. Biol. 2012, 61, 539–542. [Google Scholar] [CrossRef] [PubMed]
  24. Kalyaanamoorthy, S.; Minh, B.Q.; Wong, T.K.F.; von Haeseler, A.; Jermiin, L.S. ModelFinder: Fast model selection for accurate phylogenetic estimates. Nat. Methods 2017, 14, 587–589. [Google Scholar] [CrossRef] [PubMed]
  25. Wicke, S.; Schneeweiss, G.M.; de Pamphilis, C.W.; Müller, K.F.; Quandt, D.J.P.M.B. The evolution of the plastid chromosome in land plants: Gene content, gene order, gene function. Plant Mol. Biol. 2011, 76, 273–297. [Google Scholar] [CrossRef]
  26. Qian, J.; Song, J.; Gao, H.; Zhu, Y.; Xu, J.; Pang, X.; Yao, H.; Sun, C.; Li, X.E.; Li, C.; et al. The complete chloroplast genome sequence of the medicinal plant Salvia miltiorrhiza. PLoS ONE 2013, 8, e57607. [Google Scholar] [CrossRef] [PubMed]
  27. Cao, Z.; Yang, L.; Xin, Y.; Xu, W.; Li, Q.; Zhang, H.; Tu, Y.; Song, Y.; Xin, P. Comparative and phylogenetic analysis of complete chloroplast genomes from seven Neocinnamomum taxa (Lauraceae). Front. Plant Sci. 2023, 14, 1205051. [Google Scholar] [CrossRef] [PubMed]
  28. Bock, R. Structure, function, and inheritance of plastid genomes. In Cell and Molecular Biology of Plastids; Bock, R., Ed.; Springer: Berlin/Heidelberg, Germany, 2007; pp. 29–63. [Google Scholar]
  29. Cavalier-smith, T. Chloroplast evolution: Secondary symbiogenesis and multiple losses. Curr. Biol. 2002, 12, R62–R64. [Google Scholar] [CrossRef]
  30. Nie, X.; Lv, S.; Zhang, Y.; Du, X.; Wang, L.; Biradar, S.S.; Tan, X.; Wan, F.; Weining, S. Complete chloroplast genome sequence of a major invasive species, crofton weed (Ageratina adenophora). PLoS ONE 2012, 7, e36869. [Google Scholar] [CrossRef]
  31. Zhao, K.; Zhou, Y. The chloroplast genome of Gardenia jasminoides and related phylogenetic analysis (Rubiaceae). Mitochondrial DNA Part B. 2020, 5, 1743–1745. [Google Scholar] [CrossRef]
  32. Liu, C.; Chen, H.; Cai, J.; Tian, X.; Han, L.; Song, Y. Characteristics of the complete plastid genome sequences of the monotypic genus dodecadenia (family: Lauraceae) and its phylogenomic implications. Forests 2022, 13, 1240. [Google Scholar] [CrossRef]
  33. Dong, Z.; Zhang, R.; Shi, M.; Song, Y.; Xin, Y.; Li, F.; Ma, J.; Xin, P. The complete plastid genome of the endangered shrub Brassaiopsis angustifolia (Araliaceae): Comparative genetic and phylogenetic analysis. PLoS ONE 2022, 17, e0269819. [Google Scholar] [CrossRef] [PubMed]
  34. Pauwels, M.; Vekemans, X.; Godé, C.; Frérot, H.; Castric, V.; Saumitou-Laprade, P. Nuclear and chloroplast DNA phylogeography reveals vicariance among European populations of the model species for the study of metal tolerance, Arabidopsis halleri (Brassicaceae). New Phytol. 2012, 193, 916–928. [Google Scholar] [CrossRef]
  35. Biju, V.C.; Shidhi, P.R.; Vijayan, S.; Rajan, V.S.; Sasi, A.; Janardhanan, A.; Nair, A.S. The complete chloroplast genome of Trichopus zeylanicus, and phylogenetic analysis with dioscoreales. Plant Genome 2019, 12, 190032. [Google Scholar] [CrossRef] [PubMed]
  36. Zhang, Y.; Zhang, J.-W.; Yang, Y.; Li, X.-N. Structural and comparative analysis of the complete chloroplast genome of a mangrove plant: Scyphiphora hydrophyllacea Gaertn. f. and related Rubiaceae species. Forests 2019, 10, 1000. [Google Scholar] [CrossRef]
  37. Fu, P.-C.; Zhang, Y.-Z.; Geng, H.-M.; Chen, S.-L. The complete chloroplast genome sequence of Gentiana lawrencei var. farreri (Gentianaceae) and comparative analysis with its congeneric species. PeerJ 2016, 4, e2540. [Google Scholar] [CrossRef] [PubMed]
  38. Levinson, G.; Gutman, G.A. Slipped-strand mispairing: A major mechanism for DNA sequence evolution. Mol. Biol. Evol. 1987, 4, 203–221. [Google Scholar] [CrossRef]
  39. Shimada, H.; Sugiura, M. Pseudogenes and short repeated sequences in the rice chloroplast genome. Curr. Genet. 1989, 16, 293–301. [Google Scholar] [CrossRef] [PubMed]
  40. Shaw, J.; Small, R.L. Chloroplast DNA phylogeny and phylogeography of the North American plums (Prunus subgenus Prunus section Prunocerasus, Rosaceae). Am. J. Bot. 2005, 92, 2011–2030. [Google Scholar] [CrossRef]
  41. Kim, K.-J.; Lee, H.-L. Widespread occurrence of small inversions in the chloroplast genomes of land plants. Mol. Cells 2005, 19, 104–113. [Google Scholar] [CrossRef]
  42. Pombert, J.F.; Lemieux, C.; Turmel, M. The complete chloroplast DNA sequence of the green alga Oltmannsiellopsis viridis reveals a distinctive quadripartite architecture in the chloroplast genome of early diverging ulvophytes. BMC Biol. 2006, 4, 3. [Google Scholar] [CrossRef] [PubMed]
  43. Palmer, J.D. Plastid chromosomes: Structure and evolution. In The Molecular Biology of Plastids: Cell Culture and Somatic Cell Genetics of Plants; Bogorad, L., Vasil, I.K., Eds.; Academic Press: San Diego, CA, USA, 1991; Volume 7A, pp. 5–53. [Google Scholar]
  44. Song, Y.; Yao, X.; Tan, Y.; Gan, Y.; Corlett, R.T. Complete chloroplast genome sequence of the avocado: Gene organization, comparative analysis, and phylogenetic relationships with other Lauraceae. Can. J. For. Res. 2016, 46, 1293–1301. [Google Scholar] [CrossRef]
  45. Zhao, W.; Guo, L.; Yang, Y.; Wang, Y.; Yang, L.; Wei, C.; Guo, J.; Yan, K.; Chen, H.; Yang, Z.; et al. Complete chloroplast genome sequences of Phlomis fruticosa and Phlomoides strigosa and comparative analysis of the genus Phlomis sensu lato (Lamiaceae). Front. Plant Sci. 2022, 13, 1022273. [Google Scholar] [CrossRef]
  46. Ge, Y.; Dong, X.; Wu, B.; Wang, N.; Chen, D.; Chen, H.; Zou, M.; Xu, Z.; Tan, L.; Zhan, R. Evolutionary analysis of six chloroplast genomes from three Persea americana ecological races: Insights into sequence divergences and phylogenetic relationships. PLoS ONE 2019, 14, e0221827. [Google Scholar] [CrossRef] [PubMed]
  47. Quan, X.; Zhou, S. Molecular identification of species in Prunus sect. Persica (Rosaceae), with emphasis on evaluation of candidate barcodes for plants. J. Syst. Evol. 2011, 49, 138–145. [Google Scholar] [CrossRef]
  48. Mo, Z.; Lou, W.; Chen, Y.; Jia, X.; Zhai, M.; Guo, Z.; Xuan, J. The chloroplast genome of Carya illinoinensis: Genome structure, adaptive evolution, and phylogenetic analysis. Forests 2020, 11, 207. [Google Scholar] [CrossRef]
  49. Dai, J.P.; Liu, Q.Z.; Xu, X.Y.; Tan, Z.J.; Lin, Y.X.; Gao, X.X.; Zhu, S. Comparative and phylogenetic analysis of the complete chloroplast genomes of Uncaria (Rubiaceae) species. Front. Plant Sci. 2023, 14, 1271689. [Google Scholar] [CrossRef] [PubMed]
  50. Plotkin, J.B.; Kudla, G. Synonymous but not the same: The causes and consequences of codon bias. Nat. Rev. Genet. 2011, 12, 32–42. [Google Scholar] [CrossRef]
  51. Morton, B.R. The role of context-dependent mutations in generating compositional and codon usage bias in grass chloroplast DNA. J. Mol. Evol. 2003, 56, 616–629. [Google Scholar] [CrossRef] [PubMed]
  52. Raman, G.; Park, S.; Lee, E.M.; Park, S. Evidence of mitochondrial DNA in the chloroplast genome of Convallaria keiskei and its subsequent evolution in the Asparagales. Sci. Rep. 2019, 9, 5028. [Google Scholar] [CrossRef]
Figure 1. Gene map of Fosbergia chloroplast genomes. An asterisk (*) following a gene name indicates that the gene contains introns.
Forests 15 01150 g001
Figure 2. Analysis of long repeats in four Fosbergia chloroplast genomes. (A) Type of repeats and number of repeat sequences longer than 25 bp. (B) Distribution of long repeats.
Forests 15 01150 g002
Figure 3. Analysis of simple sequence repeats (SSRs) in four Fosbergia chloroplast genomes. (A) Number of selected motifs of SSRs. (B) Distribution of SSRs.
Forests 15 01150 g003
Figure 4. The patterns of nucleotide substitutions among F. shweliensis, F. petelotii, and F. thailandica chloroplast genomes. The chloroplast genome of F. thailandica (SY9674) was used as a reference.
Forests 15 01150 g004
Figure 5. Sliding window analysis of the nucleotide variability (Pi) among four Fosbergia chloroplast genomes. The window length was 600 bp, with a step size of 200 bp. The X-axis represents the position of the midpoint of a window, while the Y-axis represents the nucleotide diversity of each window. Indels are identified by blue circles, while red circles identify the positions of SNPs. The red text marks regions where the pi values are greater than 0.003.
Forests 15 01150 g005
Figure 6. Relative synonymous codon usage (RSCU) in the four Fosbergia chloroplast genomes.
Forests 15 01150 g006
Figure 7. The phylogenetic tree of the complete plastid genomes for 25 Gentianales was created using ML analysis and BI. The red markers refer to Fosbergia species in this study. The numbers on the branches represent BI posterior probabilities (PPs) and ML bootstrap (BS) values. Asterisks (*) denote branches with a BS/PP of 100/1.00, respectively.
Forests 15 01150 g007
Table 1. Summary of four complete chloroplast genomes of Fosbergia.
Fosbergia shweliensisFosbergia thailandicaFosbergia thailandicaFosbergia petelotii
VoucherSY6456SY9590SY9674SY9593
Total cpDNA size (bp)154,717154,623 154,628 154,730
LSC region (bp)84,747 84,662 84,667 84,769
IRs region (bp)25,870 25,870 25,870 25,870
SSC region (bp)18,230 18,221 18,221 18,221
Total GC content (%)37.6%37.6%37.6%37.6%
LSC GC content (%)35.5%35.5%35.5%35.5%
IR GC content (%)43.2%43.2%43.2%43.2%
SSC GC content (%)31.4%31.4%31.4%31.4%
Total number of genes130130130130
Total number of PCG85858585
Total number of tRNA37373737
Total number of rRNA8888
Table 2. Location of simple sequence repeats in the Fosbergia chloroplast genomes.
No.LocationRegionMotifNo. of Repeats
F. shweliensisF. petelotiiF. thailandica
(SY9674)
F. thailandica
(SY9590)
1trnH-psbAIntergenicT17151016
2trnH-psbAIntergenicA11141012
3trnK-rps16IntergenicC10899
4rps16IntronT11111110
5psbK-psbIIntergenicT10101111
6atpFIntronTTAGAA3233
7atpH-atpIIntergenicA10111010
8atpI-rps2IntergenicA14141313
9petN-psbMIntergenicC5333
10psbC-trnSIntergenicA9898
11psbZ-trnGIntergenicC7666
12ycf3IntronA99910
13trnT-trnLIntergenicTA4455
14ndhK-ndhCIntergenicT910910
15rbcL-accDIntergenicT14151514
16petA-psbJIntergenicA91089
17psbE-petLIntergenicA101099
18petL-petGIntergenicT101099
19rpl20-rps12IntergenicA8889
20clpPIntronT12111212
21petD-rpoAIntergenicA12131212
22infA-rps8IntergenicT13121313
23ndhF-rpl32IntergenicA11101010
24rpl32-trnLIntergenicT6566
25rpl32-trnLIntergenicA8988
Disclaimer/Publisher’s Note: The statements, opinions and data contained in all publications are solely those of the individual author(s) and contributor(s) and not of MDPI and/or the editor(s). MDPI and/or the editor(s) disclaim responsibility for any injury to people or property resulting from any ideas, methods, instructions or products referred to in the content.