Abstract
This study aimed to assess the adaptive capacity of the dominant tree species in Lithuania, namely Scots pine, Norway spruce, and silver birch, to current climate conditions based on their changes in transpiration expressed through the tree sap flow intensity. The species-specific responses were investigated at two typical edaphically different forest sites with water-limited and water-saturated soils. Contrasting events like overflow in 2017 and drought in 2019 provided an opportunity to detect the adaptative capacity of the monitored tree species to these meteorological extremes. Norway spruce trees, due to having both the most intense sap flow at the beginning of the growing season and the longest period of active transpiration, demonstrated the highest annual transpiration rate, regardless of the hydrological regime of the site. Their decreased resilience to subsequent biogenic damage caused by pests due to a significant decrease in sap flow density during intense and prolonged droughts may reduce their importance in Lithuanian forestry. Silver birch trees, which demonstrated a reduction in sap flow after a drought following the untimely drop of their leaves and the end of active vegetation, even at the end of a prolonged warm period, can be seen to not have appropriate adaptations to current climate conditions. Scots pine trees are the best adapted to mitigating the recent threats of climate change.
1. Introduction
Forest ecosystems are one of the keystones of the entire biosphere, playing an active role in global atmospheric gas and water cycles. The significant effects of climate change on mature trees’ physiological status, structure, species composition, growth, and productivity have been observed in the northeastern region of Europe [1,2,3,4,5,6,7]. On the one hand, the productivity of some tree species and individual stands has increased due to a rising mean temperature, increasing CO2 concentrations, rising nitrogen concentrations in precipitation, and a lengthening growing season [8,9,10]. However, due to the inability to adapt to changing environmental conditions, large-scale damage and death of individual trees or entire stands has increasingly been recorded [2,3,11,12].
Understanding the physiological response of plants to climate change is essential for assessing the ability of plants to adapt to extreme weather conditions. Transpiration, as the primary component of forest evapotranspiration, not only symbolizes the fundamental physiological and ecological activities of plants but it also has an effect on forest hydrological balance [13,14,15]. It represents the main evaporative flux from terrestrial ecosystems, controlling the land surface energy balance and influencing regional and global climate. Information about the flow of water through trees, driven by transpiration, is central to the whole field of tree–water relations [16]. Sap flow, an indicator of water movement in tree trunks, has a strong linear relationship with individual tree transpiration [17,18,19]. Accurate estimates of individual tree transpiration are significant for plant physiology, hydrology, gas exchange, and biomass accumulation studies [17,19,20,21]. Therefore, the sap flow measurement method is usually used as a transpiration measurement approach for individual trees [13].
Transpiration regulation by plants is a key process that underlies vegetation drought responses and land evaporation under global changes [22]. Loss of hydrological function has been addressed in many drought-induced mortality studies, but still little is known about different plant hydraulic thresholds and strategies related to drought resilience [16,23]. Thus, sap flow measurements can be used as a warning metric and can provide a critical foundation for elucidating the physiological mechanisms underpinning tree mortality in mature forests and guiding management responses to these climate-induced disturbances [24].
Therefore, integrated studies assessing both the effects of individual environmental factors on specific physiological processes and their long-term effects on trees’ ecophysiological reactions to contrasting meteorological conditions are needed to elucidate the current responses and predict the potential responses of individual species to climate change. A good understanding of the responses of individual species to changing environmental factors would allow us to adapt to and maintain healthy and productive forest ecosystems, ensuring their sustainability.
In this study, we hypothesized that the different sap flow densities of the prevailing tree species in Lithuania, namely Scots pine (Pinus sylvestris L.), Norway spruce (Picea abies (L.) H. Karst), and silver birch (Betula pendula L.), under different hydrological and fertility regimes in relation to contrasting meteorological events would allow for assessment of their adaptive capacity to the current climate in hemiboreal forests.
The aim of this research work is to determine the adaptive capacity of the dominant tree species in Lithuania to the integrated effects of environmental factors by elucidating the causal ecophysiological responses in the sap flow density rate of individual trees under contrasting environmental conditions. To meet the aims of this study, the following objectives were set out:
- To determine the sap flow density rates of the dominant tree species under different growing conditions;
- To clarify the effects of extreme meteorological factors on the sap flow density rate of the dominant tree species in forest sites with different hydrological regimes;
- To detect the responses of the sap flow density of the considered tree species to drought at different forest sites;
- Based on the obtained results, to assess the species-specific ability of the considered tree species to adapt to changing meteorological conditions under different growing conditions.
The obtained data will provide greater insights to foster a better understanding of trees’ ecophysiological reactions to contrasting meteorological events at different forest sites, which may highlight the importance of the tree species to Lithuanian forestry.
2. Material and Methods
2.1. Study Site
This study was carried out at Aukštaitija Integrated Monitoring Station (AIMS) in the northeastern part of Lithuania, in Aukštaitija National Park, the Ažvinčiai strict nature reserve, and its surroundings (Figure 1), applying the ICP IM methodology established in 1993 [25,26].
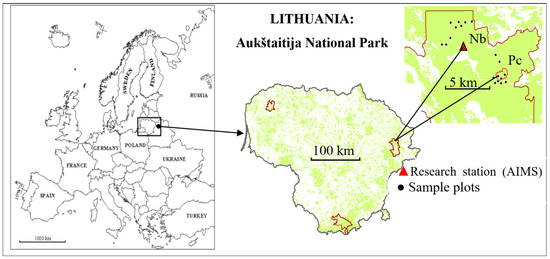
Figure 1.
Research site, eastern Lithuania, Aukštaitija National Park. Relatively dry, oligotrophic forest site—Nb FS; relatively wet, mezzo-eutrophic forest site—Pc FS.
The research work was carried out in mature, mixed, naturally regenerated forest stands dominated by Scots pine (Pinus sylvestris L.), with a strong admixture of Norway spruce (Picea abies Karst.) and silver birch (Betula pendula Roth.) trees. These stands are typical not only for Lithuanian forests but also for the entire northeastern region of hemiboreal forest.
To address the objectives of this study, sap flow seasonal variation was analyzed during the years 2016–2019 at two forest sites (FSs) with different hydrological regimes and fertilities. The forest site (FS) Nb (55.463557, 26.00392 WGS) is characterized as a poor, normal-humidity, oligotrophic FS with a groundwater table at a depth of more than 8 m, located on a flavio-aquatic accumulation with sand, gravel, and stones. The soil type is a deep (>120 cm) haplic arenosol, with a high proportion of sand (~90%).
The forest site Pc (55.437078, 26.06191 WGS) is characterized as a fertile, water-saturated, mezzo-eutrophic, lowland peatland FS, with a groundwater level at a soil depth of around 50 cm. The soil type is a deep (>80 cm) terric histosol consisting mostly of low-moor deep eutrophic peat soil. The soil properties of both sites (Table 1) were determined by assessing excavated soil profiles and analyzing samples from the relevant horizons.

Table 1.
Soil characteristics at the forest sites Nb and Pc.
Both stands are natural or seminatural, and are self-regenerating with a mixed age composition and a high proportion of mature and overmature trees [27].
2.2. The Parameters of the Monitored Trees
To detect the effect of meteorological factors on the sap flow density rate of the considered tree species, 4–7 healthy stand-dominant forest trees representing Kraft class II of each species [28] were selected to address the objectives of this study at each FS (Table 2). The parameters of the selected trees are presented in Table 3.
Table 2.
Stand parameters for the considered Nb and Pc forest sites.
Table 3.
Initial parameters of the monitored trees at the considered Nb and Pc forest sites.
2.3. Tree Sap Flow Density
Xylem sap flow measurements to estimate forest transpiration at both the individual-tree and stand scales [15,29,30] were conducted by applying the heat ratio method [31] using a sap flow meter (SFM1) from ICT International (Armidale, NSW 2350, Australia) [32]. Sap flow sensors were installed at stem heights of approximately 130 cm in the N position and sheltered with aluminum foil caps. Sensor needles with measurement points at depths of 0.75 and 2.25 cm were installed in the sapwood following the SFM1 manual, ICT international. To determine wood properties (fresh and dry weight and thermal diffusivity) and to measure sapwood area, sapwood cores of 10 surrounding trees per species were taken with a Pressler drill. The sapwood area for the sample trees was determined via equations for each species, derived from the correlation of the basal area and the sapwood depth of the analyzed trees [33,34]. Sap flow was continuously monitored from April 2016 to October 2019 using a 15 min measuring interval and using a heating power of 20 J. To eliminate tree size-related differences according to Edwards et al. (1997), sap flow per tree data were converted to the sapwood area-related flow rate—Qs (mL per cm2 of sapwood area per time span) [35].
2.4. Meteorology
Meteorological data were provided by Aukštaitija IM station (AIMS). The following parameters for each one-hour interval were recorded: wind speed, wind direction, atmospheric pressure, precipitation amount, relative air and soil humidity, air and soil temperature, and sun radiation [7,26].
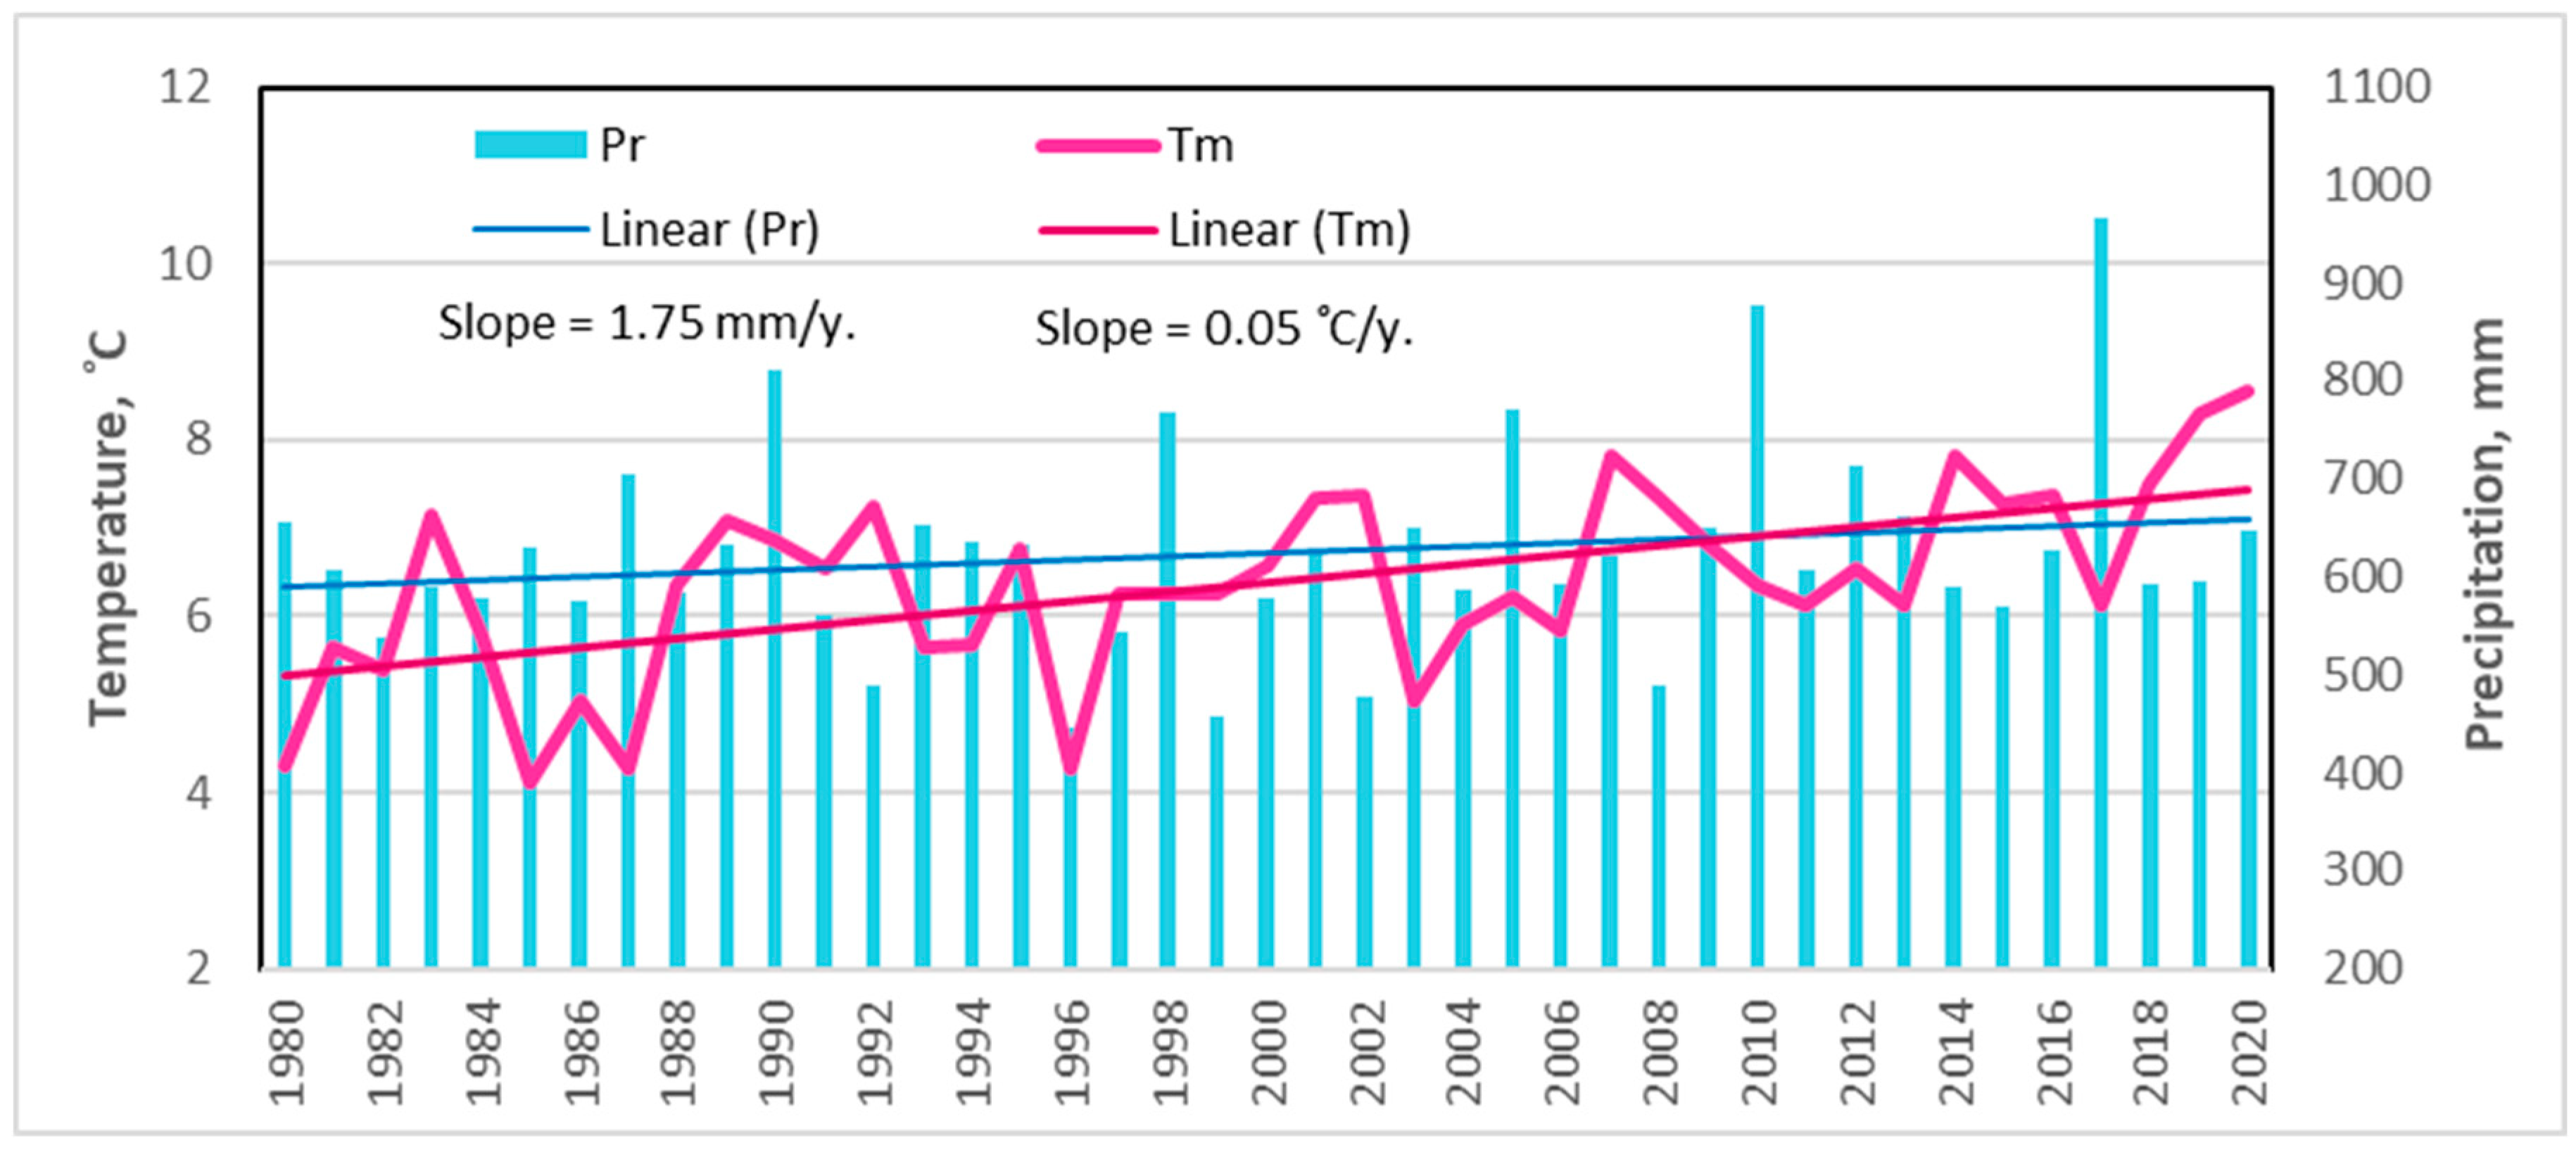
Long-term meteorological data analysis revealed that during the last 40-year period (1980–2020), the mean annual October–September temperature ranged from +4.0 °C (1985) to more than +8 °C in 2019 and 2020. A statistically significant upward trend of 0.05 °C was thus observed (Figure 2).
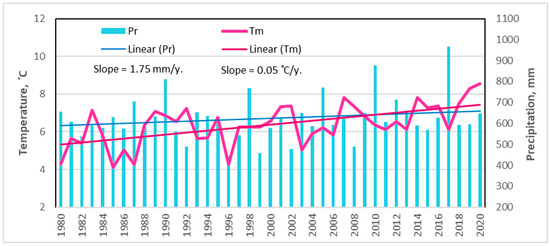
Figure 2.
Changes in mean annual (October–September) temperature and precipitation in the northeastern part of Lithuania during the period of 1980–2020 [36].
A significant increase in the mean November and December temperatures resulted in this annual temperature increase. The temperature change for the other months fluctuated around zero and did not demonstrate significant increasing trends (p > 0.05).
For the long-term period, the average annual October–September rainfall increased by 1.75 mm per year, but this tendency was not statistically significant. Based on a monthly scale, the obtained results revealed a significant increase in precipitation only in July.
Based on the Lithuanian Hydrometeorological Service [36], 2019–2020 were the hottest years and 2017 was the wettest year in this part of the country since the beginning of instrumental measurements in 1770 [36].
To estimate the drying force of the air, the vapor pressure deficit (VPD) was calculated based on relative humidity and temperature according to Equation (1):
where RH is the relative humidity and SVP is the saturated vapor pressure.
VPD = ((100 − RH)/100) × SVP
The SVP (es) was calculated using the MAGNUS Equations (2) and (3),
es (t) = 6.11 × 107.45×T/(237.3+T) (hPa) when t > 0 °C
es (t) = 6.11 × 109.5×T/(265.5+T) (hPa) when t < 0 °C
2.5. Statistical Analysis
The significance of differences between mean values of sap flow of different species, between FSs, or among periods, was estimated by applying analysis of variance (ANOVA) of a single-factor function in STATISTICA 10 software. The level of significance of the F criterion was set at p < 0.05. The relationship between individual physiological parameters and meteorological factors was assessed using the linear Pearson correlation. The specific nonlinear effects of the individual environmental factors over the course of the growing season were expressed by a polynomic equation of the third degree, the parameters of which were determined by means of the least squares method using the Excel extension SOLVER. For all statistical analyses, t-tests and F-tests p < α were used to determine the significance of the correlation and coefficient of determination at α = 0.05.
3. Results
3.1. Meteorological Conditions in the Northeastern Part of Lithuania in the 2016–2019 Period
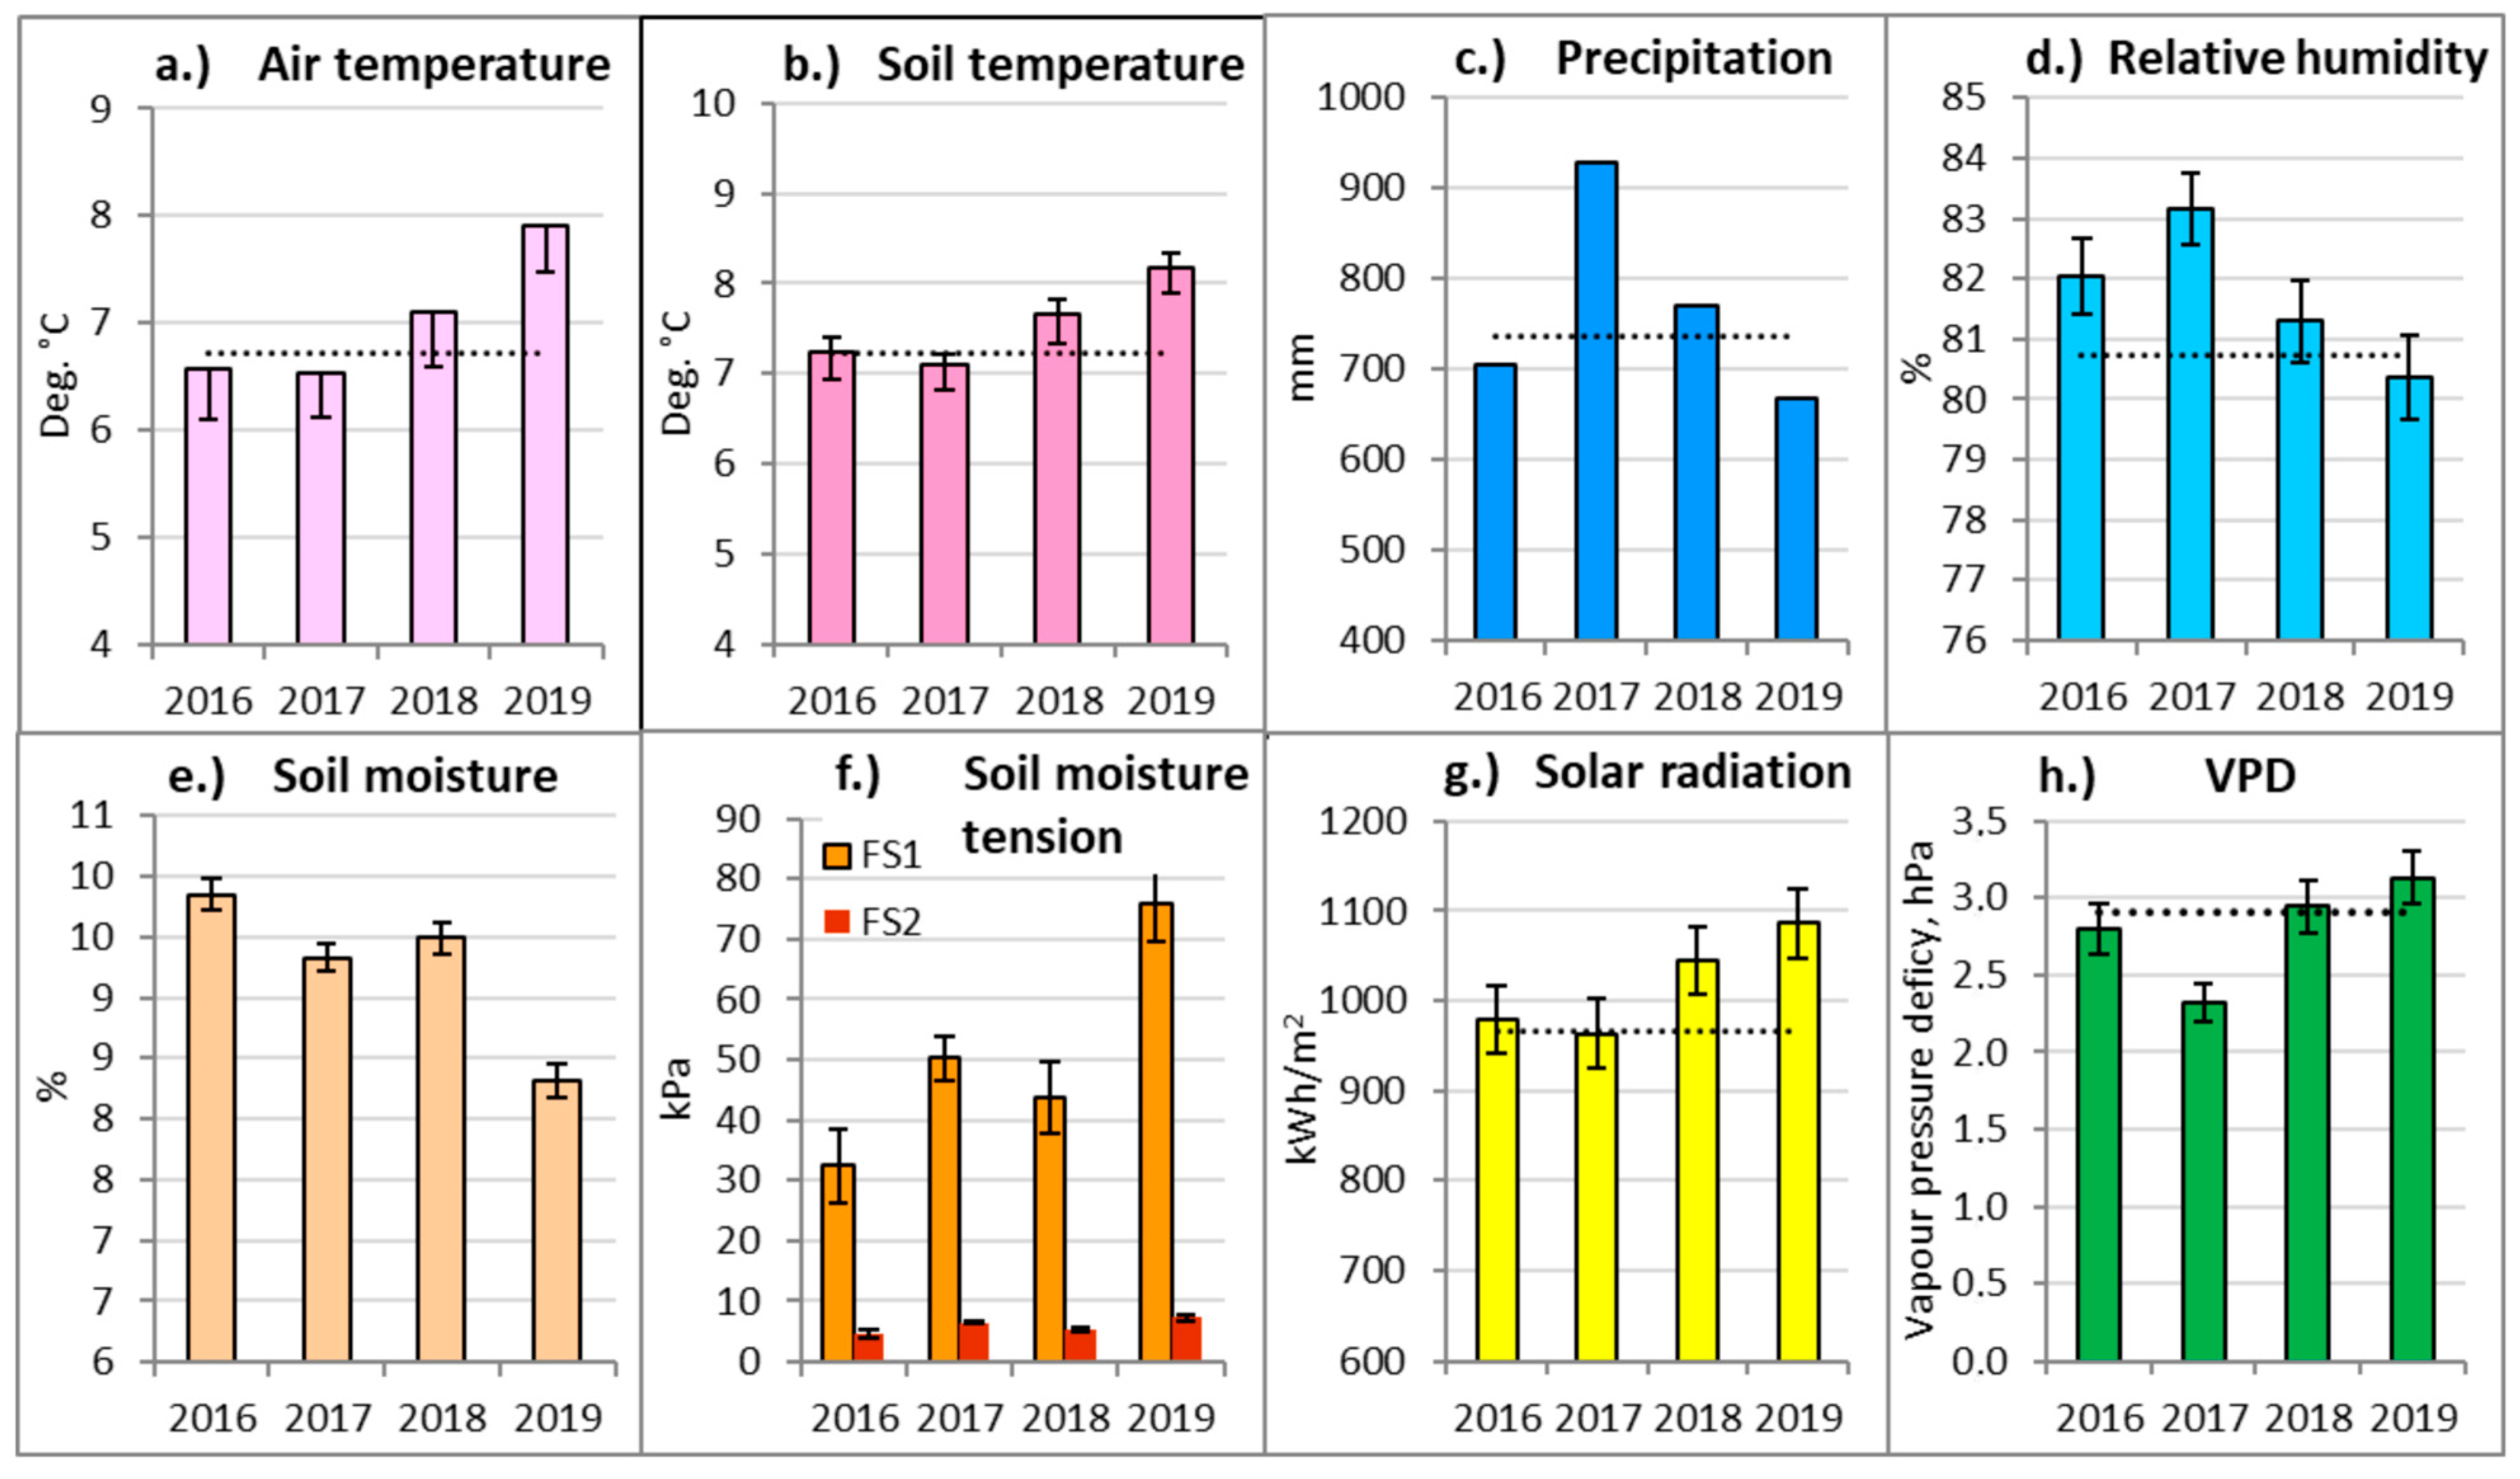
Analysis of the meteorology of the studied period allowed us to exclude the most contrasting and extreme meteorological events and their periods. Air and soil temperatures during the first part of the study period (2016–2017) were close to or below the long-term (1999–2019) climatic averages (Figure 3a,b). In the second part of the study period (2018–2019), both the air and soil mean annual temperatures were significantly higher compared to the long-term average. The year 2019 was the hottest year at Aukstaitija IMS, exceeding the long-term (1999–2019) average by more than 1.0 °C.
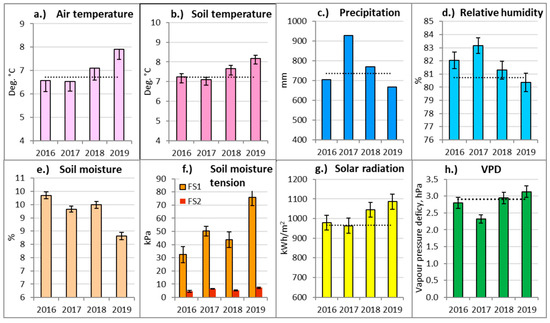
Figure 3.
Annual meteorological parameters and the standard errors (±SE) of Aukštaitija IMS for the considered period and their comparison with the long-term (1999–2019) averages (dashed lines). FS1—Nb FS; FS2—Pc FS.
Monthly air and soil temperatures were exceptionally low in April–July 2017 and, controversially, 3.5 °C above the long-term average in June 2019. This was the highest monthly temperature recorded at Aukstaitija IMS. As a result, the meteorological summer, or the period when the average daily air temperature rose above 15 °C, started three weeks earlier than usual. Monthly soil temperatures generally followed a similar pattern to air temperatures.
The annual rainfall in 2016 and 2019 was close to the long-term norm (Figure 3c). By contrast, in 2017, the precipitation amount reached its highest value (1019.2 mm), exceeding the long-term average for AIMS by 38.2%. Due to that, 2017 was the wettest year at Aukstaitija IMS.
Monthly rainfall was exceptionally high throughout the whole growing season in 2017, except for May. May and June were exceptionally dry compared to the long-term average for all of the considered study years (2016–2019), except for the rainy 2017. Excluding June 2017, the average May–June rainfall for the considered study period was >50% below the long-term average. April and June 2019 were exceptionally dry, with the rainfall amounting to only 40.8% of the long-term average for the study area.
The annual relative air humidity (Figure 3d) was the highest in 2017. High humidity and low temperatures also led to an exceptionally low water vapor pressure deficit in 2017 (Figure 3h). In the second half of the considered period (2018–2019), the average annual humidity was significantly lower than over the first two-year period.
The annual relative soil moisture and soil water potential were measured only from 2016 onwards, so there were no long-term data to compare with. In the dry oligotrophic Nb FS, soil was significantly drier in 2018–2019, while in 2019, the soil water potential was the highest. By contrast, the soil water potential remained very low throughout all of the considered period in the wet, mezzo-eutrophic Pc FS.
The years 2018–2019 were also characterized by a significantly higher total annual solar radiation and a slightly higher vapor pressure deficit (Figure 3g,h). Exceptionally low values of VPD were recorded for almost the entirety of the 2017 growing season, except for May. The highest value of VPD was detected in June 2019. The number of sunshine hours in April 2019 exceeded the long-term monthly average by 53%, and in June by 30%. The months of April and July 2017 were characterized by relatively lower solar radiation than usual.
Generalizing meteorological data, the year 2017 was relatively cool and exceptionally rainy and wet. By contrast, 2019 was extremely hot and relatively sunny and dry, which led to an extreme decrease in soil moisture and an increase in soil water potential in the drier Nb FS. These parameters indicated that 2017 and 2019 were the years with very extreme, contrasting and significantly different conditions affecting tree physiology, resulting in these years becoming the main research objects in this study.
3.2. Meteorological Extremes in 2019
As drought and heat wave events are likely to become more frequent and stronger in the region in the future, the year 2019 was chosen for a more detailed period-by-period sap flow study. Based on soil moisture and precipitation data, the drought period of DOY 174–185 in 2019 was chosen for a more detailed investigation (Table 4), when the average soil moisture in the Nb forest site was below 4% and even dropped below 2.5% in the topsoil layer. The soil water potential in the Nb FS remained above >120 cbar, while some of the sensors showed a maximum available value of 200 cbar at a 40 cm depth.
Table 4.
Meteorological parameters of separated periods for individual sap flow analyses in 2017 and 2019 at the Nb and Pc forest sites.
The excluded period was also characterized by a high VPD, high air and soil temperatures, and intensive solar activity (Table 4). To distinguish the drought-induced effects on tree sap flow, four periods were identified based on the changes in sap flow density and meteorology:
- I:
- Beginning of the season, DOY 82–135—from the beginning of continuous sap flow until the soil temperature reached 9 °C, when the leaf spread of birch trees reached 80%.
- II:
- before drought, DOY 136–173—from the end of the first period until the drought.
- III:
- drought, DOY 174–185—when the soil water content at the Nb FS was below 4% and the soil water potential was <120 kPa.
- IV:
- after drought, DOY 186–260—from the end of the drought until the end of heavy vegetation and the beginning of the leaf yellowing of birch trees.
To compare the ecophysiological reactions of trees during different meteorological events, the same periods were separated in 2017. The detected reactions of monitored trees during these different periods allow us to address the main objectives of this study.
3.3. Sap Flow and Its Seasonal Variation at Forest Sites with Different Hydrological Regimes
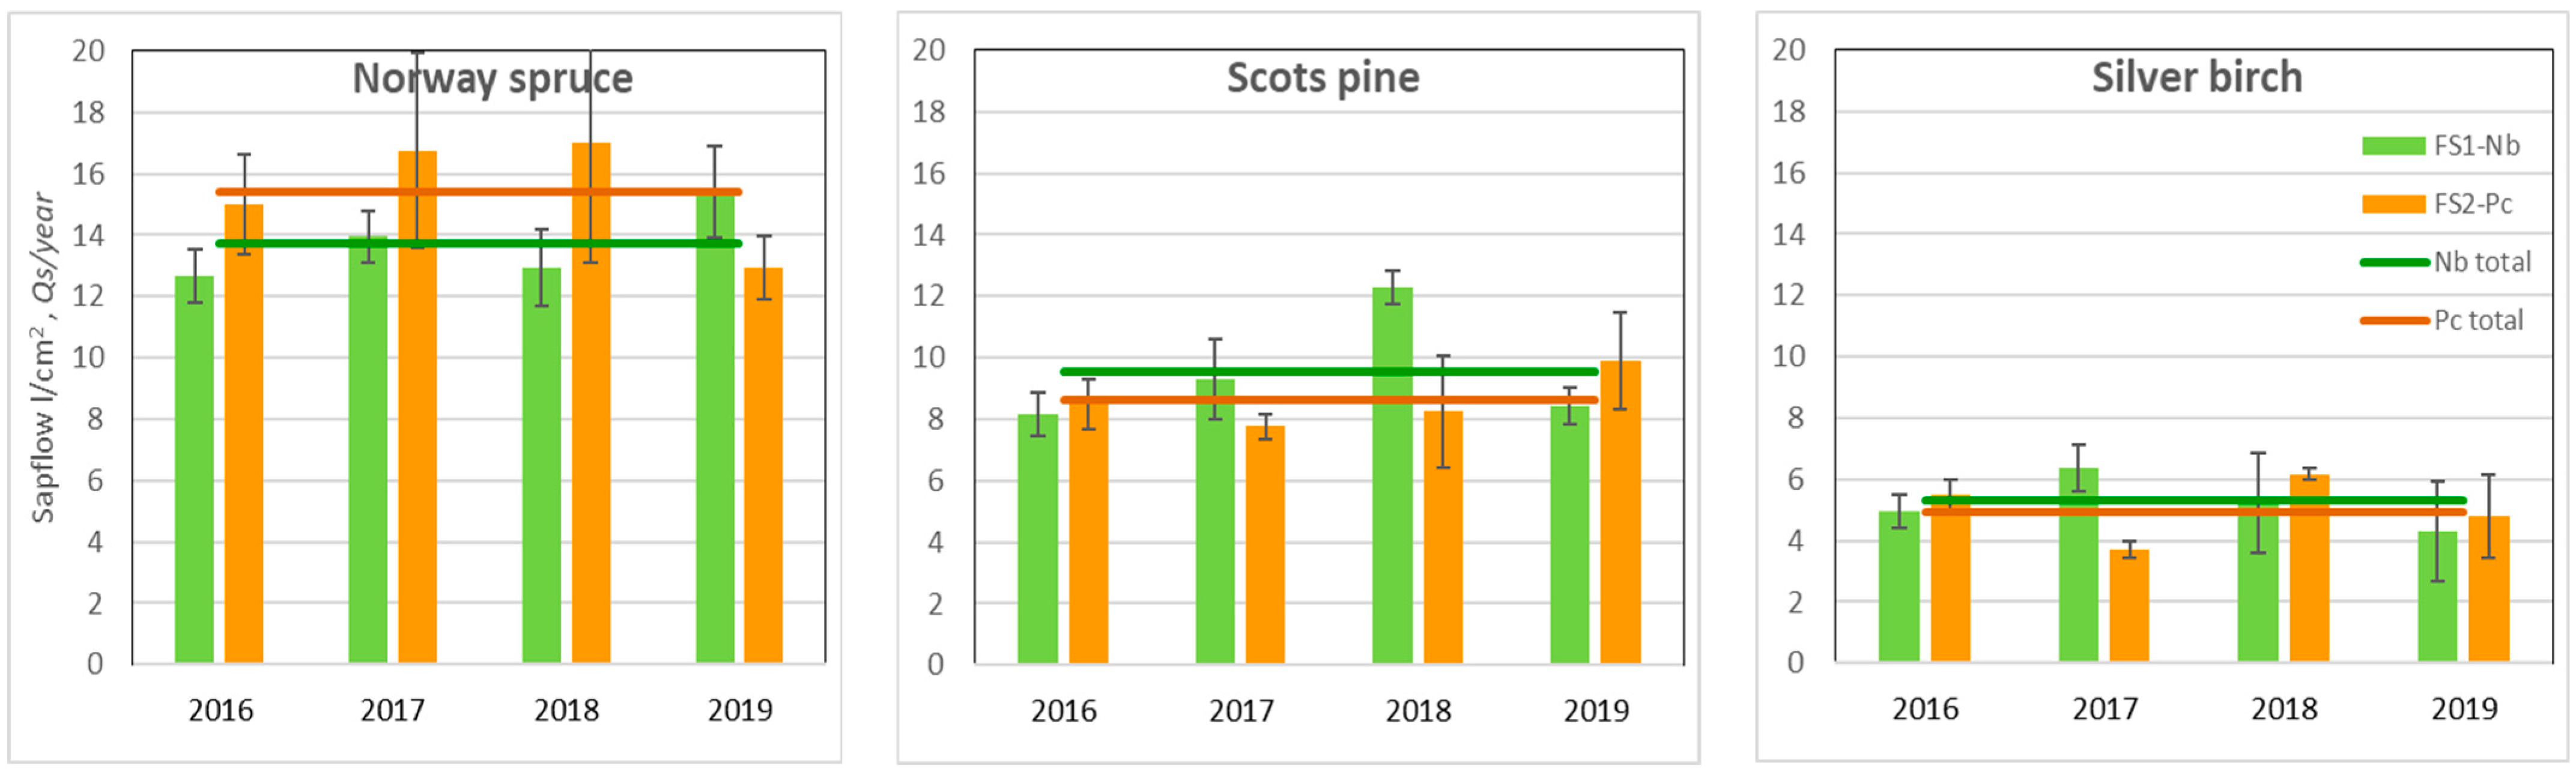
The obtained results suggested that Norway spruce was the most water-demanding species, while silver birch, in contrast, was the least water-demanding species (Figure 4). There was no significant difference in the annual sap flow density per cm2 sapwood area per year (Qs) between the same species located in FSs with different hydrological regimes. The absence of these significant differences between the FSs indicated that, in general, soil moisture was not a limiting factor of annual Qs during the study.
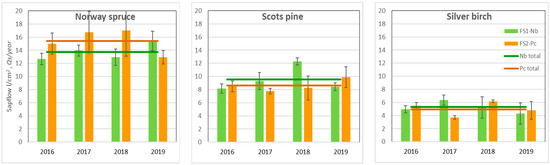
Figure 4.
Mean annual value of the sap flow density per basal area (Qs) unit over the 2016–2019 period and the standard errors (±SE).
In the hot and dry year of 2019, when soil moisture during the growing season highly decreased (Figure 4), spruce at the dry Nb FS transpired most intensively. During the most humid year, pine and birch trees demonstrated higher sap flow density rates at the relatively drier Nb FS.
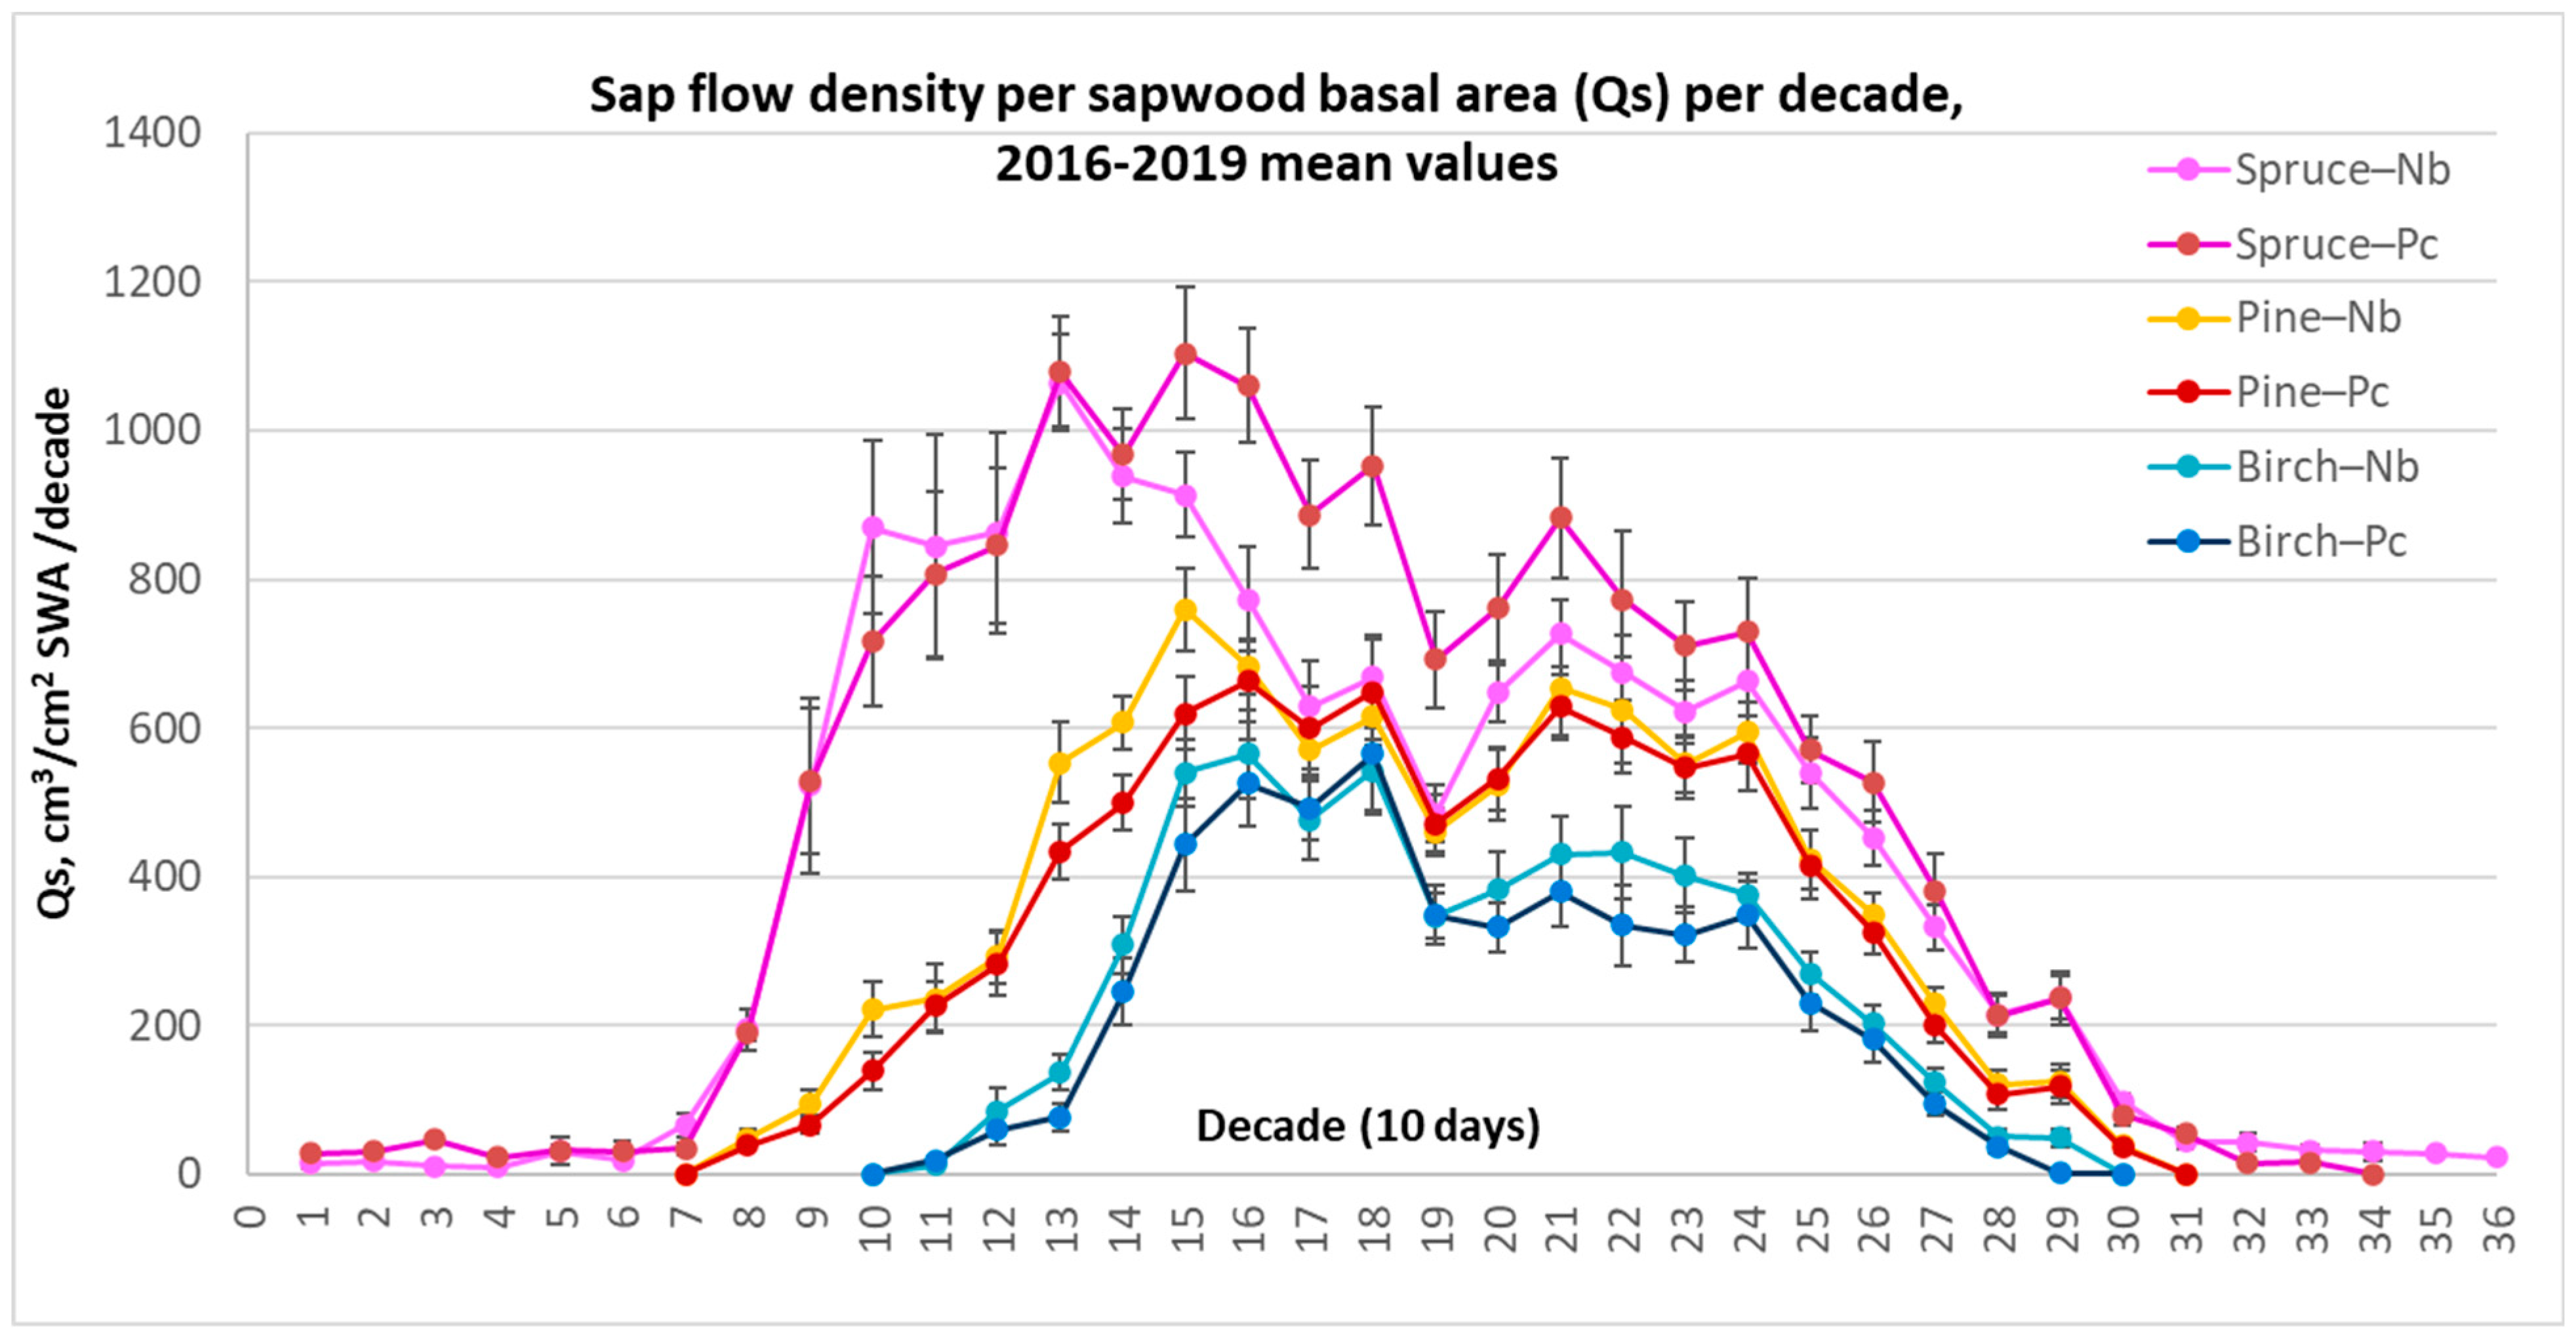
Seasonal analysis of the sap flow variation showed that all of the considered tree species had unique, species-related annual sap flow curves (Figure 5). Norway spruce clearly had the longest season of active transpiration (251.5 days) and, despite low values, transpired even in wintertime (decades 1–7, 31–36), during the temporal thawing (Table 5). By contrast, birch trees, due to their annual leaf-driven phenology, had the shortest period of active transpiration (165.2 days). The length of the season of pines was close to that of spruce (224.5 days), but in contrast, the sap flow density significantly declined during temporal thawing.
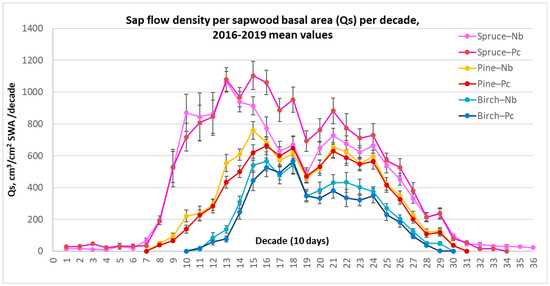
Figure 5.
Average values of species-specific sap flow density (Qs) for 10-day periods per 1 cm2 sap wood area (SWA) at different Nb and Pc forest sites during the whole investigated 4-year period from 2016 to 2019, along with the standard errors (±SE).
Table 5.
The term and length of vegetation periods in 2016–2019.
Norway spruce demonstrated exceptionally high Qs values at the beginning of the season (decades 9–15) (Figure 5). This could have been the result of faster topsoil warming, where most of spruce trees’ roots are located. Also, it may have been the consequence of better lighting conditions as the leaves of deciduous species only start to unfold at that time. These were the key findings indicating the main differences in seasonal sap flow density rate among the considered tree species.
It should be noticed that during decades 19–20, all tree species showed a synchronous temporary reduction in sap flow intensity, apparently due to the recurrence of cool and rainy periods after the dry periods in decades 15–18 during all four consecutive years.
For spruce only, a significant difference in Qs between forest sites was recorded during decades 14–19 after a dry April–May. At that time, probably due to significant reduction in soil moisture, spruce displayed significantly reduced Qs values, especially at the relatively dry (Nb) FS.
3.4. Sap Flow Density of the Considered Tree Species during Contrasting Seasons
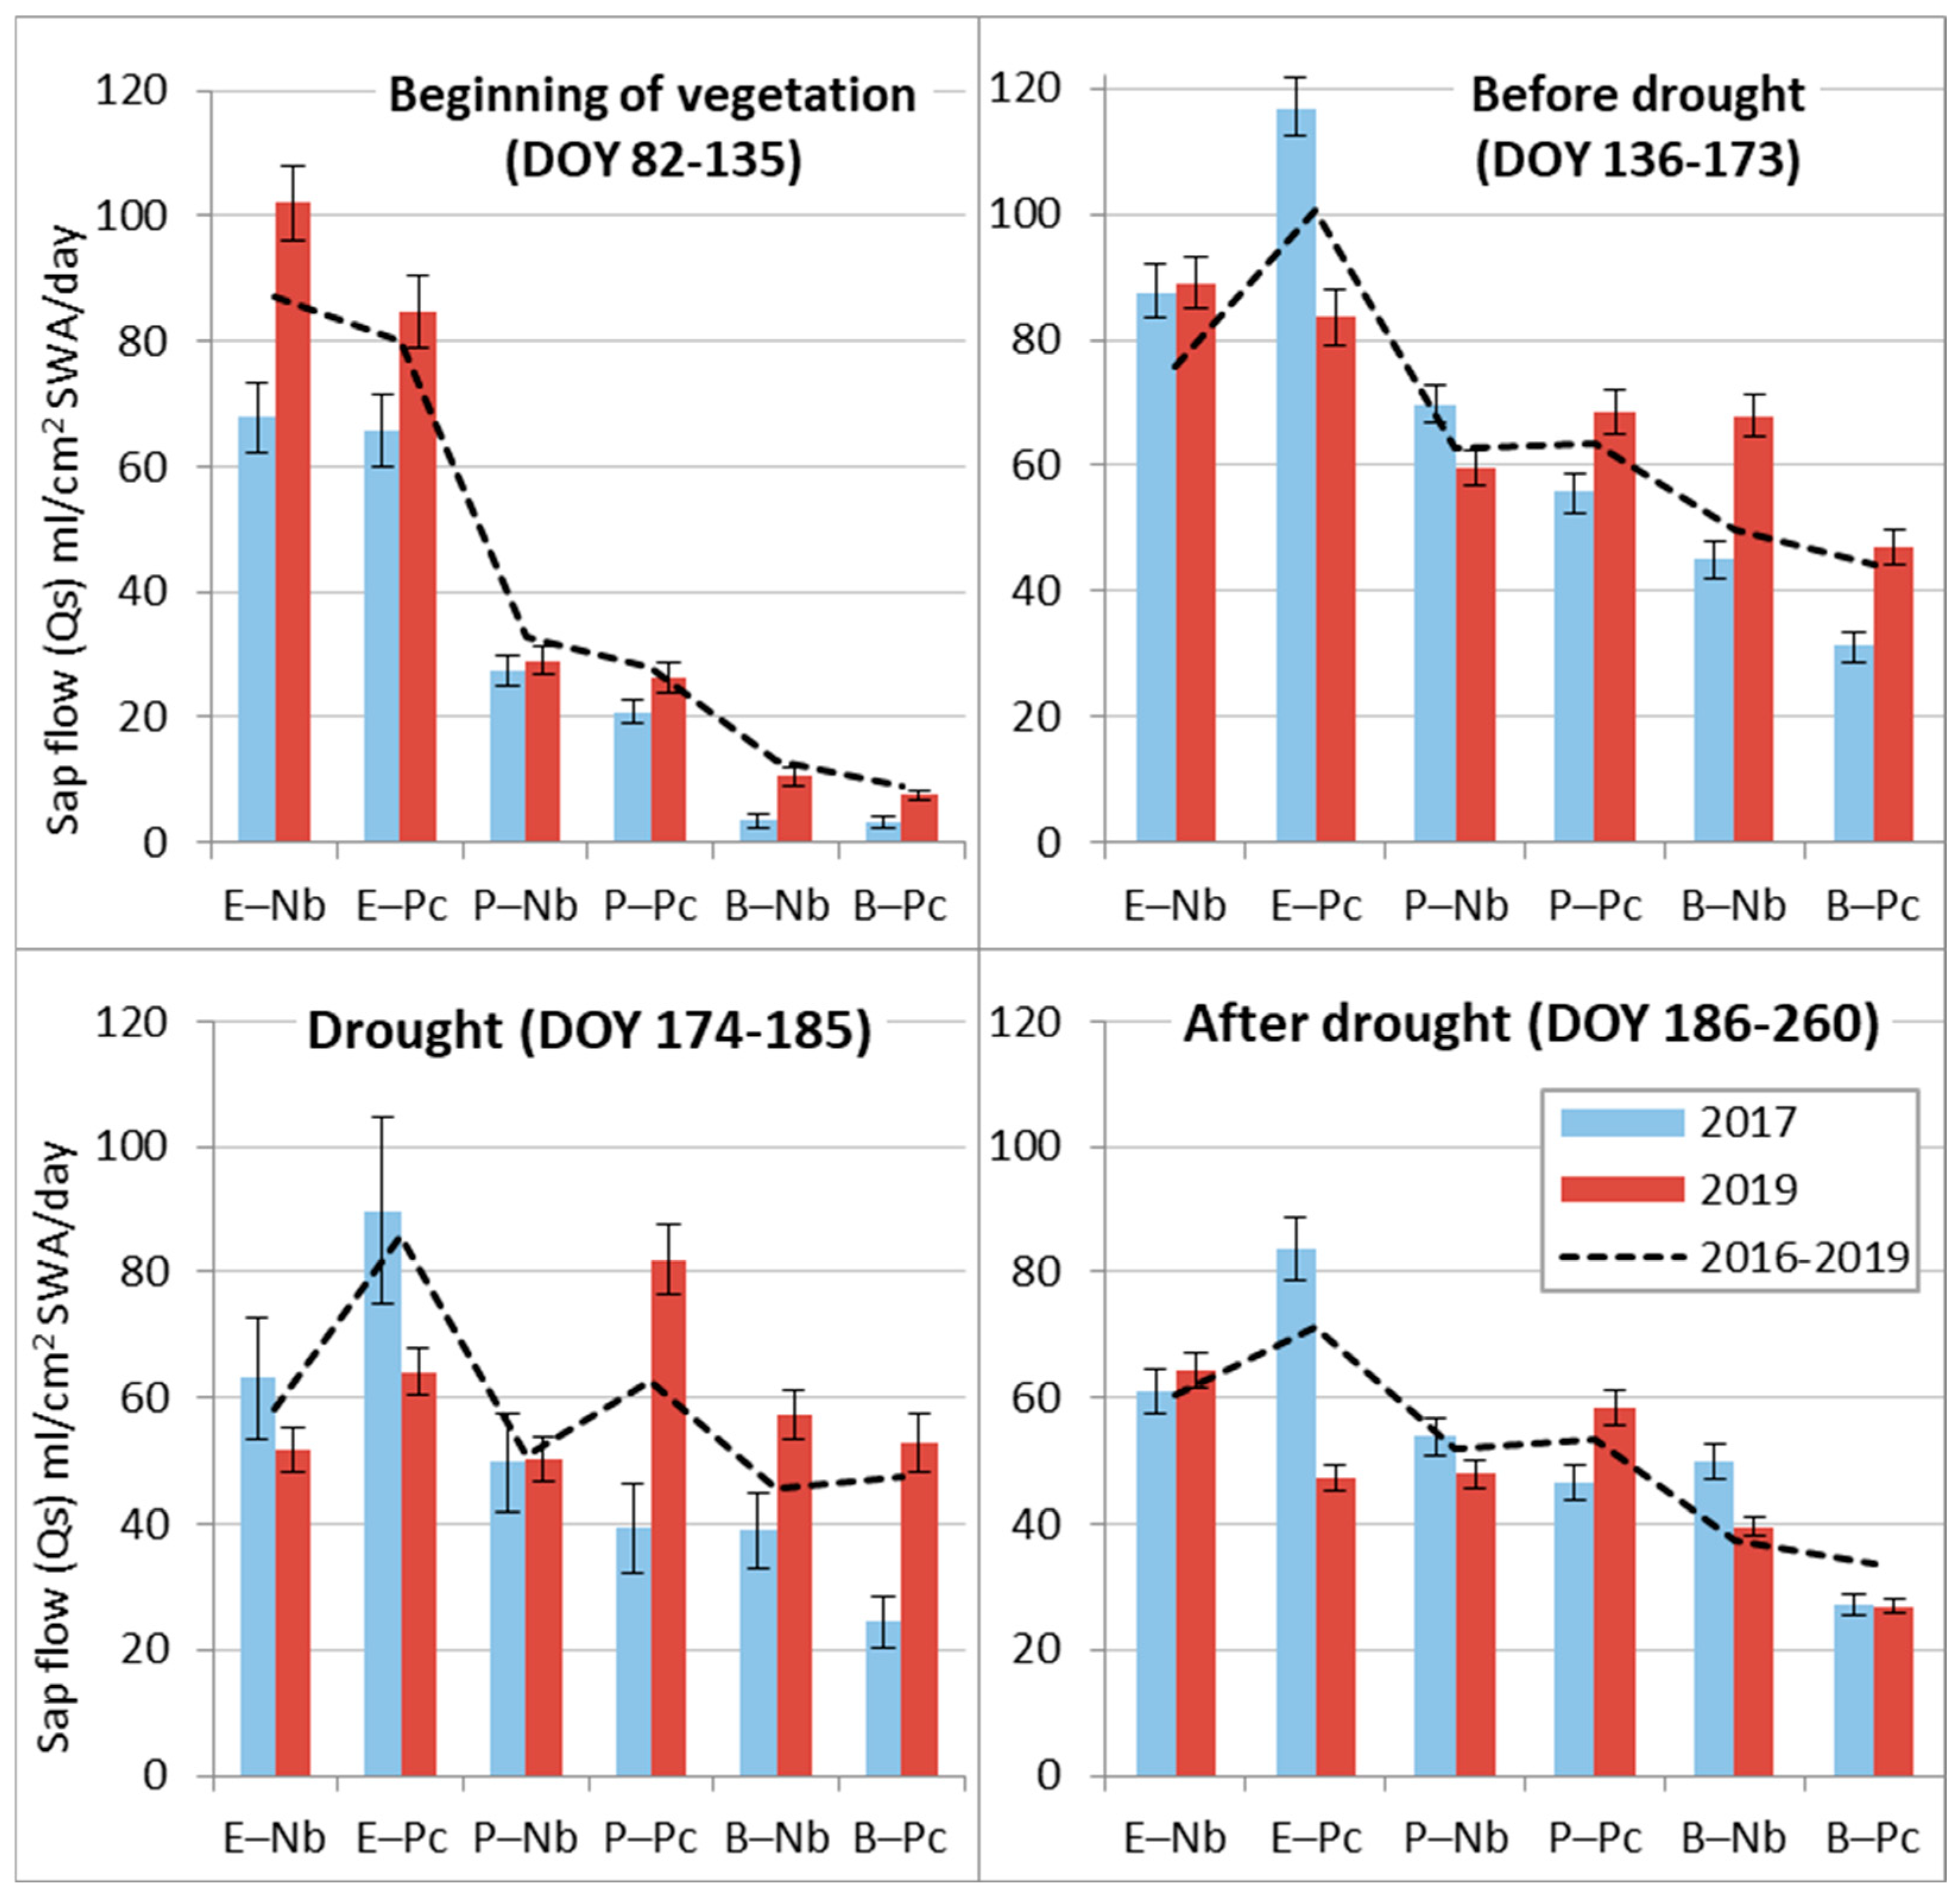
Sap flow Qs analysis during separate periods of the contrasting 2017 and 2019 seasons allowed us to evaluate the adaptive capacity of the prevailing tree species in hemiboreal forests to meteorological extremes. The obtained data revealed that only at the beginning of the season in 2019 did Norway spruce at the dry oligotrophic Nb FS demonstrate exceptionally high Qs values due to higher-than-usual air and soil temperatures and intense solar radiation at that time (Table 4). During the remaining periods, a higher sap flow Qs was detected in the wet year, 2017. During the drought in 2019 (Figure 6), spruce sap flow Qs decreased most intensively, especially at the dry Nb FS, where precipitation recovered it very fast. At the wet Pc FS, precipitation after drought did not increase Qs until the end of the season.
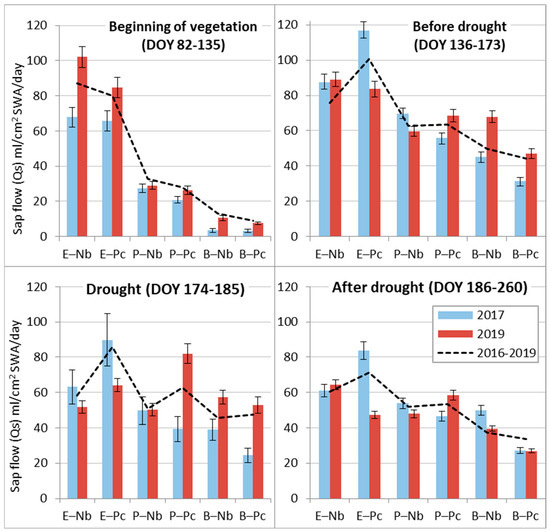
Figure 6.
Comparison of the mean daily sap flow (Qs) at relatively dry (Nb) and relatively wet (Pc) forest sites during different periods of 2017 and 2019 with the standard errors (±SE) and mean values of entire 2016-2019 period (dashed line).
The sap flow Qs of birch trees was more intensive at the dry Nb FS during both monitored years. However, during the drought in 2019, their Qs at Nb FS had a tendency to decrease, while at Ps FS, it had a tendency to increase. The exceptional reaction of birch trees was a further decrease in sap flow Qs after the drought in 2019, while in 2017, the Qs value remained at a similar level from DOY 136 to 260.
3.5. Effect of the Meteorology on the Sap Flow Qs of the Monitored Trees during the Dry 2019 Season
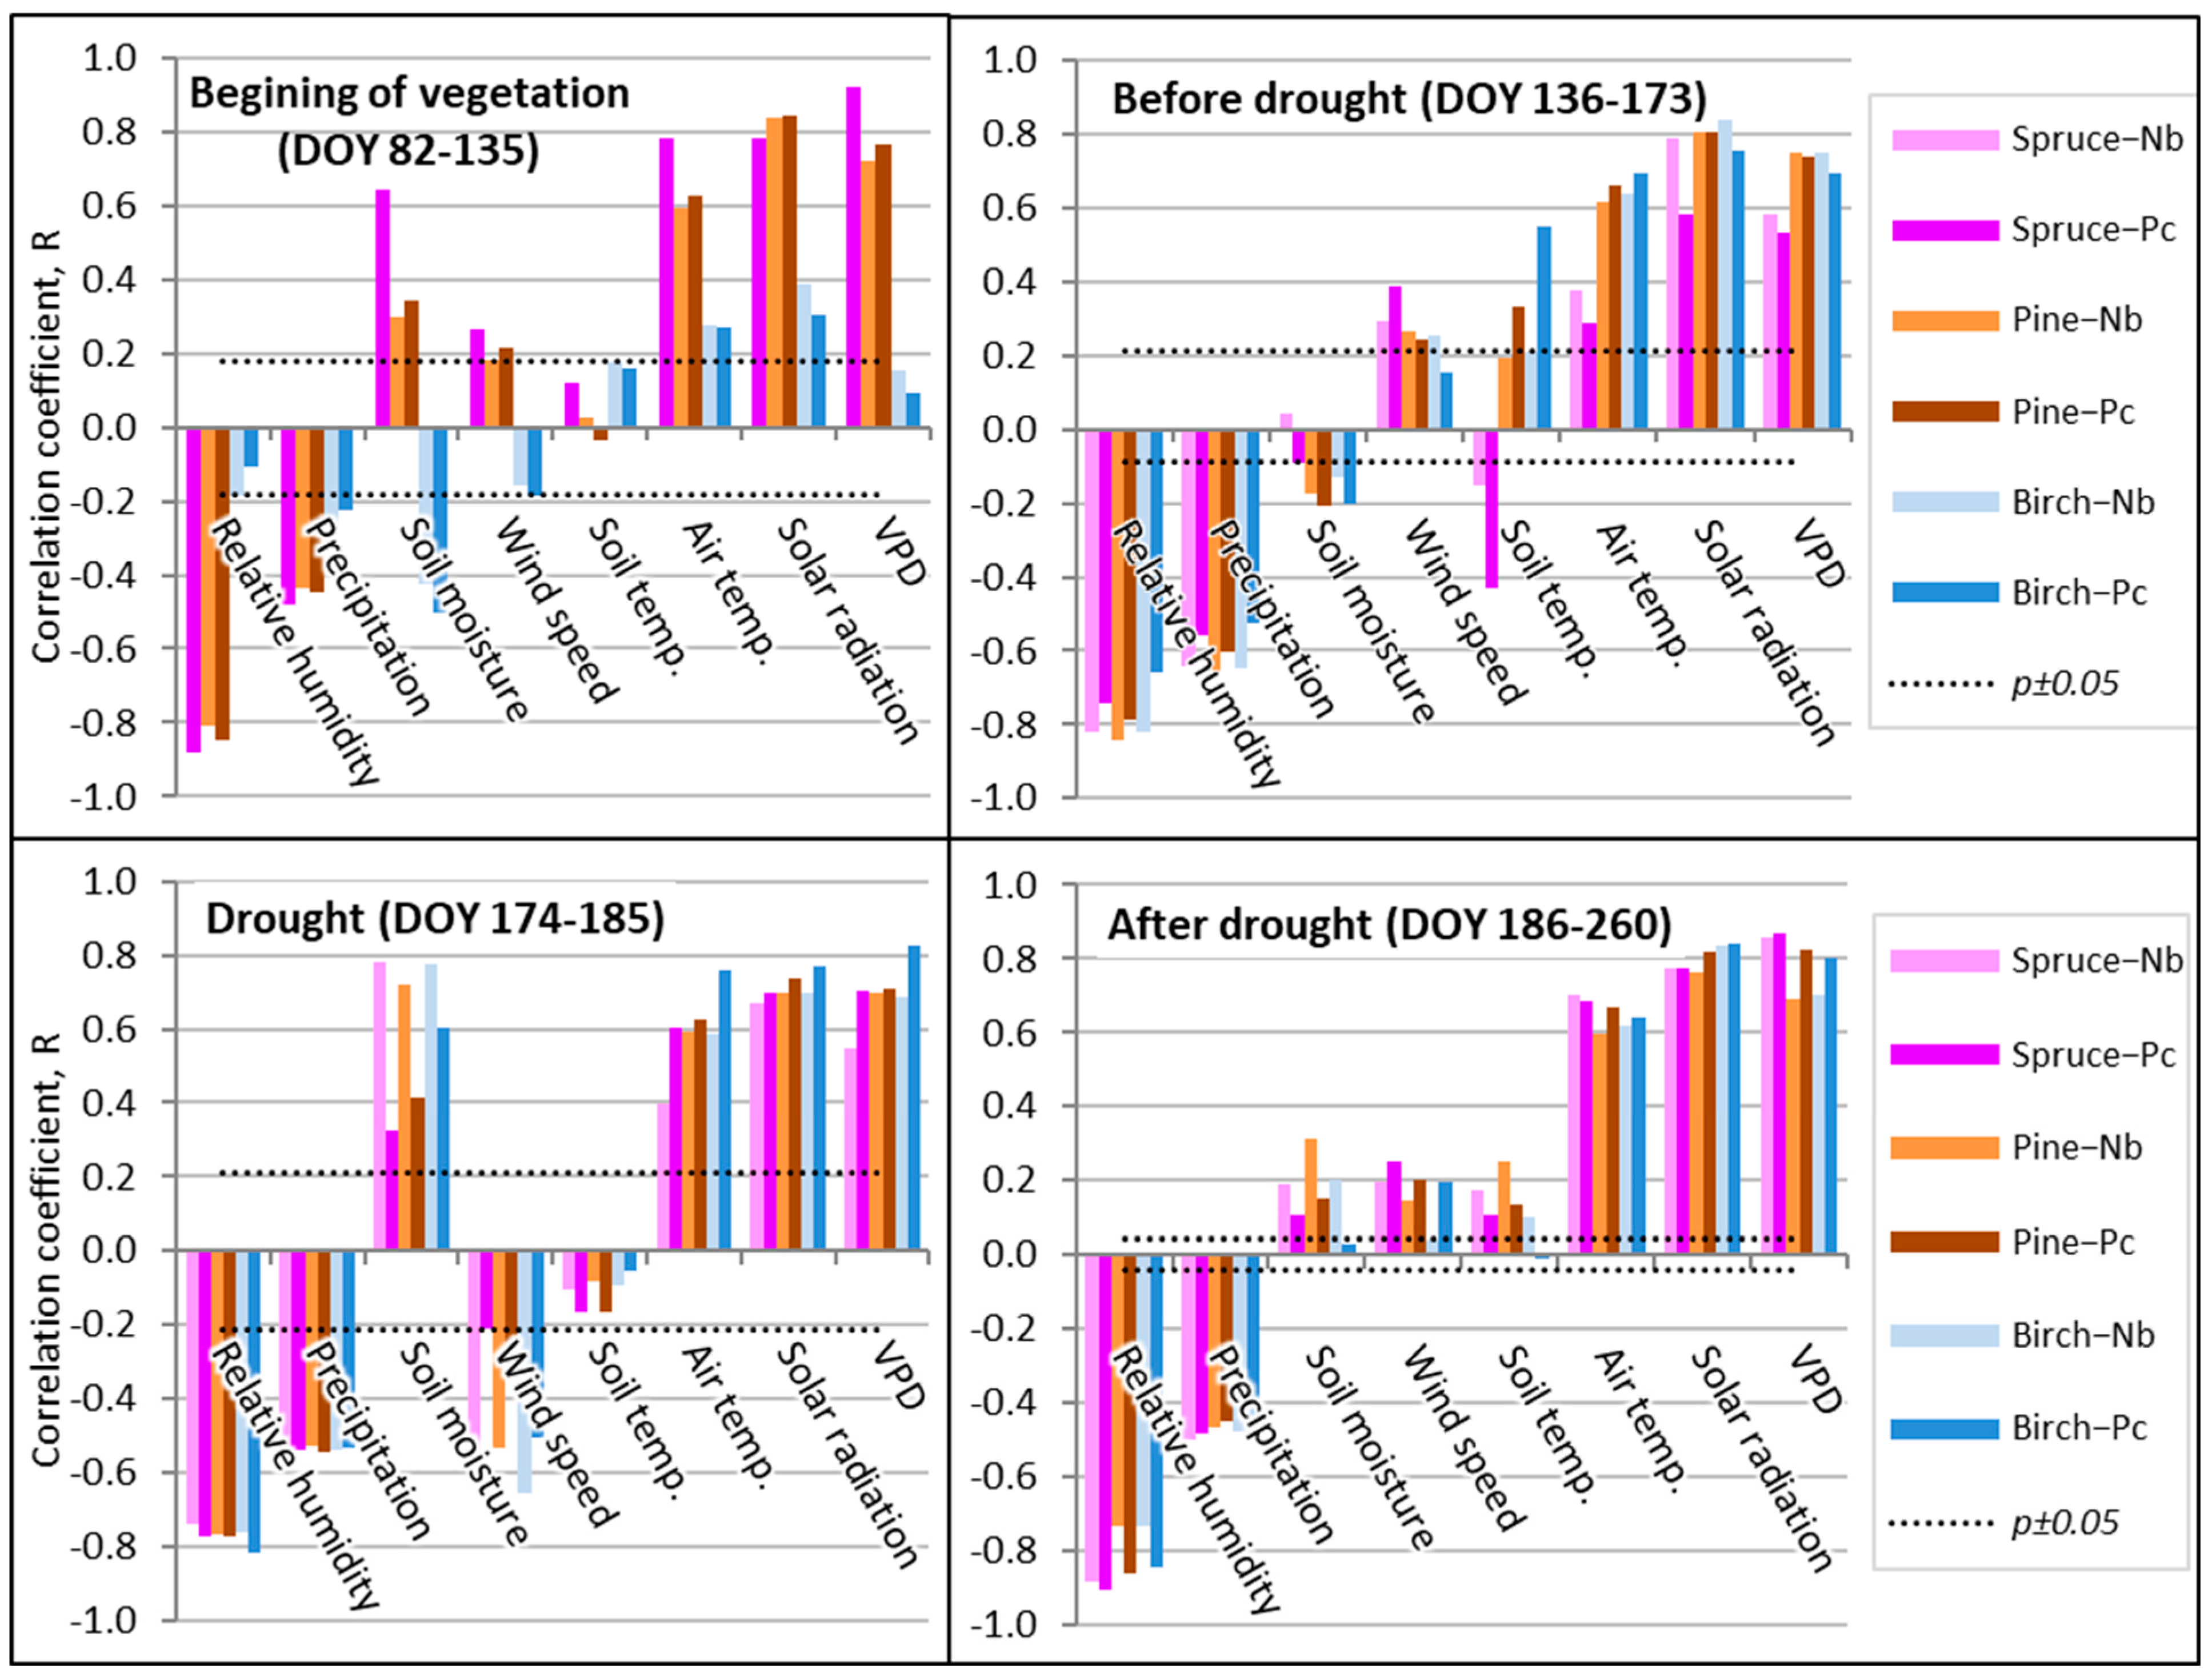
At the beginning of the growing season, a higher air temperature and solar radiation were observed, which resulted in higher VPD values, significantly stimulating the sap flow Qs of spruce trees (Figure 7), when their value exceeded even 1000 cm3 per 1 cm2 of sap wood area (SWA) every 10 days (Figure 5). This stimulating effect of the meteorological parameters on pine sap flow Qs was a little less evident, while on birch Qs it was not significant. During the other periods considered, the meteorological parameters most significantly stimulated birch Qs (Figure 7). Contrary to this, the inhibiting effect of relative humidity on the sap flow Qs of coniferous tree species was also most significantly expressed at the beginning of the vegetation period and during the periods before and after the drought. In birch trees, the Qs-inhibiting effect of humidity was registered during the whole period of active vegetation, i.e., after DOY 136 and even during the drought.
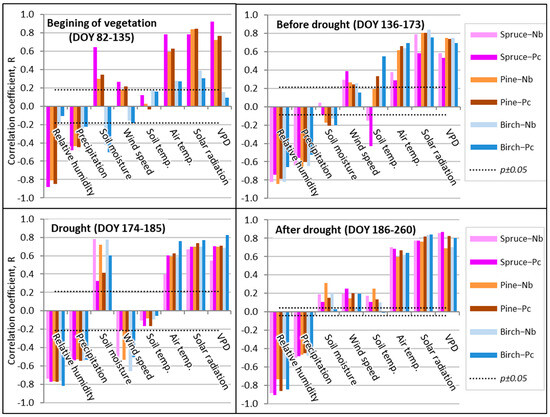
Figure 7.
Pearson correlation coefficients between separate environmental factors and sap flow (Qs) during separate periods at the hourly scale in 2019. Note: beginning of the growing season, p < 0.05 if R > 0.12, n = 324; before drought, p < 0.05 if R > 0.19, n = 228; drought, p < 0.05 if R > 0.21, n = 72; and after drought, p < 0.05 if R > 0.09, n = 450.
Soil water is a crucial factor for forest development, affecting the physiological processes and conditions in the ecological balance and the hydrological cycle of the whole forest ecosystem [37]. Notwithstanding this, the exceptional effect of soil moisture was detected only at the beginning of the vegetation period on the sap flow density of birch trees, when higher moisture inhibited sap flow Qs intensity (Figure 7). The most significant direct effect of soil moisture on sap flow Qs was detected during the drought period mainly at the dry oligotrophic FS. At the mezzo-eutrophic wet FS, its effect on the sap flow Qs of the coniferous tree species was remarkably lower, while this difference in birch Qs was not significant. The obtained results show that, despite the absence of the effect on annual Qs rate, soil moisture is among the key factors affecting the seasonal Qs rate of considered tree species, while the effect of soil temperature was the least significant and changed in relation to soil moisture. Similar correlations were detected when analyzing the relationships between the sap flow Qs of the considered tree species and the precipitation amount.
The effect of wind speed was also not homogeneous during the whole vegetation period (Figure 7). Its suppressing effect was detected only during the drought. This indicates that with increased sensitivity to soil moisture, the monitored trees tend to reduce their stomatal conductance and so limit the loss of water during windy periods. This may be a sign of good adaptation to drought by closing the stomata and causing a reduction in turgor due to the effect of wind. During the remaining periods, wind speed enhanced the direct effect of air temperature, solar radiation, and VPD.
Finally, the most significant relationships between spruce sap flow Qs and relative humidity, air temperature, and VPD were detected during the period when the drought was over (Figure 7). These findings indicate a very good recovery of spruce Qs after the unfavorable period, which could be presented as key findings indicating the rather good adaptation of spruce trees to the temporal lack of humidity.
3.6. Vapor Pressure Deficit (VPD)—A Key Factor for Sap Flow Qs Intensity
VPD is identified as one of the main environmental factors affecting plant transpiration, demonstrating non-rectilinear relationships with sap flow Qs, the nature of which depends on the effect of other meteorological factors, which may change during the season significantly [38]. The obtained data revealed that the determination coefficient during the entire growing season (DOY 82–260) was remarkably lower than that during the investigated periods.
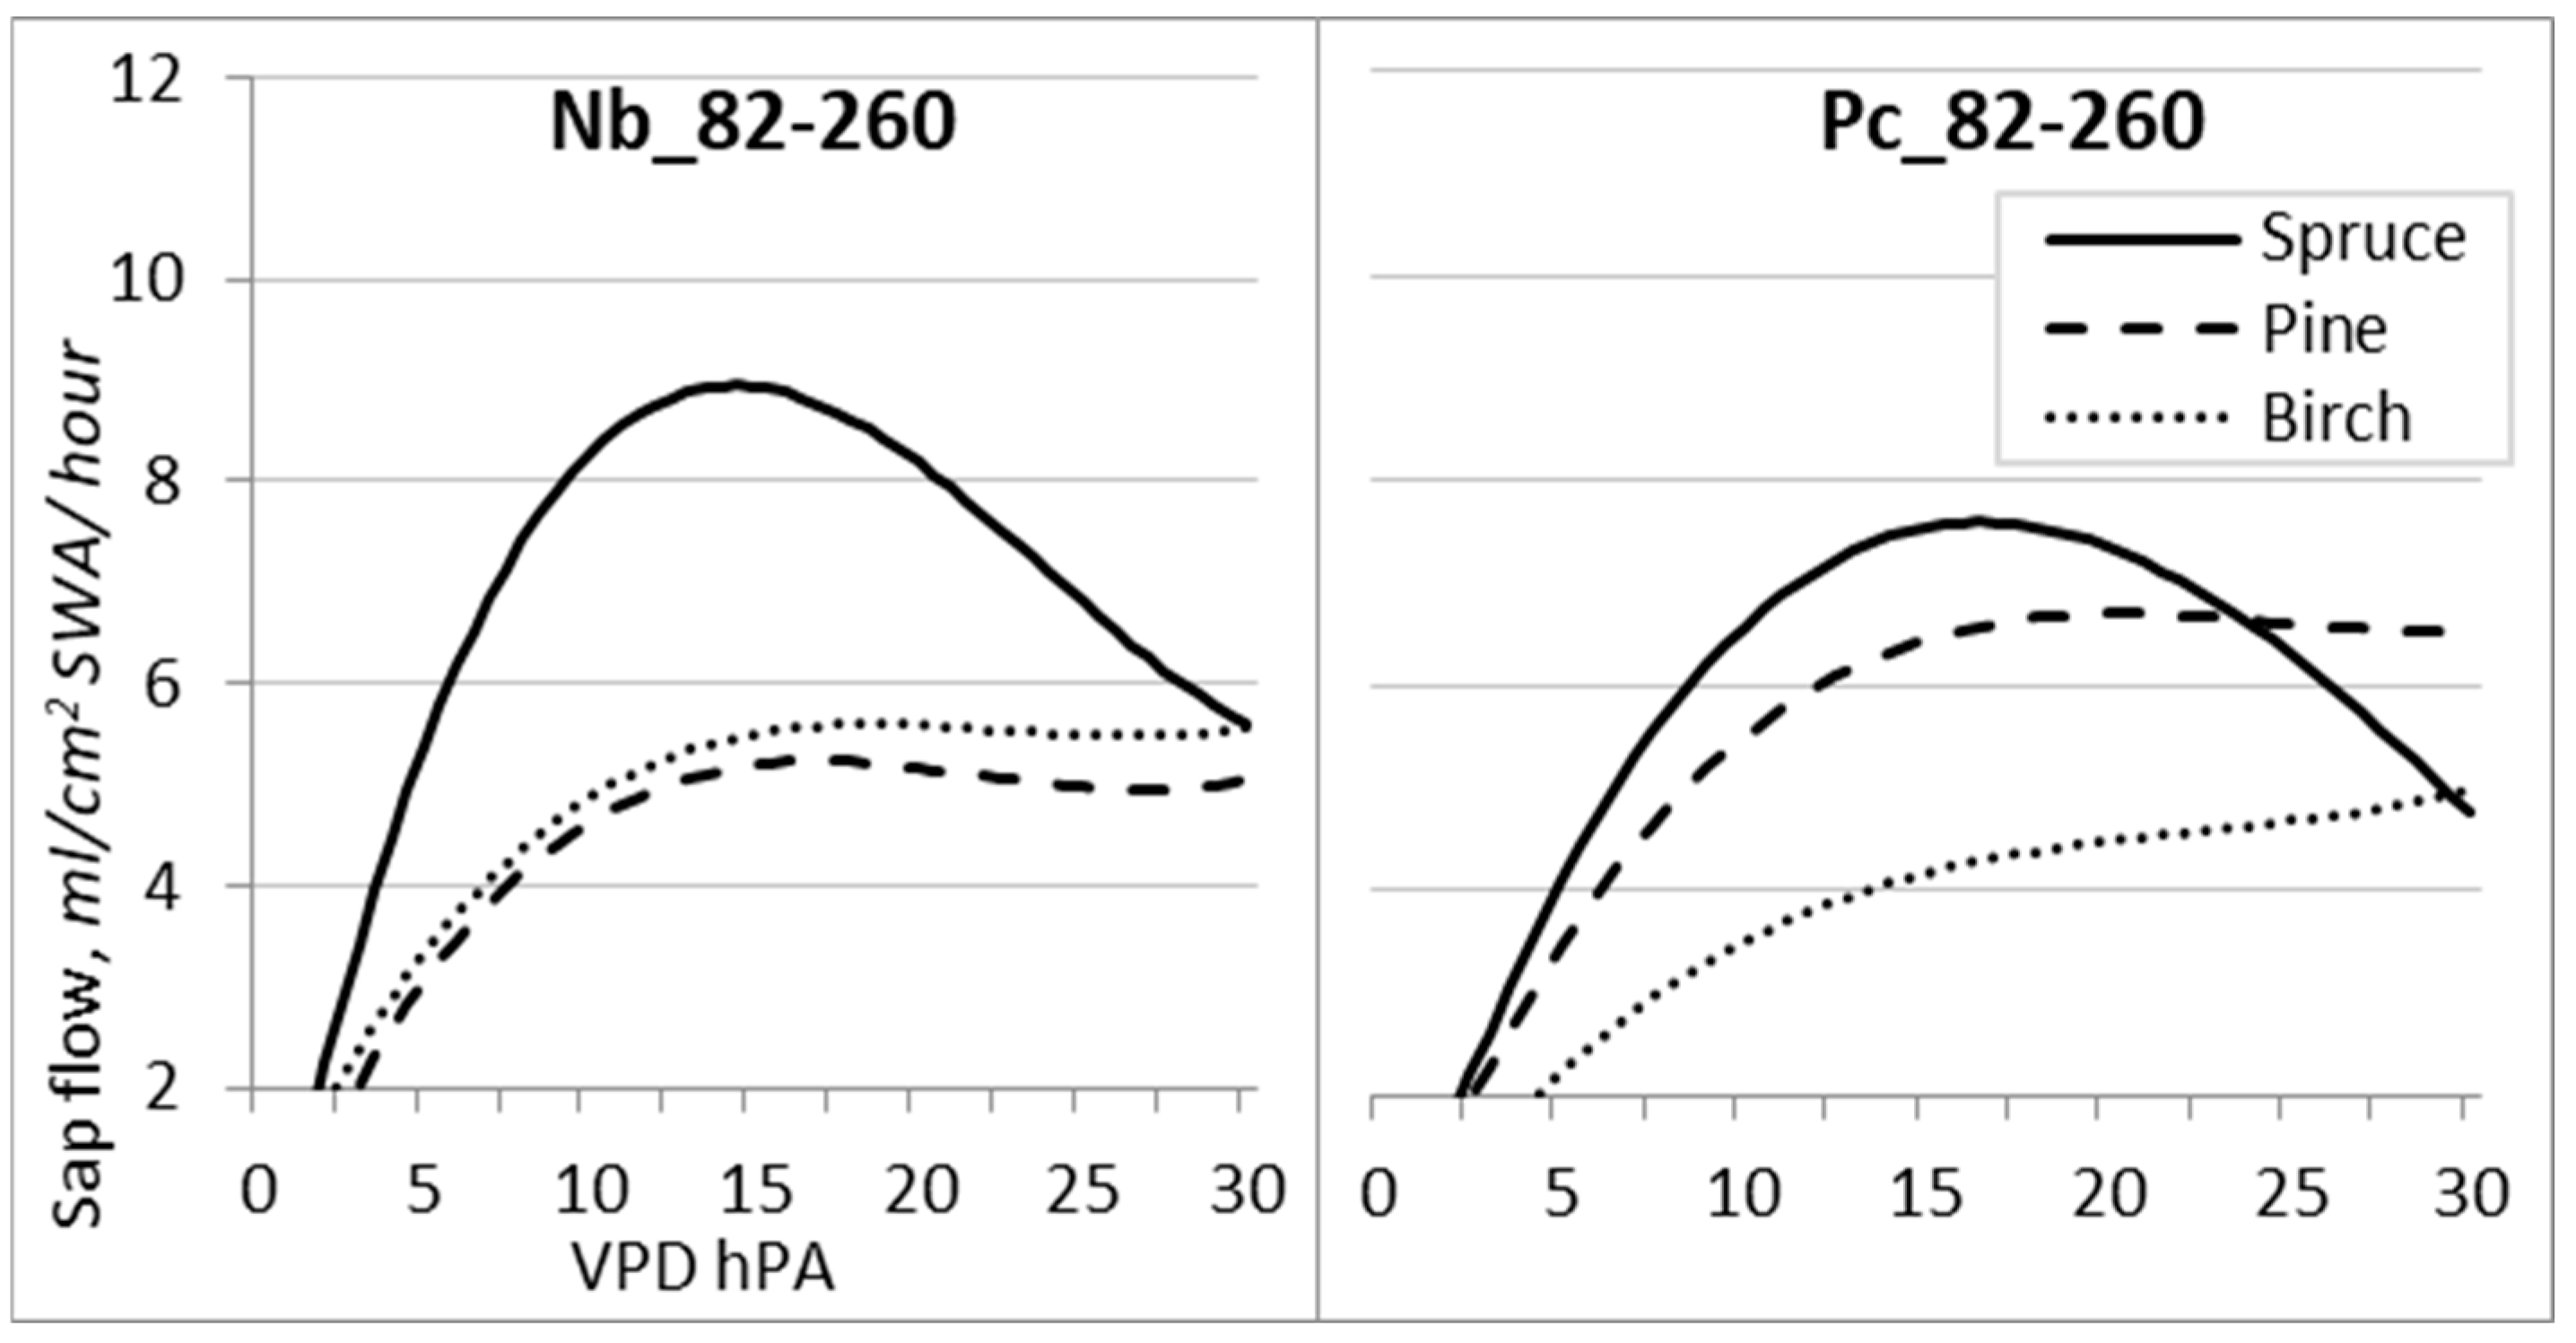
Cubic polynomic regression was used to establish the relationships between VPD and Qs either during the entire season (Figure 8) or the investigated periods (Figure 9; Table 6). All species reached near-maximum values of sap flow Qs when VPD reached 13–16 hPa at the Nb FS and 15–18 hPa at the Pc FS. However, with the continuous rise in VPD, sap flow Qs decreased only for spruce trees.
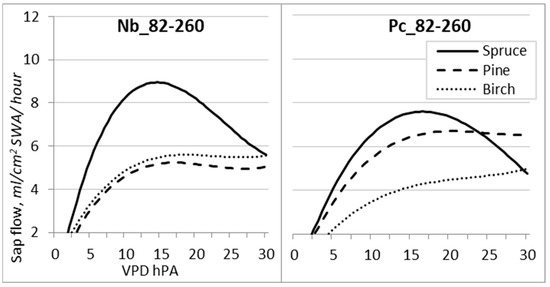
Figure 8.
Regression curves of hourly sap flow (Qs) in relation to VPD for the entire 2019 growing season at forest sites with different hydrological regimes.
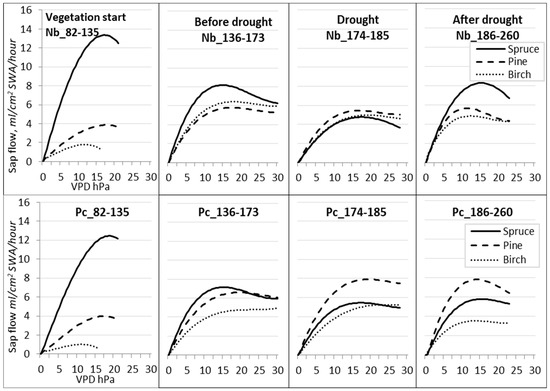
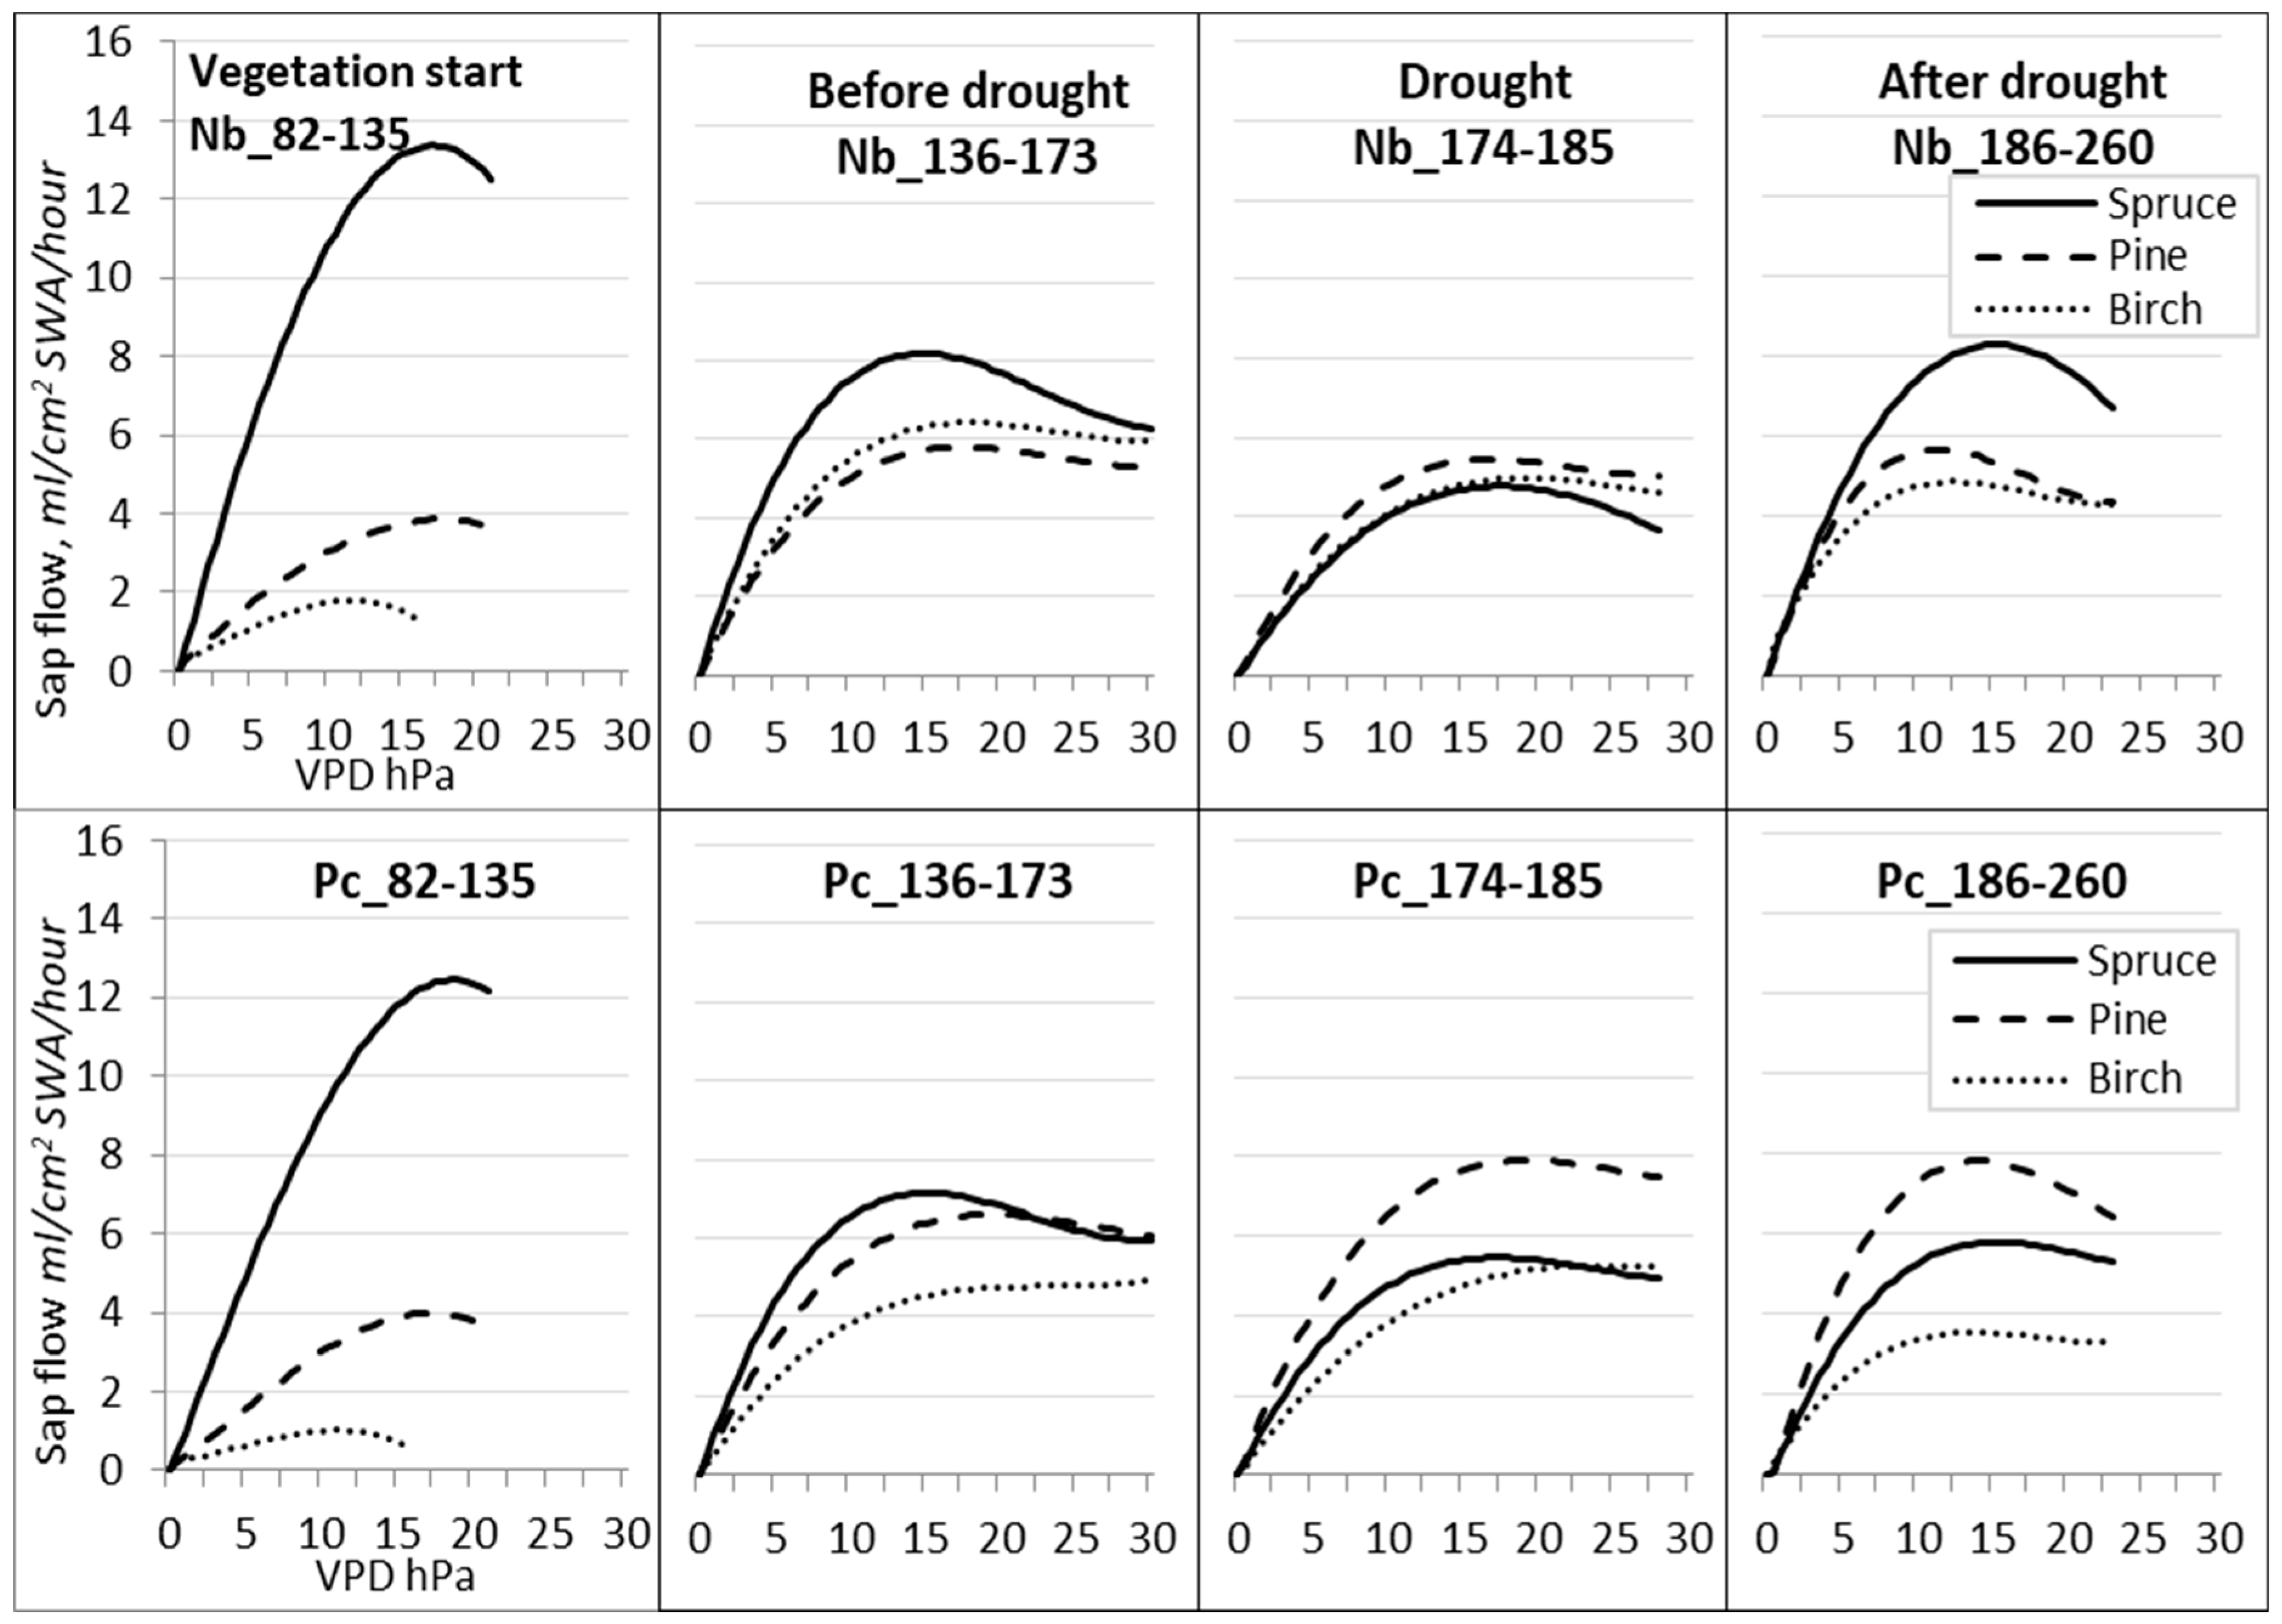
Figure 9.
Regression curves of hourly sap flow (Qs) in relation to VPD for different periods during the season of 2019. Forest sites with different hydrological regimes: dry FS—(Nb); wet FS—(Pc).
Table 6.
Determination coefficient (R2) of cubic regression between the sap flow (Qs) and VPD values.
During the drought (DOY 174–185) at Nb FS (Figure 9), the sap flow Qs decreased for all trees to 5 mL per cm2 SWA per h. At the wet Pc FS, contrary to this, the sap flow Qs of pine trees increased by 8 mL per cm2 SWA per h, that of birch trees remained almost unchanged, and that of spruce trees slightly decreased. Birch trees did not display a reduction in sap flow density, even during periods when the VPD was at its maximum. This could be attributed to the lack of adaptations, which could have led to premature defoliation.
After the drought period (DOY 186–260), the most intensive recovery in sap flow Qs was detected for spruce trees growing at the Nb FS, while it remained at the previous level for pine trees at both FSs and continued to further decrease for birch trees at the Pc FS.
3.7. Effect of Soil Temperature on the Sap Flow (Qs) of the Considered Tree Species
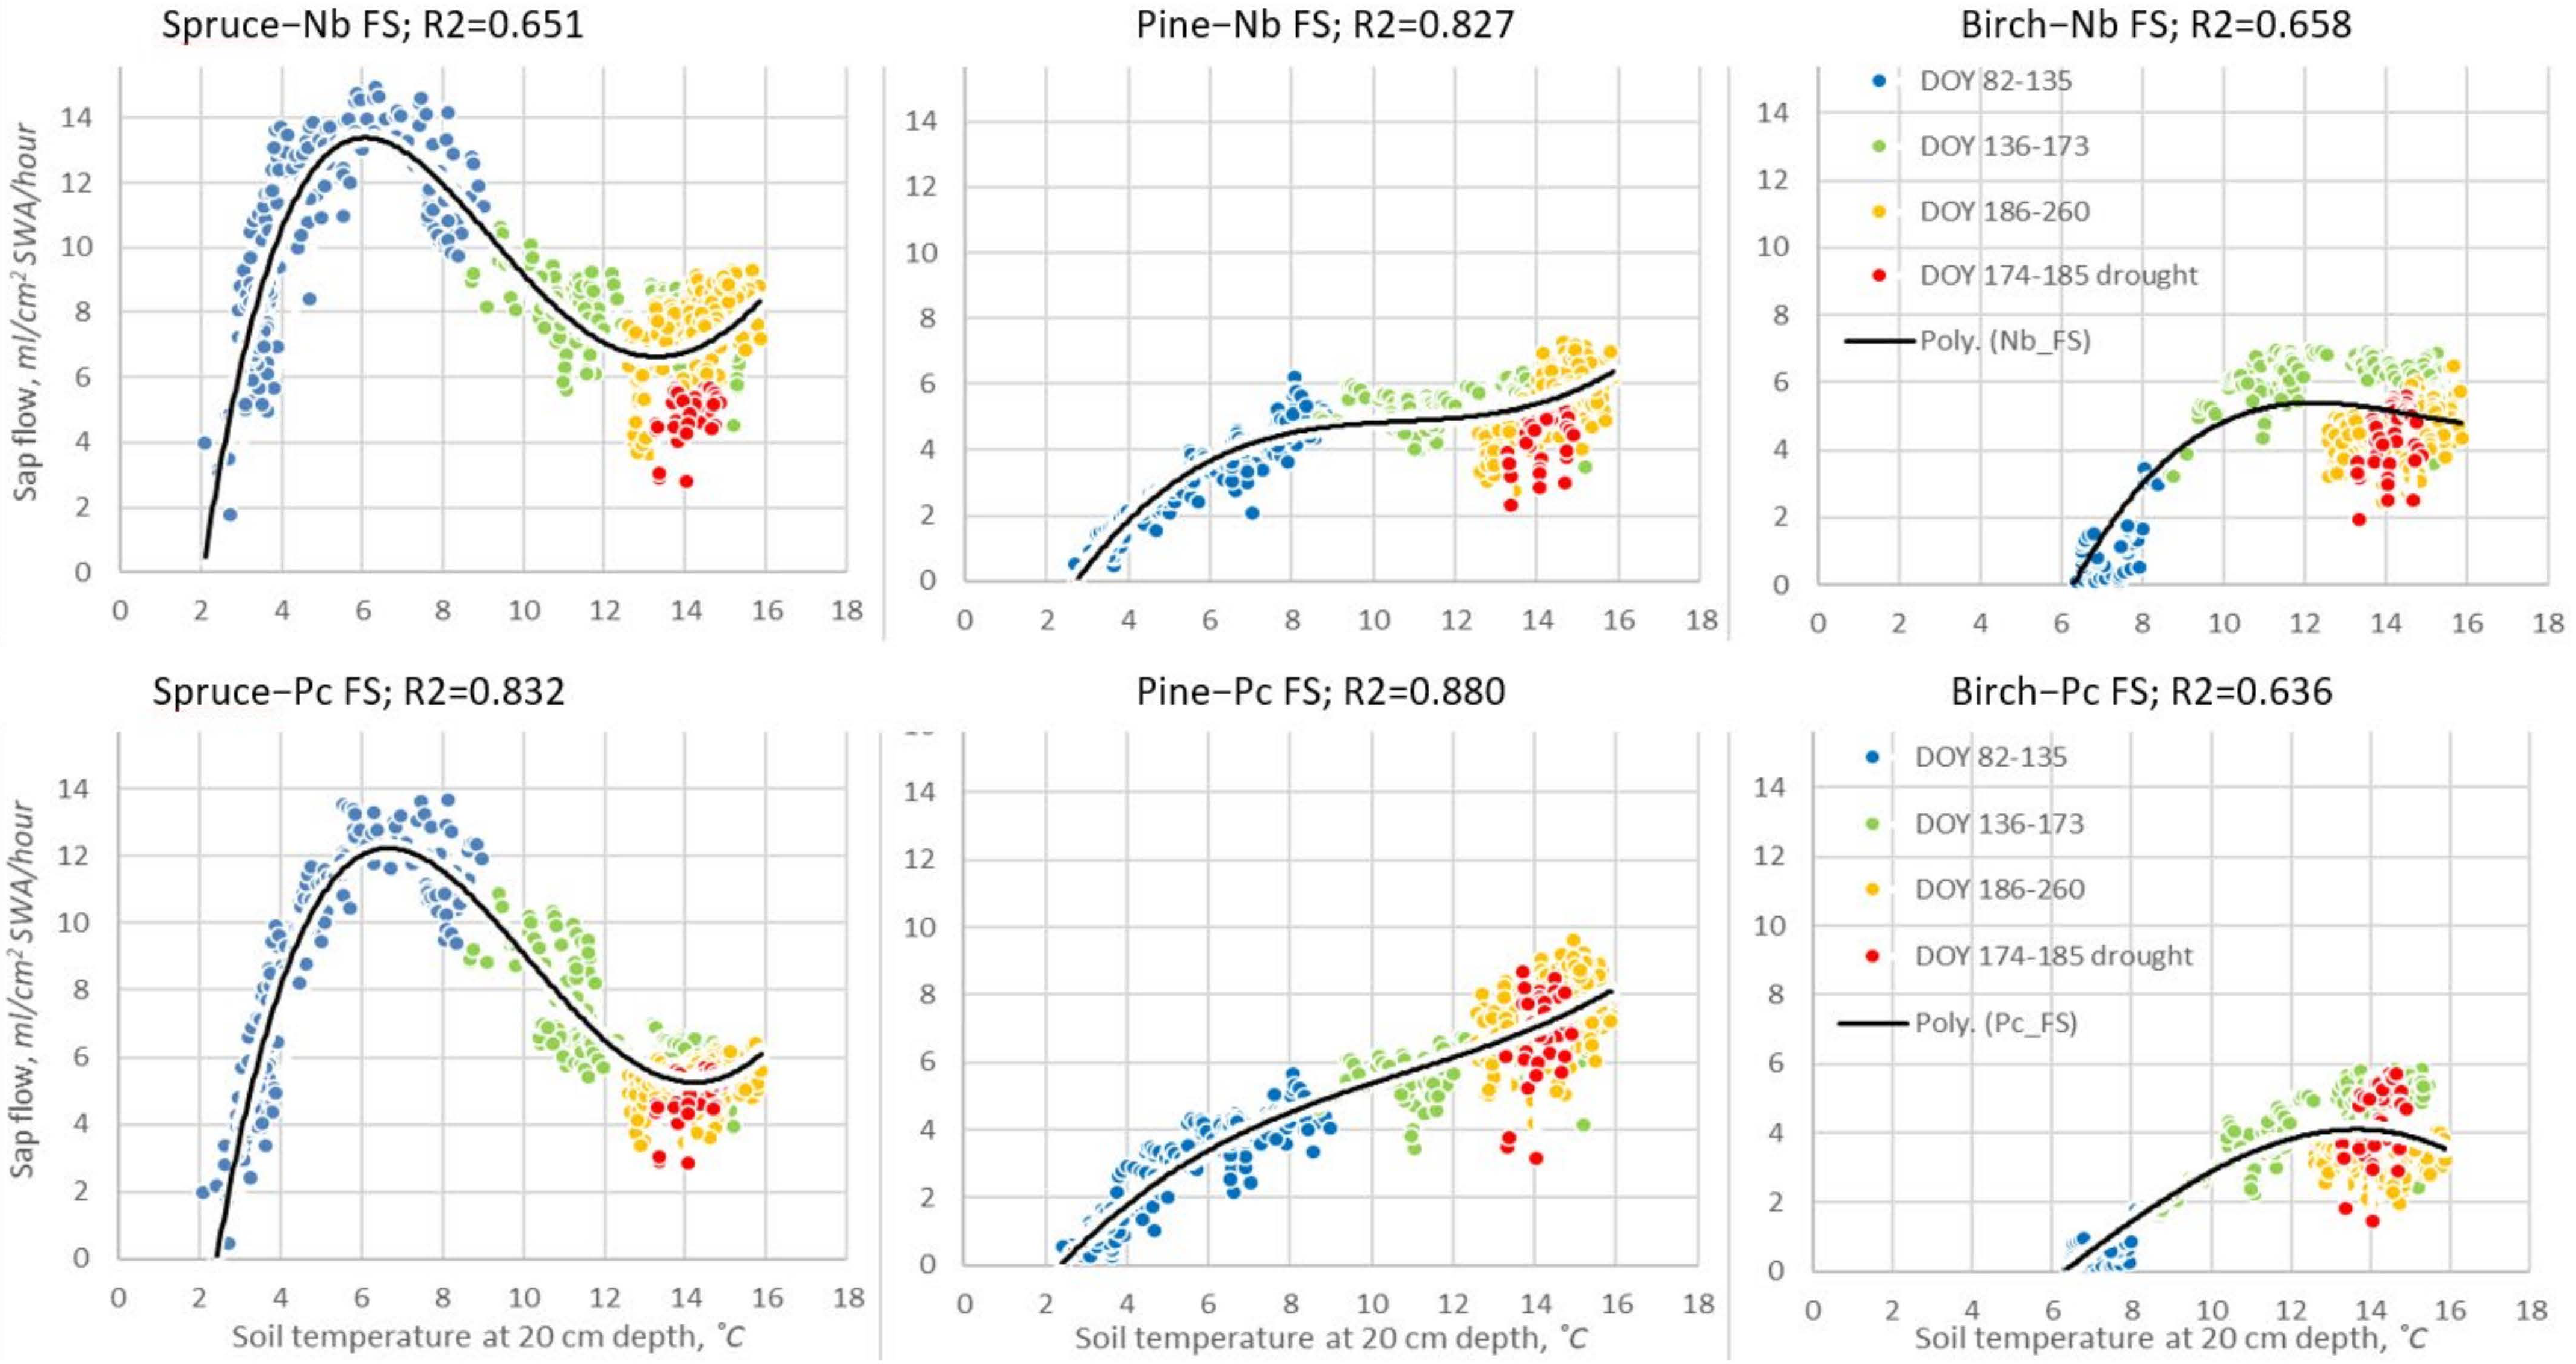
Because soil temperature changes slowly and inertially and remains close to its maximum during the second half of the season, its relationship with sap flow density during the investigated periods was the least significant (Figure 7). Due to the differences in tree transpiration between daytime and night-time [37], the relationships were determined by only applying data for when VPD > 8 hPa, and solar radiation > 400 W/m2, during daytime (10–15) hours, and when there had been no rainfall for 3 days (Figure 10).
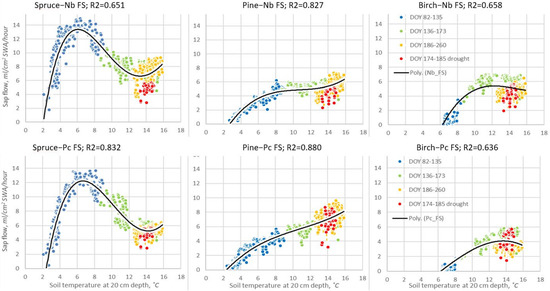
Figure 10.
Cubic polynomic relationships between hourly sap flow (Qs) and soil temperature at a 20 cm depth for the entire 2019 growing season at forest sites with different hydrological regimes, when VPD > 8 hPa, and solar radiation > 400 W/m2, during daytime (10–15) hours, and when there had been no rainfall for 3 days. Nb—dry oligotrophic forest site; Pc—wet mezzo-eutrophic forest site. The drought period is in red. Note: R2 > 0.09 is statistically significant, when n > 590 and p < 0.05.
The obtained data reveal (Figure 10) that the soil temperature significantly (R2 = 65–86%) explained the changes in Qs throughout the season of all considered tree species. The maximum Qs of spruce was registered as the highest, at relatively low soil temperatures of 4.5–9.0 °C, and significantly decreased when temperature increased. Pines demonstrated the opposite response. An increase in soil temperature resulted in an increase in Qs, and these relationships were close to linear, especially at the wet Pc FS. Birch trees showed an intermediate response to soil temperature, i.e., similarly to pines, they showed a nearly linear relationship with soil temperature between the temperatures of 5 and 12 °C, but as the soil temperature continued to increase, Qs stabilized at the Nb or started to decrease at the Pc FS. Also, at both FSs, birch Qs decreased during the drought, but this was not as significant as for spruce. Our key finding is that after the drought, in contrast with pine and especially spruce, the sap flow Qs of birch trees did not recover, creating threats for the adaptive capacity of this tree species to recent climate changes.
The drought period data points (DOY 174–185) indicated the most significant reduction in Qs for spruce trees at the Nb FS, when it decreased to 4 mL/cm2 SWA per h. Contrary to this, the sap flow Qs of birch and pine trees increased to this value (Figure 10), and for pine trees growing at the wet Pc FS, it almost reached its maximal value, i.e., 6 mL/cm2 SWA per h. These data indicated the significance of soil temperature affecting annual sap flow Qs, despite its low significance in affecting seasonal Qs (Figure 7).
4. Discussion
Forests play a crucial role in the hydrological cycle through evapotranspiration, where tree transpiration, as the primary component of forest evapotranspiration, has a critical influence on forests’ hydrological balance [14,15,37]. Thus, understanding the peculiarities of tree transpiration under extreme meteorological conditions is essential for developing sustainable forest management strategies to mitigate the new threats of climate change, thus contributing to the achievement of the United Nations Sustainable Development Goals [39] and further relieving the pressure on forests and the forest economy [15].
The extreme drought events that are occurring more frequently than ever before in Europe highlight the need to understand the key processes that may allow trees and stands to overcome such severe water shortages [40]. Declines in transpiration and water uptake due to stomatal closure have been quantified as the adaptive capacity of tree species to these unfavorable climatic conditions. The sap flow method is a transpiration measurement approach for individual trees that could be employed as an indicator of this tree capacity. Considering summer droughts, the low precipitation and the high air temperature, solar radiation, and evaporative demand will lead to water deficits, causing tree transpiration to be significantly limited [38,41]. This leads to a reduction in the primary production of more susceptible tree individuals and the entire stand [3,40]. Therefore, determining the maximum sap flow rate and the corresponding VPD and temperature with relative humidity provides an indication of the ideal conditions for the development of hemiboreal forests in the future.
The obtained data revealed that spruce trees demonstrated their maximum Qs rate at the beginning of the vegetation period when soil temperature only reached 5–7 °C and VPD reached 15–17. Higher values of these key factors during the vegetation period reduced the sap flow Qs of spruce trees significantly. Pine trees, in most cases, demonstrate the least pronounced suppressive effects from high temperatures, solar radiation, or extremely low air humidity. In contrast to coniferous trees, birch trees’ sap flow density usually does not regenerate back to the previous density after a deep drought at the end of a vegetation period, which may indicate the end of active vegetation, even at the end of a prolonged warm period [42]. Therefore, these reactions of Norway spruce, Scots pine, and silver birch in the northeastern European region become the key findings regarding the sap flow density peculiarities in relation to meteorology when assessing their adaptive capacity to mitigate the new threats presented by climate change.
The Norway spruce in Lithuania is close to the southern edge of its native range [43], indicating that it is a more boreal tree species compared to both birch and pine species. Based on the state of knowledge, spruce is also the most susceptible to climate change in the region [44,45,46]. This is why Norway spruce trees, especially those growing in the drier oligotrophic habitat, can clearly be identified as the most sensitive to instantaneous changes, especially in meteorological conditions.
For summer droughts, low precipitation and high air temperature, solar radiation, and evaporative demand lead to a high water vapor pressure deficit, causing tree transpiration to be significantly limited [41]. However, once the unfavorable period is over, the full recovery of all of the ecophysiological processes is observed [34], thanks to these trees’ shallow-rooted systems. The ability to preserve water reserves may be a feature of spruce trees’ adaptation to unfavorable, short-term environmental conditions. On the other hand, it may also be a consequence of a failure to obtain water quickly enough. Therefore, due to the highest sensitivity to both favorable and unfavorable environmental factors, spruce trees are well adapted to the current climatic conditions. Spruce trees having one of the highest productivity levels among hemiboreal tree species confirmed their adaptive capacity [7]. Only intense droughts and subsequent biogenic damage may significantly reduce the importance of this species in Lithuanian forestry due to their lower resistance to Ips typographus damage during drought periods. However, the high genetic variation between individuals, explaining the phenotypic variation in drought response in Europe, confirms the high adaptive variation of Norway spruce to climate extremes [47]. Therefore, further investigation of spruce trees’ reactions during extreme meteorological conditions is needed to obtain more insights into their threshold conditions, exceeding which the regeneration of their ecophysiological processes ends.
The silver birch in Lithuania is at the epicenter of its natural distribution range. However, based on annual growth data, birch productivity is already relatively low under current conditions and is likely to further decline with an increase in annual temperature [7]. A reduction in productivity may also lead to a decline in competitiveness and self-propagation, as well as in distribution in mixed-species natural and seminatural stands if the status of other normally coexisting species does not deteriorate. The exceptional physiological reactions to changes in meteorology and especially to its extremes can be interpreted in two ways. These reactions are either a feature of high plasticity, with wide tolerance limits, or represent an inability to actively adapt to changing climatic conditions. However, based on the decline in annual growth and the inability to restore sap flow rate after drought events, especially close to the end of the vegetation season, the latter scenario is more likely. Disturbances in the process of water uptake may be caused by other factors, such as by folivores that reduce the number of leaves and the area of tree transpiration or by pathogens that attack tree roots, leading to the reduction in the number of roots capable of absorbing water. An increase in the frequency and intensity of such extreme events in the future and the potential involvement of hydraulic dysfunctions or of deficits in carbon storage as causes for the observed long-term decline in the tree growth [40] of birch trees could result in stem and root decay, instigating their premature leaf drop.
The Scots pine in Lithuania is also in the central part of its natural distribution range. The exceptionally wide range of this species’ distribution and its ability to modify its morphometric parameters reflect its broad adaptive capacity and adaptability to various adverse environmental conditions. Despite this, some authors predict that pines, like spruce, will be among the most vulnerable tree species to climate change in this region [43,45,48]. Our results indicate that pine trees growing on a relatively dry oligotrophic forest site, similarly to spruce, benefited from the increase in annual temperature, resulting in an increase in their productivity in future [7]. Due to their deep root systems and high sensitivity to both favorable and unfavorable environmental factors, pine trees display the highest tolerance to current meteorological conditions.
Therefore, all three species will remain viable in the region in future. The riskiest situation, despite its maximum growth rates, is in drier monoculture, mature or overmature spruce forests, where the probability of large-scale biogenic damage following meteorological extremes is highest. Despite its lower productivity [49], birch remains an indispensable deciduous species for mixed stands [50], especially in drier, lower-yielding stands, to maintain their biodiversity and increase resilience to adverse meteorological factors.
Pine should remain the main tree species in hemiboreal forests, with an increase in its productivity due to it having the best adaptive capacity to climate change and the highest ability to mitigate the new threats of climate change. On the other hand, we confirmed that the more shallow-rooted spruces utilized small quantities of precipitation more effectively and responded faster than pine and especially birch trees [51]. In the case of an absence of deep drought events, Norway spruce trees remain among the main tree species in boreal and hemiboreal silviculture.
5. Conclusions
The density of sap flow during the growing season varied quite significantly, but synchronously for all species and in both forest sites with contrasting humidity and fertility regimes, depending only on meteorological conditions. Soil moisture was not a limiting factor of the annual sap flow amount.
Spruce had the longest period of active transpiration and the most intensive sap flow per basal area unit (Qs), especially at the beginning of vegetation, which resulted in their highest annual transpiration rate. By contrast, birch had the shortest active transpiration period and the lowest Qs, resulting in the lowest annual transpiration rate.
High air and soil temperatures, solar radiation, VPD values, and lower relative humidity were the main factors significantly limiting sap flow Qs. During the drought, the sap flow Qs for birch and pine trees increased up to its highest or close to its highest values, while for spruce trees, it decreased to its lowest values, at around 4–5 mL/cm2 per h in both cases.
Spruce trees were the most sensitive to both favorable and unfavorable environmental factors, displaying their highest productivity level and indicating their quite good adaptation to the current climatic conditions. Only intense and prolonged droughts with subsequent biogenic damage may significantly reduce the importance of this tree species to Lithuanian forestry needs.
Silver birch trees demonstrated a reduction in sap flow Qs after drought following the untimely drop of their leaves and end of active vegetation, even at the end of a prolonged entire warm period, indicating that they are not appropriately adapted to current climate conditions.
Pine trees demonstrated significant and nearly linear relationships between sap flow Qs rate and meteorology, when high temperature, solar radiation, and VPD and low relative humidity resulted in the highest sap flow Qs values, especially at the wet forest site. This is the species which is the best adapted to mitigating the recent threats of climate changes in hemiboreal forests.
Author Contributions
Conceptualization, A.A. and A.P.; methodology, A.A. and A.P.; software, A.P.; validation, A.A. and A.P.; formal analysis, A.P.; investigation, A.A. and A.P.; resources, A.A. and A.P.; data curation, A.A. and A.P.; writing—original draft preparation, A.P.; writing—review and editing, A.A.; visualization, A.A. and A.P.; supervision, A.A.; project administration, A.A. All authors have read and agreed to the published version of the manuscript.
Funding
This research paper has received funding from Horizon Europe Framework Programme (HORIZON), called Teaming for Excellence (HORIZON-WIDERA-2022-ACCESS-01-two-stage)—Creation of the Center of excellence in smart forestry “Forest 4.0” No. 101,059,985—and co-funded by the European Union under the project “FOREST 4.0—Center of excellence for the development of a sustainable forest bioeconomy”, No. 10-042-P-0002.
Data Availability Statement
The part of the data presented in this study are openly available in [34] Baumgarten et al., 2019; https://doi.org/10.2480/agrmet.D-18-00008. The datasets presented in this article are not readily available because the data are part of an ongoing study of the European Union under the project “FOREST 4.0.
Acknowledgments
Ingrida Augustaitiene for the help in preparing the manuscript.
Conflicts of Interest
The authors declare no conflicts of interest.
References
- Solberg, S. Summer drought: A driver for crown condition and mortality of Norway spruce in Norway. For. Pathol. 2004, 34, 93–104. [Google Scholar] [CrossRef]
- Allen, C.D.; Macalady, A.K.; Chenchouni, H.; Bachelet, D.; McDowell, N.; Vennetier, M.; Kitzberger, T.; Rigling, A.; Breshears, D.D.; Hogg, E.H.; et al. A global overview of drought and heat-induced tree mortality reveals emerging climate change risks for forests. For. Ecol. Manag. 2010, 259, 660–684. [Google Scholar] [CrossRef]
- Allen, C.; Breshears, D.; McDowell, N. On underestimation of global vulnerability to tree mortality and forest die-off from hotter drought in the Anthropocene. Ecosphere 2015, 6, 1–55. [Google Scholar] [CrossRef]
- Eilmann, B.; Rigling, A. Tree-growth analyses to estimate tree species drought tolerance. Tree Physiol. 2012, 32, 178–187. [Google Scholar] [CrossRef] [PubMed]
- Augustaitis, A.; Augustaitienė, I.; Kliučius, A.; Pivoras, G.; Šopauskienė, D.; Girgždienė, R. The seasonal variability of air pollution effects on pine conditions under changing climates. Eur. J. For. Res. 2010, 129, 431–441. [Google Scholar] [CrossRef]
- Augustaitis, A.; Augustaitienė, I.; Mozgeris, G.; Juknys, R.; Vitas, A.; Jasinevičienė, D. Growth patterns of Scots pine (Pinus sylvestris L.) under the current regional pollution load in Lithuania. iForest 2015, 8, 509–516. [Google Scholar] [CrossRef]
- Augustaitis, A.; Augustaitienė, I.; Baumgarten, M.; Bičenkienė, S.; Girgždienė, R.; Kulbokas, G.; Linkevičius, E.; Marozas, V.; Mikalajūnas, M.; Mordas, G.; et al. Tree-ring formation as an indicator of forest capacity to adapt to the main threats of environmental changes in Lithuania. Sci. Total Environ. 2018, 615, 1247–1261. [Google Scholar] [CrossRef] [PubMed]
- Spiecker, H. Growth dynamics in a changing environment long-term observation. Plant Soil 1995, 169, 555–561. [Google Scholar] [CrossRef]
- Solberg, S.; Dobbertin, M.; Reinds, G.J.; Lange, H.; Andreassen, K.; Fernandez, P.G.; Hildingsson, A.; de Vries, V. Analyses of the impact of changes in atmospheric deposition and climate on forest growth in European monitoring plots: A stand growth approach. For. Ecol. Manag. 2009, 258, 1735–1750. [Google Scholar] [CrossRef]
- Reyer, C.P.O.; Brouwers, N.; Rammig, A.; Brook, B.W.; Epila, J.; Grant, R.F.; Holmgren, M.; Langerwisch, F.; Leuzinger, S.; Lucht, W.; et al. Forest resilience and tipping points at different spatio-temporal scales: Approaches and challenges. J. Ecol. 2015, 103, 5–15. [Google Scholar] [CrossRef]
- Vanoni, M.; Bugmann, H.; Nötzli, M.; Bigler, C. Quantifying the effects of drought on abrupt growth decreases of major tree species in Switzerland. Ecol. Evol. 2016, 6, 3555–3570. [Google Scholar] [CrossRef] [PubMed]
- Hartmann, H.; Moura, C.F.; Anderegg, W.R.L.; Ruehr, N.K.; Salmon, Y.; Allen, C.D.; Galbraith, D. Research frontiers for improving our understanding of drought-induced tree and forest mortality. New Phytol. 2018, 218, 15–28. [Google Scholar] [CrossRef] [PubMed]
- Zhao, X.; Li, X.; Hu, W.; Liu, J.; Di, N.; Duan, J.; Li, D.; Liu, Y.; Guo, Y.; Wang, A.; et al. Long-term variation of the sap flow to tree diameter relation in a temperate poplar forest. J. Hydrol. 2023, 618, 129189. [Google Scholar] [CrossRef]
- Di, N.; Xi, B.; Clothier, B.; Wang, Y.; Li, G.; Jia, L. Diurnal and nocturnal transpiration behaviors and their responses to groundwater-table fluctuations and meteorological factors of Populus tomentosa in the North China Plain. For. Ecol. Manag. 2019, 448, 445–446. [Google Scholar] [CrossRef]
- Liu, J.; Li, D.; Ferńandez, J.E.; Coleman, M.; Hu, W.; Di, N.; Zou, S.; Liu, Y.; Xi, B.; Clothier, B. Variations in water-balance components and carbon stocks in poplar plantations with differing water inputs over a whole rotation: Implications for sustainable forest management under climate change. Agric. For. Meteorol. 2022, 320, 108958. [Google Scholar] [CrossRef]
- Landsberg, J.; Waring, R. Water relations in tree physiology: Where to from here? Tree Physiol. 2017, 37, 18–32. [Google Scholar] [CrossRef] [PubMed]
- Dragoni, D.; Lakso, A.N.; Piccioni, R.M. Transpiration of apple trees in a humid climate using heat pulse sap flow gauges calibrated with whole-canopy gas exchange chambers. Agric. For. Meteorol. 2005, 130, 85–94. [Google Scholar] [CrossRef]
- Kume, T.; Komatsu, H.; Kuraji, K.; Suzuki, M. Less than 20-min time lags between transpiration and stem sap flow in emergent trees in a Bornean tropical rainforest. Agric. For. Meteorol. 2008, 148, 1181–1189. [Google Scholar] [CrossRef]
- Tie, Q.; Hu, H.; Tian, F.; Guan, H.; Lin, H. Environmental and physiological controls on sap flow in a subhumid mountainous catchment in North China. Agric. For. Meteorol. 2017, 240–241, 46–57. [Google Scholar] [CrossRef]
- Chang, X.; Zhao, W.; He, Z. Radial pattern of sap flow and response to microclimate and soil moisture in Qinghai spruce (Picea crassifolia) in the upper Heihe River Basin of arid northwestern China. Agric. For. Meteorol. 2014, 187, 14–21. [Google Scholar] [CrossRef]
- Mitchell, P.J.; Veneklaas, E.; Lambers, H.; Burgess, S.S.O. Partitioning of evapotranspiration in a semi-arid eucalypt woodland in south-western Australia. Agric. For. Meteorol. 2009, 149, 25–37. [Google Scholar] [CrossRef]
- Poyatos, R.; Granda, V.; Molowny-Horas, R.; Mencuccini, M.; Steppe, K.; Martínez-Vilalta, J. SAPFLUXNET: Towards a global database of sap flow measurements. Tree Physiol. 2016, 36, 449–1455. [Google Scholar] [CrossRef] [PubMed]
- Hartmann, H.; Bastos, A.; Das, A.J.; Esquivel-muelbert, A.; Hammond, W.M.; Martínez-vilalta, J.; Mcdowell, N.G.; Powers, J.S.; Pugh, T.A.M.; Ruthrof, K.X.; et al. Climate change risks to global forest health: Emergence of unexpected events of elevated tree mortality worldwide. Annu. Rev. Plant Biol. 2022, 73, 673–702. [Google Scholar] [CrossRef]
- Anderegg, W.R.L.; Anderegg, L.D.L.; Huang, C.-Y. Testing early warning metrics for drought-induced tree physiological stress and mortality. Glob. Chang. Biol. 2019, 25, 2459–2469. [Google Scholar] [CrossRef]
- UN-ECE. Manual on Methods and Criteria for Harmonized Sampling Assessment, Monitoring and Analyses on Air Pollution on Forests; ICP: New York, NY, USA, 1994; p. 178. [Google Scholar]
- Augustaitis, A. Impact of Meteorological Parameters on Responses of Pine Crown Condition to Acid Deposition at Aukstaitija National Park. Balt. For. 2011, 17, 205–214. [Google Scholar]
- Mikalajūnas, M.; Pretzsch, H.; Mozgeris, G.; Linkevičius, E.; Augustaitienė, I.; Augustaitis, A. Scots pine’s capacity to adapt to climate change in hemi-boreal forests in relation to dominating tree increment and site condition. iForest 2021, 14, 473–482. [Google Scholar] [CrossRef]
- Kraft, G. Beiträge zur Lehre von den Durchforstungen, Schlagstellungen und Lichtungshieben; Klindworth‘s Verlag: Hannover, Germany, 1884. [Google Scholar]
- Flo, V.; Martinez-Vilalta, J.; Steppe, K.; Schuldt, B.; Poyatos, R. A synthesis of bias and uncertainty in sap flow methods. Agric. For. Meteorol. 2019, 271, 362–374. [Google Scholar] [CrossRef]
- Komatsu, H.; Shinohara, Y.; Nogata, M.; Tsuruta, K.; Otsuki, K. Changes in canopy transpiration due to thinning of a Cryptomeria japonica plantation. Hydrol. Res. Lett. 2013, 7, 60–65. [Google Scholar] [CrossRef]
- Burgess, S.S.O.; Adams, M.A.; Turner, N.C.; Beverly, C.R.; Ong, C.K.; Khan, A.A.H.; Bleby, T.M. An improved heat pulse method to measure low and reverse rates of sap flow in woody plants. Tree Physiol. 2001, 21, 589–598. [Google Scholar] [CrossRef] [PubMed]
- ICT International. Sap Flow Tool. Analysis and Visualization of Sap Flow Data. User Manual. 2016. Version 1.4. Available online: https://ictinternational.com/manuals-and-brochures/sfm1x-sap-flow-meter/ (accessed on 24 June 2024).
- Baumgarten, M.; Weis, W.; Kühn, A.; May, M.; Matyssek, R. Forest transpiration targeted through xylem sap flux assessment versus hydrological modeling. Eur. J. For. Res. 2014, 133, 677–690. [Google Scholar] [CrossRef]
- Baumgarten, M.; Hesse, B.D.; Augustaitienė, I.; Marozas, V.; Mozgeris, G.; Byčenkienė, S.; Mordas, G.; Pivoras, A.; Pivoras, G.; Juonytė, D.; et al. Responses of species-specific sap flux, transpiration and water use efficiency of pine, spruce and birch trees to temporarily moderate dry periods in mixed forests at a dry and wet forest site in the hemi-boreal zone. J. Agric. Meteorol. 2019, 75, 13–29. [Google Scholar] [CrossRef]
- Edwards, W.R.N.; Becker, P.; Čermák, J. A unified nomenclature for sap flow measurements. Tree Physiol. 1997, 17, 65–67. [Google Scholar] [CrossRef]
- LHMT (Lithuanian Hydrometeoservice). 2020. Available online: https://www.meteo.lt/ (accessed on 12 January 2021).
- Liu, Z.; Yu, S.; Xu, L.; Wang, Y.; Yu, P.; Chao, Y. Differentiated responses of daytime and nighttime sap flow to soil water deficit in a larch plantation in Northwest China. Agric. Water Manag. 2023, 289, 108540. [Google Scholar] [CrossRef]
- Oogathoo, S.; Houle, D.; Duchesne, L.; Kneeshaw, D. Vapor pressure deficit and solar radiation are the major drivers of transpiration of balsam fir and black spruce tree species in humid boreal regions, even during a short-term drought. Agric. For. Meteorol. 2020, 291, 108063. [Google Scholar] [CrossRef]
- United Nations. Sustainable Development Goals: 17 Goals to Transform Our World. 2015. Available online: http://www.un.org/sustainabledevelopment/sustainable-development-goals/ (accessed on 15 June 2020).
- Bréda, N.; Huc, R.; Granier, A.; Dreyer, E. Temperate forest trees and stands under severe drought: A review of ecophysiological responses, adaptation processes and long-term consequences. Ann. For. Sci. 2006, 63, 625–644. [Google Scholar] [CrossRef]
- Grossiord, C.; Buckley, T.N.; Cernusak, L.A.; Novick, K.A.; Poulter, B.; Siegwolf, R.T.W.; Sperry, J.S.; McDowell, N.G. Plant responses to rising vapor pressure deficit. New Phytol. 2020, 226, 1550–1566. [Google Scholar] [CrossRef] [PubMed]
- Boczoń, A.; Wróbel, M. The influence of drought on the water uptake by Scots pines (Pinus sylvestris L.) at different positions in the tree stand. For. Res. Pap. 2015, 76, 370–376. [Google Scholar] [CrossRef]
- Ozolinčius, R.; Lekevičius, E.; Stakėnas, V.; Galvonaitė, A.; Samas, A.; Valiukas, D. Lithuanian forests and climate change: Possible effects on tree species composition. Eur. J. For. Res. 2014, 133, 51–60. [Google Scholar] [CrossRef]
- Sykes, M.T.; Prentice, I.C.; Cramer, W.A. Bioclimatic Model for the Potential Distributions of North European Tree Species Under Present and Future Climates. J. Biogeogr. 1996, 23, 203–233. Available online: https://researchers.mq.edu.au/en/publications/a-bioclimatic-model-for-the-potential-distributions-of-north-euro (accessed on 2 January 2024). [CrossRef]
- Hanewinkel, M.; Cullmann, D.A.; Schelhaas, M.J.; Nabuurs, G.J.; Zimmermann, N.E. Climate change may cause severe loss in the economic value of European forest land. Nat. Clim. Chang. 2013, 3, 203–207. [Google Scholar] [CrossRef]
- Zimmermann, N.E.; Normand, S.; Pearman, P.B.; Psomas, A. Future ranges in European tree species. In Adapting to Climate Change in European Forests—Results of the MOTIVE Project; Fitzgerald, J., Lindner, M., Eds.; Pensoft Press: Sofia, Bulgaria, 2013; pp. 15–21. [Google Scholar]
- Trujillo-Moya, C.; George, J.P.; Fluch, S.; Geburek, T.; Grabner, M.; Karanitsch-Ackerl, S.; Konrad, H.; Mayer, K.; Sehr, E.M.; Wischnitzki, E.; et al. Drought sensitivity of Norway spruce at the species’ warmest fringe: Quantitative and molecular analysis reveals high genetic variation among and within provenances. G3 Genes Genomes Genet. 2018, 8, 1225–1245. [Google Scholar] [CrossRef] [PubMed]
- Falk, W.; Hempelmann, N. Species Favourability Shift in Europe due to Climate Change: A Case Study for Fagus sylvatica L. and Picea abies (L.) Karst. Based on an Ensemble of Climate Models. J. Climatol. 2013, 6, 18. [Google Scholar] [CrossRef]
- Briceño-Elizondo, E.; Garcia-Gonzalo, J.; Peltola, H.; Matala, J.; Kellomäki, S. Sensitivity of growth of Scots pine, Norway spruce and silver birch to climate change and forest management in boreal conditions. For. Ecol. Manag. 2006, 232, 152–167. [Google Scholar] [CrossRef]
- Dubois, H.; Verkasalo, E.; Claessens, H. Potential of Birch (Betula pendula Roth and B. pubescens Ehrh.) for Forestry and Forest-Based Industry Sector within the Changing Climatic and Socio-Economic Context of Western Europe. Forests 2020, 11, 336. [Google Scholar] [CrossRef]
- Cienciala, E.; Kučera, J.; Ryan, M.; Lindroth, A. Water flux in boreal forest during two hydrologically contrasting years; species specific regulation of canopy conductance and transpiration. Ann. Sci. For. 1998, 55, 47–61. [Google Scholar] [CrossRef]

Disclaimer/Publisher’s Note: The statements, opinions and data contained in all publications are solely those of the individual author(s) and contributor(s) and not of MDPI and/or the editor(s). MDPI and/or the editor(s) disclaim responsibility for any injury to people or property resulting from any ideas, methods, instructions or products referred to in the content. |
© 2024 by the authors. Licensee MDPI, Basel, Switzerland. This article is an open access article distributed under the terms and conditions of the Creative Commons Attribution (CC BY) license (https://creativecommons.org/licenses/by/4.0/).