Article

Applying and Evaluating the Modified Method of the Rothermel Model under No-Wind Conditions for Pinus koraiensis Plantations

1
Key Laboratory of Sustainable Forest Ecosystem Management, Ministry of Education, College of Forestry, Northeast Forestry University, Harbin 150040, China
2
Key Laboratory National Forestry and Grassland Administration on Ecological Hydrology and Disaster Prevention in Arid Regions, Northwest Surveying and Planning Institute of National Forestry and Grassland Administration, Xi’an 710048, China
*
Author to whom correspondence should be addressed.
Forests 2024, 15(7), 1178; https://doi.org/10.3390/f15071178
Submission received: 31 May 2024 / Revised: 29 June 2024 / Accepted: 4 July 2024 / Published: 6 July 2024
(This article belongs to the Section Forest Ecology and Management)

Abstract

:
Pinus koraiensis is one of the important tree species in Northeast China. Due to its high pine-needle-oil content and the density of human activities in its habitat, the forest-fire prevention situation is severe in the context of climate change. The rate of surface-fire spread is one of the key indicators for scientifically advancing early fire prevention and is crucial for guiding forest firefighting operations. In this study, we investigated how moisture content, load, and slope impact the surface-fire spread rate using indoor-simulated fire-spread experiments. Furthermore, we analyzed the limitations in the Rothermel model for predicting the surface-fire spread rate in P. koraiensis plantations and proposed modifications to the model by the modification method of priority to no-wind or slope conditions and slope conditions. Additionally, we evaluated the prediction accuracy of the original Rothermel model and two other modified models on the surface-fire spread rate. A high moisture content and low slope demonstrated an absolute inhibitory effect on the rate of surface-fire spread, whereas the promotional effect of a low moisture content and high slope was easily disturbed by the other factors. Under high-slope conditions, an overestimation situation was observed in the Rothermel model. Both of the modification methods involving priority to no-wind or slope conditions and slope conditions could improve this situation. Furthermore, the modification method demonstrated a better improvement effect on the prediction accuracy. Our findings provide valuable insights for refining the Rothermel model and offer guidance for improving the accuracy of predicting fire spread rates and behavior for Pinus koraiensis. This bears immense significance for advancing the understanding and calculation of the ROS of forest fires in the region.

1. Introduction

The incidence and severity of global wildfires are increasing [1]. Pinus koraiensis forests, serving as significant climax communities in the Xiaoxing’an and Changbai Mountains of China, occur both naturally and as widely planted forests. However, P. koraiensis, being a light-loving species with high needle-oil content, is highly flammable [2]. Frequent human activities in its growth areas further enhance the likelihood and intensity of forest fires. Therefore, effective prevention and scientific firefighting of P. koraiensis plantation fires have become a focal point of forest-fire research in Northeast China [3]. Relevant studies continuously focus on a series of characteristics related to the spread of surface fires in P. koraiensis plantations and the prediction of fire behavior [4,5,6]. Among these studies, the rate of fire spread has always been a key research focus, as it is the basis of all fire development and an important basis for assessing fire risk and formulating firefighting strategies [7].
Researchers have developed various prediction models by incorporating the main influencing factors of fire spread, such as fuel characteristics (moisture content, load, surface-to-volume ratio, and packing ratio, among others) [8], topographic features (slope, etc.) [9], and meteorological features (temperature, humidity, wind speed, etc. [10]) to accurately predict the fire spread rate. These include empirical [11], physical [12], and mathematical models, among others [13]. The semi-physical model proposed by Rothermel in 1972 has been widely recognized and applied in practice [14].
The Rothermel model, rooted in the energy conservation theorem [15], estimates fire spread rates through the regression fitting of a series of physical formulae and experimental data. The United States, for example, has advanced fire-behavior prediction systems like FlamMap [16,17] and BehavePlus [18,19], which are built upon the Rothermel model. This model serves as a powerful tool for fire prediction and aids in decision-making for subsequent fire management. However, due to limitations in the experimental conditions, the accuracy of the model varies when applied to different fuel types [6,20]. Therefore, strict applicability evaluations and necessary modifications must be performed to ensure the accuracy and reliability of the prediction results before using this model for predicting fire behavior [21].
Presently, domestic and foreign amendments to the Rothermel model mainly include two approaches. The first involves splitting the original model, classifying it according to input variables, and, finally, forming a multiple regression model with multiple independent variables [20,22]. The second involves re-fitting parameters for each part of the equation without changing the form of the original model and, finally, forming an amendment model that is consistent with the original model form but has different parameters [6,23]. The first approach alters the equation form established by the physical theory of the Rothermel model, hindering theoretical advancements and comprehension of the spread process. The second approach maintains the theoretical foundation while adjusting model parameters, enhancing the model applicability, and allowing for future theoretical advancements. Additionally, the main objects of model modification include moisture content, load, slope, and wind speed, among others [22]. However, the spread rate is mainly driven by slope because the wind speed in red-pine forests in Northeast China is usually low [24], in addition to the influence of physicochemical properties and characteristics. We did not set up a wind-speed gradient in our experiment and only considered three other main variables to more clearly determine the influence of the slope and fuel on the spread rate and reduce interference from other variables.
Therefore, this study considered the surface fuels of typical Pinus koraiensis forests in Northeast China as the research object, seeking to address (1) the key factors affecting the fire spread rate of surface fuels in Pinus koraiensis forests under no-wind conditions, (2) the suitability of the original Rothermel model for predicting the fire spread rate of surface fuels in these forests, and (3) the more effective modification effect when improving the prediction effect of the model: the no-wind or slope condition priority modification method or the slope condition priority modification method. The no-wind or slope condition priority modification method first uses experimental data under no-wind or slope conditions to modify the Rothermel model. Subsequently, it uses experimental data under slope conditions to modify the slope coefficient. Finally, the two parts are combined to form a modified Rothermel model. The slope-condition priority modification method first uses experimental data under slope conditions for slope coefficient modification. Subsequently, it uses the slope coefficient calculated to obtain the experimental data, excluding the slope’s influence, and, finally, combines the data under no-wind or slope conditions to jointly modify the remaining part of the model. This study aims to enhance our comprehension of the fire spread characteristics of surface fuels in P. koraiensis forests and improve the accuracy and applicability of the model for predicting fire spread on the surface of P. koraiensis forests through modification. Furthermore, we aim to provide more accurate and scientific fire management strategies for management departments to formulate and provide, so as to provide a theoretical basis for a more effective protection of forest resources and the ecological environment in Northeast China.

2. Materials and Methods

The study area was located in the Maoer Mount Experimental Forestry, Harbin, Heilongjiang Province, China (Figure 1). The area is a remnant of the western slope of Zhangguangcai Mountain Range, a branch of the Changbai Mountain Range, characterized by low hills and gentle slopes. The Ashe River, originating from Jianla Ditch and the Laoyeling Mountain Range, is the primary river in the region, flowing through the study area from north to south before merging with the Songhua River. The climate of the region is influenced by the Eurasian monsoon, resulting in a temperate monsoon climate. Springs are dry and windy, summers are hot and humid, autumn temperatures are higher than those in spring, and winters are long, cold, and dry. The annual average temperature in this area is approximately 2.8 °C, with a monthly average minimum temperature of −31.9 °C and a monthly average maximum temperature of 26.1 °C The local original P. koraiensis forests were plundered and destroyed by Japanese and Russian invaders [25]. Later, through secondary succession and human management, different stages of natural secondary forests and plantations were formed. The main tree species include red pine (P. koraiensis), Xing’an larch (Larix gmelinii), Mongolian pine (Pinus sylvestris var. mongolica), Korean spruce (Picea koraiensis), Mongolian oak (Quercus mongolica), white birch (Betulla platyphylla), Manchurian ash (Fraxinus mandshurica), and Manchurian walnut (Juglans mandshurica). According to historical statistics, from 1970 to 2015, there were a total of 9 forest fires, covering a total burned area of 270.35 hectares. The accumulation of understory fuel load is relatively high, posing a significant risk for fire occurrence. The annual spring fire prevention period in this region runs from 15th March to 15th June, while the autumn fire prevention period is from 15th September to 15th November. The permanent resident population is approximately 13,000, and there is frequent human activity in the vicinity of the forest.
Since autumn (15th September–15th November) has a high incidence of forest fires in this region [26], we collected fine dead fuel from the P. koraiensis plantations in September 2022 as the experimental materials for simulating the spread of real wildfires indoors. After collecting the fuels, they were first dried at 105 °C and, then, stored in a dark and well-ventilated indoor space for later use. The preliminary information of the sample plots is shown in Table 1.

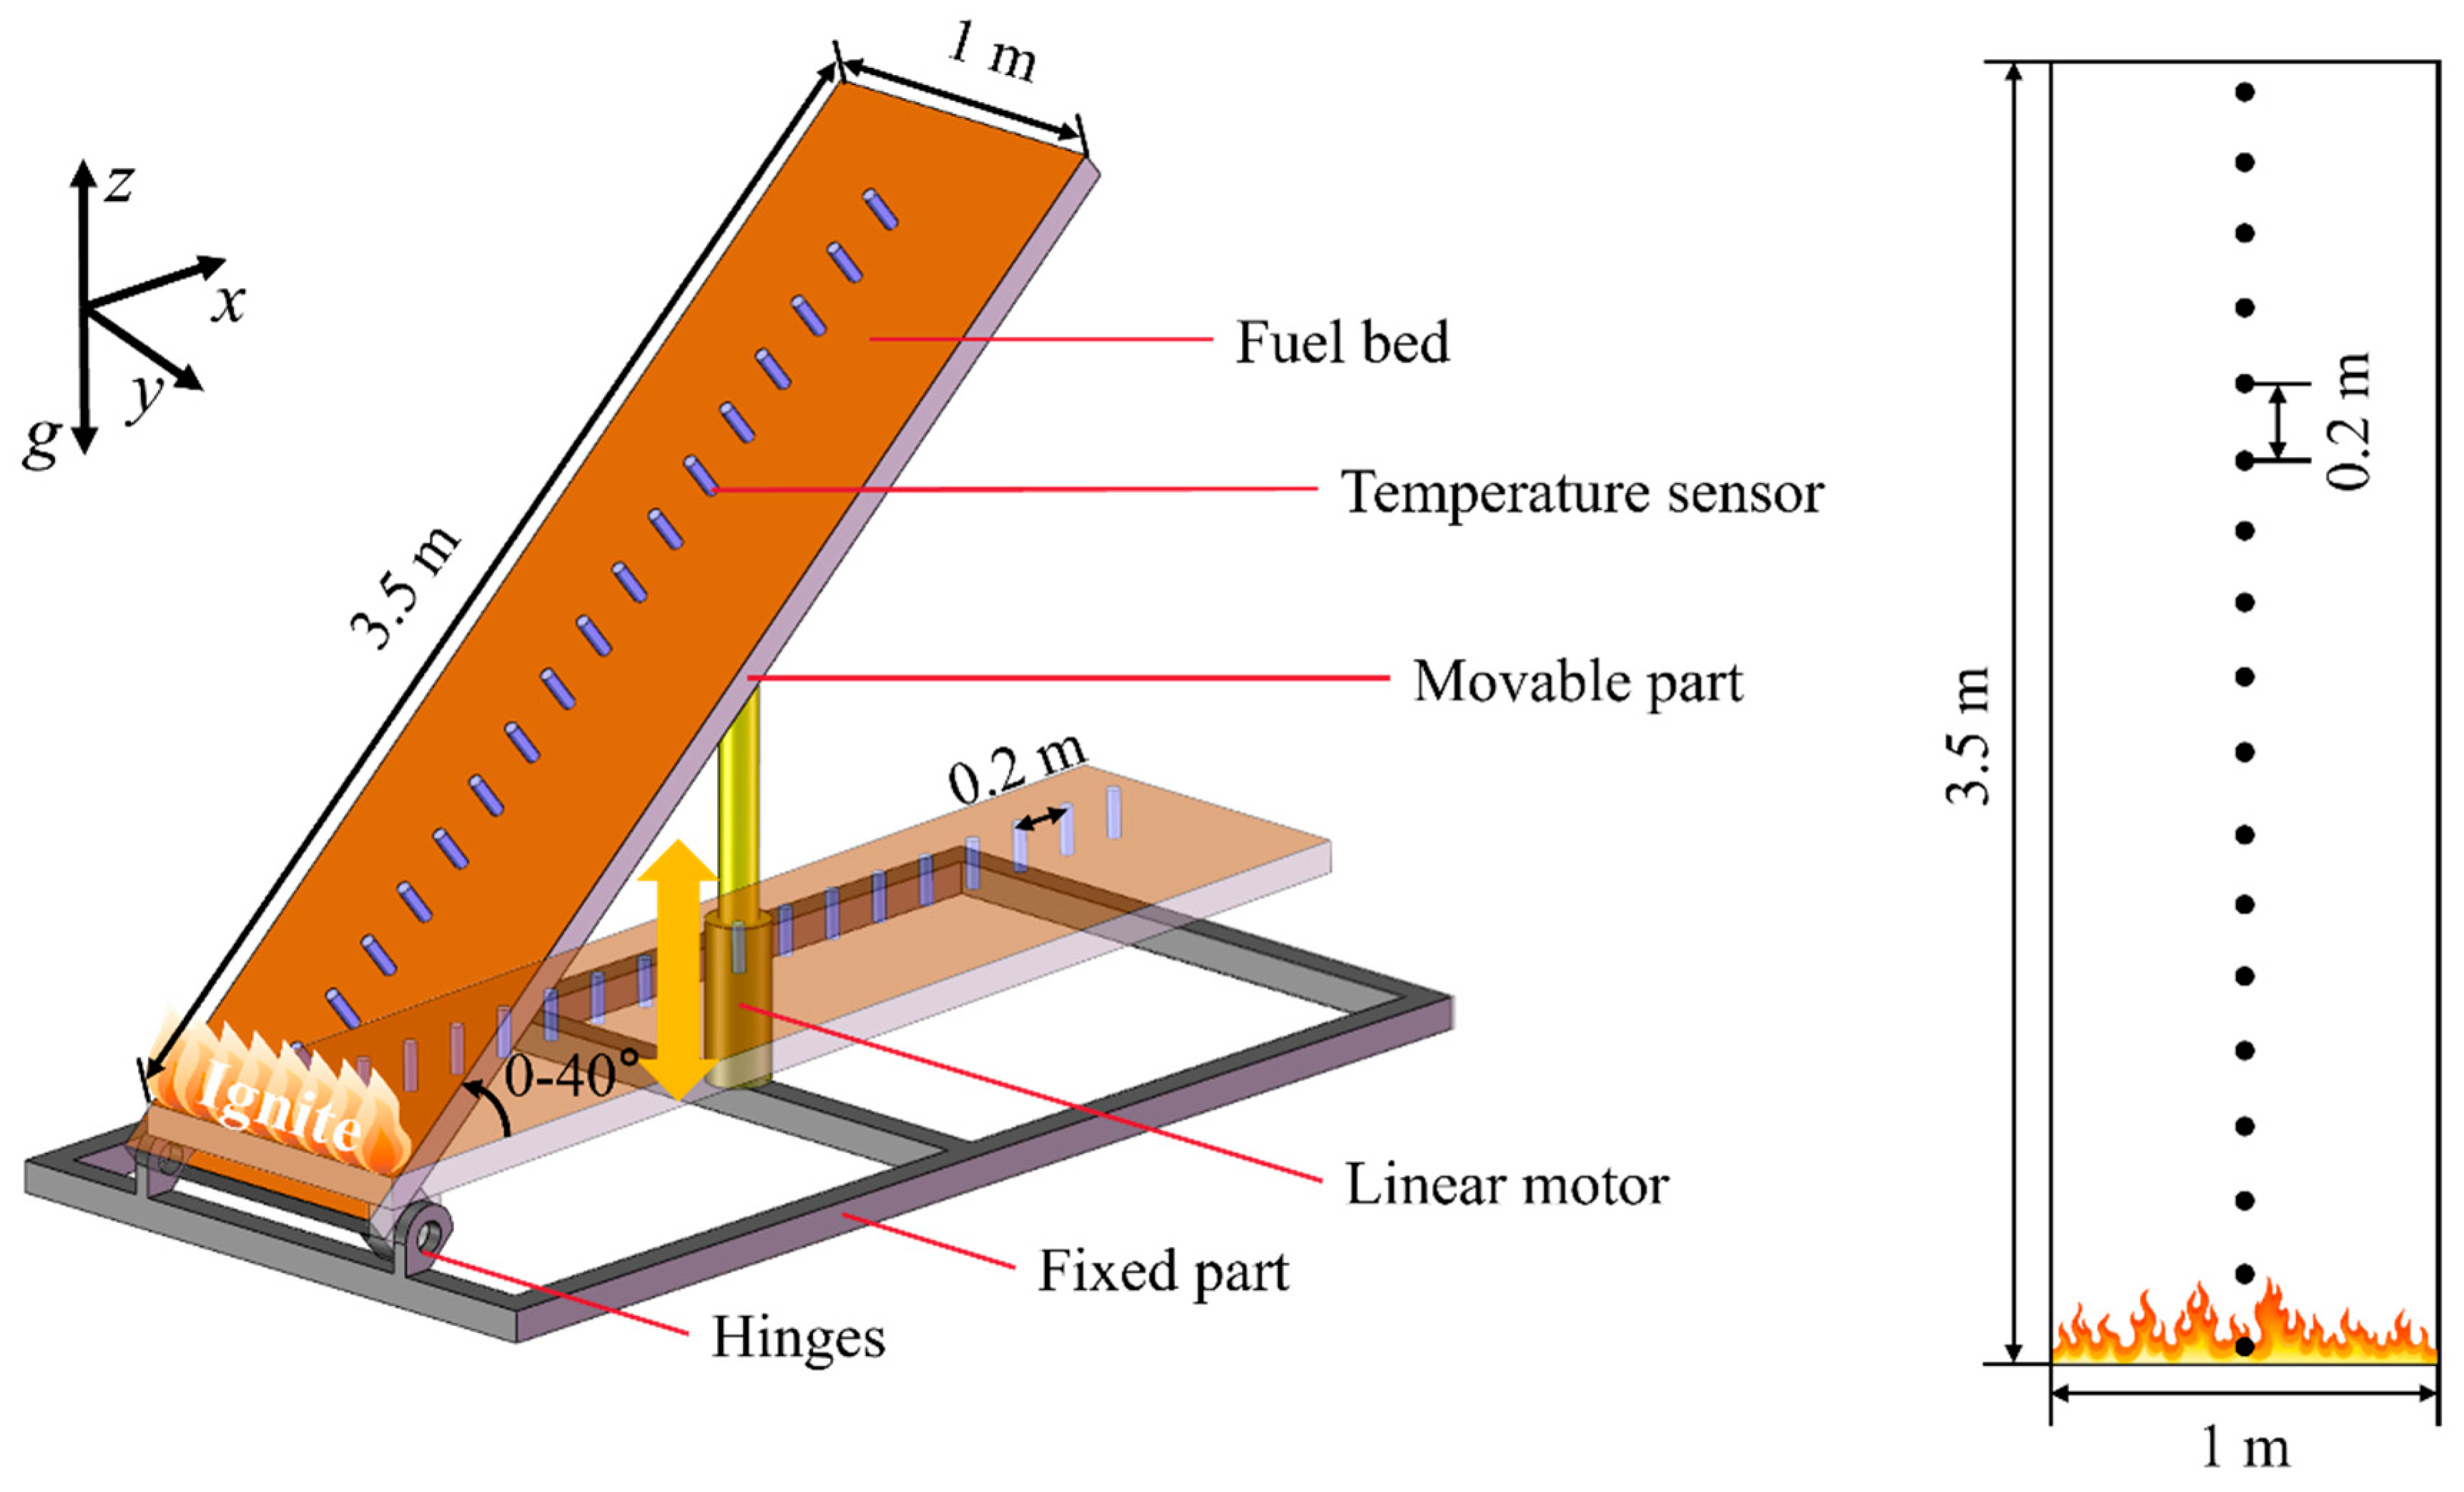
2.1. Indoor-Simulated Fire-Spread Experiment

The experiment was conducted in the Forest–Grassland Fire Behavior Laboratory of Northeast Forestry University, Harbin, Heilongjiang Province. Figure 2 shows the indoor-simulated fire-spread experimental device, which is designed to simulate a wild environment and provide an experimental basis for measuring the rate of fire spread under conditions closest to the real situation. The main body of the self-made experimental device consisted of an adjustable bed layer, a telescopic support rod, a hinge, and a thermocouple. An adjustable bed layer was used to carry the fuels, a telescopic support rod and hinge were used to adjust the slope of the bed layer, and a thermocouple was used to determine the flame temperature when the fire front passed through. The variations in fuel and terrain conditions were simulated by adjusting the moisture content, load, and slope gradient of the fuels (Table 2), and the fire spread rate under different conditions was determined. This experiment is a completely factorial experimental design with three, four, and five levels of moisture content, load, and slope, with a total of 60 experiments. Additionally, the measured value of this experiment’s fire-spread rate is the average value of the fire-spread rate measured using 12 thermocouples, which has representativeness and repeatability. Therefore, each combination of gradients in the completely factorial experimental design was carried out only once.

2.1.1. Fuel-Bed Preparation

According to the results of the plot investigation (Table 1), the surface fuel load of the P. koraiensis forest plot was approximately 0.6–1.0 kg·m−2. The gradients of fuel load for the indoor-simulated fire-spread experiment were set as 0.5 kg·m−2, 0.7 kg·m−2, 0.9 kg·m−2, and 1.1 kg·m−2 according to Equation (1) to ensure that the research has practical significance. Through a pre-experiment of an indoor-simulated fire spread, we observed that, when the moisture content of the fuel increased to approximately 30%, it could not form a stable fire spread. Therefore, we set the moisture-content gradients of the fuel to 5%, 15%, and 25%, which were as close as possible to 30% while ensuring that the flame stably moved on the fuel bed. The fuel moisture content during the experiment was calculated using Equation (2).
w 0 = m 0 S
M f = m H m 0 m 0
where w 0 is the dry fuel load (kg·m−2); m 0 is the dry fuel mass (kg); S is the area covered by dry fuel (m2); M f is the absolute moisture content of fuel; and m H is the wet fuel mass (kg).
The moisture content must be determined before the fuel bed is placed. We removed the spare fuel, determined the current moisture content, calculated the difference from the target moisture content, and determined the water mass that was required to be added or reduced per unit of fuel mass. Subsequently, the required water was evenly sprayed onto the fuel and thoroughly mixed, and the fuel that was required to be reduced in water was placed in an oven for drying. The moisture content of the fuel was measured several times during this period until it satisfied the requirements. The fuel that completed the moisture content configuration was stored in a light- and wind-free 20 °C room-temperature environment until the fuel bed was laid.
Relevant studies have revealed that a small acceleration process exists in the fire front at the beginning of the surface-fire spread on a bed with a uniform fuel distribution, after which the spread rate tends to be stable (see Figure A1). Therefore, the fuel bed set in this study was 3.5 m long and 1 m wide to ensure that the fire-spread rate was measured at the stable stage. While laying the fuel bed, we artificially simulated the natural falling process and evenly spread the fuel on the bed. It is worth mentioning that, since we completely simulated the natural fallout when laying the fuel bed without any manual intervention such as compaction or loosening of the fuel bed, the variation in loads does not affect the bulk density. The bed depth increases with the load, while the bulk density remains constant.

2.1.2. Slope Preparation

According to the results of the plot investigation (see Table 1), the slope of the P. koraiensis forest within the sample plot ranged from 13–33°. Although there may be slopes in the actual terrain that exceed the range of this survey, after comprehensive consideration of the topographic characteristics of the area [27], we have reason to believe that this slope range can serve as an initial reference to narrow down the slope conditions for the experiment. The priority modification of the Rothermel model requires completion based on an experiment with a 0° slope because of the first-step modification method of the flat windless condition. Therefore, the indoor-simulated fire-spread experiment in this study incorporated experimental conditions with a 0° slope. The original Rothermel model is only suitable for low slopes [6,14], and we set the slope gradient of the indoor-simulated fire-spread experiment to 0°, 10°, 20°, 30°, and 40° to expand the slope applicability of the Rothermel model combined with the conditions of the Pinus koraiensis forest plot.

2.1.3. Measurement of the Fire-Spread Rate

When the fire-resistant bed was adjusted to the corresponding slope, a 1 m long cotton thread with 2.11 g of gasoline adsorbed on it was placed at the front of the bed. Subsequently, we quickly ignited the cotton thread and ensured that all positions on the fire line used for ignition were simultaneously ignited. Seventeen thermocouples were placed in the middle of the fire-resistant material to measure the flame temperature (Figure 2). Previous related studies have considered that when the fire line arrives, the thermocouple temperature reaches 300 °C [28]. In addition, according to relevant research [6], we had reserved a 1 m preheating zone to ensure that the fire-spread rate enters a quasi-steady state stage [14]. Therefore, we collected the time it took for 12 thermocouples 2.5 m away from the end of the bed to reach 300 °C, as well as the distance between the thermocouple and the ignition position. We calculated the values of distance/time (Figure A2), and their average value was used as the fire-spread rate under the experimental conditions.

2.2. Data Analysis

2.2.1. Rothermel Model

The basic form of the Rothermel model is expressed by Equation (3). Since this study was conducted under no-wind conditions, Φ w in Equation (3) is zero. The fire-spread rate can be calculated by substituting Equations (4)–(17) into Equation (3), and Table 3 lists the data required for input into this group of equations. Directly changing the unit of the input values causes calculation errors owing to the complexity of the applying formulae within the Rothermel model. Therefore, the metric unit data obtained from the indoor simulation of fire-spread experiments must be converted into English units before they can be substituted into Equations (4)–(17). We converted the output results into metric units to facilitate comparison with other studies.
R = I R ξ 1 + Φ W + Φ S ρ b ε Q i g
Q i g = 250 + 1116 M f
I R = w n h Γ η M η S
w n = w o 1 + S T
Γ = Γ m a x β β o p A e A 1 β β o p
Γ m a x = σ 1.5 495 + 0.0594 σ 1.5 1
β = ρ b ρ p
β o p = 3.348 σ 0.8189
A = 1 4.774 σ 0.1 7.27
η M = 1 2.59 M f M x + 5.11 M f M x 2 3.52 M f M x 3
η S = 0.174 S e 0.19
ξ = 192 + 0.2595 σ 1 e 0.792 + 0.681 σ 0.5 β + 0.1
Φ S = 5.275 t a n φ β 0.15 2
ρ b = w o δ
ε = e 138 σ
where R is the fire-spread rate (ft·min−1); Q i g is the preignition heat (Btu·lb−1); IR is the reaction intensity (Btu·ft−2·min−1); w n is the net load (lb·ft−2); Γ is the optimal reaction rate (min−1); Γ m a x is the maximum reaction rate (min−1); β is the compression ratio (dimensionless); β o p is the optimal compression ratio (dimensionless); η M is the moisture-damping coefficient (dimensionless); η S is the mineral-damping coefficient (dimensionless); ξ is the propagation flux ratio (dimensionless); Φ S is the slope coefficient (dimensionless); ρ b is the dry bulk density (lb·ft−3); and ε is the effective heating coefficient (dimensionless).

2.2.2. Modification Method of Priority to No-Wind or Slope Conditions

The indoor-simulated fire-spread experiment set the moisture content, load, and slope gradient. And, the model modification is for η M and Φ S , since the calculation formula related to load in the Rothermel model does not involve regression fitting.
Substituting Equations (4)–(14) into Equation (3) under the conditions of flat land without wind and after simplification, Equation (18) is obtained, which is used to calculate the measured value of the moisture damping coefficient η M during the fire-spread experiment. We added M f and η M into Equations (12) and (19) for parameter fitting based on the least-squares method to simplify the form of the formula and simultaneously improve the prediction accuracy, and the modified moisture-damping coefficient was introduced into Equation (3) to calculate the predicted value of the fire-spread rate under the condition of flatland without wind. The determination coefficients of the two models were 0.974 and 0.977, respectively. We chose the simpler form of Equation (19) and a more convenient fitting process as the moisture-damping coefficient equation for the subsequent model modification under the condition of a slightly higher prediction accuracy. We used η M , M f , and M x to estimate the related parameters in Equation (19) and, subsequently, obtained the predicted value of the moisture-damping coefficient η M 1 that should be first modified under flatland conditions without wind.
η M = R 0 ρ b Q i g ε w n h Γ η S ξ
η M 1 = a 1 M f M x + b 1
where η M is the measured value of the moisture-damping coefficient; R 0 is the measured value of the fire-spread rate under flatland windless conditions; and a 1 and b 1 are the parameters to be estimated.
Subsequently, we selected the experimental data with a slope of approximately 10–40° and calculated the measured value of the slope coefficient Φ S according to Equation (20). We used Φ S , t a n φ , and β to estimate the relevant parameters in Equation (21), where Φ S 1 was substituted with Φ S . And, we substituted η M 1 and Φ S 1 into Equation (3) to obtain the predicted fire-spread rate R 1 under flat windless conditions with priority modifications.
Φ S = R S R 0 1
Φ S 1 = c 1 t a n φ β d 1 2
where Φ S is the measured slope coefficient; R S is the measured fire-spread rate under the slope condition; Φ S 1 is the predicted slope coefficient for priority modification under flatland without wind conditions; and c 1 and d 1 are the parameters to be estimated.

2.2.3. Modification Method of Priority to Slope Conditions

First, we selected the experimental data with a slope of approximately 10–40°, calculated the slope coefficient Φ S 2 according to Equation (20), and obtained the measured value Φ S . Using Φ S   t a n φ , and β to estimate the relevant parameters in Equation (22), where Φ S 2 was substituted by Φ S , we then obtained the modified slope coefficient Φ S 2 . Subsequently, we calculated the approximate flatland windless fire-spread rate R 0 by removing the slope’s influence according to Equation (23).
Φ S 2 = c 2 t a n φ β d 2 2
R 0 = R S 1 + Φ S 2
where Φ S 2 is the predicted value of the slope coefficient with preferential modification for the slope condition; c 2 and d 2 are the parameters to be estimated; R S is the approximate flatland windless fire-spread rate without the slope’s influence; and R S is the measured fire-spread rate under slope conditions.
The measured value of the moisture-damping coefficient η M is calculated using Equations (18) and (24). The related parameters in Equation (25) are estimated using η M , M f , and M x , and subsequently, the predicted value of the moisture-damping coefficient with slope condition priority modification η M 2 is obtained. Finally, Φ S 2 and η M 2 were substituted into Equation (3) to obtain the predicted value of the fire-spread rate with aslope condition priority modification of R 2 .
η M = R 0 ρ b Q i g ε w n h Γ η S ξ
η M 2 = a 2 M f M x + b 2
where η M is the measured value of the moisture-damping coefficient; η M 2 is the predicted value of the moisture-damping coefficient with slope condition priority modification; and a 2 , b 2 are the parameters to be estimated.

2.2.4. Analysis of Variance (ANOVA) and Correlation

For statistical analysis, SPSS Statistics 27 was used. A three-way ANOVA was used to analyze the effects of slope, moisture content, and load on the fire-spread rate. Additionally, multiple comparisons were conducted using the least significant difference (LSD) test method to analyze the effects of the three factors and two-way interaction on the fire-spread rate. The correlation between the slope, moisture content, load, and fire-spread rate was studied using Pearson correlation analysis.

2.2.5. Model Evaluation

The average absolute error (MAE, m·min−1), mean relative error (MRE, %), root-mean-square error (RMSE, m·min−1), regression coefficient, and determination coefficient (R2) were the five indicators to evaluate the prediction accuracy of the three models under conditions of different moisture contents and slope as well as the overall prediction accuracy.

3. Results

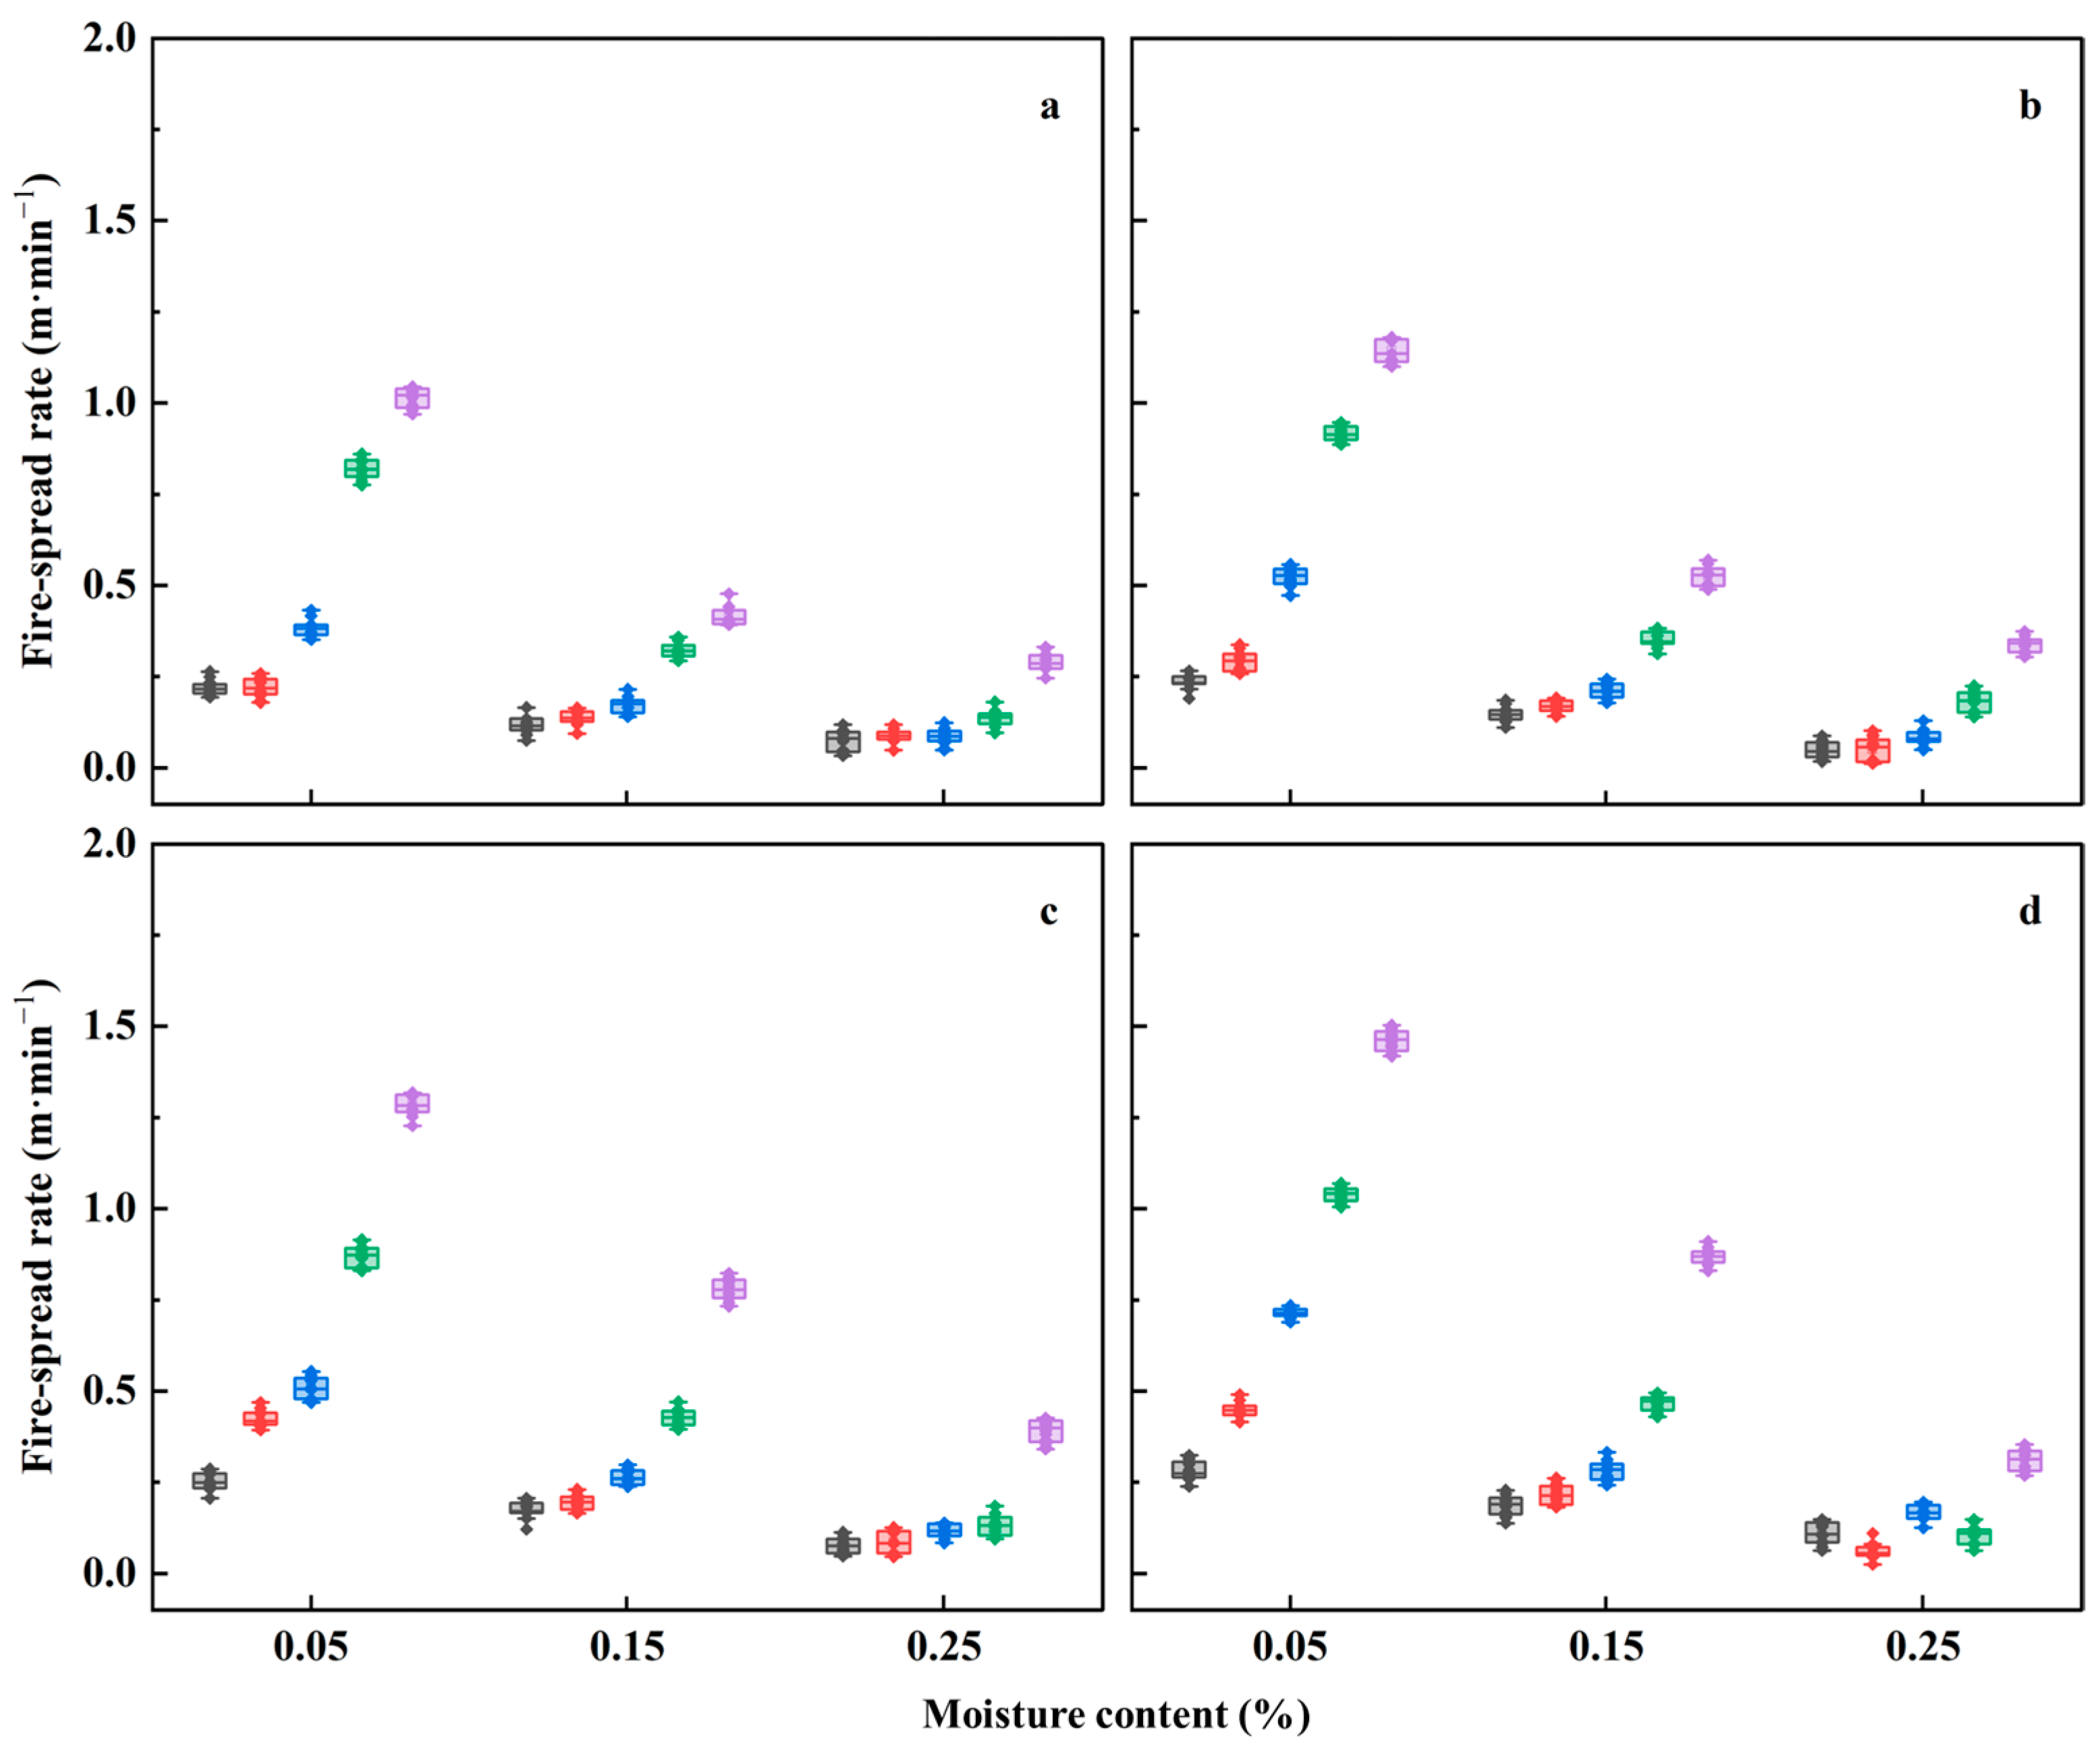
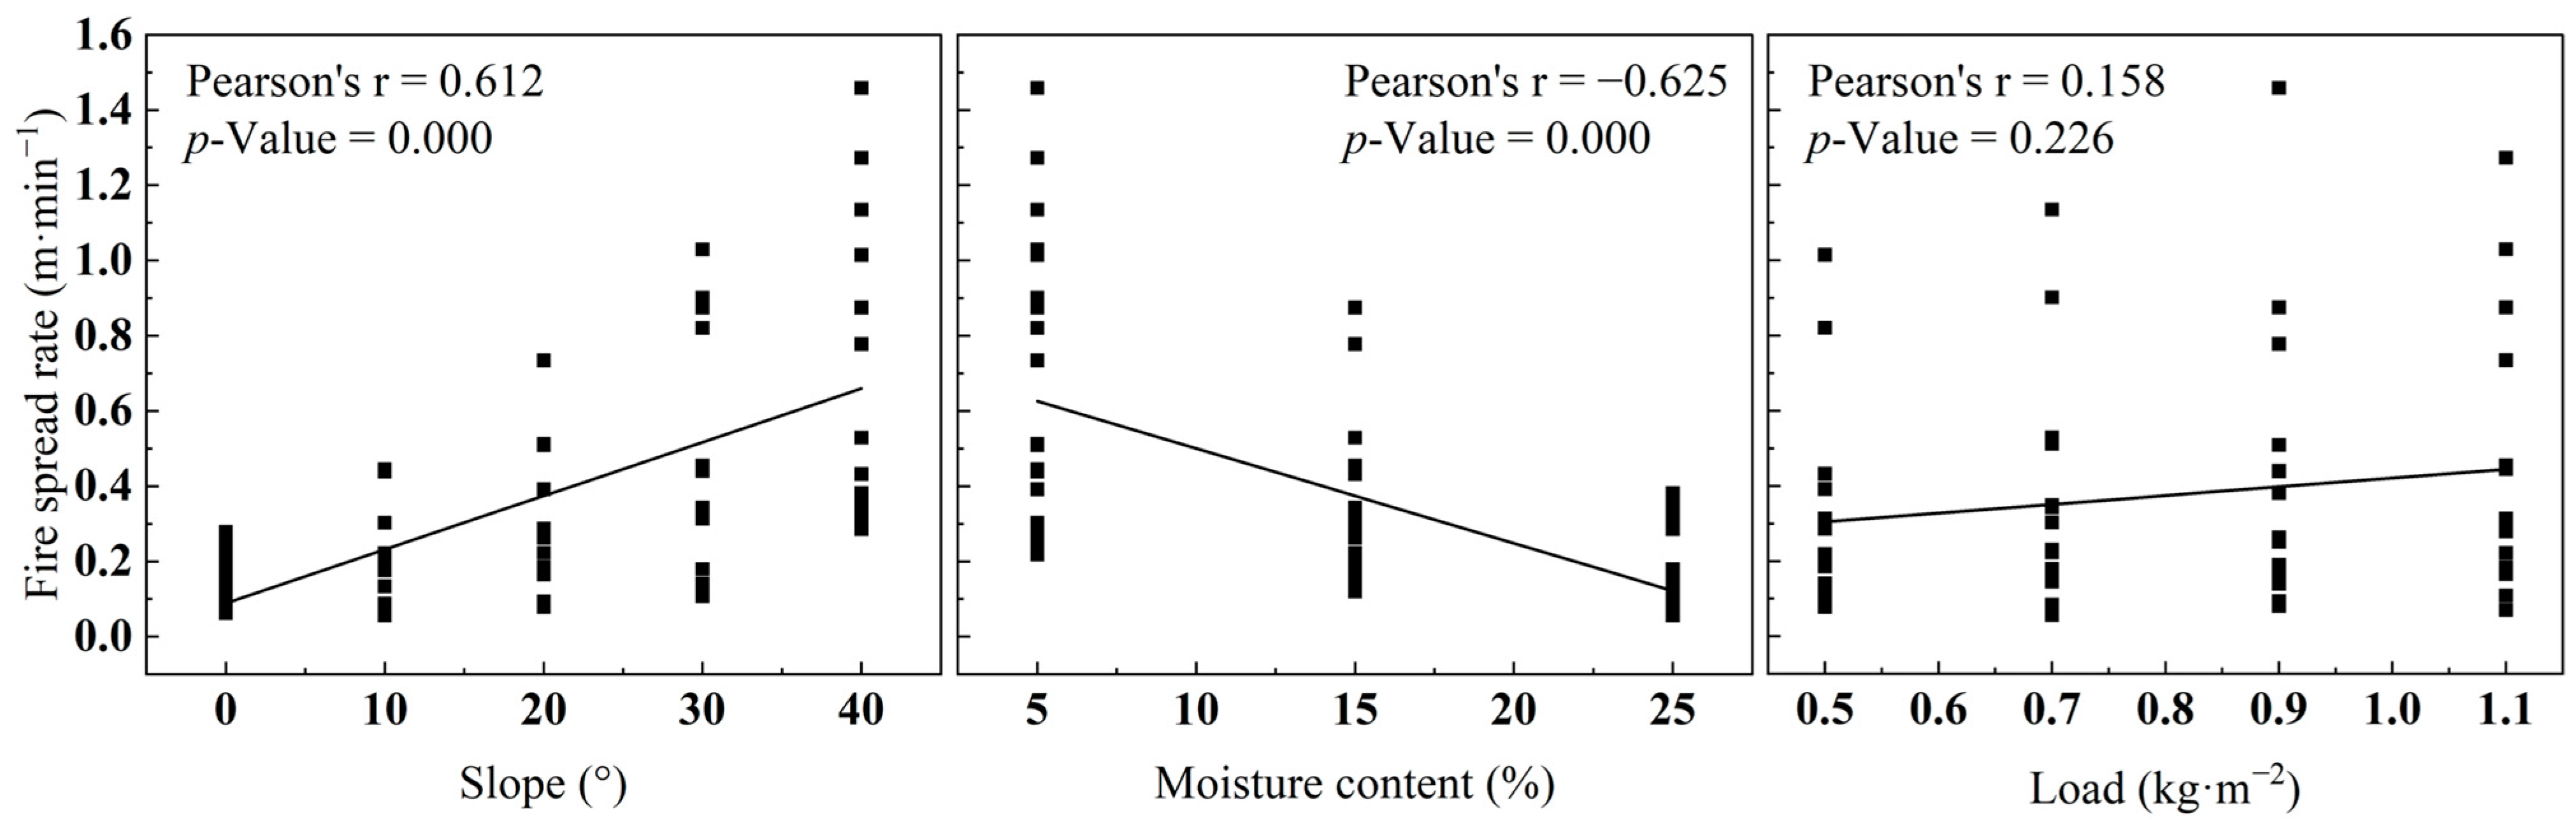
3.1. Statistics of the Fire-Spread Rate and Influencing Factors

The maximum, minimum, and mean values of the fire-spread rate in 60 indoor-simulated experiments were 1.458 m·min−1, 0.056 m·min−1, and 0.379 m·min−1, respectively. Additionally, the quartiles of data were 0.140 m·min−1, 0.251 m·min−1, and 0.445 m·min−1.
The three-factor variance analysis of the measured fire-spread rate (Table 4) indicated that the differences between the groups for all three influencing factors (slope, moisture content, and load) and between the groups for slope × moisture content were extremely significant, and the differences between the groups for slope × load and moisture content × load were significant. The F values, from the largest to smallest, were the moisture content, slope, slope × moisture content, load, moisture content × load, and slope × load. Among the three influencing factors, the difference in moisture content demonstrated the greatest impact on the measured fire-spread rate, followed by slope.
According to the correlation analysis of the influencing factors and the measured fire-spread rate (Figure 3), the measured fire-spread rate demonstrated a highly significant correlation with the slope and moisture content but was not significantly correlated with the load. Furthermore, the moisture content demonstrated a highly significant negative correlation with the measured fire-spread rate, and the Pearson correlation coefficient was −0.625. The slope exhibited a highly significant positive correlation with the measured fire-spread rate, and the Pearson correlation coefficient was 0.612.
The slope and moisture content demonstrated a greater impact on the measured fire-spread rate, and the correlation trend was substantial. The independent effect of the load on the measured fire-spread rate was small and insignificant; however, the interaction of the load with the slope and moisture content exhibited a considerable effect on the measured fire-spread rate. Therefore, the slope and moisture content can be used as influencing factors to separately establish prediction equations when establishing a fire-spread prediction model, whereas the load should be established in conjunction with at least one influencing factor. In the following text, only the two aspects of slope and moisture content were analyzed to evaluate the model’s predictive effect.

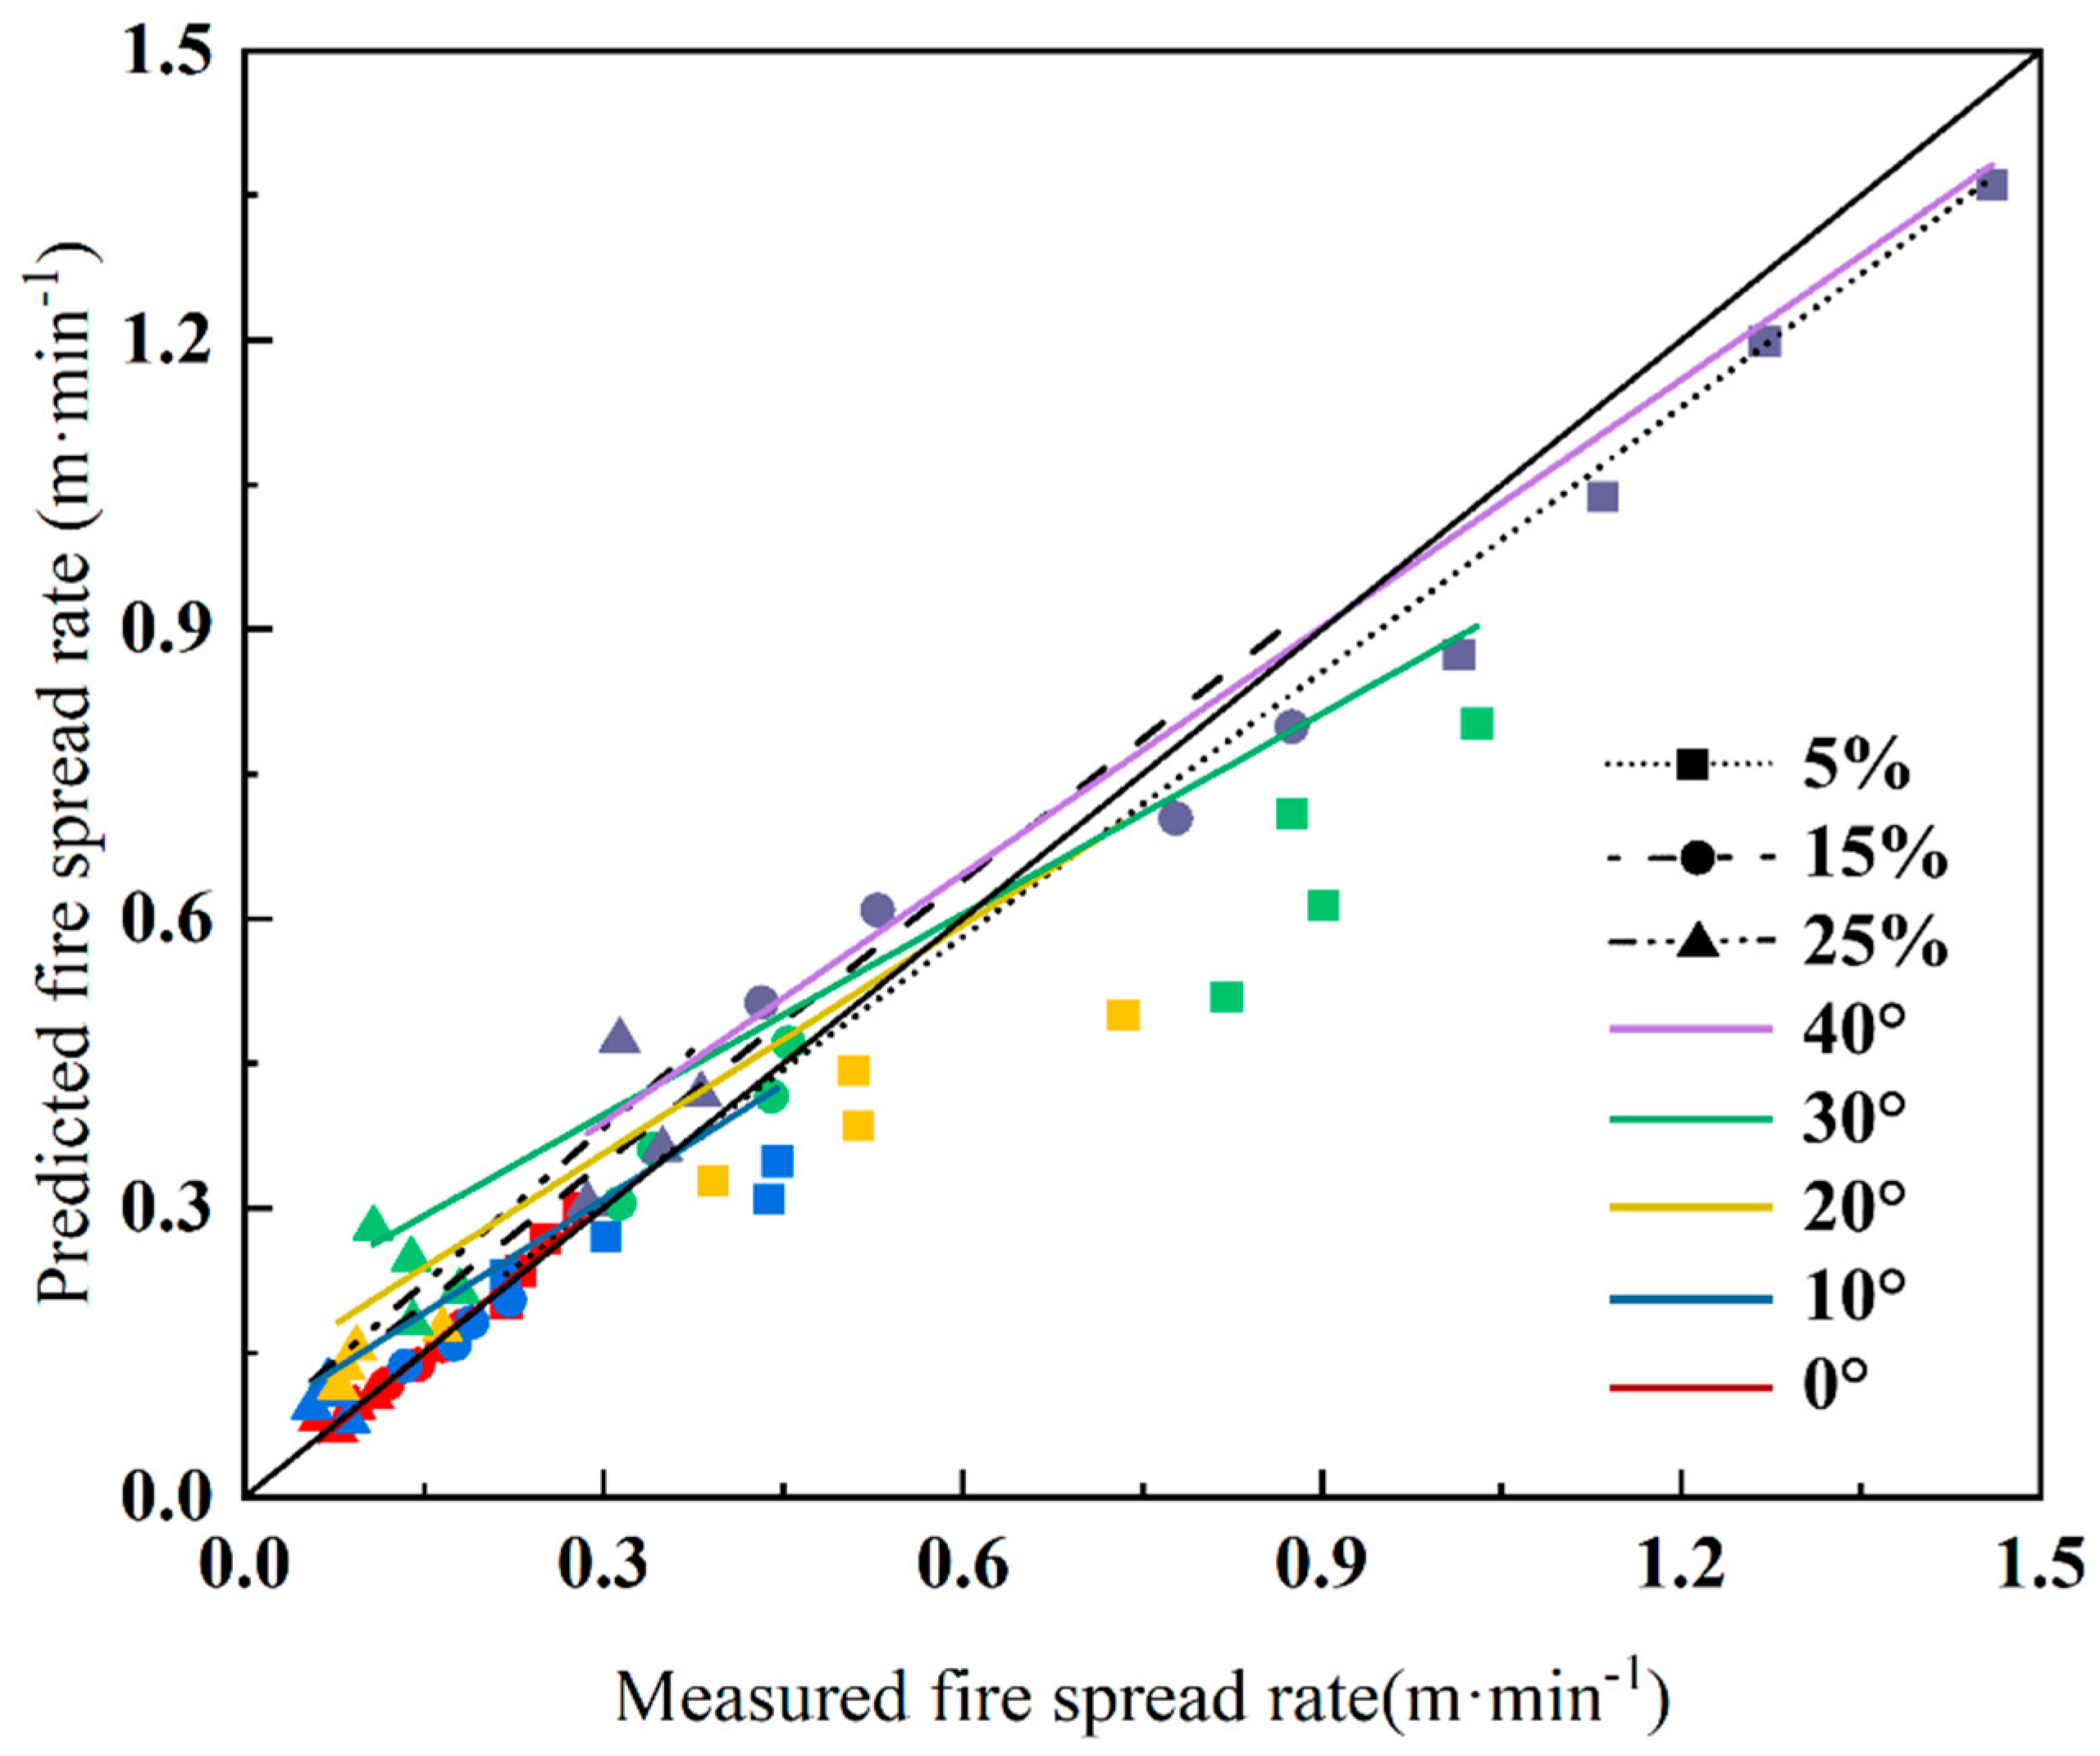
3.2. Prediction Accuracy of the Rothermel Model for Fire-Spread Rate Predictions

The original Rothermel model was used to predict the fire-spread rate of P. koraiensis on the surface (Figure 4); the predicted values were generally higher than the measured fire-spread rates. The predicted values were higher than the measured fire-spread rates with an increasing slope. Among them, the Rothermel model demonstrated a good prediction accuracy, in the range of approximately 0–20° slope, with regression coefficients ranging from approximately 0.711–0.944 and a root-mean-square error ranging from approximately 0.030 to 0.094 m·min−1. Additionally, the maximum value of the average absolute error was 0.088 m min−1, and the maximum value of the average absolute error was 29.913%. The prediction accuracy of the Rothermel model significantly decreased when the slope increased to 30° and 40°, and the root-mean-square error and average absolute error significantly increased, with the average relative error increasing by approximately 30% and 70%, respectively (Table 5). Simultaneously, R2 decreased with an increase in the slope.
The predicted values were higher than the measured fire-spread rate with a decreasing moisture content (Figure 4). However, the regression coefficients of the Rothermel model prediction ranged from approximately 2.008 to 2.185, the average absolute error ranged from approximately 0.137 to 0.315 m·min−1, and the average relative error ranged from approximately 48.261 to 92.636% under conditions of different moisture contents (Table 6).

3.3. No-Wind or Slope Conditions Priority Modified Rothermel Model

The original Rothermel model significantly overestimated the spread rate of surface fires in P. koraiensis plantations. Therefore, the model parameters required modification to fit the current environment. The modification method of priority to no-wind or slope conditions (see Section 2.2.2) was used for the Rothermel model, and the estimated parameters a 1 = −0.486, b 1 = 0.898, c 1 = 10.040, and d 1 = −0.110 in the η M and Φ S equations of the modified Rothermel model were obtained. Figure 5 illustrates the results of the prediction of the surface-fire spread rate of the P. koraiensis plantations. The prediction accuracy of the Rothermel model with priority modification to no-wind conditions under 30° and 40° slope conditions is considerably better than that of the original Rothermel model, with regression coefficients of 0.694 and 0.855, respectively. Furthermore, the root-mean-square errors were reduced by 0.129 m·min−1 and 0.692 m·min−1, and the average relative errors decreased by 32.851% and 85.430%, respectively (Table 7). Meanwhile, the average absolute error of the Rothermel model with priority modification to no-wind conditions was reduced by an overall value of 0.015 m·min−1, and the average relative error was reduced by an overall value of 6.609% under flat and low-slope conditions, with small improvements in the accuracies of both model predictions.
The Rothermel model predicted values with flatland calm conditions were preferentially modified as the moisture content decreased; however, the overall prediction accuracy improved. Furthermore, the average absolute error was reduced by 0.166 m·min−1 on average, and the average relative error was reduced by 52.124% on average. Additionally, the regression coefficient range of 0.916–1.077 was markedly better than that of the original Rothermel model (Figure 5, Table 5 and Table 8).

3.4. Slope Condition Priority Modified Rothermel Model

The a priori modification of the Rothermel model involves first modifying and establishing the slope equation and, subsequently, using all the experimental data, after excluding the influence of slope, for modifying and constructing the moisture-content equation. The estimated parameters in the η M and Φ S equations of the modified Rothermel model are a 2 = −0.873, b 2 = 1.110, c 2 = 4.668, and d 2 = 0.010. The predicted results after the modification are shown in Figure 6. The trend of overall smaller prediction values by the slope condition priority modification method was weakened compared with the flatland no-wind condition priority modification results. Under different slope conditions, the root-mean-square error of the Rothermel model with slope condition priority modification was reduced by an overall amount of 0.189 m·min−1, the average absolute error was reduced by an overall amount of 0.181 m·min−1, and the average relative error was reduced by an overall amount of 31.110% compared with the original Rothermel model, all of which are greater than those of the Rothermel model with flatland no-wind condition priority modification by 0.168 m·min−1, 0.166 m·min−1, 27.621%, respectively.
No obvious underestimation was observed for the Rothermel model with slope condition preferential modification at a low moisture content and 20° and 30° slope conditions. (Figure 6) Additionally, the root-mean-square error decreases by 0.137 m·min−1 on average, the mean absolute error decreases by 0.181 m·min−1 on average, and the mean relative error decreases by 56.750% on average, all of which are greater than those of the Rothermel model with flat windless condition preferential modification by 0.133 m·min−1, 0.166 m·min−1, and 52.124%, respectively (Table 9 and Table 10).

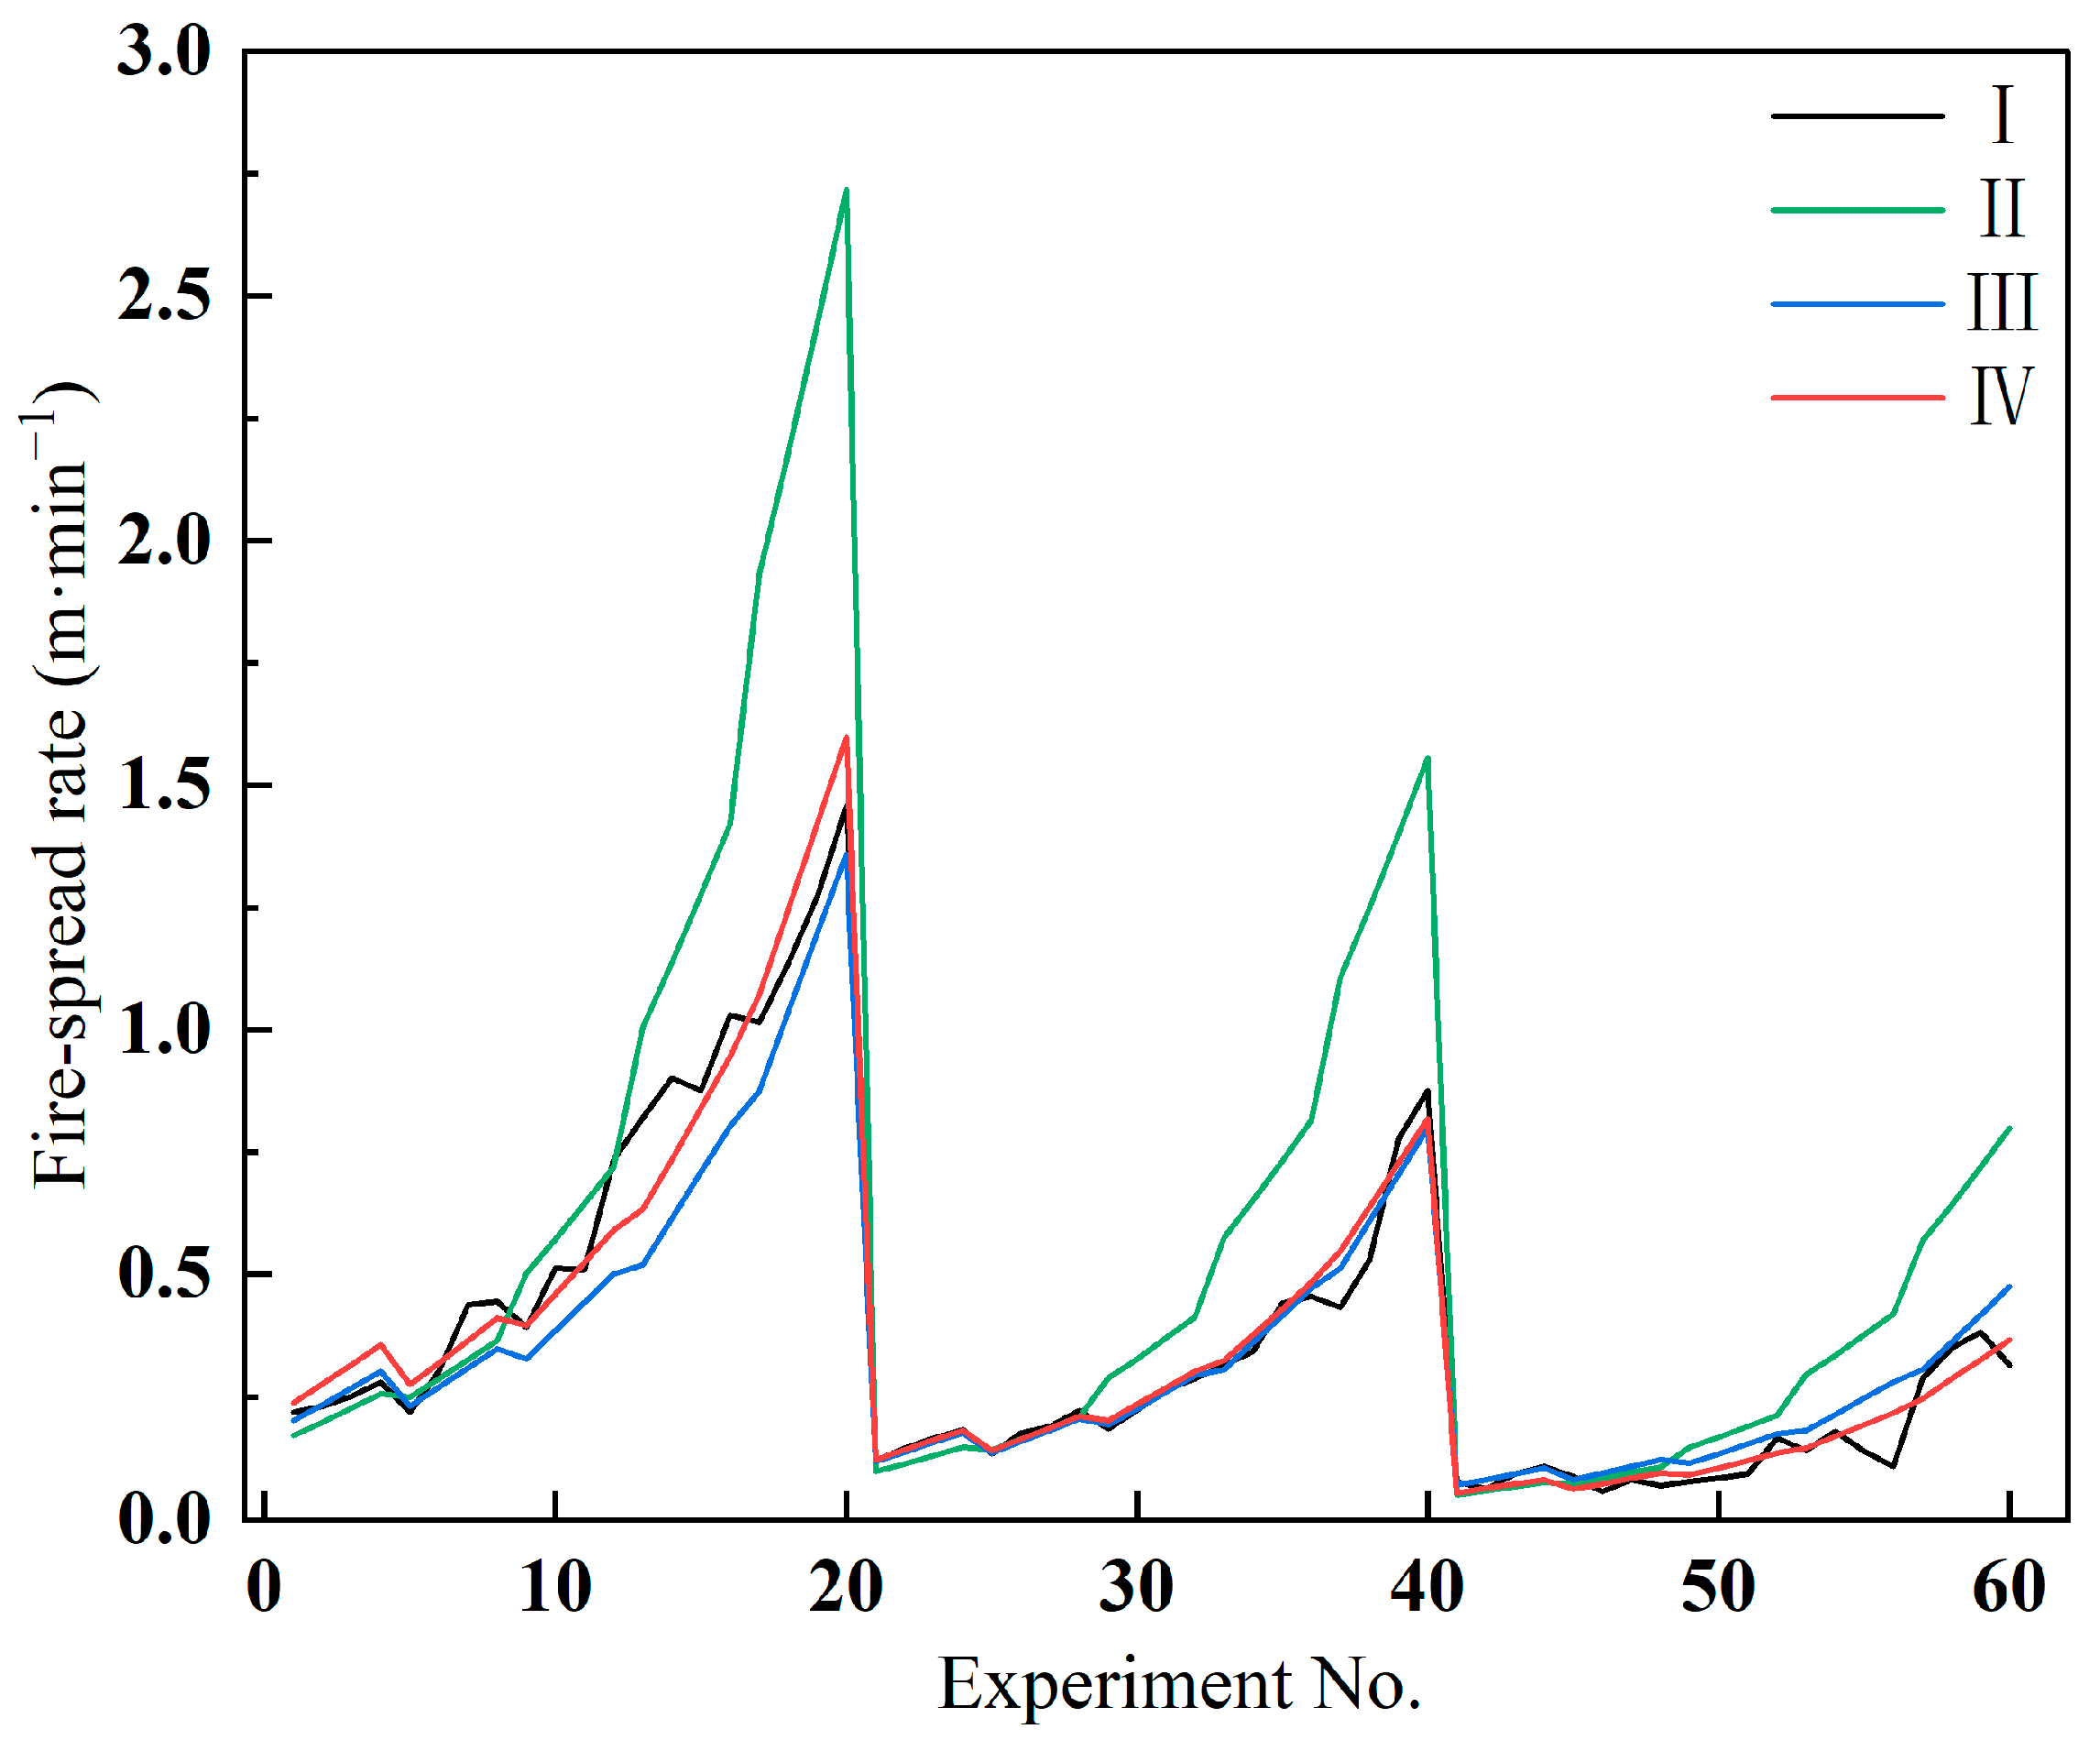
3.5. Comparing the Prediction Errors for the Three Models

A considerable overestimation of the fire-spread rate by the original Rothermel model was observed according to the comparison of the measured fire-spread rate and three model-predicted values (Figure 7). Among them, experiment nos. 1–20, 21–40, and 41–60 consisted of the 5%, 15%, and 25% moisture-content conditions, respectively. Overestimation of the original Rothermel model under low moisture content conditions is particularly evident, compared with the two modified Rothermel models that are closer to the measured values. Additionally, the other moisture-content conditions are the same. The prediction results of both modified Rothermel models were better than those under the other moisture-content conditions at 15% moisture content. This indicates that the modified Rothermel model is more suitable for medium moisture-content conditions. Furthermore, both excessively high and low moisture-content conditions lead to a decrease in the model’s prediction accuracy.
The overall prediction accuracy of the surface-fire spread rate for Pinus koraiensis plantations was in the following order: slope condition preferential modification Rothermel model > flat no-wind condition preferential modification Rothermel model > Rothermel model (Table 11). The root-mean-square error of the slope condition preferential modification Rothermel model decreased by 0.312 m·min−1, the average absolute error decreased by 0.182 m·min−1, and the average relative error decreased by 48.588% compared with the original Rothermel model, all of which were greater than those of the flatland no-wind condition preferential modification Rothermel model by 0.282 m·min−1, 0.166 m·min−1, 44.412%, respectively. This indicates that the slope condition is more effective than the flatland no-wind condition preferential modification method for improving the prediction accuracy of the modification model by incorporating the experimental data that exclude the slope’s influence.

4. Discussion

4.1. Factors Influencing the Fire-Spread Rate

Moisture content and slope were the most influential factors on the fire-spread rate in fuel characteristics and terrain characteristics, respectively. Our results reveal that the inhibition effect of high moisture content and low slope on the fire-spread rate is absolute under no-wind conditions. Contrastingly, the promotion effect of low moisture content and high slope on the fire-spread rate is relative, which is reflected in the fact that other factors are required to cooperate with it to manifest as a substantial increase in the fire-spread rate. This is consistent with the relevant research [29], which concluded that the influence of moisture content on the fire-spread rate under flatland no-wind conditions is independent of other factors (such as the compression ratio). Our study found that the moisture content exhibits a damping effect, resulting in a continuous decrease in the rate of fire spread as it increases, ultimately leading to fire extinction [30]. Contrastingly, the slope influences the fire-spread rate [29,31]. According to the results of Weise et al., an increase in slope causes an increase in the fire-spread rate; however, they did not pay attention to the promotion effect’s relativity [31]. We believe that the development process of fire spread determines the absolute nature of this retardation effect and the relativity of the promotion effect. As a continuous fire-spread process must ensure that heat generation, transmission, and absorption are not interrupted, promoting the fire-spread process must guarantee that each process manifests as a promotion. The inhibition of any one of these processes reduces the final fire-spread rate. During the process of fire spread, the efficiency of heat generation, transmission, and absorption collectively determine the heat transfer efficiency and jointly affect the rate of fire spread.
However, the effect of the load on the fire-spread rate always depends on other factors (such as the moisture content, slope, fuel-bed depth, packing ratio, etc.). Under the same conditions, the fire-spread rate increases with an increase in the load, which is consistent with the results of previous studies [32]. Zhang et al. found that the fire-spread rate increased with an increase in the load under the same moisture-content conditions. Additionally, they speculated that this positive correlation may be attributed to the ability of the fuel bed to simultaneously produce more heat for preheating the fuel ahead of the fire front, thereby accelerating the process of advancing the fire front [33]. However, when other variables are introduced, the influence of load is always covered by them [29]. This indicates that, within a certain range, compared with the slope and moisture content, the impact of load on the spread rate of a surface fire is weak. Therefore, the load is not a dominant factor to some extent unless other conditions remain unchanged, although it can promote the fire-spread rate.

4.2. Application of the Rothermel Model

The Rothermel model is a semi-physical model based on the energy conservation theorem and has a better theoretical basis and generalization potential than empirical models. It can be used to predict the fire-spread rate and understand the material changes and energy flow of the occurrence of the fire spread and process of development. However, a set of parameters of the Rothermel model cannot be universally applicable to the fire-spread process of multiple fuels, which is also a consistent view obtained in several other studies [6,22] and is inseparable from its construction process.
The Rothermel model was established based on a set of primary fire-spread experiments and several supplementary experiments. The primary fire-spread experiment used three fuel sizes for the open-field windless and open-field wind-chamber experiments, whereas sawdust was used for the slope-free wind-chamber experiment. The remaining supplementary experiments included reaction intensity [34], moisture damping [35], mineral damping, pre-ignition heat [36], effective volume density experiments [36], and a set of field experimental data established using an auxiliary wind coefficient. The corresponding variable’s regression equation was established through a series of experiments, after which, it was input into the calculation formula derived by Frandsen [15] to obtain an approximation of the fire-spread rate. The calculation process included 11 input variables in the Rothermel model, among which, 5 are easily obtained in the experiment, namely load ( w 0 ), bed thickness (δ), moisture content ( M f ), wind speed (U), and slope ( Φ S ). The remaining six variables are mostly fixed values in the application process.
The representativeness of the experiments used for the fitting parameters determines whether the model is generally applicable because the Rothermel model construction involves multiple regression equations. Simultaneously, whether the 11 input variables mentioned above can represent the average value of the predicted fire fuel characteristics will also have an impact on the prediction effect of the fire-spread rate. Our results revealed that an overestimation of the fire-spread rate of surface fuels existed in the Pinus koraiensis plantations via the Rothermel model, with this overestimation becoming more obvious with an increasing slope, which is consistent with previous studies [37,38]. However, other research results suggest the existence of an underestimation phenomenon of the predicted object by the Rothermel model [22]. This phenomenon has an inseparable relationship with the input variables and regression equations. For example, when applying the Rothermel model, Campbell-Lochrie et al. adopted reference values of the input variables provided via the model [39], whereas Pan et al. adopted data obtained from experimental determination [37,38]. Relevant studies that discuss the influence of different input variables and regression equation parameters on the prediction value of the fire-spread rate are absent; however, we believe that accurately applying the Rothermel model is crucial.

4.3. Modifications of the Rothermel Model

Limited by the experimental objects and conditions for establishing the Rothermel Model, several regression equations exist in the model, whose estimated parameters cannot fit all fuel types and environmental conditions [20,22]. Therefore, modifying the Rothermel model is crucial for improving its prediction accuracy, though this was also the original intention of establishing the Rothermel Model. The flat windless condition priority modification method mentioned in this study and the slope condition priority modification method can both improve the model’s prediction effect; however, a certain difference exists in terms of the data demand and modification effect. The modification results are only applicable to flat windless conditions compared with other studies that only used 92 groups [40], 45 groups [37], and 36 groups [20] of data for the first step of the flat windless condition priority modification method. Our proposed slope condition priority modification method has a total of 60 data groups, and the modification results can be used for 0–40° slope conditions. Simultaneously, the prediction effect of the slope condition priority modification method increased by 4% MRE compared with the flat windless condition priority modification method, and it increased by 49% MRE compared with the original Rothermel model, which is consistent with the result of a 50% MRE increase observed in previous research [20]. However, our modification results apply to 0–40° slope conditions, whereas their results are only applicable to flat conditions. Therefore, the performance of the slope condition priority modification method was better in terms of the data usage rate or modification effect.
This study achieved certain results in the exploration of predicting forest-surface fire spread; however, several limitations still need to be further discussed and explored in subsequent studies. First, this study, limited by experimental conditions, only considered three influencing factors—moisture content, slope, and load—and did not include wind and other fuel characteristics in the research, which may have had some impact on the systematicity of the conclusions [41]. Furthermore, although we had mitigated the issue of non-representative spread rates by calculating the average fire-spread rate using 12 thermocouples in one experiment, due to limited experimental resources and time, our total sample size, while meeting statistical requirements, was still relatively small. This, to some extent, increases the uncertainty of the statistical results. Thus, subsequent studies should explore other influencing factors of the fire-spread rate in a targeted way, incorporate wind and fuel characteristics into constructing the modification methodology of the Rothermel model, and increase the sample size to improve the universality of the research results.

4.4. Application of Fire-Spread Rate Prediction

In the long-term practice of forest-fire prevention and extinguishment worldwide, predicting a fire-spread rate has always been considered a crucial operation that can directly guide prescribed burning, resource allocation, and strategy formulation [42]. We measured the surface-fire spread rate under different slope gradients, moisture contents, and fuel loads, proposing a priority correction method for conditions with slopes that significantly improves the prediction accuracy of the Rothermel model. This method reduces the amount of experimentation required while ensuring a high prediction accuracy. However, it is worth mentioning that we did not distinguish between the training set and the test set when training and evaluating the model. This decision was made after comprehensively considering the small amount of data and the low complexity of the model. Certainly, this approach affects the accuracy of the model’s generalization ability evaluation, which should be emphasized in subsequent research. Both our findings and those from other studies [43] indicate that steep slopes and low moisture-content conditions are prone to rapid fire line movement. In addition, although fuel load has a weak effect on promoting the fire-spread rate within a certain range, it still serves as an essential material basis for fire spread that cannot be ignored. Therefore, practical prescribed burning and wildfire suppression efforts should avoid operating under such hazardous conditions, while seizing the opportunity to control and extinguish the fire during periods of flat ground and medium-to-high moisture content. Additionally, in fire-prone areas, it is essential to reduce fuel loads before the fire season begins, thus cutting off the material conditions for fire occurrence and achieving the goal of fire prevention.

5. Conclusions

This study thoroughly examined the impact of slope, moisture content, and load on the fire-spread rate using a fire-spread experiment in an indoor-simulated red-pine forest. Subsequently, the suitability of the original Rothermel model under varied conditions was assessed, employing two modification methods aimed at improving the original model and comparing the modification effects.
The findings revealed a positive correlation between the slope and the fire-spread rate while revealing a negative correlation with the moisture content. Additionally, the correlation with load was insignificant. A multivariate analysis of variance revealed that the slope and moisture content could independently predict the fire-spread rate, whereas the load required to interact with both had a substantial effect. We evaluated the applicability of the original Rothermel model under varied conditions and observed that it can only be applied to flat land and low-slope conditions. We adopted two modification methods and compared their effectiveness to improve the model’s prediction accuracy. Among them, the priority modification method involving flatland windless conditions could improve the prediction accuracy; however, an obvious underestimation exists under medium- and high-slope conditions. Therefore, by incorporating fire-spread data without considering the slope’s influence, we proposed a priority modification method involving slope conditions. This improved the rate of data utilization and avoided the omission of information, markedly improving the Rothermel model’s modification accuracy, with R2 = 0.964 and regression coefficient = 0.999. This method effectively enhanced the Rothermel model’s applicability to P. koraiensis forests. Thus, we will continue to promote and verify this method to develop a systematic theory for modifying the Rothermel model and apply it to constructing new models in the future.

Author Contributions

Conceptualization, Y.G., H.H. and L.S.; Methodology, Y.G. and T.H.; Software, Y.G.; Validation, Z.M.; Formal analysis, Y.G.; Investigation, M.R.; Resources, B.C.; Data curation, J.F.; Writing—original draft, Y.G.; Writing—review & editing, H.H. and L.S.; Visualization, Y.G.; Funding acquisition, H.H. and L.S. All authors have read and agreed to the published version of the manuscript.

Funding

This work was funded by the National Key Research and Development Program of China (2022YFC3003002), and the Key Research and Development Program of Heilongjiang Province (ZZDYF220100001).

Data Availability Statement

Data are contained within the article.

Conflicts of Interest

The authors declare no conflict of interest.

Appendix A

Figure A1. Illustrative diagram of linear fitting for fire-spread rate (moisture content: 5%; slope: 40; fuel load: 1.1 kg/m2). Scatter: experimental data; line: regression line.
Forests 15 01178 g0a1
Figure A2. The measured fire-spread rates under different conditions (ad) represent different load of 0.5 kg·m−2, 0.7 kg·m−2, 0.9 kg·m−2, and 1.1 kg·m−2, respectively; The gray, red, blue, green, and purple colors represent the fire-spread rates for slope conditions of 0°, 10°, 20°, 30°, and 40°, respectively.
Forests 15 01178 g0a2

References

  1. Food and Agriculture Organization of the United Nations. The State of the World’s Forests 2022: Forest Pathways for Green Recovery and Building Inclusive, Resilient, and Sustainable Economies; FAO: Rome, Italy, 2022. [Google Scholar]
  2. Ju, L. Study on Combustibility of Several Main Tree Species in Heilongjiang Provience. Master’s Thesis, Northeast Forestry University, Heilongjiang, China, 2009. [Google Scholar]
  3. Zhang, S. Study on Forest Furface Fuel in Wan Dian Zi Experimental Forest Farm of Liaoning. Master’s Thesis, Shenyang Agricultural University, Shenyang, China, 2018. [Google Scholar]
  4. Ning, J.B.; Yang, G.; Liu, X.Y.; Geng, D.T.; Wang, L.X.; Li, Z.G.; Zhang, Y.L.; Di, X.Y.; Sun, L.; Yu, H.Z. Effect of fire spread, flame characteristic, fire intensity on particulate matter 2.5 released from surface fuel combustion of Pinus koraiensis plantation—A laboratory simulation study. Environ. Int. 2022, 166, 107352. [Google Scholar] [CrossRef]
  5. Jin, S.; Chu, T.F.; Di, X.Y.; Liu, B.F.; Zhang, J.L. Influence Factors on Fire Spread Across Fuel Beds of Korean Pine Needles Under No-wind and Zero-slope Conditions and Modeling of Fire Behavior. J. Northeast For. Univ. 2012, 40, 51–57. [Google Scholar]
  6. Geng, D.T.; Ning, J.B.; Li, Z.G.; Yu, H.Z.; Di, X.Y.; Yang, G. Spread rate and parameter modification of surface fuel in Pinus koraiensis plantation based on Rothermel model. J. Beijing For. Univ. 2021, 43, 79–88. [Google Scholar]
  7. Wang, M.Y.; Li, T.; Ren, Y.M.; Shu, L.F.; Zhao, F.J.; Tian, X.R. Research Advances in Forest Fire Behavior and Special Forest Fire Behaviors. World For. Res. 2009, 22, 45–49. [Google Scholar]
  8. McArthur, A.G. Control Burning in Eucalypt Forests. Leaflet No.80. In Proceedings of the Eighth British Commonwealth Forestry Conference, Nairobi, Kenya, 25 June–28 July 1962. [Google Scholar]
  9. Zhong, Z.R.; Zhou, J.J.; Zou, Y.H.; Zhu, J.P. Study on the Model of Wildland Fire Spread. Fire Saf. Sci. 2001, 10, 83–87. [Google Scholar]
  10. Gao, Z.L.; Shu, L.F.; Wang, M.Y.; Zhao, F.J.; Zhou, Y.L. Model for predicting the forest fire preading speed based on the prescriptive combustion of Pinus yunnanensis. J. Saf. Environ. 2016, 16, 82–86. [Google Scholar]
  11. Sullivan, A.L. Wildland surface fire spread modelling, 1990–2007. 2: Empirical and quasi-empirical models. Int. J. Wildland Fire 2009, 18, 369–386. [Google Scholar] [CrossRef]
  12. Sullivan, A.L. Wildland surface fire spread modelling, 1990–2007. 1: Physical and quasi-physical models. Int. J. Wildland Fire 2009, 18, 349–368. [Google Scholar] [CrossRef]
  13. Sullivan, A.L. Wildland surface fire spread modelling, 1990–2007. 3: Simulation and mathematical analogue models. Int. J. Wildland Fire 2009, 18, 387–403. [Google Scholar] [CrossRef]
  14. Rothermel, R.C. A Mathematical Model for Predicting Fire Spread in Wildland Fuels; Research Paper INT-115; USDA Forest Service, Intermountain Forest and Range Experiment Station: Ogden, UT, USA, 1972. [Google Scholar]
  15. Frandsen, W.H. Fire spread through porous fuels from the conservation of energy. Combust. Flame 1971, 16, 9–16. [Google Scholar] [CrossRef]
  16. Finney, M.A. An Overview of FlamMap Fire Modeling Capabilities. In Proceedings of the 1st Fire Behavior and Fuels Conference, Portland, OR, USA, 28–30 May 2006. [Google Scholar]
  17. Finney, M.A. FARSITE: Fire Area Simulator-Model Development and Evaluation; Research Paper RMRS-RP-4; USDA Forest Service, Rocky Mountain Research Station: Missoula, MT, USA, 1998. [Google Scholar]
  18. Andrews, P.L. BEHAVE: Fire Behavior Prediction and Fuel Modeling System-BURN Subsystem, Part 1; Research Paper INT-194; USDA Forest Service, Intermountain Forest and Range Experiment Station: Ogden, UT, USA, 1986. [Google Scholar]
  19. Andrews, P.L.; Bevins, C.D.; Seli, R.C. BehavePlus Fire Modeling System Version 4.0 User’s Guide; General Technical Report RMRS-GTR-106WWW; USDA Forest Service, Rocky Mountain Research Station: Ogden, UT, USA, 2008. [Google Scholar]
  20. Man, Z.Y.; Sun, L.; Hu, H.H.; Zhang, Y.L. Prediction Model of the Spread Rate of Eight typical Surface Dead Fuel in Southern China under Windless and Flat Land. Sci. Silvae Sin. 2019, 55, 197–204. [Google Scholar]
  21. Jimenez, E.; Hussaini, M.Y.; Goodrick, S. Quantifying parametric uncertainty in the Rothermel model. Int. J. Wildland Fire 2008, 17, 638–649. [Google Scholar] [CrossRef]
  22. Hua, J.; Zhang, S.Y.; Gao, H.W.; Chen, X.D. Optimizing the Rothermel Model for easily predicting spread rate of forest fire. Math. Comput. For. Nat. Resour. Sci. 2020, 12, 62–71. [Google Scholar]
  23. Ren, M.L.; Guo, Y.; Chen, B.X.; Fan, J.L.; Hu, T.X.; Sun, L. Prediction models of fire spread rate of Pinus koraiensis plantation’s surface fuel. Chin. J. Appl. Ecol. 2023, 34, 2091–2100. [Google Scholar]
  24. Masinda, M.M.; Li, F.; Liu, Q.; Sun, L.; Hu, T. Prediction model of moisture content of dead fine fuel in forest plantations on Maoer Mountain, Northeast China. J. For. Res. 2021, 32, 2023–2035. [Google Scholar] [CrossRef]
  25. Li, Z.Y. The Environmental Influence Because of Japanese and Russian Occupation of the Northeast Since Modern Times —Focusing on the Investigation of Forest Resources. Acad. J. Jinyang. 2019, 3, 14–22. [Google Scholar]
  26. Zhao, F.J.; Liu, Y.Q.; Shu, L.F. Change in the fire season pattern from bimodal to unimodal under climate change: The case of Daxing’aning in Northeast China. Agric. For. Meteorol. 2020, 291, 108075. [Google Scholar] [CrossRef]
  27. Wang, W.F.; Song, L.N.; Sui, X. Estimation of Forest Biomass and lts Temporal and Spatial Distribution Patterns in Maoershan Forest Farm, Heilongjiang Province. J. Northeast For. Univ. 2010, 38, 47–49. [Google Scholar]
  28. Li, H. Effects of Fuel Bed Width on Upslope Fire Spread: Experimental and Theoretical Study. Ph.D. Thesis, University of Science and Technology of China, Hefei, China, 2020. [Google Scholar]
  29. Jin, S.; Liu, B.F.; Di, X.Y.; Chu, T.F.; Zhang, J.L. Fire behavior of Mongolian Oak leaves fuel-bed under no-wind and zero-slope conditions. I. Factors affecting fire spread rate and modeling. Chin. J. Appl. Ecol. 2012, 23, 51–59. [Google Scholar]
  30. Awad, C.; Morvan, D.; Rossi, J.; Marcelli, T.; Chatelon, F.J.; Morandini, F.; Balbi, J. Fuel moisture content threshold leading to fire extinction under marginal conditions. Fire Saf. J. 2020, 118, 103226. [Google Scholar] [CrossRef]
  31. Weise, D.R.; Koo, E.; Zhou, X.; Mahalingam, S.; Morandini, F.; Balbi, J.-H. Fire spread in chaparral—A comparison of laboratory data and model predictions in burning live fuels. Int. J. Wildland Fire 2016, 25, 980–994. [Google Scholar] [CrossRef]
  32. Campbell-Lochrie, Z.; Walker-Ravena, C.; Gallagher, M.; Skowronski, N.; Mueller, E.V.; Hadden, R.M. Effects of fuel bed structure on heat transfer mechanisms within and above porous fuel beds in quiescent flame spread scenarios. Int. J. Wildland Fire. 2023, 32, 913–926. [Google Scholar] [CrossRef]
  33. Zhang, Y.C.; Kong, L.Y.; Guo, H.W.; Gao, Y.J. Experimental study on the effects of fuel load and water content on surface fire spread over flat fuel bed. Fire Sci. Technol. 2022, 41, 261–265. [Google Scholar]
  34. Frandsen, W.H.; Rothermel, R.C. Measuring the energy-release rate of a spreading fire. Combust. Flame 1972, 19, 17–24. [Google Scholar] [CrossRef]
  35. Anderson, H.E. Heat Transfer and Fire Spread; Research Paper INT-69; USDA Forest Service, Intermountain Forest and Range Experiment Station: Ogden, UT, USA, 1969. [Google Scholar]
  36. Frandsen, W.H. Effective Heating of Fuel Ahead of Spreading Fire; Research Paper INT-140; USDA Forest Service, Intermountain Forest and Range Experiment Station: Ogden, UT, USA, 1973. [Google Scholar]
  37. Pan, D.; Zhang, H.P.; Pan, G.; Yi, L. Research on masson pine potential fire behavior in southern subtropical based on Behave Plus. J. Cent. South Univ. For. Technol. 2017, 37, 14–23. [Google Scholar]
  38. Zhang, Y.L.; Tian, L.L. Examining and Reforming the Rothermel Surface Fire Spread Model under No-Wind and Zero-Slope Conditions for the Karst Ecosystems. Forests 2023, 14, 1088. [Google Scholar] [CrossRef]
  39. Campbell-Lochrie, Z.; Gallagher, M.; Skowronski, N.; Hadden, R.M. The effect of fuel bed structure on Rothermel model performance. Int. J. Wildland Fire 2023, 33, WF23046. [Google Scholar] [CrossRef]
  40. Zhang, J.L.; Liu, B.F.; Chu, T.F.; Di, X.Y.; Jin, S. Fire behavior of ground surface fuels in Pinus koraiensis and Quercus mongolica mixed forest under no wind and zero slope condition: A prediction with extended Rothermel model. Chin. J. Appl. Ecol. 2012, 23, 1495–1502. [Google Scholar]
  41. Li, C.Y.; Jin, S.; Zhou, Y.; Zhang, J.L. A Simulation on Wind Factors of Fuelbed of Korean Pine Needles. Sci. Silvae Sin. 2014, 50, 116–124. [Google Scholar]
  42. Maffei, C.; Menenti, M. Predicting forest fires burned area and rate of spread from pre-fire multispectral satellite measurements. ISPRS J. Photogramm. Remote Sens. 2019, 158, 263–278. [Google Scholar]
  43. Masinda, M.M.; Sun, L.; Wang, G.Y.; Hu, T.X. Moisture content thresholds for ignition and rate of fire spread for various dead fuels in northeast forest ecosystems of China. J. For. Res. 2021, 32, 1147–1155. [Google Scholar] [CrossRef]
Figure 1. Schematic diagram of the sample plots location.
Forests 15 01178 g001
Figure 2. Schematic diagram of the combustion bed.
Forests 15 01178 g002
Figure 3. Correlation analysis between the influencing factors and fire-spread rate.
Forests 15 01178 g003
Figure 4. Comparing the measured fire-spread rates with the Rothermel model predictions The squares (■), circles (●), and triangles (▲) in the figure are the fire-spread rates for 5%, 15%, and 25% moisture-content conditions, respectively. The short dotted line (···), dashed line (- - -), and dotted line (-··-) are the linear regression lines for 5%, 15%, and 25% moisture-content conditions, respectively. Additionally, the red, blue, yellow, green, and purple colors are the fire-spread rates and the linear regression lines for slope conditions of 0°, 10°, 20°, 30°, and 40°, respectively.
Forests 15 01178 g004
Figure 5. Comparing the measured fire-spread rates with predictions from no-wind or slope condition priority modified Rothermel model The squares (■), circles (●), and triangles (▲) in the figure represent the fire spread rates for 5%, 15%, and 25% moisture-content conditions, respectively; the short dotted line (···), dashed line (- - -), and dotted line (-··-) are the linear regression lines for 5%, 15%, and 25% moisture-content conditions, respectively. Red, blue, yellow, green, and purple colors are the fire-spread rates and the linear regression lines for 0°, 10°, 20°, 30°, and 40° slope conditions, respectively.
Forests 15 01178 g005
Figure 6. Comparing the measured fire spread rates with the predictions from slope condition priority modified Rothermel model The squares (■), circles (●), and triangles (▲) in the figure are the fire-spread rates for 5%, 15%, and 25% moisture-content conditions, respectively. The short dotted line (···), dashed line (- - -), and dotted line (-··-) are the linear regression lines for 5%, 15%, and 25% moisture-content conditions, respectively. Red, blue, yellow, green, and purple colors are the fire-spread rates and the linear regression lines for 0°, 10°, 20°, 30°, and 40° slope conditions, respectively.
Forests 15 01178 g006
Figure 7. Comparison of the fire-spread rate predictions from the three models I: measured value; II: predicted value by the Rothermel model; III: predicted value by the Rothermel model after no-wind or slope condition priority modified; IV: predicted value by the Rothermel model after slope condition priority modified.
Forests 15 01178 g007
Table 1. Preliminary information for the sample plots.
No.Mean Height
(m)
Mean Diameter
(cm)
Canopy DensityMoisture Content
(%)
Load
(kg·m−2)
Slope
(°)
115.6 ± 1.321.6 ± 3.20.713.7 ± 0.50.6 ± 0.113 ± 2
219.4 ± 2.326.5 ± 2.40.818.6 ± 0.80.9 ± 0.126 ± 1
323.5 ± 1.722.3 ± 3.70.921.1 ± 0.61.0 ± 0.133 ± 1
Table 2. Experimental gradient design.
Fuel TypeMoisture Content
(%)
Load
(kg·m−2)
Slope
(°)
Pinus koraiensis5
15
25
0.5
0.7
0.9
1.1
0
10
20
30
40
Note: number of experiments in completely factorial design = 3 moisture contents × 4 loads × 5 slopes.
Table 3. Inputs to the Rothermel model.
SymbolicName of InputsUnitInputs Value
M f Fuel particle moisture content-Experiment
M x Moisture content of extinction-0.3 [14]
w o Ovendry fuel loadlb·ft−2Experiment
S T Fuel particle total mineral content-0.0555 [14]
S e Fuel particle effective mineral content-0.01 [14]
ρ p Ovendry particle densitylb·ft−323.4 [23]
σ Fuel particle surface-area-to-volume ratioft−13325 [23]
δ Fuel depthftExperiment
h Fuel particle low heat contentBtu·lb−15368.78 [23]
φSlope°Experiment
Table 4. Three-factor analysis of variance for the fire spread rate.
Source of VariationdfMean SquareF-Valuep-Value
Slope40.669196.0880.000 **
Moisture content21.310384.1920.000 **
Load30.05616.3370.000 **
Slope × Moisture content80.10229.7910.000 **
Slope × Load120.0072.1840.050 *
Moisture content × Load60.0113.1480.020 *
Note: * p ≤ 0.05; ** p ≤ 0.01.
Table 5. Prediction accuracy of the Rothermel model under different slope conditions.
Slope
(°)
Average Absolute Error
(MAE)
(m·min−1)
Mean Relative Error
(MRE)
(%)
Root-Mean-Square Error
(RMSE)
(m·min−1)
Regression
Coefficient
R2
00.02817.6250.0300.9440.977
100.03115.3350.0440.7110.943
200.08829.9130.0940.9260.957
300.27457.2840.2861.1100.956
400.70796.1880.7821.7350.940
Table 6. Prediction accuracy of the Rothermel model under conditions of different moisture contents.
Moisture Content
(%)
Average Absolute Error
(MAE)
(m·min−1)
Mean Relative Error
(MRE)
(%)
Root-Mean-Square Error
(RMSE)
(m·min−1)
Regression
Coefficient
R2
50.31548.2610.2732.0080.917
150.22669.9440.1132.1430.929
250.13792.6360.0372.1850.854
Table 7. Prediction accuracy of the no-wind or slope condition priority modified Rothermel model under different slope conditions.
Slope
(°)
Average Absolute Error
(MAE)
(m·min−1)
Mean Relative Error
(MRE)
(%)
Root-Mean-Square Error
(RMSE)
(m·min−1)
Regression
Coefficient
R2
00.0105.9610.0121.0390.972
100.03718.1790.0520.7880.946
200.05618.9070.0850.7880.966
300.11724.4330.1570.6940.929
400.08010.7580.0900.8550.975
Table 8. Prediction accuracy of the no-wind or slope condition priority modified Rothermel model under conditions of different moisture contents.
Moisture Content
(%)
Average Absolute Error
(MAE)
(m·min−1)
Mean Relative Error
(MRE)
(%)
Root-Mean-Square Error
(RMSE)
(m·min−1)
Regression
Coefficient
R2
50.11116.9820.0200.9160.975
150.0237.2420.0010.9770.936
250.04530.2450.0041.0770.746
Table 9. Prediction accuracy of the slope condition priority modified Rothermel model under different slope conditions.
Slope
(°)
Average Absolute Error
(MAE)
(m·min−1)
Mean Relative Error
(MRE)
(%)
Root-Mean-Square Error
(RMSE)
(m·min−1)
Regression
Coefficient
R2
00.02414.8900.0351.4180.973
100.02411.6910.0310.8660.943
200.03010.0660.0470.8200.962
300.06112.7930.0860.7950.960
400.08311.3490.0911.1150.973
Table 10. Prediction accuracy of the slope condition priority modified Rothermel model under conditions of different moisture content.
Moisture Content
(%)
Average Absolute Error
(MAE)
(m·min−1)
Mean Relative Error
(MRE)
(%)
Root-Mean-Square Error
(RMSE)
(m·min−1)
Regression
Coefficient
R2
50.07711.7830.0091.0250.942
150.0257.8500.0020.9800.960
250.03120.9590.0020.8470.829
Table 11. Prediction errors of the fire-spread rates for the three models.
ModelsAverage Absolute Error
(MAE)
(m·min−1)
Mean Relative Error
(MRE)
(%)
Root-Mean-Square Error
(RMSE)
(m·min−1)
Regression
Coefficient
R2
Rothermel model0.22660.3370.3751.7420.895
No-wind or slope condition priority modified Rothermel model0.06015.9250.0930.8150.942
Slope condition priority modified Rothermel model0.04411.7490.0630.9990.964
Disclaimer/Publisher’s Note: The statements, opinions and data contained in all publications are solely those of the individual author(s) and contributor(s) and not of MDPI and/or the editor(s). MDPI and/or the editor(s) disclaim responsibility for any injury to people or property resulting from any ideas, methods, instructions or products referred to in the content.

