Article

Analysis of Land-Use/Cover-Type Extraction Results of Tamarix Shrub Forest of China Based on Remote Sensing Technology

1
Institute of Resources and Environment Innovation, Shandong Jianzhu University, Jinan 250101, China
2
School of Municipal and Environmental Engineering, Shandong Jianzhu University, Jinan 250101, China
3
Marine Development Center of Changyi, Weifang 261300, China
4
School of Surveying and Geo-Informatics, Shandong Jianzhu University, Jinan 250101, China
*
Authors to whom correspondence should be addressed.
Forests 2024, 15(7), 1179; https://doi.org/10.3390/f15071179
Submission received: 25 June 2024 / Revised: 30 June 2024 / Accepted: 2 July 2024 / Published: 6 July 2024
(This article belongs to the Section Forest Inventory, Modeling and Remote Sensing)

Abstract

:
The endmember spectrum method can improve image classification quality based on the spectral features of pure pixels in remote sensing images. The CART (Classification and Regression Tree) is a powerful machine learning algorithm that can also be used for remote sensing image classification. In this study, the Tamarix chinensis forest in the Changyi National Marine Ecological Special Reserve in Shandong Province was taken as the research object, and the endmember spectrum method and the CART decision tree method were used to compare and analyze the results of land-use/cover-type classification extraction. In the extraction process, the land use/cover types of the Tamarix forest in the study area were first divided into forested land types such as high-density forest land, medium-density forest land, and low-density forest land, as well as non-forested land types such as water bodies, roads, dams, buildings, and bare soil. Through analysis, the following conclusions could be drawn: while the overall forest cover of the Tamarix forest is high, there is still some room for further afforestation and ecological restoration in the protection area; from the results of land-use/cover extraction results based on the endmember spectrum method in the study area, it can be seen that this method has better results when extracting well-grown forested land, such as high-density Tamarix chinensis forests and medium-density Tamarix chinensis forests, and poorer results when extracting non-forested land, such as low-density tamarisk forests, roads, buildings, dams, and water bodies; from the results of land use/cover extraction based on a CART decision tree in the study area, it can be seen that this method is more effective when extracting non-forested land, such as roads, buildings, dams, and water bodies, but less effective when extracting forested land, such as high-density Tamarix chinensis forests, medium-density Tamarix chinensis forests, and low-density Tamarix chinensis forests. The relevant research results and conclusions of this study can provide some reference for the classification and extraction of large-scale shrub forest cover types based on remote sensing images.

1. Introduction

Distinct from the extraction and classification of land use/cover and utilization types in urban areas, river basins, and other research regions, the differences in image texture, spectral, and other information in remote sensing images of various shrub forest are not obvious [1]. After entering the late 20th century, China has embarked on research in the field of land cover classification [2]. Previous studies have shown that for research areas with small differences in texture information, supervised classification (minimum distance method, maximum likelihood method, support vector machine, and spectral angle mapping method), unsupervised classification (ISODATA and K-Means), object-oriented classification, and other remote sensing image classification methods have unsatisfactory results in extracting land cover types [3,4]. In light of the aforementioned challenges encountered in shrubland remote sensing image classification, where the differences in image texture and spectral information are not apparent, resulting in unsatisfactory outcomes from traditional remote sensing image classification methods, it is of paramount importance to seek a classification approach that can accurately identify land cover types while demonstrating a low sensitivity to image texture variations.
The endmember spectrum method mainly obtains various qualitative and quantitative information of different land cover types from spectral absorption feature parameters such as the wavelength position, depth, width, slope, and symmetry of land cover objects and then performs the classification and extraction of forest stands and geology. Based on the above characteristics, endmember spectrum method can make the remote sensing image classification of shrubbery more accurate and can also make the remote sensing quantification more in depth [5,6]. The CART decision tree method can build structurally intuitive classification principles based on multi-source data, making classification results easier to interpret [7,8]. In addition, unlike most classification methods that only focus on discrete values or continuous values, the CART decision tree method can handle both discrete values and continuous values. In addition to the aforementioned classification methods, there exist numerous other approaches such as random forest and neural networks. However, in comparison, the CART decision tree method possesses a simpler structure, which is more intuitive and easier to understand. Furthermore, the endmember spectrum method, which relies on the spectral characteristics of ground objects for classification and has a clear physical basis, resulting in more reliable classification outcomes [9].
In order to further compare the extraction results of land cover types in shrubbery using the endmember spectrum method and CART decision tree method, taking the Tamarix forest in the Changyi National Marine Ecological Special Reserve of Shandong Province as the research object, the extraction results using these two methods were compared and analyzed in this study. The results of this study can provide reference for the extraction of shrubbery cover types using the above two methods and can provide some scientific references for the management, protection, transformation, and operation of forested land in protected areas. The technical roadmap of this study is shown in Figure 1.

2. Overview and Data Sources of the Study Area

Shandong Changyi National Marine Ecological Special Reserve (hereinafter referred to as the protected area) is the only national marine ecological special reserve with Tamarix as the main protection object approved by the State Oceanic Administration of China in October 2007 [10]. Tamarix vegetation in the reserve is a typical recretohalophyte. A Tamarix forest planted in the coastal saline–alkali soil not only has ecological and environmental functions such as climate and water regulation, water purification, biodiversity conservation, windbreak, and sand fixation/embankment protection but has an effective method to improve saline soil using biological means [11]. The total area of the protected area is 2929 hm2, of which about 1550 hm2 of the Tamarix forest is the study area (see Figure 2 for the location). At present, various organisms in the Tamarix forest are interdependent, and the population density and community structure can be in a stable state for a long time.
When imaging remote sensing images, it is necessary to meet the conditions of clear growth characteristics of the tamarisk vegetation in the protected area, obvious land features, and zero cloud coverage in the study area during satellite imaging [12]. Therefore, the remote sensing image used in this research was the Sentinel 2A remote sensing image captured on 9 September 2019.

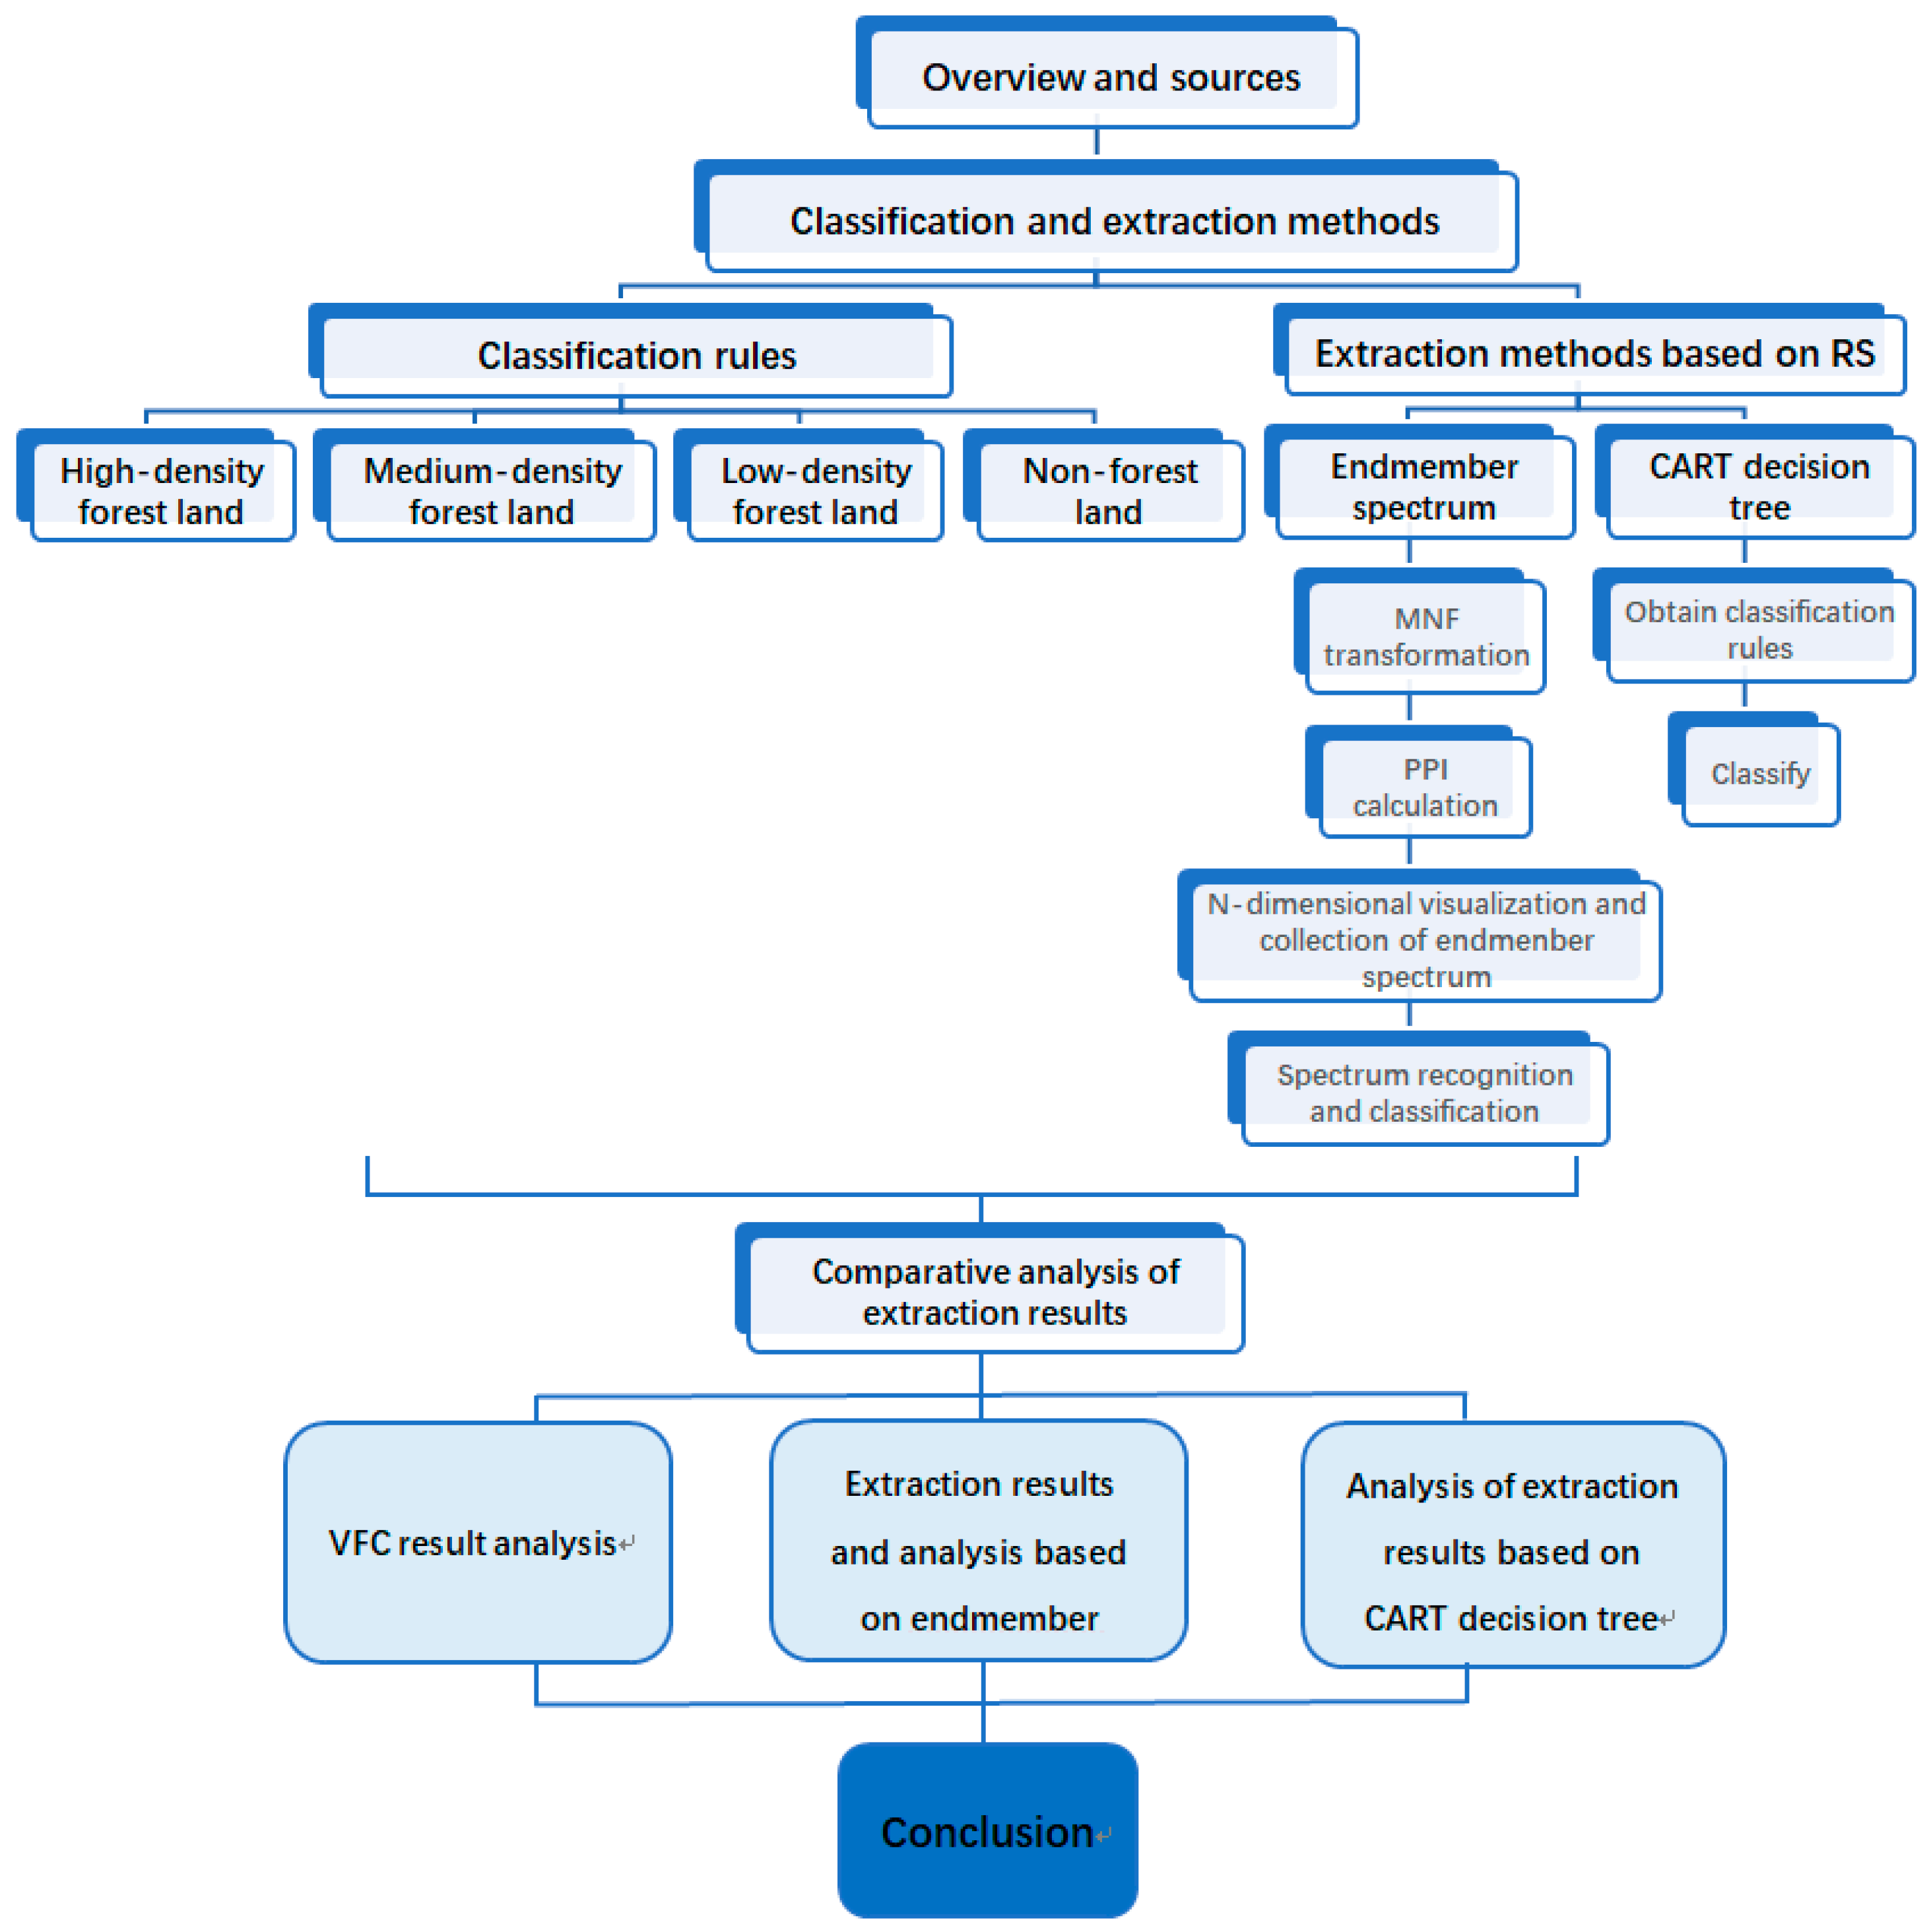
3. Classification and Extraction Methods

3.1. Classification of Land Use/Cover Types in the Study Area

In order to determine the land use/cover types of the Tamarix forest in the protected area while referring to the Technical regulations for inventory for forest management planning and design (GB/T 26424-2010) [13] issued by the State Forestry Administration and according to the actual situation of the Tamarix forest stand structure in the study area, the land use/cover types of Tamarix forest in the study area were divided into forested land types, such as high-density forest land, medium-density forest land, and low-density forests, as well as non-forest land types, such as water bodies, roads/buildings/dams, and bare soil [14].
The division of high-density forest land, medium-density forest land, low-density forest land, and non-forest land in the protected area was based on the value of VFC (VFC—Vegetation Fractional Coverage) [15]. The specific principles are as follows: VFC < 0.2 indicates that the land use/cover is non-forest land, which includes water bodies, bare land, roads, dams, moisture-proof dams, and other land use/cover types; VFC ≥ 0.2 indicates that the land use/cover is forest land, whereas VFC between 0.2 and 0.4 indicates that the land use/cover type is low-density Tamarix forest land, VFC between 0.4 and 0.7 indicates that the land use/cover type is medium-density Tamarix forest land, and VFC > 0.7 indicates that the land use/cover type is high-density Tamarix forest land. In this study, the VFC was calculated using the dimidiate pixel model [16].

3.2. Endmember Spectrum Method

The determination and acquisition of the endmember spectrum can be categorized into three types. The first method is obtained by using a spectroradiometer on-site, the second method is obtained from the standard spectrum library, and the third method is obtained from the higher-resolution remote sensing images [17]. Combined with the actual research objectives, the third method was adopted in this study.

3.2.1. MNF Transformation

The main purpose of Minimum Noise Fraction (MNF) transformation is to remove the correlation between bands, separate the noise in the data, and determine the inherent dimensions of the images [18]. As can be seen from the results of MNF transformation in Figure 3, there are 12 bands of source data before MNF transformation, and the first 4 bands after statistical transformation contain more than 89% of the information of source data. Therefore, the subsequent PPI (Pixel Purity Index) calculation and N-dimensional visualization analysis can be based on the calculations of the first four bands.

3.2.2. PPI Calculation

Based on the results of the first four bands generated in the previous step, the PPI in this study was calculated by setting the number of iterations and threshold [19]. According to debugging, the number of iterations and threshold of this study were set to 10,000 and 2.5, respectively. The PPI result is shown in Figure 4, with the larger PPI value indicating the purer pixel [20].

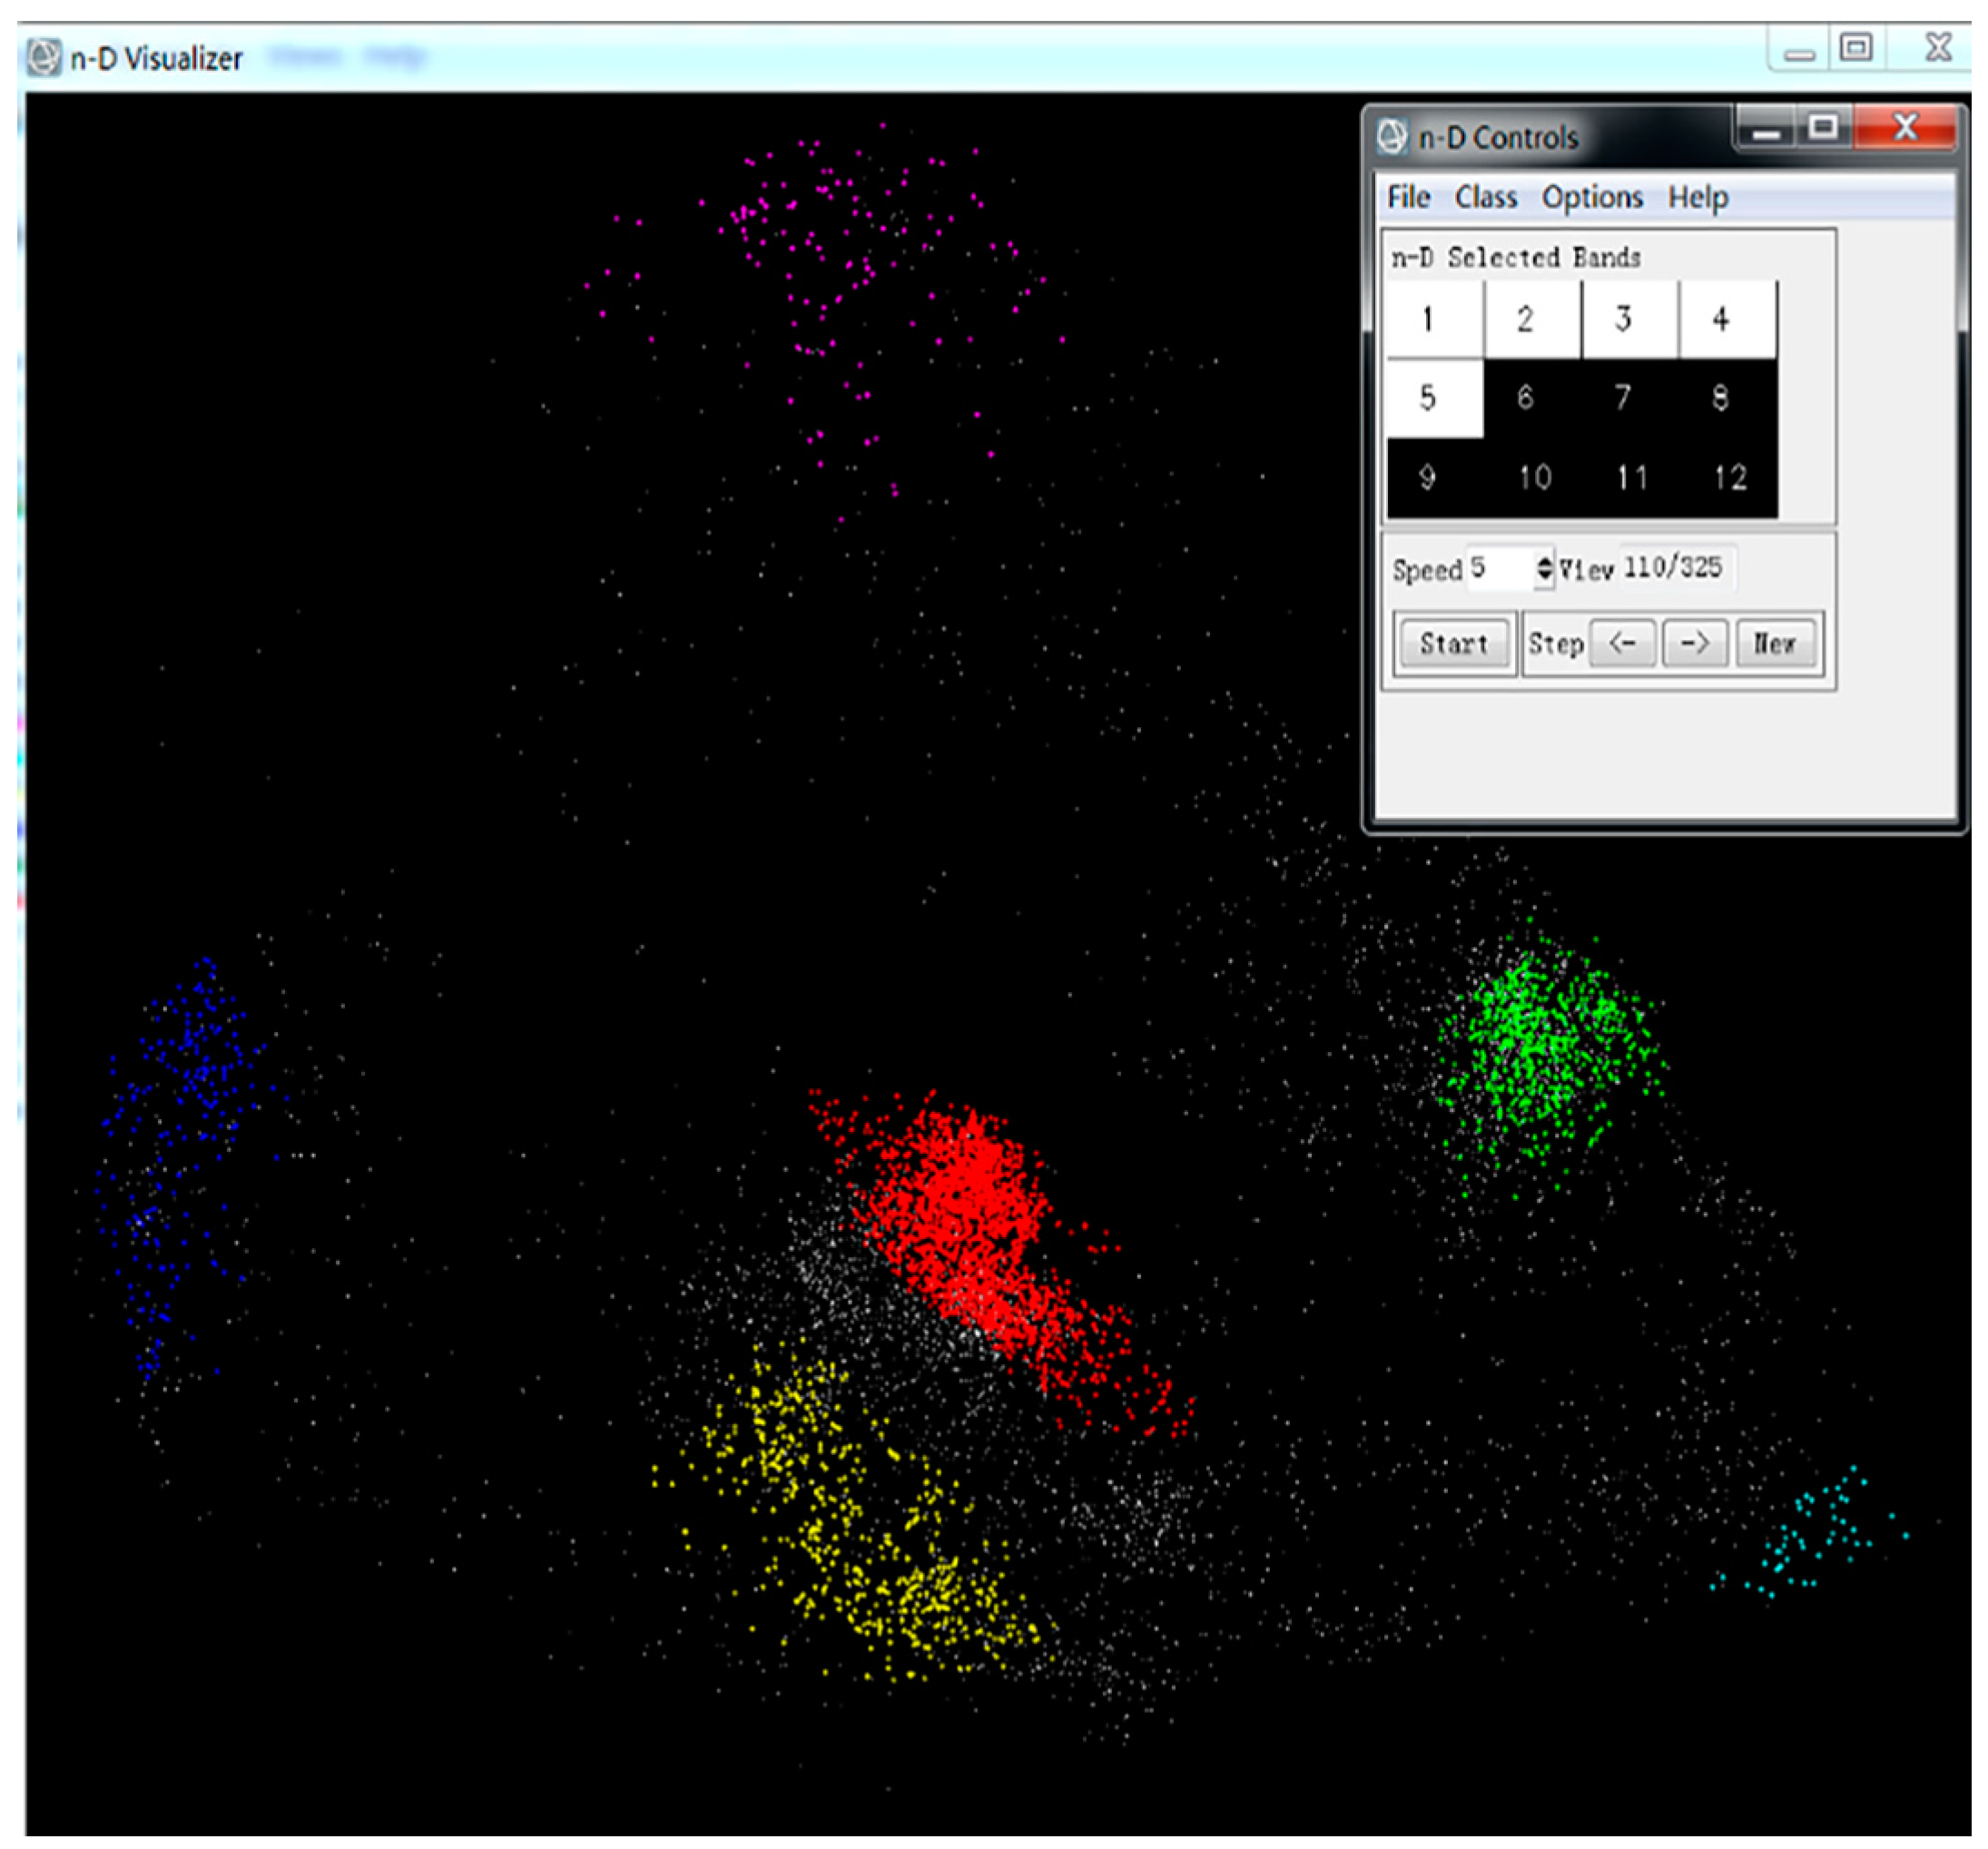
3.2.3. N-Dimensional Visualization and Collection of Endmember Spectrum

The region of interest was established by setting the threshold of the PPI (the minimum threshold was set to 2, and the maximum was 5012 after repeated debugging), and then, N-dimensional visualization was performed. The average ground spectrum was generated by the selected sample pixels, and the endmember spectrum was saved to the spectrum library [21]. Finally, the N-dimensional visualization results of the MNF transformed images of the reserve are shown in Figure 5.

3.2.4. Spectrum Recognition and Classification

The usual spectrum recognition refers to the comparison and analysis between the collected spectrum and the spectrum in the standard spectrum library, and the one with the highest similarity value is regarded as the corresponding ground object [22]. Since the spectrum of Tamarix forests in the reserve has not been collected in the existing standard spectrum database, the spectrum recognition and classification in this study are based on the spectral characteristics of various endmembers in the field collection in the reserve and the corresponding endmember coverage types and are combined with the spectral characteristics of the target pixels to comprehensively determine the coverage types represented by the spectrum of the target pixels. The classification results of this study based on endmember spectrum are shown in Figure 6.

3.3. CART Decision Tree

The CART decision tree classification method in this study is based on the remote sensing image data and other types of spatial data (world map data, data from 91 maps, and field research data), and it is a method to obtain classification rules and carry out land use/cover classification of remote sensing images through expert experience [23]. The classification rules and process of the CART decision tree are intuitive and consistent with the human cognitive process, and its best feature is that it can utilize multi-source data. The key to CART decision tree classification is to obtain classification rules, in which the CART decision tree based on the Gini Index is intuitive and does not have strict regulations on the distribution of data [24]. Therefore, our study used this algorithm to obtain the rules and then classified the land use/cover types of protected areas.
The multiple data sources of this study include NDVI (the Normalized Difference Vegetation Index) data and the result data of unsupervised classification in the study area, and then based on the actual situation, six types of ROIs were established, including high-density Tamarix forest, medium-density Tamarix forest, low-density Tamarix forest, bare soil, water body, road, and building (validated separation of all types of ROIs > 1.8). Finally, the CART decision tree was generated (see Figure 7). The land use/cover classification of the study area was carried out by executing the decision tree and post-classification processing. The final classification results are shown in Figure 8.
In order to differentiate between the endmember spectrum method and CART decision tree method, the advantages and disadvantages of each of the methods have been described and analyzed in Table 1.

4. Comparative Analysis of Extraction Results

4.1. VFC Results Analysis

The statistics and distribution results of the VFC in the study area are shown in Table 2 and Figure 9, respectively. The analysis of Figure 9 shows that the VFC value in the central area of the study area is significantly higher than that in the surrounding area, with the value higher than 0.7 in most areas and 0.8 in localized areas; this indicates that the Tamarix forests in the central region of the study area are lush and dense, representing high-density Tamarix forests. The VFC values in most of the southern part of the study area were in the range of 0.4–0.6, but in some areas near the southern boundary of the research area, the VFC values were lower than 0.3, or even lower than 0.2. Through an investigation, it was found that the main reason for this phenomenon was that the southern part of the study area was close to villages and agricultural land areas and was susceptible to certain human activities.
The VFC values in the eastern part of the study area were in the range of 0.1 to 0.5, with a spatial cross-distribution of forest land and non-forest land, among which the northeast area was mostly non-forest land, and the southeast area was mostly forest land. The research found that the main reason for this distribution was that according to the Overall Plan of Changyi National Marine Ecological Special Protection Area in Shandong Province (2016–2025), the planned land type in the eastern region was a development and utilization zone, but later, a certain scale of ecological restoration projects was carried out, resulting in a situation of cross-distribution between forested and non-forest areas.
The VFC values in the northern part of the study area were relatively low, being lower than 0.3 in the most areas. The main reason for the current situation was that this area was a development and utilization zone for bromine resources. In response to this situation, the local government had implemented a large-scale ecological restoration project.
In the western part of the study area, the forest land and the non-forest land were distributed in a scattered form, and the overall fragmentation degree was high. The main reason for this situation was that the eastern region was adjacent to river dams, and the original basic ecological environment was poor. In view of this situation, a certain amount of ecological environment improvement measures have been carried out in local areas.
A further analysis of the VFC results statistics in Table 2 shows that the study area (the VFC boundary values between medium-density and high-density Tamarix forests) accounts for 69.74% of the total area of Tamarix forest in the study area, and the area with a VFC less than 0.4 accounts for 30.26% of the total area of Tamarix forest in the study area. These results indicates that while the overall forest coverage rate of Tamarix forest is relatively high, despite the fact that there exists a small portion of localized areas of such as dykes, roads, and buildings in the non-forest land that are difficult to change their land use/cover attributes, there is still some space for further afforestation and ecological restoration within the protected area (Figure 2 and Figure 9).

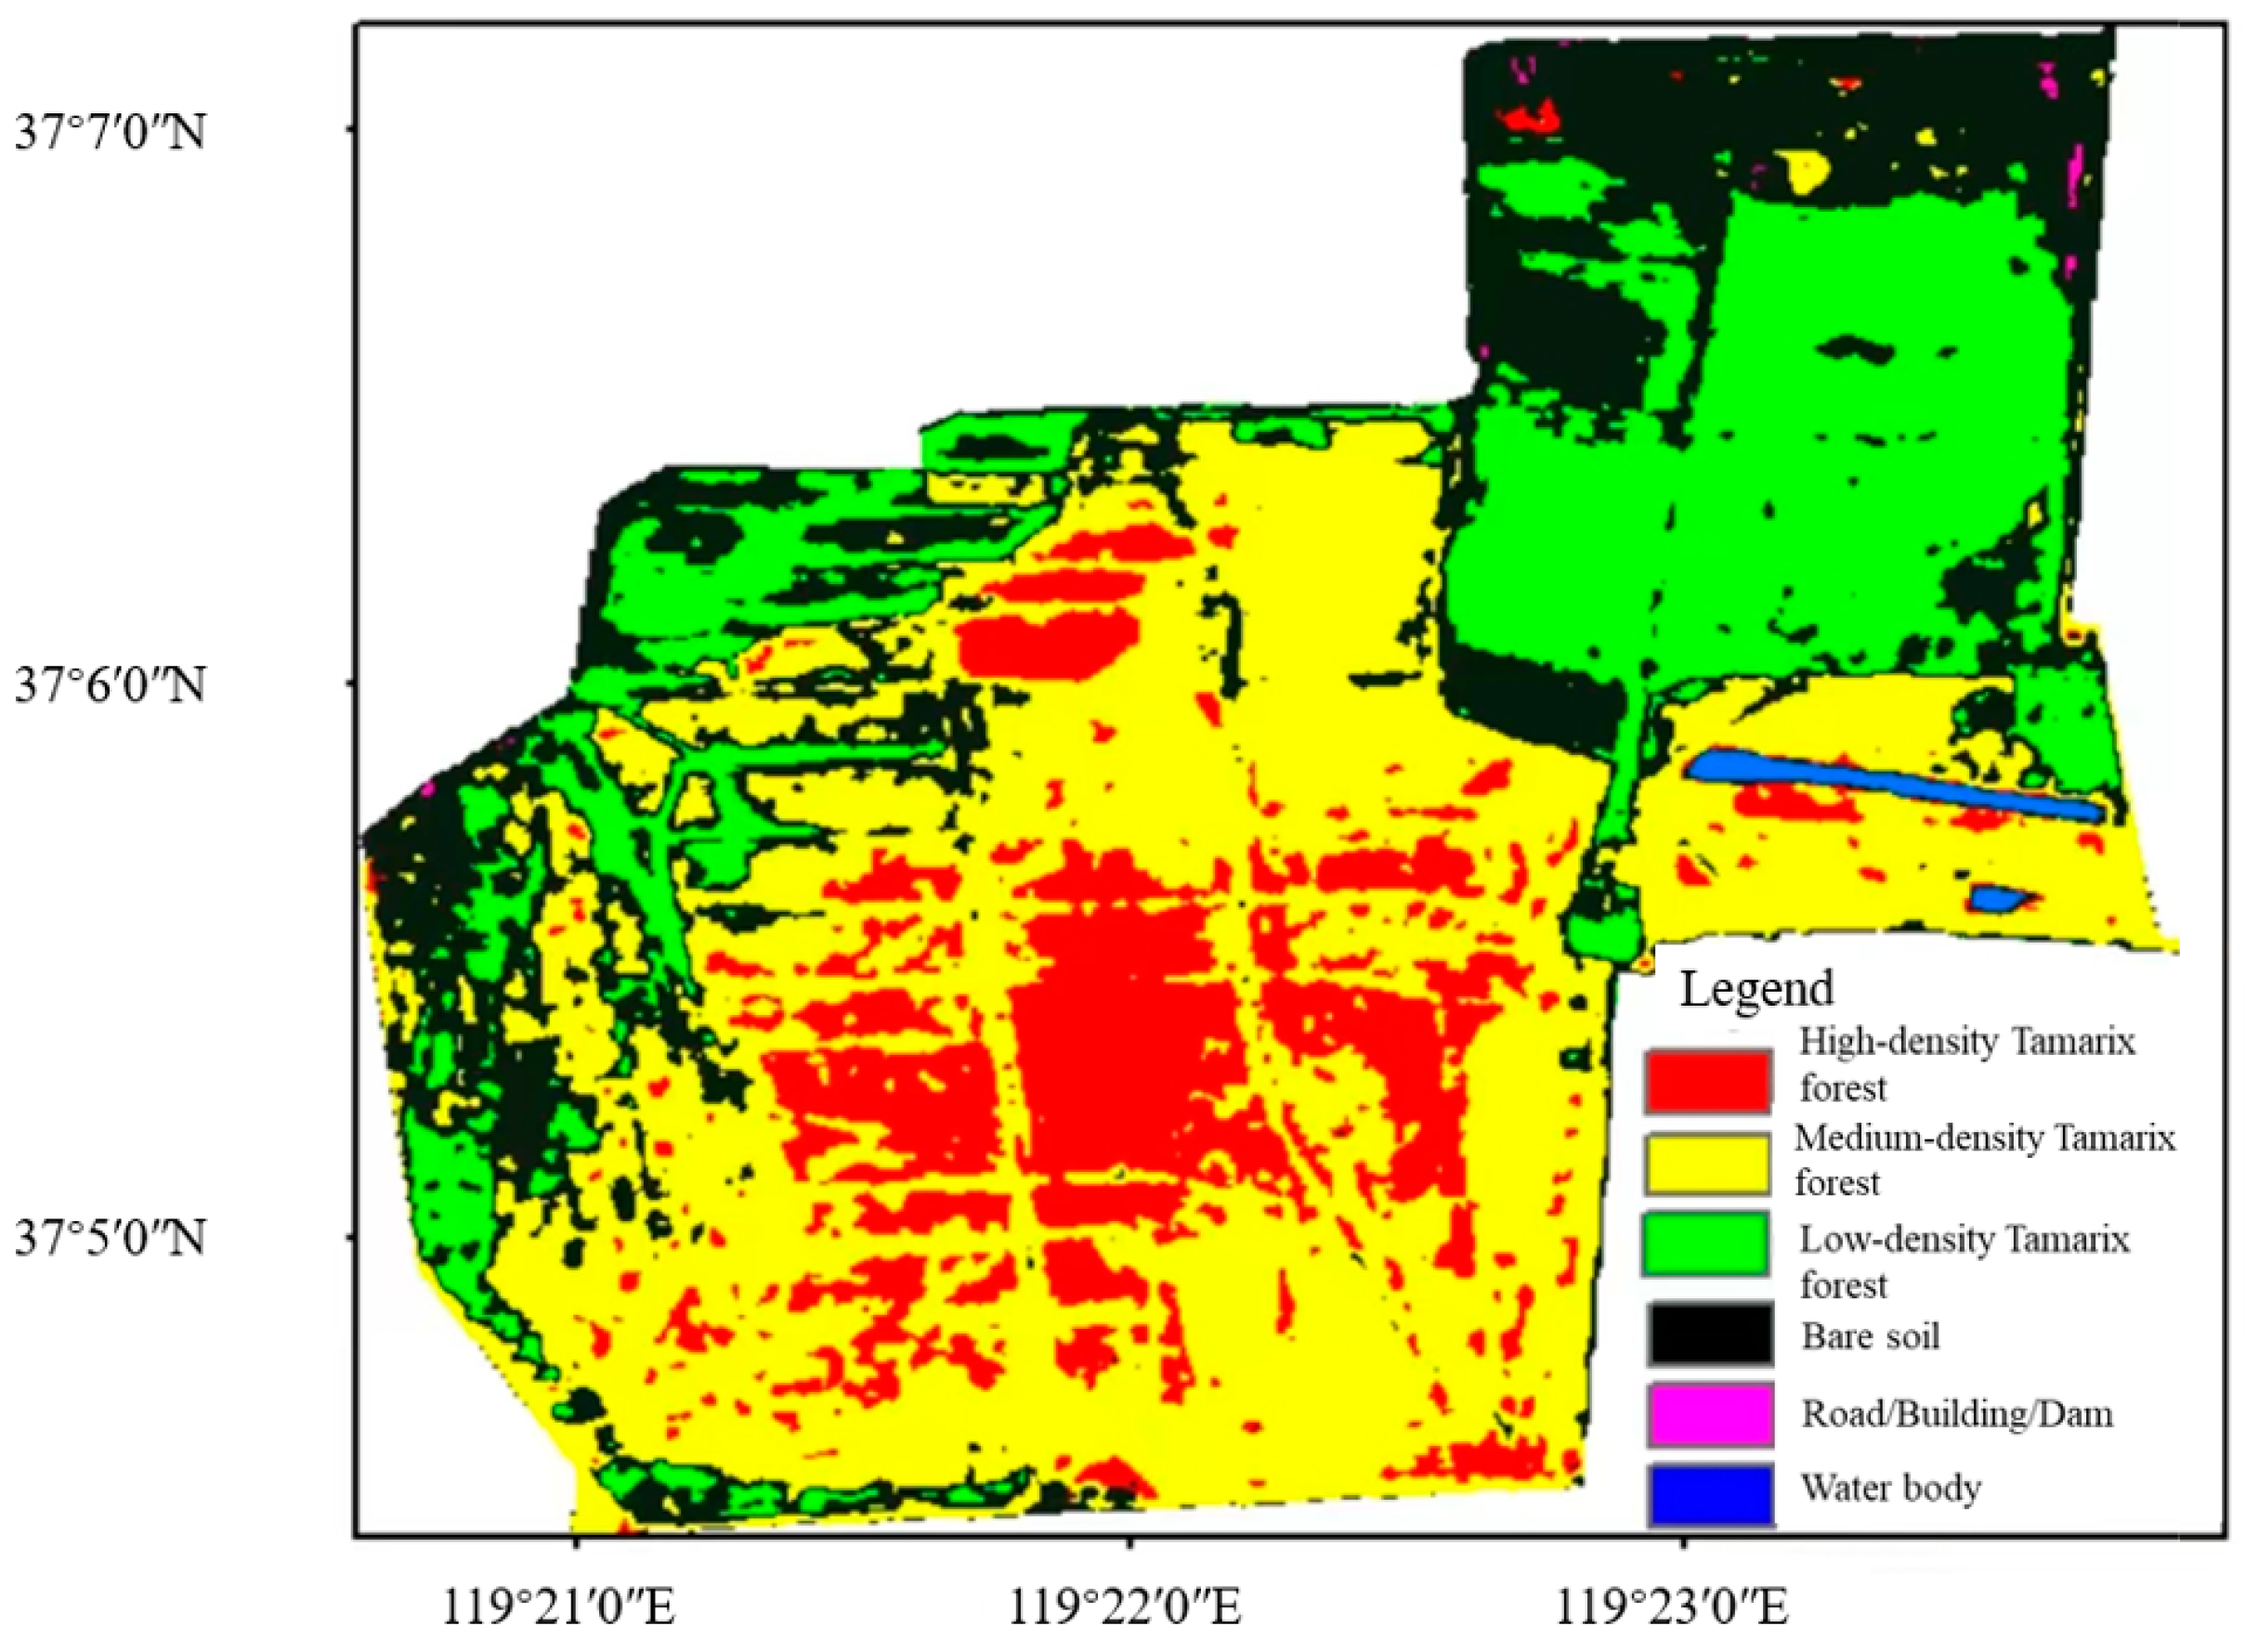
4.2. Extraction Results and Analysis of Land Use/Cover in the Study Area Based on Endmember Spectrum Method

A comprehensive analysis of the VFC distribution results in Figure 9 and the results of land use/cover extraction in the study area based on the endmember spectrum method in Figure 6 show that the overall results of this method in extracting high-density and medium-density Tamarix forests are relatively accurate, with only a small range of phenomena of omissions and erroneous extraction. This method has a certain degree of the phenomenon of mis-extraction when extracting low-density tamarisk forests and non-forest land, which is mainly manifested in the fact that part of the area covered with non-forest land with a VFC < 0.2 is mistakenly extracted as low-density tamarisk forests. This situation was particularly obvious in the northeastern and marginal areas of the study area, which resulted in an extraction of low-density Tamarix forests that was higher than the actual coverage of the low-density forest in the protected area. The main reason for this result being analyzed in this study was the spectral similarity between Suaeda salsa and low-density Tamarix [29].
In addition, most of the roads, buildings, and water bodies in the study area were mistakenly extracted or omitted, resulting in unsatisfactory extraction results. For example, the roads were mistakenly extracted as the medium-density Tamarix forest. The main reason for this result being analyzed in this study is that the spatial resolution of the processed Sentinel 2A image was 10 m, resulting in the mixed pixels being mistakenly extracted as a medium-density Tamarix forest [30].
Furthermore, techniques such as random forest, object-oriented support vector machine, and neural network have garnered significant attention in research on the extraction of forest land use/cover types. In recent years, numerous scholars have continuously explored and studied the accuracies of various methods in extracting forest information. Among them, some scholars compared random forest, neural network, and support vector machine to determine which method achieves the highest overall accuracy in mangrove population classification. The results indicated that the overall accuracy of random forest classification reached 73%, outperforming neural network and support vector machine in terms of classification accuracy [31]. Additionally, researchers have developed a remote sensing information extraction and fine classification model for mangrove forests. Initially, mangrove vegetation information was extracted using an object-oriented threshold classification method, followed by the classification of mangroves using pixel-based nearest neighbor, Bayesian, and random forest methods. The results revealed that the pixel-based random forest method achieved better classification performance for mangrove species-level classification, surpassing the nearest neighbor and Bayesian methods [32]. It is evident that each classification method has its own advantages and disadvantages. This study utilizes endmember spectral analysis and the CART decision tree method to extract Tamarix forest land information, not only aiming to compare which method achieves higher accuracy in this particular research area, but also to conduct a comparative analysis of these two less frequently compared classification methods to precisely evaluate their respective strengths, weaknesses, and extraction accuracy.

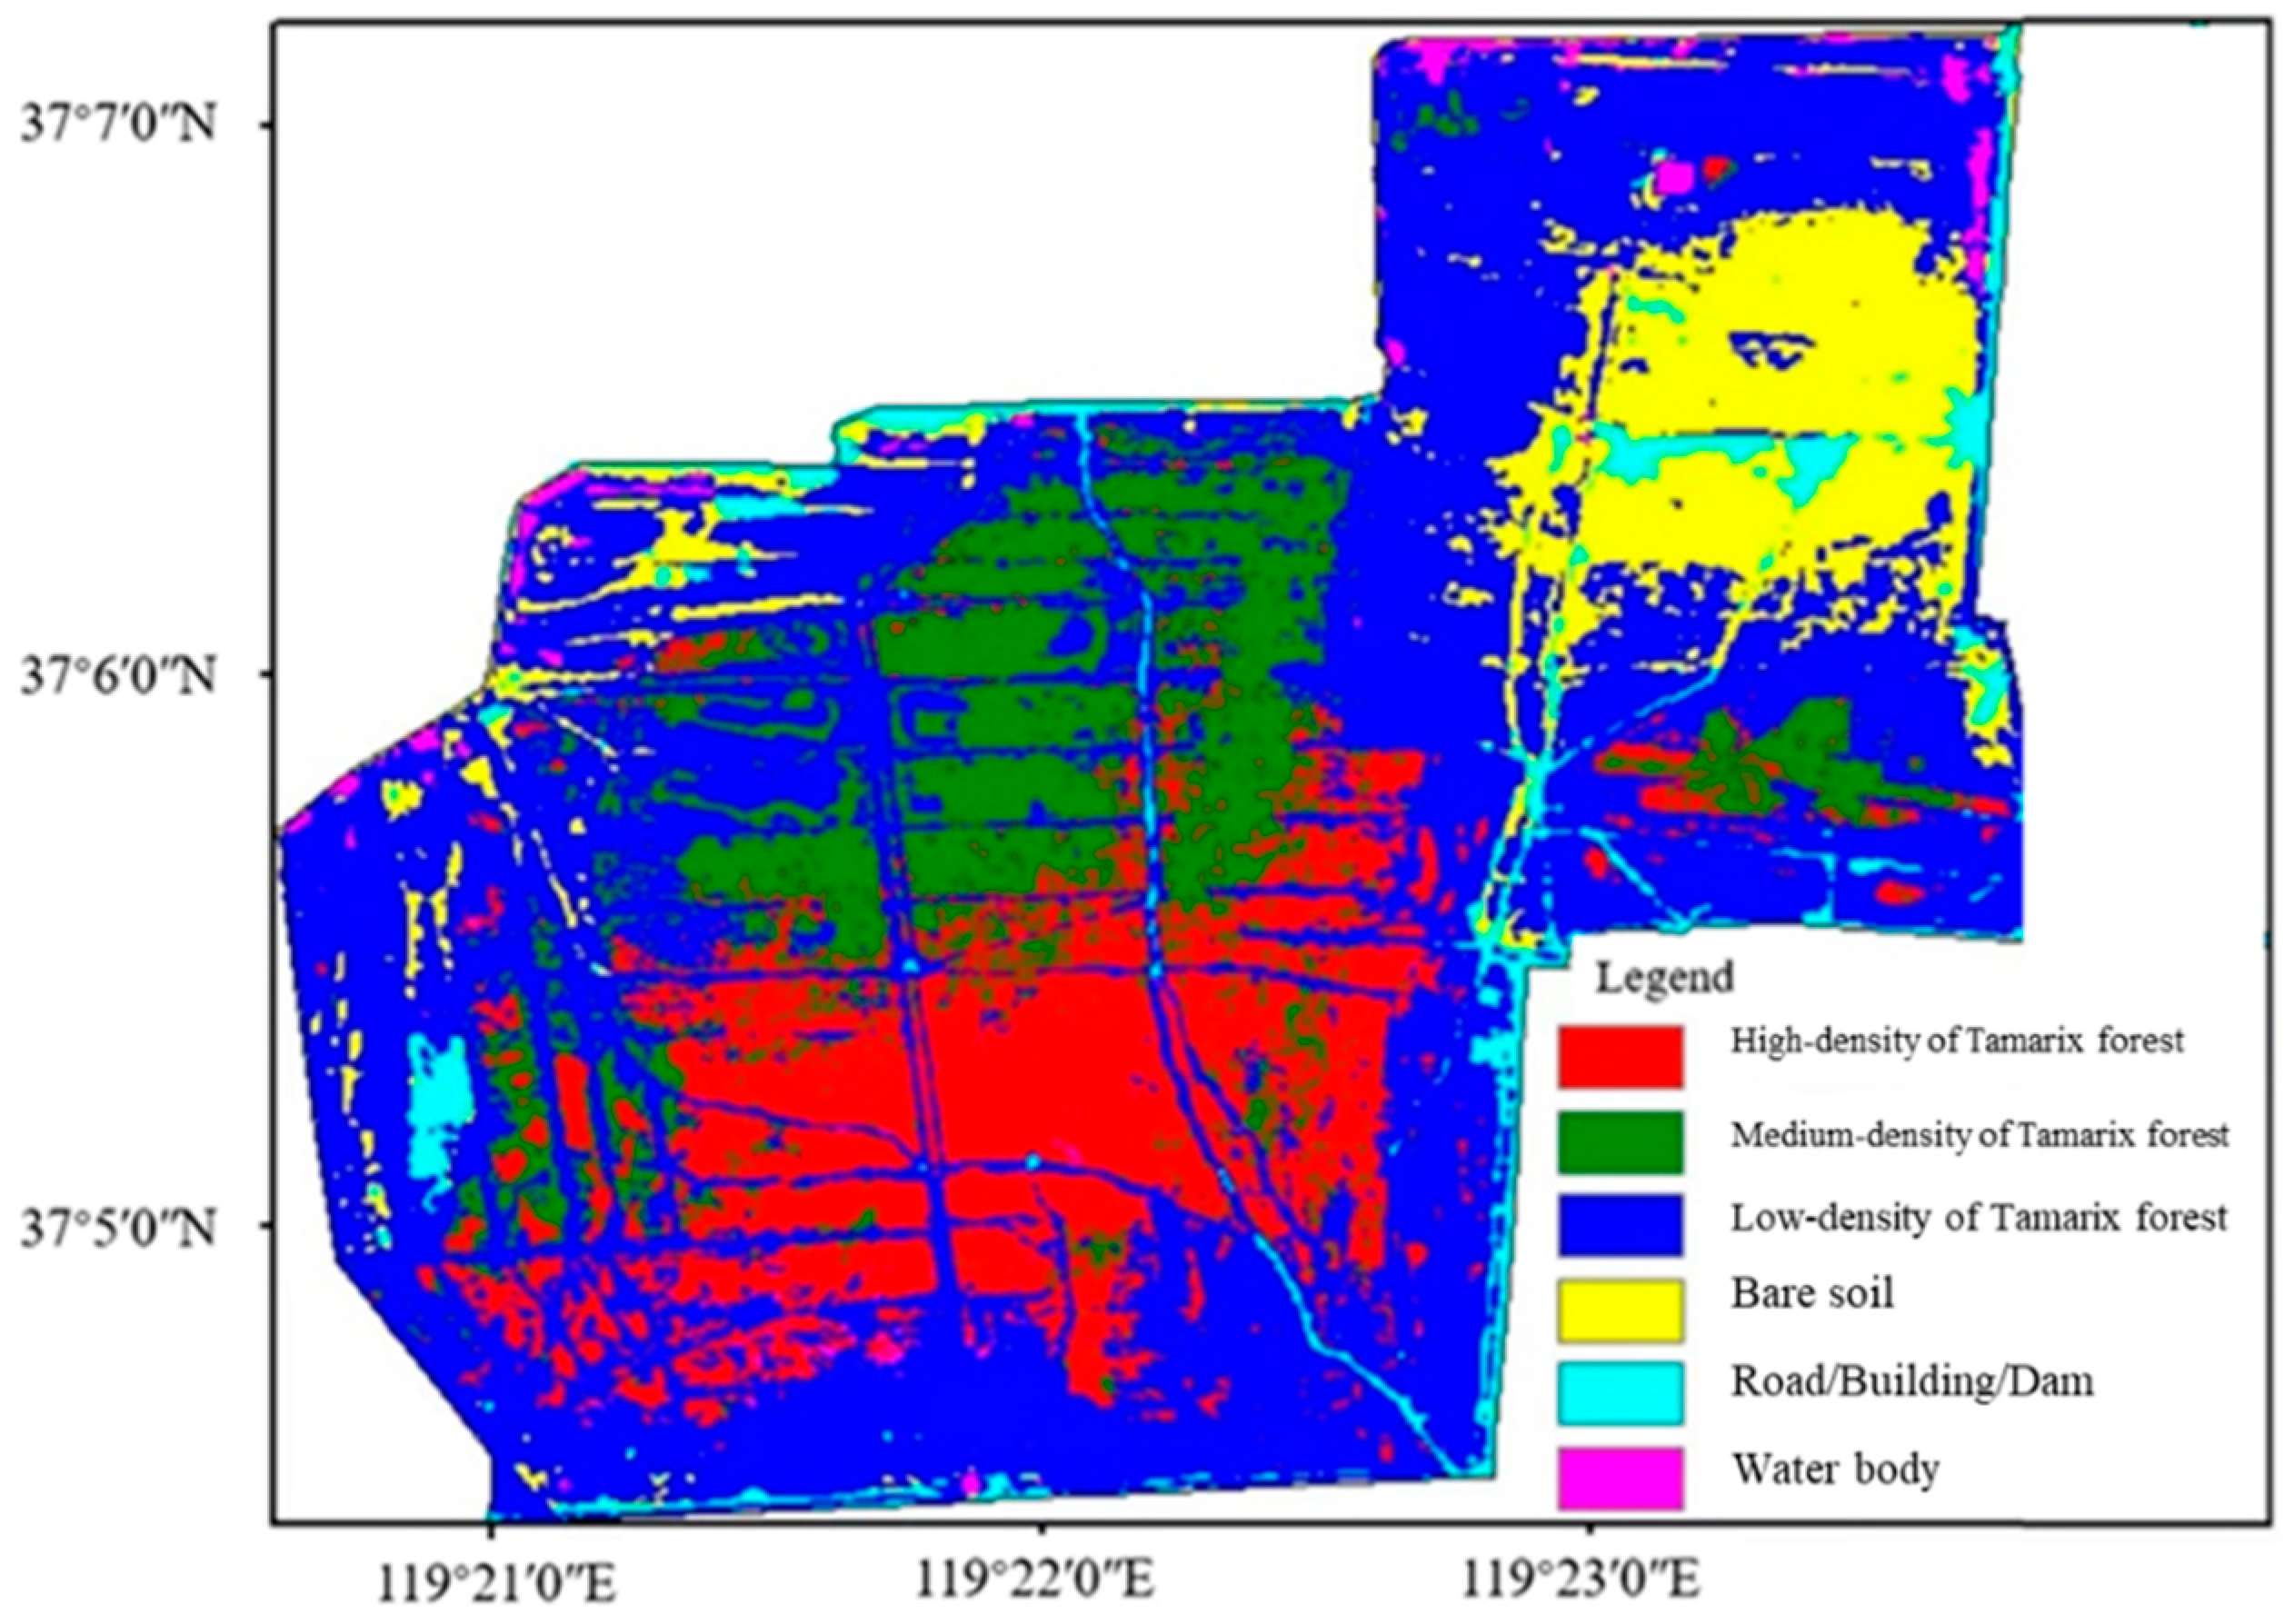
4.3. Analysis of Land-Use/Cover Extraction Results in the Study Area Based on CART Decision Tree

According to the comprehensive analysis of the distribution results of VFC in the study area in Figure 9 and the land-use/cover extraction results based on CARTs in Figure 8, it can be seen that the extraction results of high-density Tamarix forest are more accurate in the central and southern parts of the study area, but in the central–eastern part and central–northern part of the study area, there is a phenomenon of omission of extraction in some areas with a certain scale of high-density Tamarix forests. The overall extraction result of medium-density Tamarix forests is poor, such as the incorrect extraction in the southern part, east-central part, and the marginal area of the study area. In fact, the low-density Tamarix forest in the study area mainly exists in the neck of the northeast of the study area as well as in the west and southwest of the study area. Overall, the extraction of the overall spatial distribution pattern of the low-density Tamarix forest was relatively accurate, but due to a certain amount of non-low-density Tamarix being mistakenly extracted, the overall spatial coverage ratio of low-density forest was larger than the actual result.
The main reasons for the above extraction results are as follows: when using the CART decision tree for remote sensing image classification and recognition, the “same object, different spectrum, and same spectral different objects” will have a certain impact on the classification of remote sensing images in the study area; at the same time, a relatively low spatial resolution of remote sensing image affects the accuracy of spectral information, which will also have an impact on the accurate classification of remote sensing image [33,34].
In this study, the regions of VFC < 0.2 include bare soil, roads, buildings, dams, water bodies, and other types of land use/cover. Among them, the actual situation of the area extracted as bare soil in the northeast direction of the study area of low-density Tamarix forest with artificial afforestation and the extraction result were more objective and accurate. At the same time, most of the extraction results of roads, buildings, dams, and water bodies were relatively accurate. For example, the geometry of roads and dams could be clearly displayed in non-central areas. In the central region, the road was mistakenly extracted as a medium-density Tamarix forest, mainly due to the low spatial resolution of the remote sensing image and the incorrect extraction of mixed pixels.
Through reading the literature, it has been noted that decision tree classification methods are extensively employed in forest information extraction research. One study has utilized spectral analysis of typical ground objects and experiments to determine forest land cover types by setting a threshold for the NDVI (Normalized Difference Vegetation Index), distinguishing between vegetated and non-vegetated areas. Specifically, areas with NDVI values above the threshold are classified as vegetation, while those below are considered non-vegetation; the same approach is applied to water bodies. The overall accuracy of this decision tree model classification is remarkably high, achieving a classification result of 87% [35]. Furthermore, another study has adopted a decision tree approach for the automatic extraction of mangrove information. By utilizing Landsat8 OLI remote sensing data and two selected classification indicators—NDMI (Normalized Difference Moisture Index) and MNDPI (Modified Normalized Difference Pond Index)—the decision tree model has constructed the effectively extracted mangrove information, with low misclassification and omission rates [36].

5. Conclusions

In this study, the Tamarix forest in the protected area was taken as the research object. According to the Technical regulations for inventory for forest management planning and design (GB/T 26424-2010) and the actual situation of the Tamarix forest stand structure in the study area, the land use/cover types of Tamarix forests in the study area were divided into high-density forest land, medium-density forest land, low-density forest land, as well as non-forest land types such as water bodies, roads/buildings/dams, and bare soil. Furthermore, the land classification and extraction results of the Tamarix forest in the study area were compared and analyzed using the endmember spectrum method and the CART decision tree method, respectively. Finally, the following conclusions were drawn:
(1)
The areas with VFC greater than or less than 0.4 in the study area account for 69.74% and 30.26% of the total area of the Tamarix forest in the study area. It shows that while the overall forest cover of Tamarix forests is high, there is still room for further afforestation and ecological restoration in the protection area, although a small portion of localized area, such as dams, roads, and buildings, are difficult to change their land use/cover attributes.
(2)
From the results based on the endmember spectrum method and the CART decision tree method, it could be concluded that the “same object corresponds to different spectrum, and the same spectrum corresponds to different objects”, having a certain impact on the classification and extraction of remote sensing images of shrubbery; at the same time, a relatively low spatial resolution of remote sensing images has an impact on the accuracy of spectral information, which in turn affects the extraction and classification.
(3)
From the results of land use/cover extraction based on the endmember spectrum method in the study area, it can be seen that this method has better results when extracting well-grown forested land, such as a high-density Tamarix forest and medium-density Tamarix forest, and poorer results when extracting non-forested land, such as low-density tamarisk forests, roads, buildings, dams, and water bodies.
(4)
From the results of the land use/cover extraction based on a CART decision tree in the study area, it can be seen that this method is more effective when extracting non-forested land, such as roads, buildings, dams, and water bodies, but less effective when extracting forested land, such as high-density Tamarix forests, medium-density Tamarix forests, and low-density Tamarix forests.

Author Contributions

Methodology, validation, writing—original draft preparation, writing—review and editing—formal analysis, J.W. and R.L.; investigation, Y.Z. and Y.L.; resources, X.C., J.X. and F.C. All authors have read and agreed to the published version of the manuscript.

Funding

This research was funded by Shandong Top Talent Special Foundation—Research and development of key technologies and high-end equipment of water environment health in the Yellow River Basin (Shandong) (grant number 0031504); The National Science Fund for Distinguished Young Scholars—Construction and application of remote sensing ecological index model of Tamarix shrubbery forest (grant number 42107496); The Introduction and Cultivation Plan for Young Innovative Talents of Colleges and Universities by the Education Department of Shandong Province (QCTD202108); The Youth Innovation Team Plan team of higher education institutions of Shandong Province in 2022—Research on Purification Mechanism and High Value Utilization of High Algae Water Based on Forward Osmosis Combined Process (grant number 2022KJ206); The Doctoral research fund project of Shandong Jianzhu University—Research on Ecological Environment Quality Assessment of Tamarix Chinensis Forest in Changyi based on Remote Sensing Technology (grant number X20192Z); and The Research Project of Academician Innovation Platform of Hainan Province, China—Ecological environment monitoring, protection and restoration of tropical marine islands based on intelligent robot (grant number YSPTZX202149).

Data Availability Statement

Data is contained within the article.

Conflicts of Interest

The authors declare no conflicts of interest.

References

  1. Cihlar, J.; Latifovic, R.; Trishchenko, A.; Fedosejevs, G.; Beaubien, J.; Chen, J. National Scale Forest Information Extraction from Coarse Resolution Satellite Data, Part 1. Remote Sens. For. Environ. Concepts Case Stud. 2003, 337–357. [Google Scholar] [CrossRef]
  2. Ma, S.; Wang, L.J.; Jiang, J.; Zhao, Y.G. Land use/land cover change and soil property variation increased flood risk in the black soil region, china, in the last 40 years. Environ. Impact Assess. Rev. 2024, 104, 107314. [Google Scholar] [CrossRef]
  3. Berman, M.; Kiiveri, H.; Lagerstrom, R.; Ernst, A.; Dunne, R.; Huntington, J.F. ICE: A statistical approach to identifying endmembers in hyperspectral images: Learning from Earth’s Shapes and Colors. IEEE Trans. Geosci. Remote Sens. 2004, 42, 2085–2095. [Google Scholar] [CrossRef]
  4. Adegun, A.A.; Viriri, S.; Tapamo, J.R. Review of deep learning methods for remote sensing satellite images classification: Experimental survey and comparative analysis. J. Big Data. 2023, 10, 93. [Google Scholar] [CrossRef]
  5. Denisova, A.Y.; Egorova, A.A.; Sergeyev, V.V.; Kavelenova, L.M. Requirements for multispectral remote sensing data used for the detection of arable land colonization by tree and shrubbery vegetation. Comput. Opt. 2019, 43, 846–856. [Google Scholar] [CrossRef]
  6. Zhang, J.; Zhou, Q.; Zhuo, L.; Geng, W.; Wang, S. A CBIR system for hyperspectral remote sensing images using endmember extr action. Int. J. Pattern Recogn. 2017, 31, 1752001. [Google Scholar] [CrossRef]
  7. Yang, H.; Deng, F.; Fu, H.; Zhang, J. Estimation of rape-cultivated area based on decision tree and mixed pixel decomposition. J. Indian Soc. Remote 2021, 49, 1285–1292. [Google Scholar] [CrossRef]
  8. Phiri, D.; Simwanda, M.; Nyirenda, V.; Murayama, Y.; Ranagalage, M. Decision tree algorithms for developing rulesets for object-based land cover classification. ISPRS Int. J. Geo-Inf. 2020, 9, 329. [Google Scholar] [CrossRef]
  9. Tsitsi, B.; Silvia, A.; Massim, M.; Adriaan, V.N.; Zoltán, V. A spectral unmixing method with ensemble estimation of endmembers: Application to flood mapping in the caprivi floodplain. Remote Sens. 2017, 9, 1013. [Google Scholar] [CrossRef]
  10. Xia, J.B.; Zhang, S.Y.; Zhang, G.C.; Xu, J.W.; Shao, H.B. Growth dynamics and soil water ecological characteristics of Tamarix Chinensis Lour. forests with two site types in coastal wetland of Bohai golf. J. Food Agric. Environ. 2013, 11, 1492–1498. [Google Scholar]
  11. Liu, J.N.; Fang, H.; Liang, Q.; Dong, Y.; Wang, C.; Yan, L.; Ma, X.Z.; Lang, X.; Gai, S.; Wang, L.; et al. Genomic analyses provide insights into the evolution and salinity adaptation of halophyte Tamarix chinensis. GigaScience 2023, 12, giad053. [Google Scholar] [CrossRef]
  12. Zhu, R.; Mo, N.; Zhuang, L. Class-specific dictionary-based cross-domain scene classification method with reliable target pseudo labels for remote sensing images. Remote Sens. Appl. Soc. Environ. 2023, 33, 101101. [Google Scholar] [CrossRef]
  13. GB/T 26424-2010; Technical regulations for inventory for forest management planning and design. Standardization Administration of China: Beijing, China, 2010.
  14. Horton, J.S. The Development and Perpetuation of the Permanent Tamarisk Type in the Phreatophyte Zone of the Southwest; US Department of Agriculture, Forest Service, Rocky Mountain Forest and Range Experiment Station: Fort Collins, CO, USA, 1977; pp. 124–127. [Google Scholar]
  15. Zhu, J.G.; Wei, M.J.; Lin, L.; Den, Q.L.; Yibo, L.; Weilinag, F. Using vegetation indices and texture measures to estimate vegetation fractional coverage (VFC) of planted and natural forests in Nanjing city, China. Adv. Space Res. 2013, 51, 1186–1194. [Google Scholar] [CrossRef]
  16. Huo, H.; Sun, C. Spatiotemporal variation and influencing factors of vegetation dynamics based on Geodetector: A case study of the northwest. Yunnan Plateau, China. Ecol. Indic. 2021, 130, 108005. [Google Scholar] [CrossRef]
  17. Miao, L.; Qi, H.; Szu, H. A maximum entropy approach to unsupervised mixed-pixel decomposition. IEEE T. Image Process. 2007, 16, 1008–1021. [Google Scholar] [CrossRef]
  18. Syarif, A.M.; Kumara, I.S.W. The effect of minimum noise fraction on multispectral imagery data for vegetation canopy density modelling. Geoplanning J. Geomat. Plann. 2018, 5, 251–258. [Google Scholar] [CrossRef]
  19. Pei, L.; Yan, C. Study on mixed pixel classification method of remote sensing image based on fuzzy theory. In Proceedings of the Joint Urban Remote Sensing Event, Shanghai, China, 20–22 May 2009; pp. 1–7. [Google Scholar] [CrossRef]
  20. Chang, C.I.; Li, Y.; Wang, Y. Progressive band processing of fast iterative pixel purity index for finding endmembers. IEEE Geosci. Remote Sens. 2017, 14, 1464–1468. [Google Scholar] [CrossRef]
  21. Bateson, A.; Curtiss, B. A method for manual endmember selection and spectral unmixing. Remote Sens. Environ. 1996, 55, 229–243. [Google Scholar] [CrossRef]
  22. Serventi, G.; Carli, C.; Altieri, F.; Geminale, A.; Sgavetti, M. Spectral classification and MGM-based mineralogical characterization of hydrated phases: The Nili Fossae case, Mars. Planet. Space Sci. 2021, 209, 105361. [Google Scholar] [CrossRef]
  23. Friedl, M.A.; Brodley, C.E. Decision tree classification of land cover from remotely sensed data. Remote Sens. Environ. 1997, 61, 399–409. [Google Scholar] [CrossRef]
  24. Tangirala, S. Evaluating the impact of GINI index and information gain on classification using decision tree classifier algorithm. Int. J. Adv. Comput. Sc. 2020, 11, 612–619. [Google Scholar] [CrossRef]
  25. Jacobson, C.R. The effects of endmember selection on modelling impervious surfaces using spectral mixture analysis: A case study in sydney, australia. Int. J. Remote Sens. 2014, 35, 715–737. [Google Scholar] [CrossRef]
  26. Wang, W.; Yao, X.; Ji, M.; Zhang, J. Spectral data treatments for impervious endmember derivation and fraction mapping from landsat etm+ imagery: A comparative analysis. Front. Earth Sci. 2015, 9, 179–191. [Google Scholar] [CrossRef]
  27. Luna, J.M.; Gennatas, E.D.; Ungar, L.H.; Eaton, E.; Diffenderfer, E.S.; Jensen, S.T.; Simonell, C.B.; Friedman, J.; Solberg, T.D.; Valdes, G. Building more accurate decision trees with the additive tree. Proc. Natl. Acad. Sci. USA 2019, 116, 19887–19893. [Google Scholar] [CrossRef] [PubMed]
  28. Zhang, N.; Wu, Y.; Zhang, Q. Detection of sea ice in sediment laden water using MODIS in the Bohai Sea: A CART decision tree method. Int. J. Remote Sens. 2015, 36, 1661–1674. [Google Scholar] [CrossRef]
  29. Hu, Y.; Tian, B.; Yuan, L.; Li, X.; Sun, C. Mapping coastal salt marshes in China using time series of Sentinel-1 SAR. ISPRS J. Photogramm. Remote Sens. 2021, 173, 122–134. [Google Scholar] [CrossRef]
  30. Rajabi, R.; Ghassemian, H. Spectral unmixing of hyperspectral imagery using multilayer NMF. IEEE Geosci. Remote Sens. 2014, 12, 38–42. [Google Scholar] [CrossRef]
  31. Li, Y.Q.; Zuo, X.Q.; Li, H.Z. Classification of mangrove population based on worldview-2: A case study of shenzhen bay. Software 2020, 41, 134–138. (In Chinese) [Google Scholar]
  32. Li, X.; Liu, K.; Zhu, Y.H. Species classification of mangroves based on resource three satellite imagery. Remote Sens. Technol. Appl. 2018, 33, 360–369. (In Chinese) [Google Scholar]
  33. Narayanan, R.M.; Desetty, M.K.; Reichenbach, S.E. Effect of spatial resolution on information content characterization in remote sensing imagery based on classification accuracy. Int. J. Remote Sens. 2002, 23, 537–553. [Google Scholar] [CrossRef]
  34. Zhao, J.; Zhong, Y.; Hu, X.; Wei, L.; Zhang, L. A robust spectral-spatial approach to identifying heterogeneous crops using remote sensing imagery with high spectral and spatial resolutions. Remote Sens. Environ. 2020, 239, 111605. [Google Scholar] [CrossRef]
  35. Chen, L.; Lin, H.; Sun, H. Extraction of forest information based on decision tree classification. J. Cent. South Univ. For. Technol. 2013, 33, 46–51. (In Chinese) [Google Scholar]
  36. Zhang, X. Automatic extraction of mangrove information from landsat 8 OLI images based on decision tree method. Remote Sens. Land Resour. 2016, 28, 182–187. (In Chinese) [Google Scholar]
Figure 1. Technology roadmap.
Forests 15 01179 g001
Figure 2. Location of study area.
Forests 15 01179 g002
Figure 3. MNF transformation results.
Forests 15 01179 g003
Figure 4. The grayscale image of PPI of the study area.
Forests 15 01179 g004
Figure 5. N-dimensional visualization results of MNF transformed images of the reserve.
Forests 15 01179 g005
Figure 6. Land-use/cover classification results in the study area based on the endmember spectrum.
Forests 15 01179 g006
Figure 7. Decision tree generated based on CART algorithm.
Forests 15 01179 g007
Figure 8. Results of land use/cover classification in the study area based on CART decision tree.
Forests 15 01179 g008
Figure 9. VFC distribution results in the study area.
Forests 15 01179 g009
Table 1. The advantage and disadvantage of the endmember spectrum method and CART decision tree method.
MethodAdvantageDisadvantage
Endmember spectrum methodThe MNF transformation is used to separate noise from the data, thereby reducing the dimensionality of the data and minimizing the workload of subsequent processing tasks. Additionally, the MNF transformation eliminates the correlation between different bands, further reducing noise [25].The PPI is sensitive to noise data and requires MNF transformation for noise reduction. There is no appropriate rule for the selection of the dimension of PPI dimensionality reduction. The PPI does not provide a method for determining the number of endmembers. After PPI endmember extraction, it is necessary to further manually determine the endmembers with the help of N-dimensional visualization [26].
CART
decision tree method
The classification rules and process are intuitive and consistent with the human cognitive process, and its best feature is that it can utilize multi-source data [27].It has a clear structure, speed, simplicity, and effectiveness. In particular, it can obtain nodes and thresholds based on the selected training samples, eliminating the need for repeated trials to determine thresholds. This approach avoids the subjectivity inherent in traditional expert knowledge-based methods [28].
Table 2. Statistical results of VFC in the study area.
ClassificationVFCArea/km2Percentage of the Area/%
Non-forest land<0.10.925.94
0.1–0.21.499.61
Low-density forest land0.2–0.31.298.32
0.3–0.40.996.39
Medium-density forest land0.4–0.51.107.10
0.5–0.62.5216.26
0.6–0.74.0626.19
High-density forest land0.7–0.82.8318.26
0.8–0.90.281.81
0.9–1.00.020.13
Total15.50100.00
Disclaimer/Publisher’s Note: The statements, opinions and data contained in all publications are solely those of the individual author(s) and contributor(s) and not of MDPI and/or the editor(s). MDPI and/or the editor(s) disclaim responsibility for any injury to people or property resulting from any ideas, methods, instructions or products referred to in the content.

