Article

Stoichiometric Homeostasis of N and P in the Leaves of Different-Aged Phyllostachys edulis after Bamboo Forest Expansion in Subtropical China

1
School of Hydraulic Engineering, Fujian College of Water Conservancy and Electric Power, Yong’an 366000, China
2
International Centre for Bamboo and Rattan, Key Laboratory of Bamboo and Rattan, Beijing 100102, China
3
Research Institute of Forestry Chinese Academy of Forestry, Beijing 100091, China
*
Author to whom correspondence should be addressed.
Forests 2024, 15(7), 1181; https://doi.org/10.3390/f15071181
Submission received: 4 May 2024 / Revised: 19 June 2024 / Accepted: 2 July 2024 / Published: 8 July 2024

Abstract

:
Stoichiometric homeostasis is an important mechanism in maintaining ecosystem structure, function, and stability. Phyllostachys edulis (moso bamboo) is a typical clone plant, forming pure bamboo forests or bamboo–wood mixed forests by expanding rhizomes around. Studying the stoichiometric homeostasis characteristics of moso bamboo at different ages after expansion contributes to a deeper understanding of the stability of bamboo forest ecosystems, and is of great significance for expanding the research scope of ecological stoichiometry. Based on the stoichiometric internal stability theory, the nitrogen (N) and phosphorus (P) elements in the soil and plants of typical moso bamboo forests in Tianbaoyan National Nature Reserve of Fujian Province were determined, and the internal stability index (H) of bamboo leaves of different ages (I-du, II-du, III-du, and IV-du bamboos) was calculated. The results showed that the dependence of moso bamboo on soil nutrients and the ability of moso bamboo to regulate nutrient elements were both significantly affected by the plant’s age. Under the condition of the same soil nutrients (N, P), the content of N and P in bamboo leaves decreased significantly with the increase in bamboo age. The limiting effect of phosphorus on the growth and development of moso bamboo was greater than that of nitrogen, and the limiting effect of phosphorus on aged bamboo was greater than that of young bamboo. The stoichiometric internal stability index of N and P in bamboo leaves is HN:P > HN > HP, which means that the internal stability of moso bamboo is closely related to the limiting elements. Therefore, the regulation ability of the internal stability of moso bamboo of different ages makes it grow well in the changeable environment, has stronger adaptability and competitiveness, and the leaf internal stability of I-du bamboo was higher than that of other ages, which may be one of the reasons for its successful expansion to form a stable bamboo stand structure.

1. Introduction

Nitrogen (N) and phosphorus (P) constitute the primary building blocks of living organisms, with their levels significantly impacting the structural and functional dynamics within ecosystems [1,2]. Throughout their evolutionary history, living organisms have preserved a relative constancy in their chemical makeup through a state of dynamic equilibrium. This allows for only minor fluctuations in their internal environment, thereby establishing a specific homeostatic mechanism [3]. The capacity of organisms to sustain a relatively stable elemental composition within their bodies as an adaptation to the external environment is referred to as stoichiometric homeostasis [4]. This concept more accurately captures their physiological and biochemical adjustments in response to shifts in the environment [5,6].
For plants, carbon (C) serves as the fundamental substrate and energy source essential for their vital physiological and biochemical activities, while nitrogen (N) and phosphorus (P) are primarily the nutrients that limit their growth [7]. The leaf, as the plant organ with the greatest exposure to the local environment, exhibits the highest sensitivity to environmental conditions [8]. Hence, establishing the quantitative relationships among carbon (C), nitrogen (N), and phosphorus (P) in plant leaves, as well as assessing the limitations imposed by nitrogen and phosphorus, is pivotal in the field of plant ecochemometrics research [9,10,11]. For example, Han et al. [12] highlighted the common positive correlation between soil and leaf phosphorus concentrations, indicating that increased soil phosphorus levels are associated with a higher phosphorus content in leaves. Since plants have the ability to actively regulate their cellular constituents or internal conditions to preserve the relative stability of their elemental composition, the influence of soil nutrient variations on the levels of nitrogen and phosphorus in their organs will be contingent upon the degree of their phytostoichiometric homeostatic capacity [13]. Previous research on homeostasis has predominantly concentrated on microorganisms such as bacteria and fungi, as well as algae, zooplankton, and herbaceous plants [3,14,15]. Owing to the intricate homeostatic and stoichiometric properties of elements within higher plants, research into the homeostasis of these organisms has been relatively scarce [16,17]. Some studies have indicated that species possessing high levels of internal stability exhibit greater resilience and dominance, potentially enhancing the stability of an ecosystem’s resistance; on the other hand, species with a lower internal stability may detract from an ecosystem’s capacity to sustain its equilibrium [18,19]. Thus, homeostasis can be considered a pivotal measure of a species’ competitive strength [20]. Generally, plants with robust homeostatic mechanisms are better suited to stable environments, while those with weaker homeostasis may have a competitive edge in environments that are subject to change. This could also account for why species with strong homeostasis can sustain slow growth even under conditions of resource scarcity [13]. Therefore, examining the stoichiometric homeostasis in plants offers significant insights into the ecological strategies and adaptability of various species [21].
Moso bamboo forms a pivotal part of China’s vast forest resources, being widely distributed in the country’s southern regions, where it provides high economic and ecological benefits [22,23]. At present, it stands as the predominant bamboo species cultivated in China, with its plantations covering an area of 5.28 million hectares, which represents 69.78% of the total bamboo forest area in the country, as per the 2021 statistics on China’s bamboo resources [24]. Moso bamboo, known for its robust clonal propagation capabilities, exhibits vigorous growth and rapid biomass accumulation, making it a plant with an exceptional ability to expand [25]. Within a mere four years, bamboo culms are ready for harvest, offering a sustainable alternative to traditional timber [26]. However, the regular harvesting of bamboo can deplete soil nutrients significantly, thereby impacting its capacity for sustainable yield [27,28]. Applying fertilizer is a recognized method to enhance soil fertility and it serves to effectively replenish the lacking nutrients in the soil. Nevertheless, the method and quantity of fertilizer applied can significantly affect the efficiency with which moso bamboo utilizes these nutrients. For instance, when fertilizer is applied close to the ground level, it can be challenging for the broadcast method to penetrate into the bamboo’s root absorption zone. This results in a comparatively low uptake rate of the fertilizer by the moso bamboo [29]. Secondly, reasonable fertilization can also affect soil quality by altering soil enzyme activities and microbial activity which play a crucial role in maintaining the long-term productivity of moso bamboo forests [30]. In light of the aforementioned studies, there is a growing emphasis on management strategies that advocate for precision fertilization. These strategies aim to enhance the efficiency of fertilizer use, minimize the loss of nutrients, and safeguard the ecological environment. In this regard, techniques such as furrow and spot applications of fertilizer are frequently employed in silvicultural practices. These methods are designed to curtail the wastage of nutrients and optimize the overall efficiency of fertilizer application [31]. In recent times, there has been a growing body of research dedicated to the targeted fertilization of moso bamboo forests [32]. Conversely, there is a dearth of studies exploring the intrinsic self-regulation capabilities of moso bamboo, resulting in a scarcity of pertinent data.
In this study, the ability of moso bamboos to maintain the relative stability of element composition in plants after expansion was discussed. The main objectives of this study were to determine the stoichiometric characteristics and limiting elements of bamboo leaves of different ages, and compare the internal stability of bamboo leaves of different ages to provide guidance for the efficient fertilization management of bamboo forests in China.

2. Materials and Methods

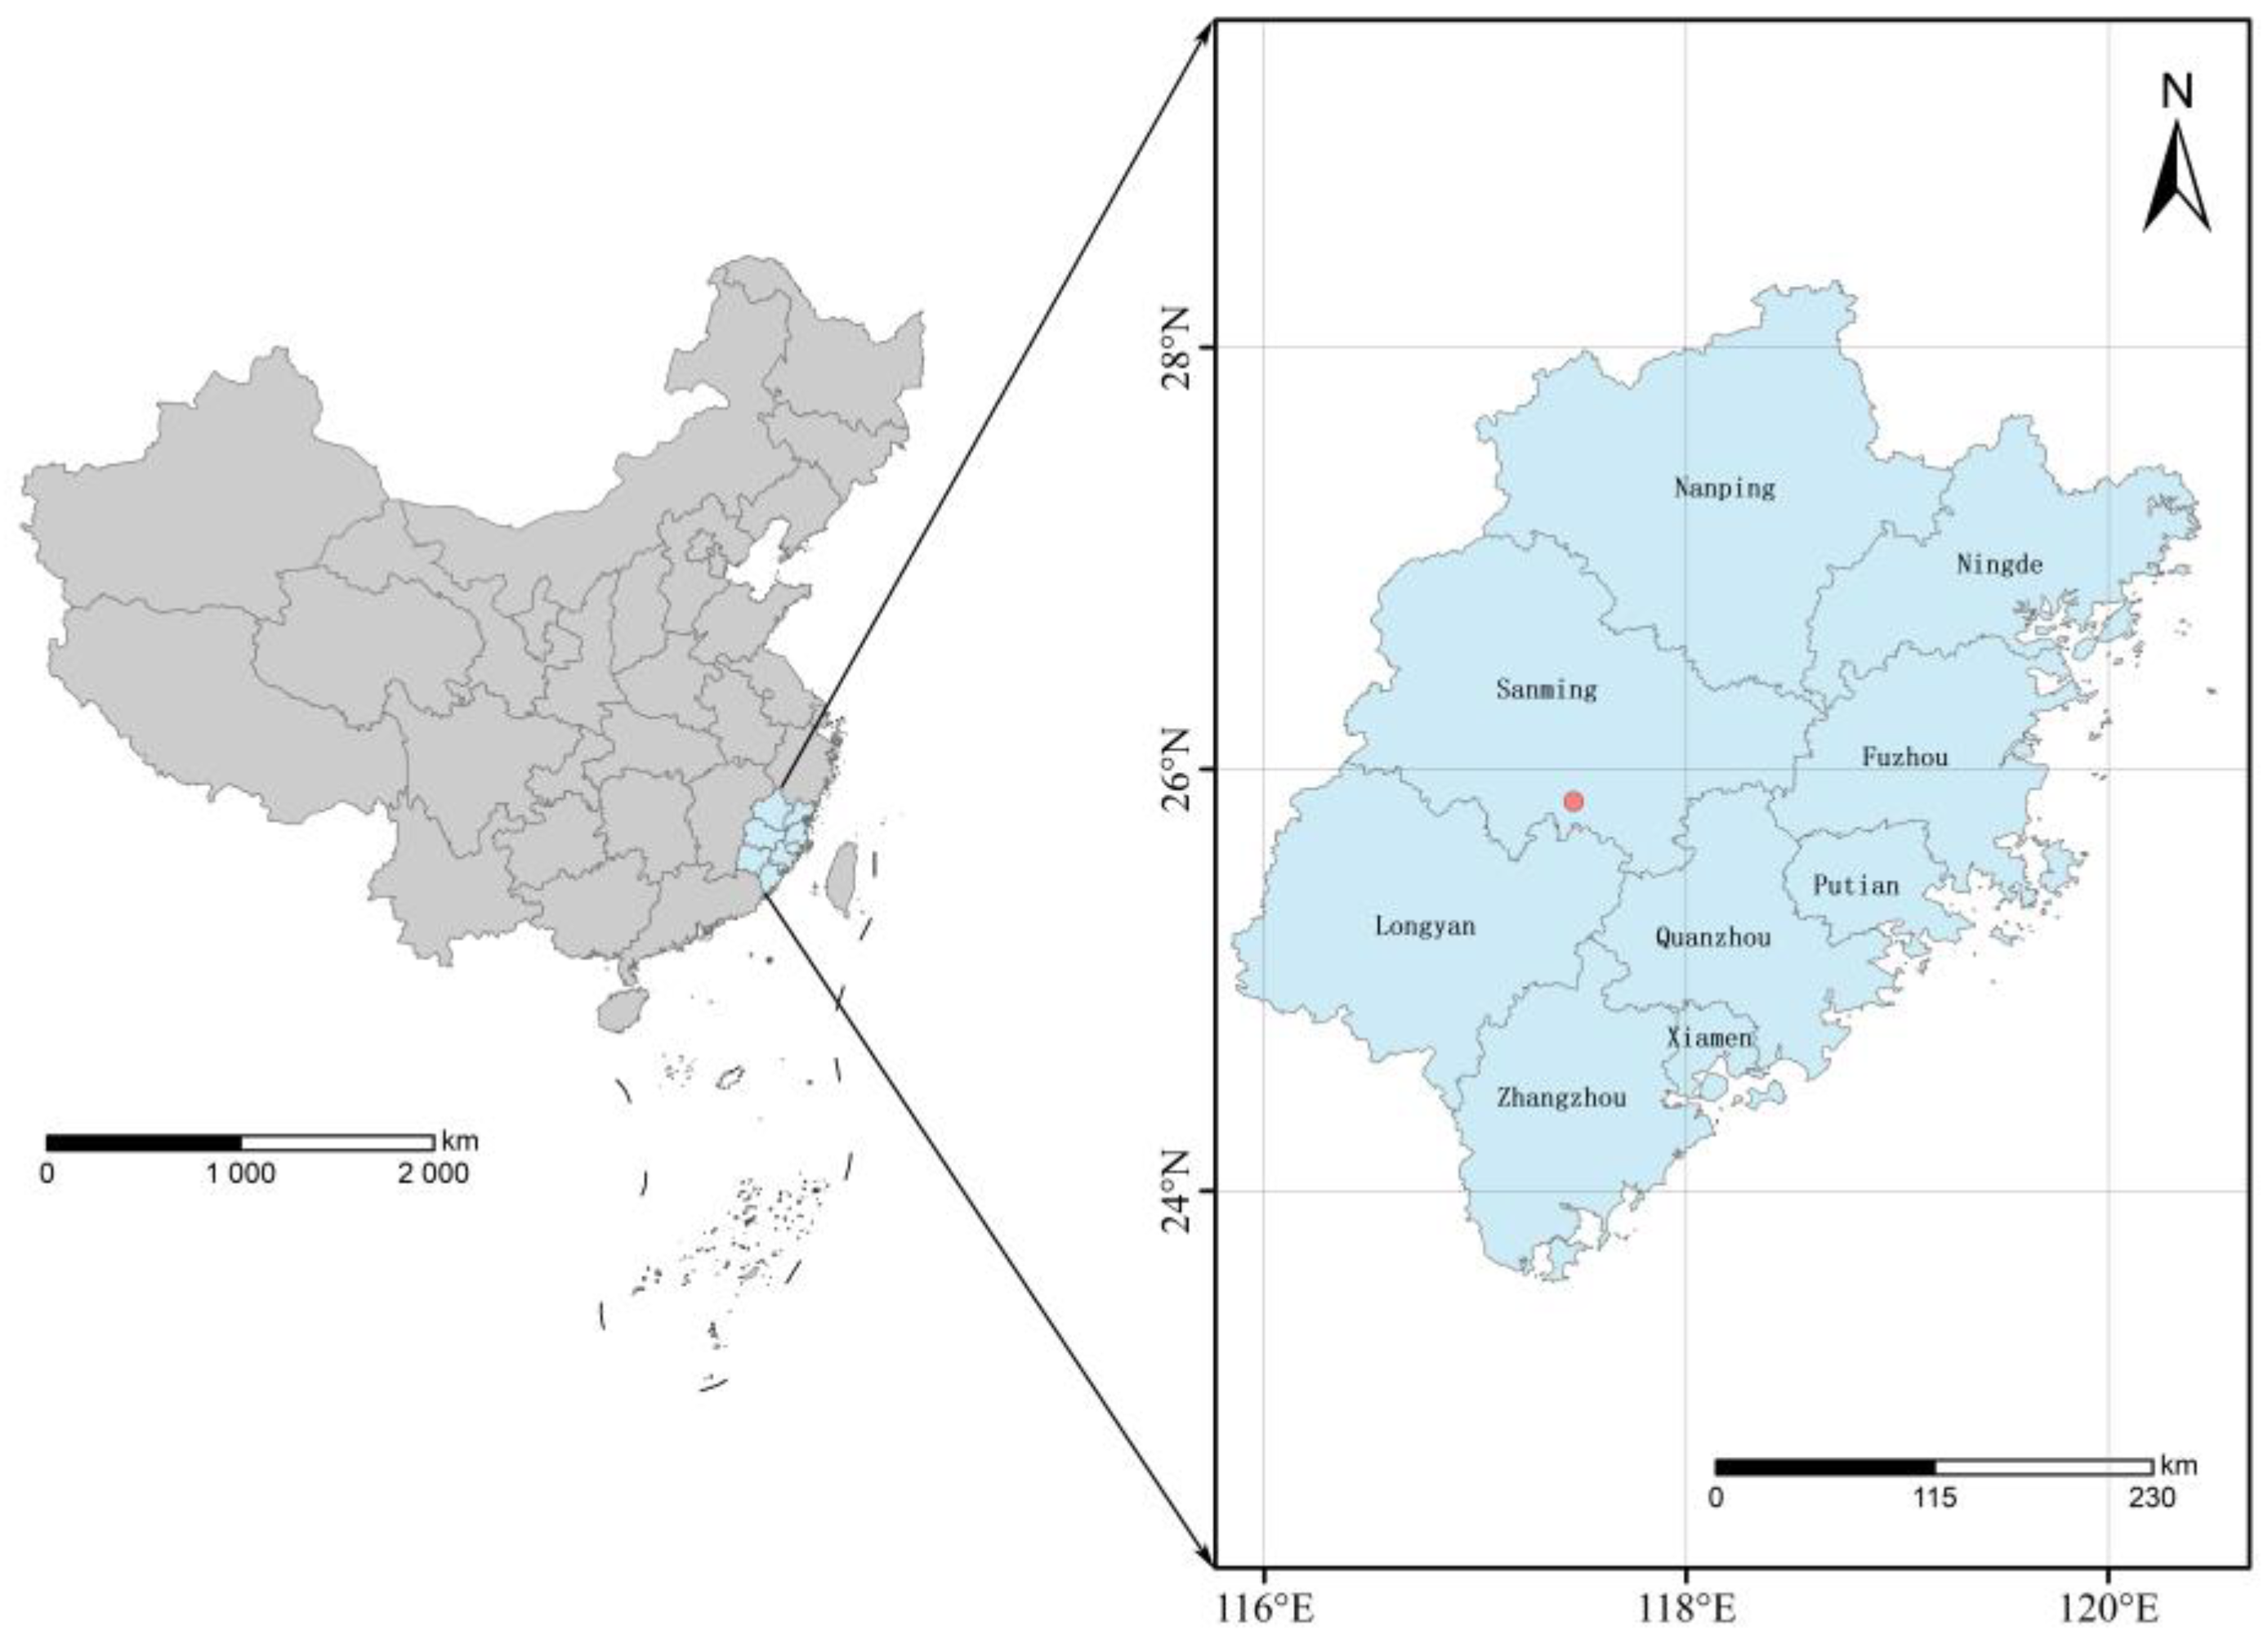
2.1. Site Description

The study site was located in Tianbaoyan National Nature Reserve at the Yongan Bamboo Forest Ecosystem Positioning Observation Station, in Fujian (117°28′03″–117°35′28″ E, 25°50′51″–26°01′20″ N). This region has a subtropical southeast monsoon climate, with an annual average temperature of 15 °C, an absolute minimum temperature of –11 °C, an absolute maximum temperature of 40 °C, an annual average relative humidity of 80%, and an annual average frost-free period totaling 290 days. Bamboo forest coverage in the study area reached 96.8%, mainly distributed below 800 m a.s.l. According to the USDA soil classification, the soils at our study site are Ultisols.
The bamboo forests in this experimental area formed via natural expansion, after ca. 30 years, in which there was mixed vegetation, such as Masson pine, Chinese fir, Zizyphus jujuba, and Muhe. This bamboo forest is managed by yearly weeding, digging of bamboo shoots, and cutting down of bamboo.

2.2. Experimental Design

In accordance with the requirements for bamboo forest growth and experimentation, nine test transects were established in the direction of the expansion of moso bamboo, with each transect measuring 40 m in length and 10 m in width (Figure 1). The culm diameter at breast height (DBH; i.e., 1.3 m) and age of each moso bamboo individual in each transect were recorded (Table 1). Because of the unique growth characteristics of moso bamboo forests—a vegetative cycle of two years (on-year and off-year)—the age was expressed as “du” [33]. One (I) “du” represents ≤ 1 years, and similarly, II, III, and IV “du” designations correspond to plants 2~3, 4~5, and 6~7 years in age, respectively [33]. According to our survey results, there were I-du, II-du, III-du and IV-du bamboos in all nine transects. In each transect, we measured the DBH and height of each moso bamboo to obtain their mean values. According to these, we choose the standard bamboo for each age (du). The standard bamboo quantities used for analysis in bands 1–9 are 12, 12, 8, 8, 8, 8, 16, 16, and 16, respectively.

2.3. Plant Sampling and Analyses

In July 2015, healthy bamboos with an average diameter at breast height (DBH) were selected for harvesting from each age group (du) within the transects. Healthy bamboo leaves from the middle of the crown, facing the four cardinal directions (east, west, south, north), were collected; at least 10 healthy leaves were gathered in each direction. Leaf collection began at 9:00 AM daily. The fresh bamboo leaves were then placed between two sheets of moist filter paper, put into a thermal box containing dry ice, and transported to the laboratory before 11:00 AM. The collected leaves were dried at 70 °C until they reached a constant weight. Subsequently, the dried samples were ground and sifted through a 0.15 mm sieve for analysis of their total nitrogen (LN) and total phosphorus (LP) content.
Forest soil was sampled concurrently with the collection of the moso bamboo samples. Sampling points for the soil were chosen along three circular arcs centered on a standard bamboo, with radii of 20 cm, 40 cm, and 60 cm, respectively. Each sampling point was excavated to a depth of 10 cm. Soil samples from the same standard bamboo were combined to create a single composite sample. All soil samples were air-dried at room temperature and then sifted through a 0.15 mm mesh screen for subsequent analysis of their total nitrogen (SN), total phosphorus (SP), available nitrogen (HN), and available phosphorus (AP) content.
Total nitrogen (LN) concentrations in leaves were analyzed using the micro-Kjeldahl method [34]. Total phosphorus (LP) concentrations in leaves were measured by the ammonium molybdate method after persulfate oxidation [35]. Soil total phosphorus concentrations were determined by sodium hydroxide fusion–molybdenum antimony colorimetry [36].

2.4. Calculation Methods

Stoichiometric homeostasis coefficients (1/H) were calculated as follows:
y = c x 1 / H
where x is the resource nutrient stoichiometry (x%); y is the organism’s nutrient stoichiometry (same units as resource); c is a constant; and 1/H is the slope of the log-linearized relationship [3]. Following Makino [15] and Persson [13], we classified the degree of homeostasis of species this way: 1/H ≤ 0, strict homeostatic; 0 < 1/H < 0.25, homeostatic; 0.25 < 1/H < 0.5, weakly homeostatic; 0.5 < 1/H < 0.75, weakly plastic; 1/H > 0.75, plastic.
The coefficient of variation (CV) is a useful statistic for quantifying the relative difference of each observation value within a group. It is usually used to compare the dispersion degree of data among different groups, and is calculated as follows:
C V = σ μ
where σ is the standard deviation of the sequence and μ is the average value of the sequence. Hence, the larger the CV value, the greater the degree of differentiation of observations within the group; conversely, the smaller the CV value, the more balanced is the distribution of observations within the group [37].

2.5. Statistical Analysis

Excel 2020 was used to calculate the density and average DBH of bamboo in the transect, and Origine 2021 was used to fit the N and P contents of bamboo leaves with the corresponding soil nutrients. Graph analyses were conducted using Origin 2021.

3. Results

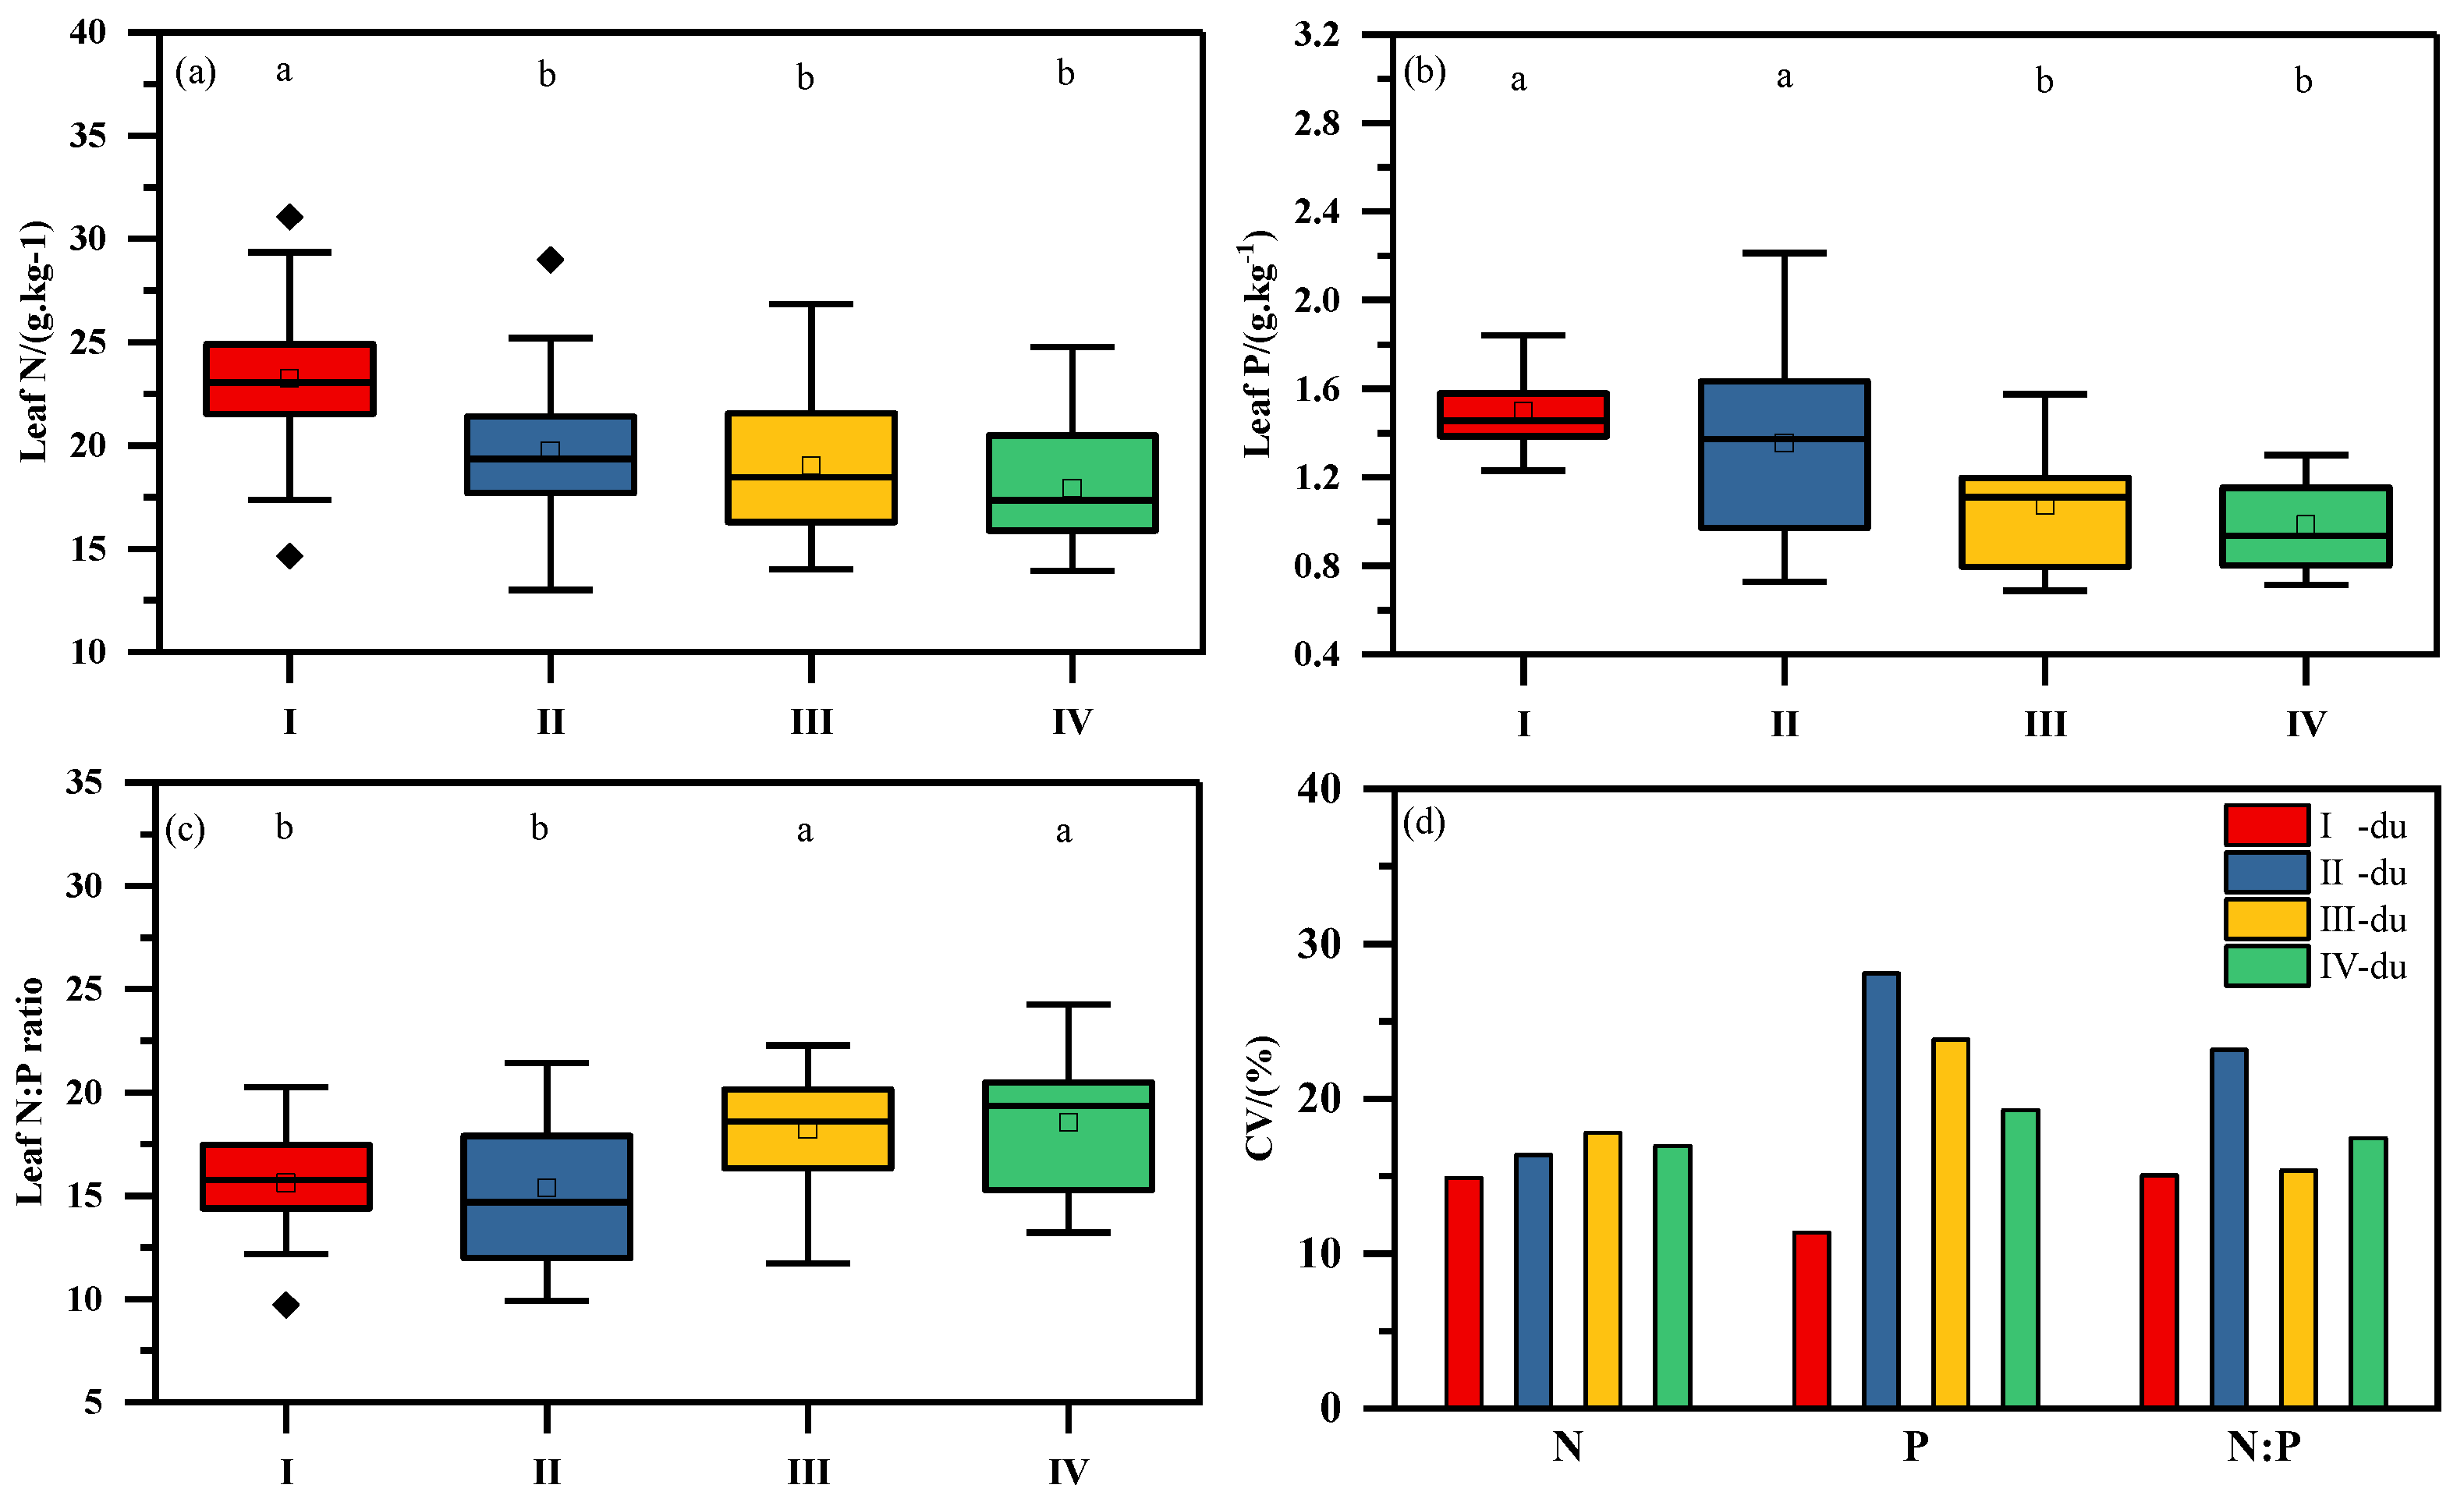
3.1. Stoichiometric Characteristics of N and P in Leaves of Moso Bamboo at Different Ages

The N concentrations in moso bamboo leaves were affected by bamboo age (Figure 2a). These N concentrations were reduced in older bamboo, in that they were 23.25, 19.73, 19.02, and 17.91 g·kg−1 in I-, II-, III-, and IV-du bamboos. From the one-way ANOVA, the N concentration in I-du bamboo leaves was the highest, significantly exceeding that of the II-, III-, and IV-du bamboo groups (p < 0.05). The N concentrations in the II-, III-, and IV-du bamboos were similar, in that their differences were not significant (p > 0.05). Similar to the trend for N concentration, the P concentration in moso bamboo leaves decreased with increasing age (Figure 2b). Bamboo age significantly affected this P concentration, being 1.5, 1.35, 1.07, and 0.99 g·kg−1 in the I-du, II-du, III-du, and IV-du bamboos, respectively. Through multiple comparisons, the P concentrations in I-du and II-du leaves significantly exceeded those of III-du and IV-du bamboos (p < 0.05); however, no significant difference was found between I-du and II-du bamboo leaves (p > 0.05). Accordingly, the N:P of bamboo leaves also depended on age (Figure 2c). The ranges of this N:P ratio in I, II, III, IV-du bamboos were, respectively, 9.72–20.74, 9.91–24.44, 11.72–22.29, and 13.22–24.25, with corresponding averages of 15.62, 15.38, 18.21, and 18.54. The average N: P of I-du and II-du bamboos was >14 but <16, while that of III-du and IV-du bamboos was >16; these latter values were significantly higher than those for either I-du or II-du bamboos (p < 0.05). There was no significant difference in N: P between the I-du and II-du bamboos, nor between the III-du and IV-du bamboos (p > 0.05). It can be seen from Figure 2d that the coefficient of variation of N content in leaves of moso bamboo is less than that of P content except I-degree bamboo.

3.2. Stoichiometric Characteristics of Soil C, N, and P in Phyllostachys pubescens Forests of Different Ages

During the growth of moso bamboo, the physiological and ecological activities of moso bamboo of different ages change, and the nutrient demand changes, so the effect on soil nutrients is different (Figure 3). The average soil C, N, and P contents of different-aged bamboo are 67.273, 2.416, and 0.311 g·kg−1, with ranges of 35.876–138.41, 1.315−4.0.037, and 0.187−0.514 g·kg−1, respectively; the average soil HP and AP contents are 135.129 mg·kg−1 and 5.940 mg·kg−1, with the ranges of 75.780−191.072 and 1.285−17.222 mg·kg−1, respectively; the average N:P ratio in the soil is 8.322, with a range of 4.036–14.794. The coefficient of variation of soil N content is the smallest. However, the differences in soil C, N, P, HP, AP, N:P in different-age bamboo did not reach a significant level (p > 0.05).

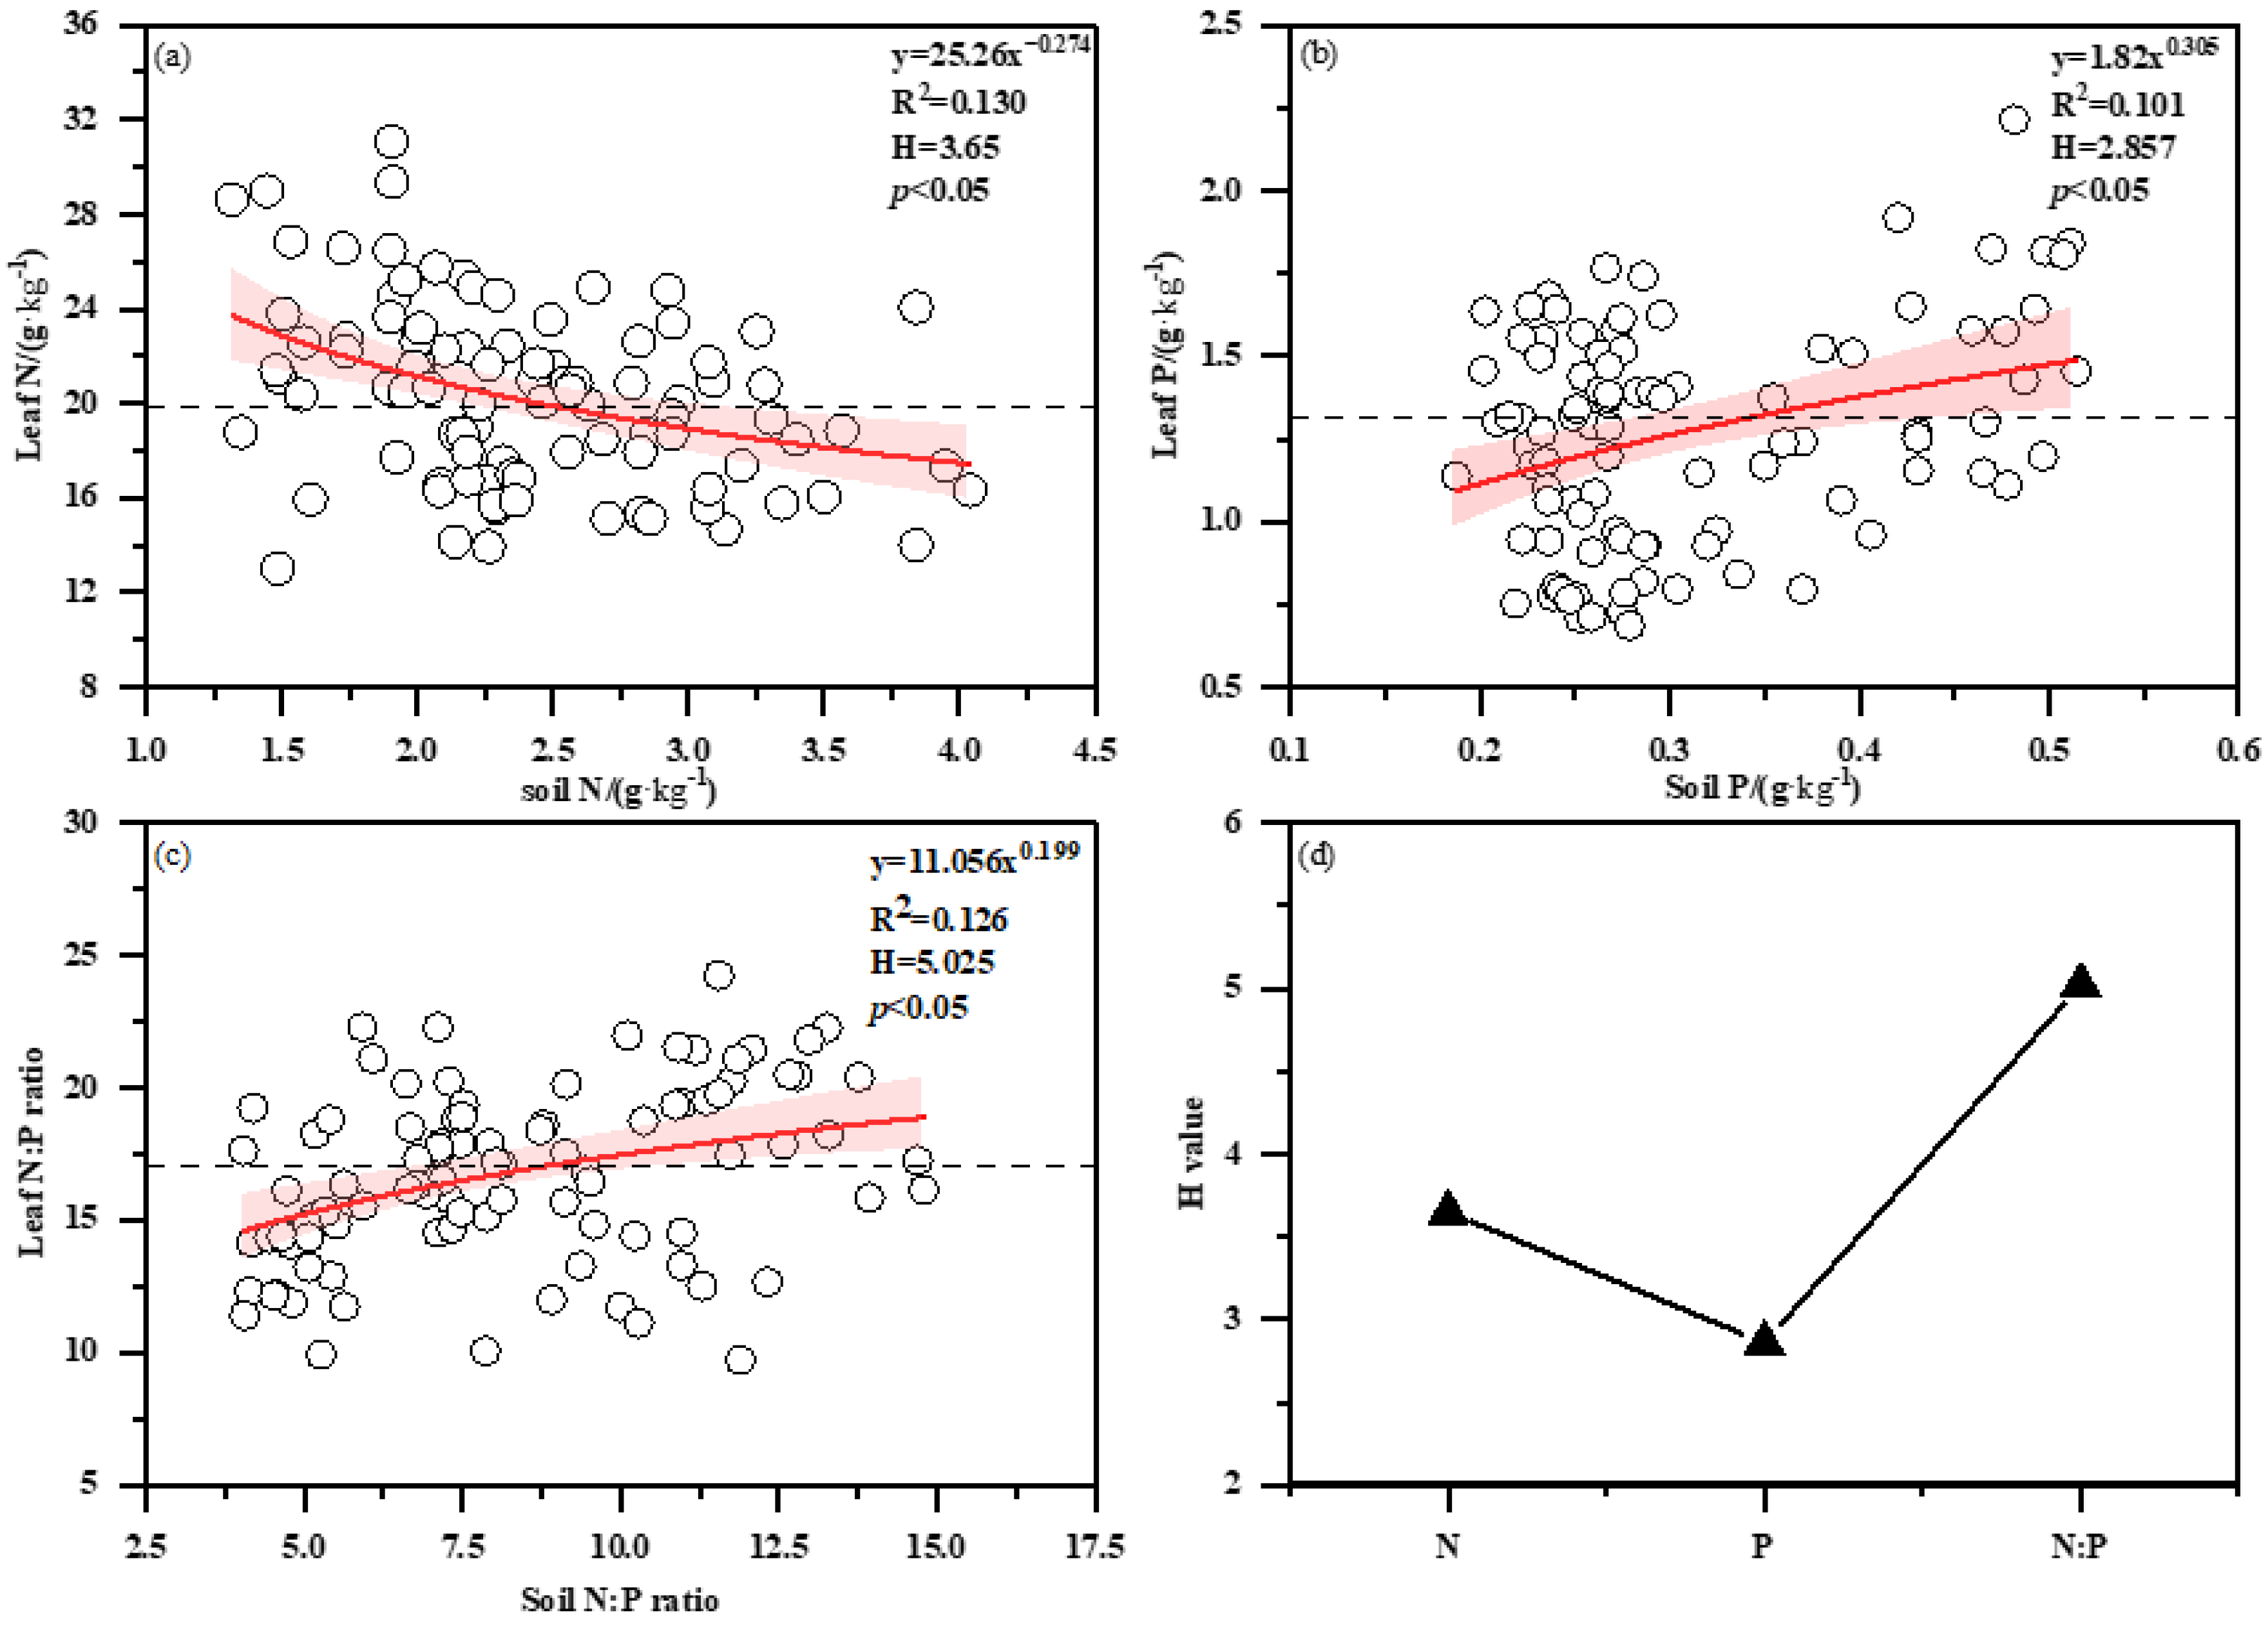
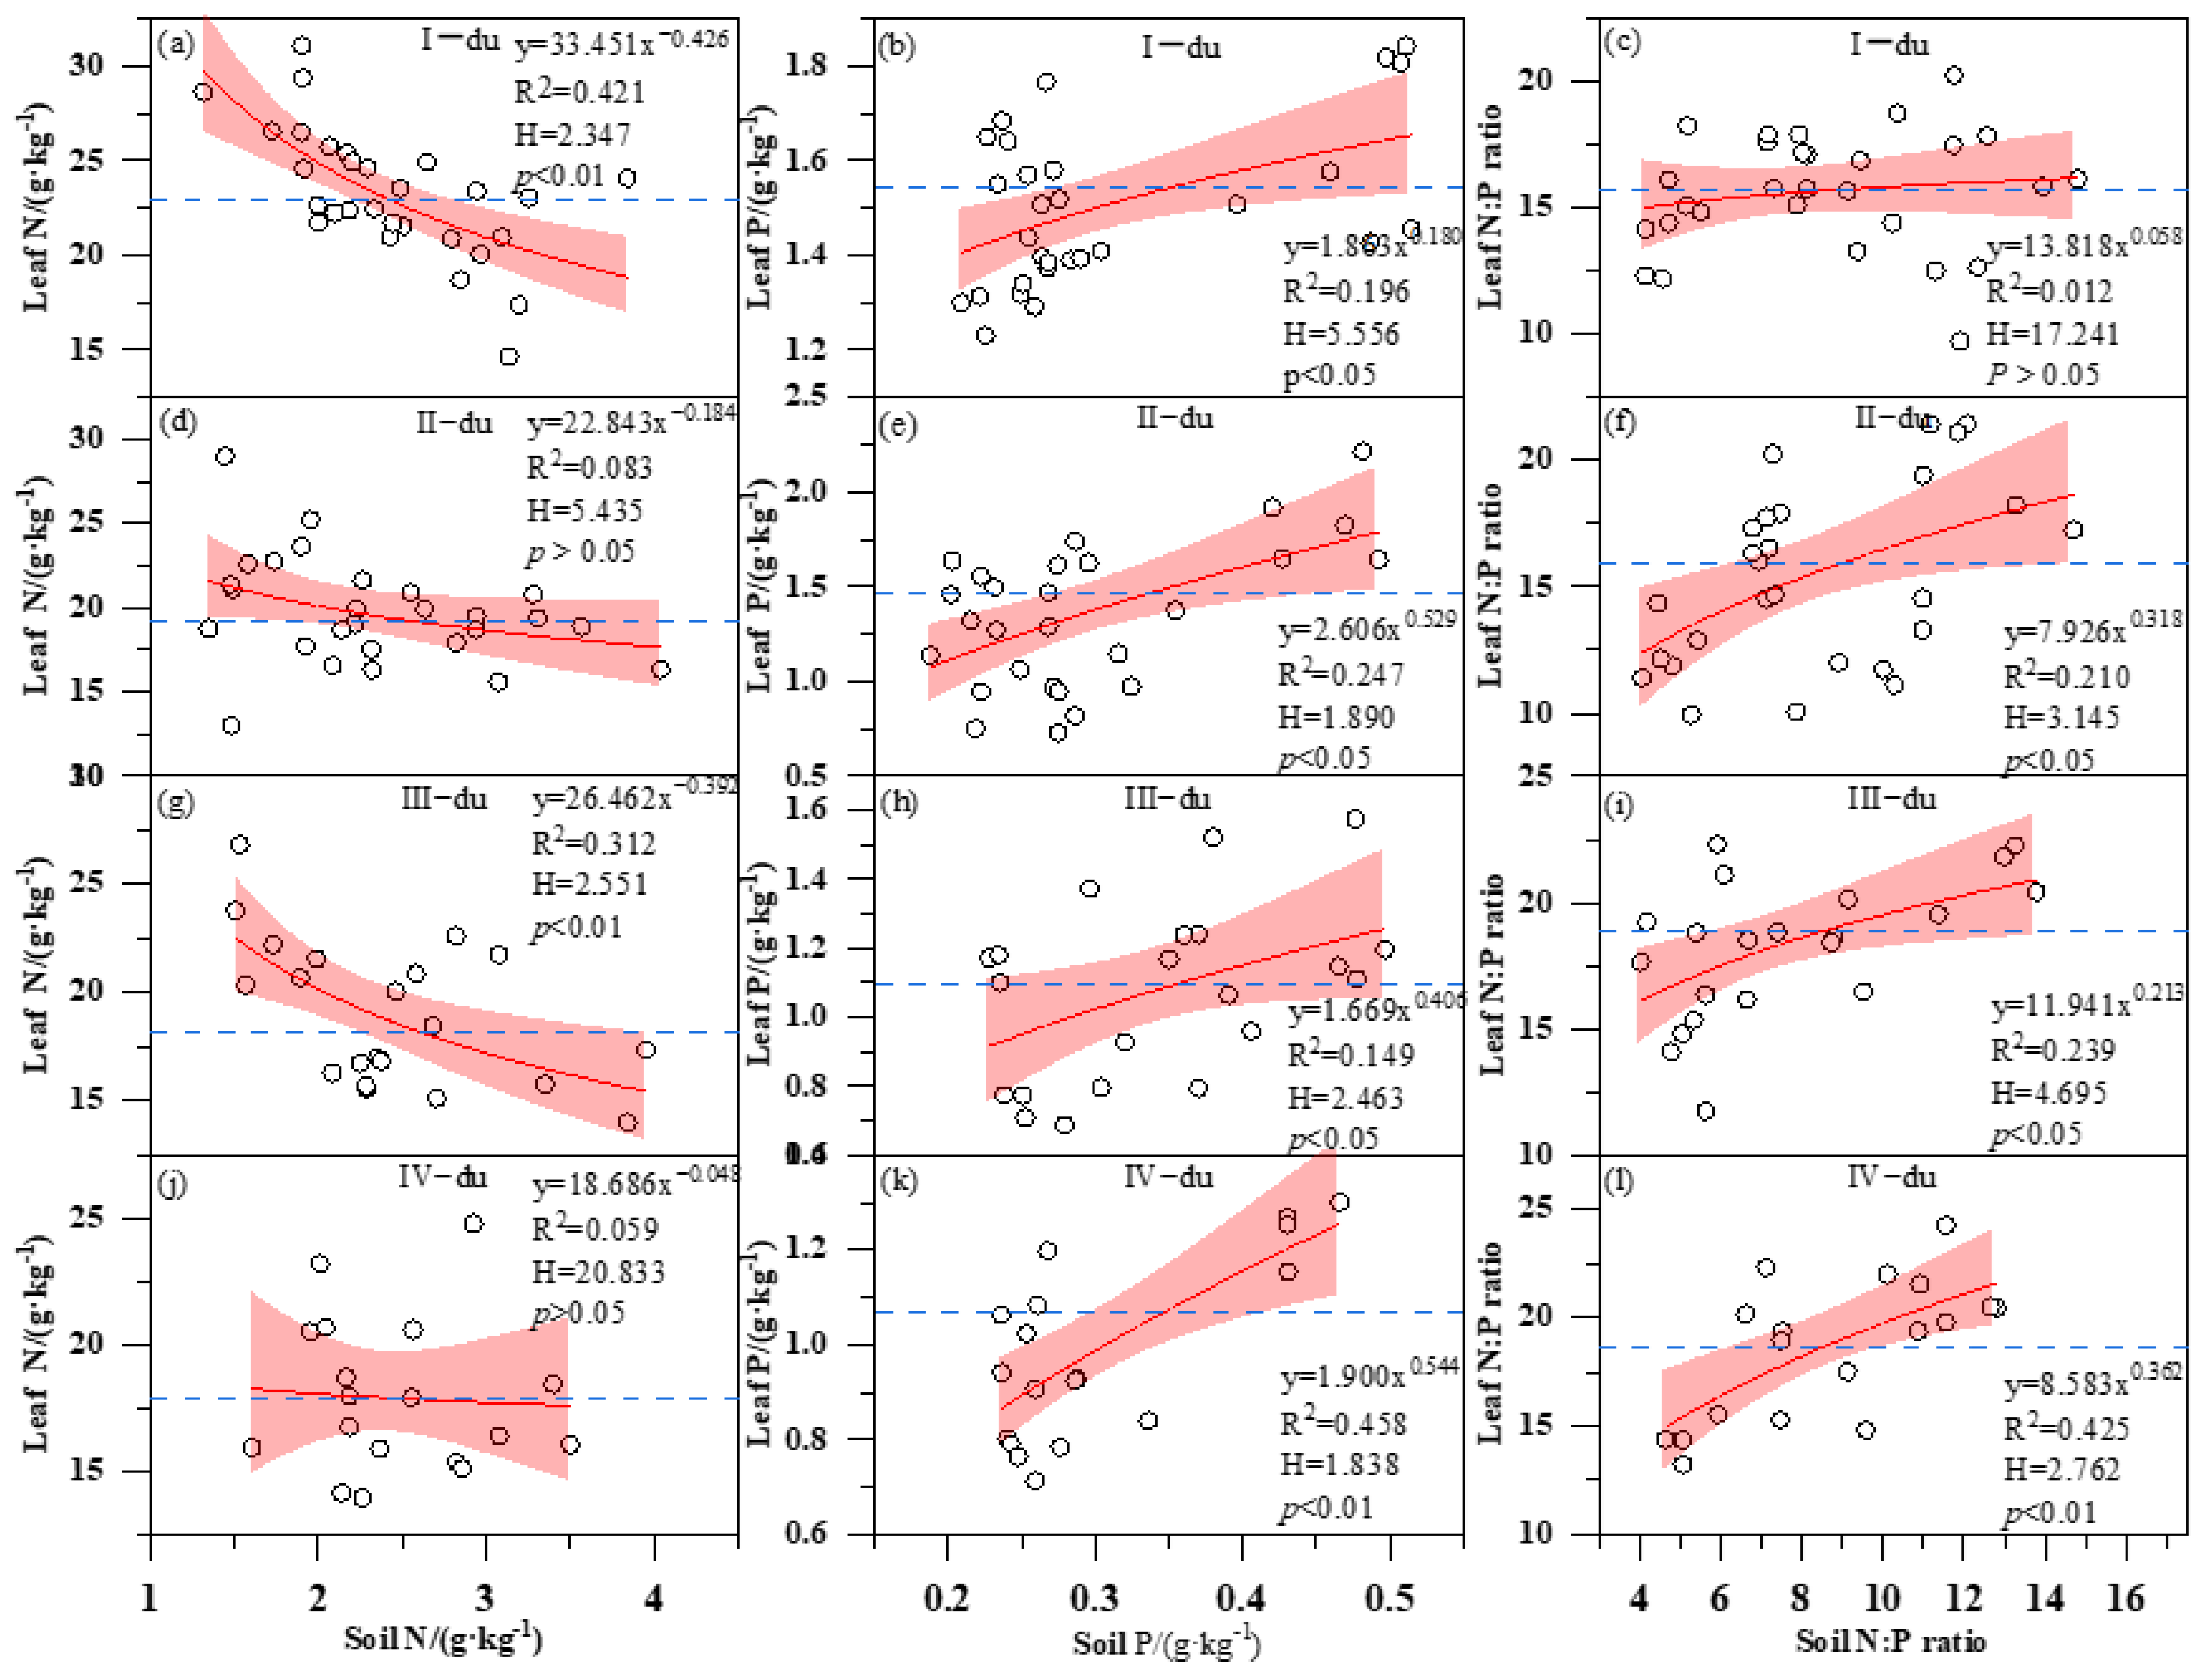
3.3. Correlation Analysis of Soil and Bamboo Plant Nutrients

There were significant relationships between the nutrients in moso bamboo leaves and their local soils (Figure 4). The N concentrations in soil were negatively correlated with N and P concentrations in the I-du and III-du bamboos, but not significantly correlated with other age groups; the P concentration of soil was positively correlated with that of moso bamboo leaves, yet negatively correlated with the N:P ratio in moso bamboo leaves. By contrast, the N:P in soil was negatively correlated with the P concentration in moso bamboo leaves and positively correlated with N:P in Moso bamboo (except for I-du bamboo). In general, the correlations between leaf P and soil nutrients were stronger than those between leaf N and soil nutrients, and as bamboo grew older, the absolute value of the correlation coefficients tended to gradually increase.

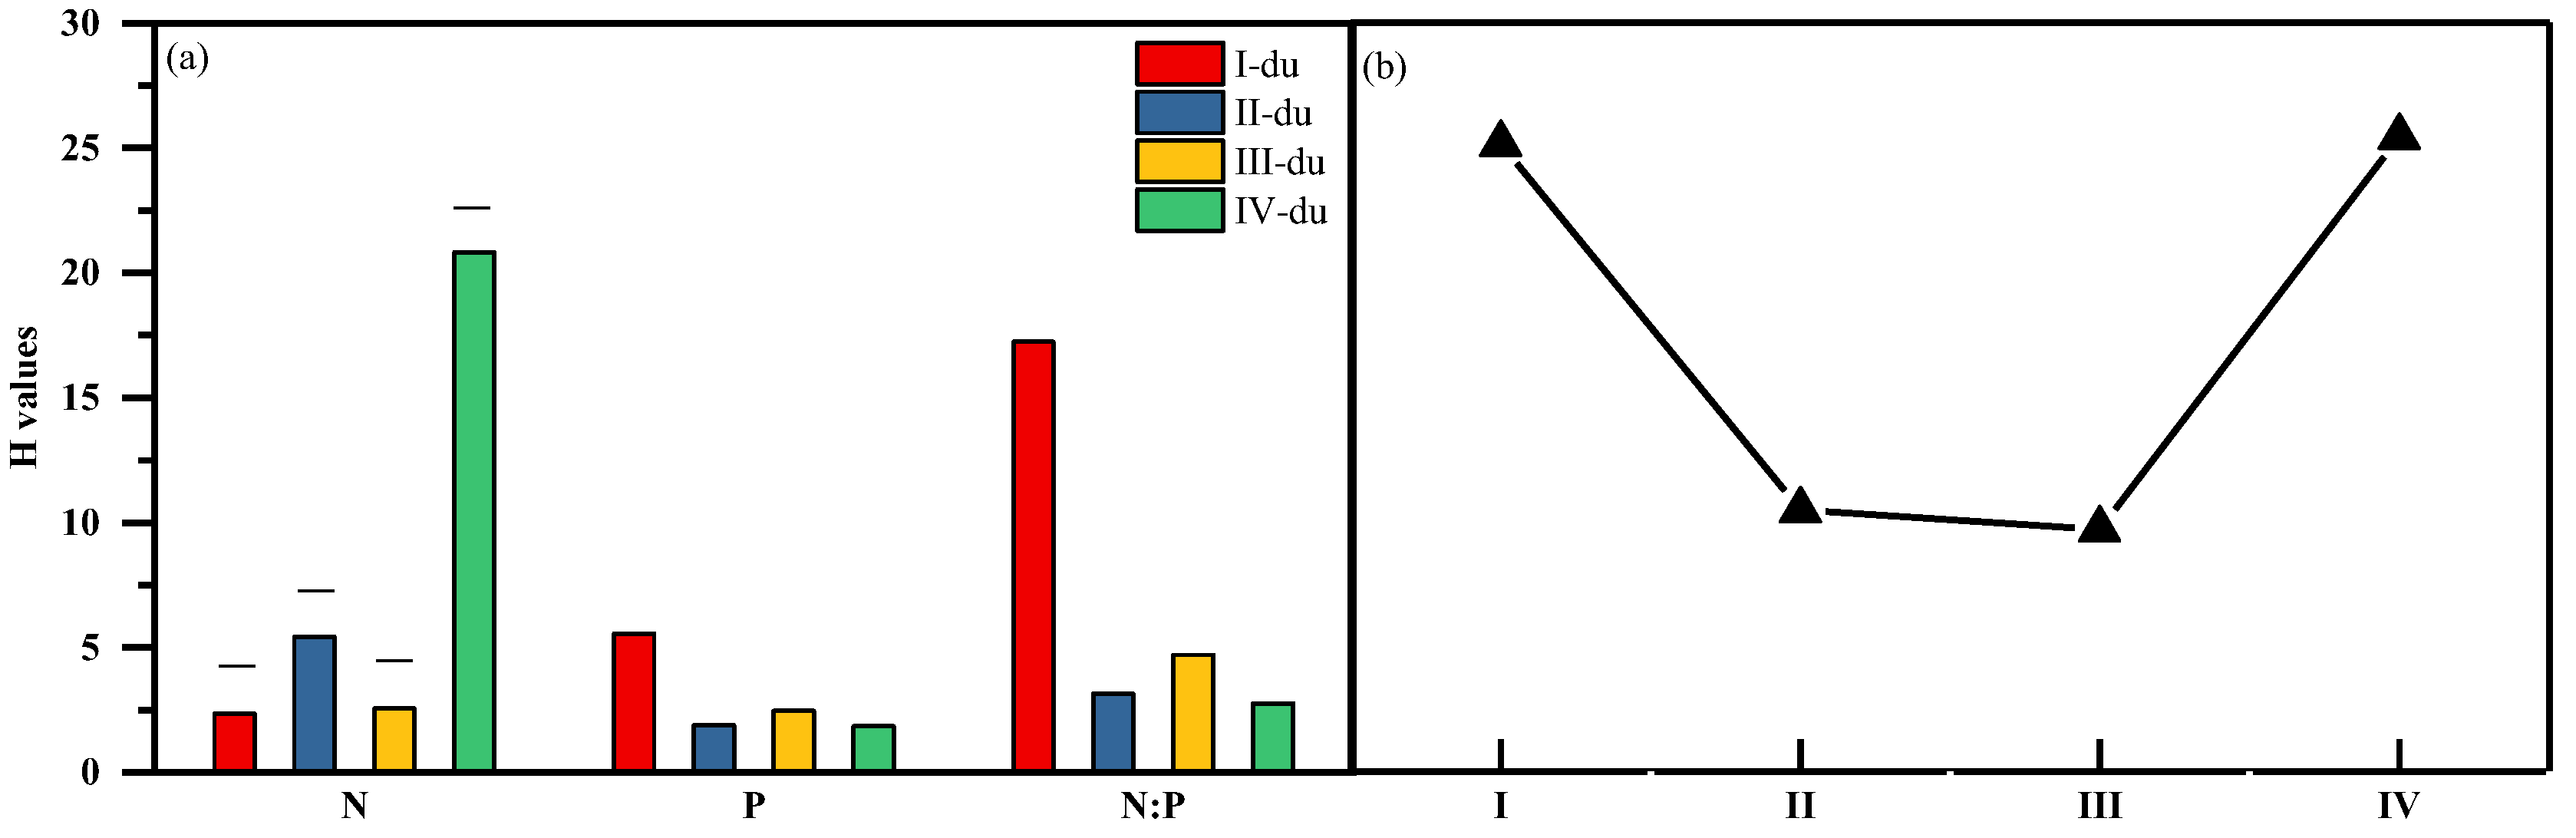
3.4. Variation of H with Bamboo Age

The homeostatic index (H) of different elements is different (Figure 5). Sterner and Elser [3] verified the stability of N and P elements in bamboo leaf samples of different ages. According to the internal stability model, the internal stability indexes of N, P, and N:P of moso bamboo leaves were 3.65, 2.850, and 5.052, respectively, showing HN:P > HN > HP. According to the definition of internal stability, HN:P belongs to steady state, while HN and HP belong to weak steady state.
As seen from Figure 6, with the change in bamboo age, the fitting results of P content in the leaves of Moso bamboo at different ages reached a significant level through the simulation of the steady state model, and the results of N fitting of I-du bamboo and III-du bamboo leaves reached a significant level (p < 0.05). The fitting results of leaf nitrogen content for I-du bamboo and III-du bamboo reach a significant level (p < 0.05). The internal stability index (H) of Moso bamboo leaves changed with the increase of bamboo age (Figure 7). The internal stability indexes of I-du bamboo, II-du bamboo III-du bamboo, and IV-du bamboo were 25.144, 10.470, 9.709, and 25.433, respectively, all greater than 2 (Figure 7b). The HN of Moso bamboo leaves of different ages was greater than 2, and the HN of I-du bamboo leaves was the smallest and the IV-du bamboo was the largest, which was in the dynamic change of ‘weakly homeostatic’ and homeostatic, while the HP of I-du bamboo leaves was the largest (5.446) and the IV-du bamboo was the lowest (1.838), showing the dynamic changes of ‘weakly plastic’, ‘weakly homeostatic’, and homeostatic. The change rule of leaf HN:P with age was consistent with that of HP, and the HN:P was greater than 2, showing ‘weakly homeostatic’ and homeostatic (Figure 7a).

4. Discussion

4.1. Identification of N and P Ecological Stoichiometric Limiting Elements in the Leaves of Bamboo with Different Ages and Ecological Adaptation Strategies

Garnier’s theory, as proposed, indicated a significant positive correlation between the nutrient content in plants and soil, signifying that plant growth was limited by nutrient availability [38]. According to this theory, the study revealed a significant positive correlation between the phosphorus (P) content in moso bamboo leaves and that in the soil. This indicates that the study area is P-limited. Among the findings, the leaf P content of the IV-du bamboo was the lowest, suggesting that it was the most dependent on soil P nutrients. This dependency could stem from the fact that soil is the primary source of phosphorus uptake for terrestrial plants. Moreover, the soil phosphorus content in this area was found to be relatively low [39]. The leaf nitrogen content is less dependent on the soil nitrogen content, this is because plants absorb nitrogen from a wider range of sources, plants cannot only absorb nitrogen from soil, but also obtain nitrogen through atmospheric deposition and even biological nitrogen fixation. Therefore, compared with the leaf phosphorus content, the leaf nitrogen content is more closely related to the characteristics of the species and the history of evolution. For example, previous studies have shown that the influence of environmental factors on leaf phosphorus content is as important as that on the leaf nitrogen content [39]. This finding aligns with the results of our study. According to Koerselman’s theory, a plant’s nitrogen-to-phosphorus (N:P) ratio of less than 14 suggests a relative nitrogen limitation, a ratio greater than 16 indicates phosphorus limitation, and a ratio within the range of 14 to 16 implies that the plant is restricted by both nitrogen and phosphorus [9,40]. This theory has been extensively applied in both aquatic and terrestrial ecosystems. However, the factors influencing the stoichiometric characteristics of plant communities are intricate and closely tied to the specific study area, ecosystem, and types of vegetation. The precise critical threshold for the N:P ratio must be ascertained through rigorous fertilization experiments [10,11]. Cao et al. [41] studied the content of nitrogen (N) and phosphorus (P), as well as the N:P ratio, in the plant-soil system of Chinese fir forests of four different stand ages (3-, 8-, 18-, and 26-year-old stands), indicating that the ecological stoichiometry of leaf nitrogen and phosphorus in Chinese fir forests is closely related to stand age. Therefore, if the critical threshold was used in this study, the average P values of I-du and I- du bamboo leaves were 15.62 and 15.38, respectively, which were limited by both N and P, but less limited by N, while III-du and IV-du were limited by P. In this study, the P content of III-du and I-du bamboo leaves was lower than that of I-du and II du leaves, but N:P was higher than that of I-du and II-du bamboo leaves, indicating that with the increase in bamboo age, the nutrient demand decreased and the utilization efficiency of P was higher than that of N. The growth rate hypothesis suggests that plants with high growth rates require higher levels of phosphorus to support the synthesis of ribosomal RNA, which in turn leads to varying rates of nitrogen and phosphorus accumulation in organisms. This results in changes to the nitrogen-to-phosphorus (N:P) ratio within the organisms [42]. This is consistent with the results of our study. According to the Garnier and Koerselman theories, our study reveals that different age groups of moso bamboo in the Tianbaoyan Nature Reserve in Fujian Province are all limited by phosphorus (P) element. With increasing age, they adapt to environmental stress by enhancing the efficiency of P utilization.

4.2. Stoichiometric Homeostasis of Moso Bamboo Leaves

Ecological stoichiometric internal stability refers to the ability of organisms to actively regulate their elemental composition to maintain relative stability, thereby adapting to external environments. This represents the manifestation of the physiological and biochemical adaptation mechanisms shaped by environmental changes [4,6]. The intrinsic stability of plants, a core concept in ecological stoichiometry, reflects the inherent adaptive mechanisms that plants possess in response to variations in soil nutrient availability [19]. Garnier’s theory, which posits a significant positive correlation between the nutrient content of plants and their soil, implies that plant growth is subject to nutrient limitations. This perspective underscores the idea that the availability of nutrients in the soil directly influences the health and productivity of plant life. When soil nutrient levels are insufficient to meet the demands of plant growth, it can lead to stunted development and reduced biomass production, potentially affecting the overall ecosystem dynamics [38]. The theory is founded on the interaction between plants and soil within a particular environment, representing a synthesis of the inherent characteristics of plant nutrient uptake and the supply of nutrients by the soil [43]. Therefore, there is a close relationship between plant internal stability and nutrient limitation. In this study, the internal stability of Moso bamboo leaves is HN:P > HN > HP. The nitrogen fixation characteristics of moso bamboo made it obtain sufficient N in hilly region of red soil with N deficiency, and its leaf N content was less affected by the change of soil nutrient content, which was relatively stable. Although the leaves P content of moso bamboo is greatly affected by soil nutrient content, its N:P content is basically not affected by soil P content, showing strong internal stability. The reasons may be as follows: (1) Moso bamboo has a strong ability of nutrient regulation, which may be the result of its adaptation to barren environment in the process of long-term evolution. (2) Moso bamboo is a typical clonal plant, which has strong resource integration ability to ensure the balance of leaf stoichiometric ratio. The increase in N concentration in plant tissue is generally accompanied by the increase in P concentration. A higher HN:P ratio signifies that the fluctuations in nitrogen (N) and phosphorus (P) within the leaves of moso bamboo are relatively minor compared to other elements. This consistency in the uptake of N and P throughout the growth process suggests that the bamboo employs a conservative nutrient utilization strategy. This strategy contributes to its stable growth in complex environments [3]. The coefficient of variation of N mass fraction and P mass fraction were 16.50 and 20.63, which were consistent with the conclusion of Vitousek et al. [44] suggested that the nitrogen (N) content in plants should exhibit more stability compared to other elements, reflecting that the nitrogen element was relatively stable in the leaves of moso bamboo. Chen et al. [45] conducted studies that demonstrated nitrogen (N) in plants is more stable than phosphorus (P). This stability is attributed to the fact that nitrogen content in plants is primarily regulated by biological factors, whereas phosphorus content is influenced by a combination of biotic and abiotic factors.
Age also has a certain effect on the stoichiometric homeostasis of plant organs. As far as N is concerned, the HN of moso bamboo leaves of all ages is greater than 2, which means that the leaves of Moso bamboo of all ages move in the range of ‘weakly homeostatic’ and homeostatic, and are less affected by the elements of soil N, mainly because the symbiotic nitrogen fixation of moso bamboo. In terms of P content, the stoichiometric homeostasis of Moso bamboo leaves showed ‘weakly plastic’, ‘weakly homeostatic’ and homeostatic of dynamic change, which means that moso bamboo responded greatly to the change in P in the soil in this area. The leaves of each sample were heterogeneous when absorbing and storing P, and I-du bamboo grew rapidly, so it could cope with environmental stress by storing P element. Although the phosphorus (P) content in the leaves of Moso bamboo is significantly influenced by soil nutrient levels, the nitrogen-to-phosphorus (N:P) ratio remains unaffected by soil phosphorus content, demonstrating robust internal stability. The highest high nitrogen-to-phosphorus (HN:P) ratio was observed in I-du bamboo, which contradicts previous studies suggesting that internal stability increases with the advancement of the plant’s regulatory systems and developmental stages [18]. It may be because moso bamboo is a typical clonal plant with strong physiological integration, which has a certain effect on nutrient utilization and chemical balance. Therefore, the ability to regulate the homeostasis of Moso bamboo at different ages makes it grow well in the changeable environment, has stronger adaptability and competitiveness, and the internal stability of I-du bamboo was higher than that of other ages, which may be one of the reasons for its successful expansion.
In this study, the homeostasis of plant leaves was closely related to the type and degree of nutrient limitation. The supply of soil nutrients affects the homeostasis of plants. Therefore, the stoichiometric homeostasis of plants is not only influenced by factors such as species, organs, types of elements, and growth stages [46], but it is also related to the type and extent of nutrient limitations in the soil.

5. Conclusions

In this study, it was shown that the dependence of moso bamboo on soil nutrients and the regulation ability of soil nutrient elements were affected by age. The main results are as follows:
(1)
Under the condition of the same soil nutrients (N, P), the content of N and P in bamboo leaves decreased significantly with the increase in bamboo age, indicating that I-du bamboo accumulated more nutrients for rapid growth and development.
(2)
Under the condition of a lack of nitrogen and phosphorus in soil, the limiting effect of phosphorus on the growth and development of moso bamboo was greater than that of nitrogen, and the limiting effect of phosphorus on aged bamboo was greater than that of young bamboo.
(3)
In this study area, the stoichiometric homeostasis index(H) of N and P of moso bamboo leaves is HN:P > HN > HP, which means that the homeostasis of bamboo is closely related to the limiting elements.
In summary, the ability to regulate the homeostasis of moso bamboo at different ages makes it grow well in the changeable environment, has stronger adaptability and competitiveness, and the internal stability of I-du bamboo was higher than that of other ages, which may be one of the reasons for its successful expansion. Since the study area is a red soil region deficient in phosphorus (P), attention should be paid to the supply of soil phosphorus (P) during the management process. However, whether the transport of nutrients will affect the ability of bamboo to regulate the balance of elements in the body remains to be further verified. The nutrient transport mechanism of moso bamboo was discussed by isotope labeling technology to provide better support for the accurate cultivation of bamboo forests.

Author Contributions

Conceptualization, J.S. and G.L.; data curation J.S.; formal analysis J.S.; investigation J.S. and J.Z.; funding acquisition, J.S.; project administration, J.S., G.L. and S.F.; visualization, J.S.; writing—original draft, J.S.; writing—review and editing, J.S., J.Z., G.L. and S.F. All authors have read and agreed to the published version of the manuscript.

Funding

This research was funded by the Fujian College of Water Conservancy and Electric Power of high-level talent research project (BLYJRC22004) and the special research fund of the International Centre for Bamboo and Rattan (1632021021, 1632023002).

Data Availability Statement

The data are contained within the article.

Acknowledgments

We thank anonymous reviewers for their helpful comments, which improved the manuscript.

Conflicts of Interest

The authors declare no conflicts of interest.

References

  1. Sundareshwar, P.V.; Morris, J.T.; Koepfler, E.K.; Fornwalt, B. Phosphorus limitation of coastal ecosystem processes. Science 2003, 299, 563. [Google Scholar] [CrossRef]
  2. Andersen, T.; Elser, J.J.; Hessen, D.O. Stoichiometry and population dynamics. Ecol. Lett. 2004, 7, 884–900. [Google Scholar] [CrossRef]
  3. Sterner, R.W.; Elser, J.J. Ecological Stoichiometry: The Biology of Elements from Molecules to the Biosphere; Princeton University Press: Princeton, NJ, USA, 2002; pp. 225–226. [Google Scholar]
  4. Kooijman, S.A.L.M. The stoichiometry of animal energetics. J. Theor. Biol. 1998, 177, 139–149. [Google Scholar] [CrossRef]
  5. Hessen, D.O.; Agren, G.I.; Anderson, T.R.; Elser, J.J.; De Ruiter, P.C. Carbon, sequestration in ecosystems: The role of stoichiometry. Ecology 2004, 85, 1179–1192. [Google Scholar] [CrossRef]
  6. Elser, J.J.; Fagan, W.F.; Kerkhoff, A.J.; Swenson, N.G.; Enquist, B.J. Biological stoichiometry of plant production: Metabolism, scaling and ecological response to global change. New Phytol. 2010, 186, 593–608. [Google Scholar] [CrossRef]
  7. Elser, J.J.; Bracken, M.E.S.; Cleland, E.E.; Gruner, D.S.; Harpole, W.S.; Hillebrand, H.; Ngai, J.T.; Seabloom, E.W.; Shurin, J.B.; Smith, J.E. Global analysis of nitrogen and phosphorus limitation of primary producers in freshwater, marine and terrestrial ecosystems. Ecol. Lett. 2007, 10, 1135–1142. [Google Scholar] [CrossRef]
  8. Wang, K.; Li, Y.H.; Jiang, T.; Yao, H.J.; Zhang, S.T. Effects of drought stress on N and P stoichiometry and allocation of poplar seedlings. Chin. J. Ecol. 2017, 36, 3116–3122. [Google Scholar]
  9. Koerselman, W.; Meuleman, A.M.F. The vegetation N:P ratio: A new tool to detect the nature of nutrient limitation. J. Appl. Ecol. 1996, 33, 1441–1450. [Google Scholar] [CrossRef]
  10. Güsewell, S. N: P ratios in terrestrial plants: Variation and functional significance. New Phytol. 2004, 164, 243–266. [Google Scholar] [CrossRef]
  11. Zhang, L.X.; Bai, Y.F.; Han, X.G. Differential responses of N:P stoichiometry of Leymus chinensis and Carex korshinskyi to N additions in a steppe ecosystem in Nei Mongol. Acta Bot. Sin. 2004, 46, 259–270. [Google Scholar]
  12. Han, W.X.; Fang, J.Y.; Guo, D.L.; Zhang, Y. Leaf nitrogen and phosphorus stoichiometry across 753 terrestrial plantspecies in China. New Phytol. 2005, 168, 377–385. [Google Scholar] [CrossRef]
  13. Persson, J.; Kato, S. To be or not to be what you eat: Regulation of stoichiometric homeostasis among autotrophsand heterotrophs. Oikos 2010, 119, 741–751. [Google Scholar] [CrossRef]
  14. Rhee, G.Y. Effects of N: P atomic ratios and nitrate limitation on algal growth, cell composition, and nitrate uptake. Limnol. Oceanogr. 1978, 23, 10–25. [Google Scholar] [CrossRef]
  15. Makino, W.; Cotner, J.B.; Sterner, R.W.; Elser, J.J. Are bacteria more like plants or animals? Growth rate and resource dependence of bacterial C:N:P stoichiometry. Funct. Ecol. 2003, 17, 121–130. [Google Scholar] [CrossRef]
  16. Cernusak, L.A.; Winter, K.; Turner, B.L. Leaf nitrogen to phosphorus ratios of tropical trees: Experimental assessment of physiological and environmental controls. New Phytol. 2009, 185, 770–779. [Google Scholar] [CrossRef]
  17. Matzek, V.; Vitousek, P.M. N:P stoichiometry and protein:RNA ratios in vascular plants: An evaluation of the growth-rate hypothesis. Ecol. Lett. 2009, 12, 765–771. [Google Scholar] [CrossRef] [PubMed]
  18. Yu, Q.; Elser, J.J.; He, N.P.; Wu, H.H.; Chen, Q.S.; Zhang, G.M.; Han, X.G. Stoichiometric homeostasis of vascular plants in the Inner Mongolia grassland. Oecologia 2011, 166, 1–10. [Google Scholar] [CrossRef]
  19. Yu, Q.; Chen, Q.S.; Elser, J.J.; Cease, A.; He, N.P.; Wu, H.H.; Zhang, G.M.; Wu, J.G.; Bai, Y.F.; Han, X.G. Linking stoichiometric homeostasis with ecosystem structure, functioning, and stability. Ecol. Lett. 2010, 13, 1390. [Google Scholar] [CrossRef] [PubMed]
  20. Jiang, L.L.; Zeng, C.S.; Shao, J.J.; Zhou, X.H. Plant nutrient dynamics and stoichiometric homeostasis of invasive species Spartina alterniflora and native Cyperus malaccensis var.brevifolius in the Minjiang River estuarine wetlands. Chin. J. PlantEcol. 2017, 41, 450–460. [Google Scholar]
  21. Frost, P.C.; Elser, J.J. Growth responses of littoral mayflies to the phosphorus content of their food. Ecol. Lett. 2002, 5, 232–240. [Google Scholar] [CrossRef]
  22. Yen, T.M.; Lee, J.S. Comparing Aboveground Carbon Sequestration between Moso Bamboo (Phyllostachys heterocycla) and China Fir (Cunninghamia lanceolata) Forests Based on the Allometric Model. For. Ecol. Manag. 2011, 261, 995–1002. [Google Scholar] [CrossRef]
  23. Liu, G.L.; Fan, S.H.; Cai, C.J.; Zhang, C.S.; Guan, F.Y. Soil Anti-erodibility Under Moso Bamboo with Different Mixture Patterns. Bull. Soil Water Conserv. 2015, 35, 12–17. [Google Scholar]
  24. Feng, P.F.; Li, Y.M. China’s Bamboo Resources in 2021. World Bamboo Ratt. 2023, 21, 100–103. [Google Scholar]
  25. Zhao, J.; Wang, B.; Li, Q.; Yang, H.; Xu, K. Analysis of soil degradation causes in Phyllostachys edulis forests with different mulching years. Forests 2018, 9, 149. [Google Scholar] [CrossRef]
  26. Sun, H.Y.; Wang, J.F.; Hui, L.; Li, T.K.; Gao, Z.M. Advancements and challenges in bamboo breeding for sustainable development. Tree Physiol. 2023, 43, 1705–1717. [Google Scholar] [CrossRef]
  27. Guan, F.; Xia, M.; Tang, X.; Fan, S. Spatial variability of soil nitrogen, phosphorus and potassium contents in moso bamboo forests in Yong’an City, China. Catena 2017, 150, 161–172. [Google Scholar] [CrossRef]
  28. Su, W.; Liu, B.; Liu, X.; Li, X.; Ren, T.; Cong, R.; Lu, J. Effect of depth of fertilizer banded-placement on growth, nutrient uptake and yield of oil seed rap (Brassicanapuw L.). Eur. J. Agron. 2015, 62, 38–45. [Google Scholar] [CrossRef]
  29. Chen, Z.; Wang, H.; Liu, X.; Liu, Y.; Gao, S.; Zhou, J. The effect of N fertilizer placement on the fate of urea-15N and yield of winter wheat in southeast China. PLoS ONE 2016, 11, e0153701. [Google Scholar] [CrossRef] [PubMed]
  30. Chu, H.; Su, W.; Zhou, Y.; Wang, Z.; Long, Y.; Sun, Y.; Fan, S. Enzyme Activity Stoichiometry Suggests That Fertilization, Especially Nitrogen Fertilization, Alleviates Nutrient Limitation of Soil Microorganisms in Moso Bamboo Forests. Forests 2024, 15, 1040. [Google Scholar] [CrossRef]
  31. Zhao, J.C.; Su, W.H.; Fan, S.H.; Cai, C.J.; Su, H.R.; Zeng, X.L. Ammonia volatilization and nitrogen runoff losses from moso bamboo forests under different fertilization practices. Can. J. Forest Res. 2019, 49, 213–220. [Google Scholar] [CrossRef]
  32. Lu, Q.F.; Lin, S.P.; Liu, S.H.; Zheng, X.; Bi, Y.F.; Xiao, Z.Z.; Jiang, J.; Wang, A.K.; Du, X.H. Meta-analysis of the effect of fertilization on the yield of Phyllostachys edulis forest. J. Nanjing For. Univ. Nat. Sci. Ed. 2024, 48, 88–96. [Google Scholar]
  33. Tang, X.; Fan, S.; Qi, L.; Guan, F.; Du, M.; Zhang, H. Soil respiration and net ecosystem production in relation to intensive management in moso bamboo forests. Catena 2016, 137, 219–228. [Google Scholar] [CrossRef]
  34. Sparks, D.L.; Page, A.L.; Helmke, P.A.; Loeppert, R.H. (Eds.) Methods of Soil Analysis. Part 3: Chemical Methods; Soil Science Society of America and American Society of Agronomy: Madison, WI, USA, 1996; pp. 1085–1121. [Google Scholar]
  35. Kuo, S. Phosphorus. In Methods of Soil Analysis. Part 3: Chemical Methods; Sparks, D.L., Page, A.L., Helmke, P.A., Loeppert, R.H., Eds.; Soil Science Society of America and American Society of Agronomy: Madison, WI, USA, 1996; pp. 891–893. [Google Scholar]
  36. Bao, S.D. Soil Agricultural Chemistry Analysis; Agriculture Press: Beijing, China, 2000. [Google Scholar]
  37. Zheng, J.Y.; Shao, M.A.; Zhang, X.C. Spatial Variation of Surface Soil’s Bulk Density and Saturated Hydraulic Conductivity on Slope in Loess Region. J. Soil Water Conserv. 2004, 3, 53–56. [Google Scholar]
  38. Garnier, E. Interspecific Variation in Plasticity of Grasses in Response to Nitrogen Supply; Cambridge University Press: Cambridge, UK, 1998; pp. 155–181. [Google Scholar]
  39. Luo, X.; Keenan, T.F.; Chen, J.M.; Croft, F.; Prentice, I.C.; Smith, N.G.; Walker, A.P.; Wang, H.; Wang, R.; Xu, C.G.; et al. Global variation in the fraction of leaf nitrogen allocated to photosynthesis. Nat. Commun. 2021, 12, 4866. [Google Scholar] [CrossRef] [PubMed]
  40. Güsewell, S.; Koerselman, W. Variation in nitrogen and phosphorus concentrations of wetland plants. Perspect. Plant Ecol. Evol. Syst. 2002, 5, 37–61. [Google Scholar] [CrossRef]
  41. Cao, J.; Yan, W.; Farooq, T.H.; Chen, X.; Wang, J.; Yuan, C.; Qi, Y.; Khan, K.A. Ecological Stoichiometry of N and P across a Chronosequence of Chinese Fir Plantation Forests. Forests 2023, 14, 1685. [Google Scholar] [CrossRef]
  42. Elser, J.J.; Sterner, R.; Gorokhova, E.; Fagan, W.F.; Markow, T.A.; Cotner, J.B.; Weider, L.W. Biological stoichiometry from genes to ecosystems. Ecol. Lett. 2000, 3, 540–550. [Google Scholar] [CrossRef]
  43. Fan, X.Y. Spatial Variation in Nutrient of Dominant Plant and Ecological Stoichiometry from Laohu Gou of Qilian Mountain. Master Thesis, Lanzhou University, Lanzhou, China, 2012. [Google Scholar]
  44. Vitousek, P.M. Nutrient limitation to nitrogen fixation in young volcanic sites. Ecosystems 1999, 2, 505–510. [Google Scholar] [CrossRef]
  45. Chen, Y.H.; Han, W.X.; Tang, L.Y.; Tang, Z.Y.; Fang, J.Y. Leaf nitrogen and phosphorus concentrations of woody plants differ in responses to climate, soil and plant growth form. Ecography 2013, 36, 178–184. [Google Scholar] [CrossRef]
  46. Zeng, Y.; Fang, Y.; Wang, X.; Tang, Y. Stoichiometric and nutrient resorption characteristics of dominant tree species in subtropical Chinese forests. Ecol. Evol. 2017, 7, 11033–11043. [Google Scholar] [CrossRef]
Figure 1. Location of the study area and the layout of the experimental plots.
Forests 15 01181 g001
Figure 2. Leaf N (a), P (b), N:P (c), and their coefficient in variation (CV) (d) of different-aged moso bamboo. I, II, III, and IV represent 1, 2–3, 4–5, and >6 years, respectively. Different lowercase letters indicate significant differences among the means of the different ages (at the p < 0.05 level).
Forests 15 01181 g002
Figure 3. Nitrogen (N), phosphorus (P), available nitrogen (HN), and available phosphorus (AP) content and N:P ratio in the soil of Moso bamboo at different ages. I, II, III, and IV represent 1, 2–3, 4–5, and >6 years. (af) respectively represent soil organic carbon content, soil nitrogen (N) content, soil phosphorus (P) content, soil available nitrogen (HN) content, soil available phosphorus (AP) content, and the soil nitrogen to phosphorus ratio (N:P).
Forests 15 01181 g003
Figure 4. The correlation coefficients between soil and plants in their nitrogen (N) and phosphorus (P) concentrations. Red represents a positive correlation and green represents a negative correlation. * Indicates a significant correlation at the p < 0.05 level; ** indicates a significant correlation at the p < 0.01 level.
Forests 15 01181 g004
Figure 5. The homeostatic index (H) of N, P, and N:P values of Moso bamboo leaves. (ac) Represent the fitting relationship between soil N, P, N/P ratio and N, P, N/P ratio of bamboo leaves. (d) represents the H values of N, P and N:P ratio of moso bamboo leaves. The pink area is the fitting function and its confidence interval values. The solid red line shows the fit of the homeostatic index of Moso bamboo leaves.
Forests 15 01181 g005
Figure 6. Fitting of the nutrient content of bamboo leaves at different ages to soil nutrient content. The pink area is the fitting function and its confidence interval values. The solid red line shows the fit of the homeostatic index of moso bamboo leaves. I, II, III, and IV represent 1, 2–3, 4–5, and >6 years. (al) Represent the fitting relationship between soil N, P, N/P ratio and N, P, N/P ratio of bam-boo leaves.
Forests 15 01181 g006
Figure 7. The homeostatic index (H) for different element and ages. I, II, III, and IV represent 1, 2–3, 4–5, and >6 years. The ‘–‘ above column diagrams denotes H values < 0. (a) different element (b) different ages.
Forests 15 01181 g007
Table 1. Basic characteristics of the transects.
Transect No.Density (Trees·hm−2)Mean DBH (cm)Slope (°)Aspect
1188010.3011NE
227079.2010NE
315698.6011NE
490011.8920SW
596010.7015SW
6110010.2025SW
721429.1825NE
823659.9515NW
9259710.7115SE
The values are the means; 1–9 represent the nine test transects.
Disclaimer/Publisher’s Note: The statements, opinions and data contained in all publications are solely those of the individual author(s) and contributor(s) and not of MDPI and/or the editor(s). MDPI and/or the editor(s) disclaim responsibility for any injury to people or property resulting from any ideas, methods, instructions or products referred to in the content.

