Article

Root Signaling Substances Regulate Carbon Allocation Mechanism in the Plant and Soil of Peatlands under Permafrost Degradation

1
College of Geographical Sciences, Harbin Normal University, Harbin 150025, China
2
Heilongjiang Wuyiling Wetland Ecosystem National Observation and Research Station, Yichun 153000, China
*
Author to whom correspondence should be addressed.
Forests 2024, 15(7), 1199; https://doi.org/10.3390/f15071199
Submission received: 6 June 2024 / Revised: 27 June 2024 / Accepted: 3 July 2024 / Published: 11 July 2024
(This article belongs to the Section Forest Soil)

Abstract

:
As the regulator of water and nutrient changes in the active layer after permafrost degradation, root signaling substances affect the plant–soil carbon allocation mechanism under climate warming, which is a key issue in the carbon source/sink balance in permafrost regions. To explore how plant root signaling substances regulate carbon allocation in plants and soils under permafrost degradation, the changes in carbon allocation and root signaling substances in the plants and soils of peatland in different permafrost regions at the time of labeling were studied by in situ 13C labeling experiments. The results showed that the fixed 13C of Larix gemlini, Carex schumidtii, and Sphagnum leaves after photosynthesis was affected by permafrost degradation. In regions with more continuous permafrost, the trend of the L. gemlini distribution to underground 13C is more stable. Environmental stress had little effect on the 13C accumulation of Vaccinium uliginosum. Nonstructural carbohydrates, osmotic regulatory substances, hormones, and anaerobic metabolites were the main root signaling substances that regulate plant growth in the peatlands of the three permafrost regions. The allocation of carbon to the soil is more susceptible to the indirect and direct effects of climate and environmental changes, and tree roots are more susceptible to environmental changes than other plants in isolated patches of permafrost regions. The physical properties of the soil are affected by climate change, and the allocation of carbon is regulated by hormones and osmotic regulators while resisting anoxia in the sporadic regions of permafrost. Carbon allocation in discontinuous permafrost areas is mainly regulated by root substances, which are easily affected by the physical and chemical properties of the soil. In general, the community composition of peatlands in permafrost areas is highly susceptible to environmental changes in the soil, and the allocation of carbon from the plant to the soil is affected by the degradation of the permafrost.

1. Introduction

Permafrost is one of the world’s most important soil carbon reservoirs, accounting for about 60% of the Earth’s terrestrial carbon pool and more than twice the amount currently stored in the atmosphere [1,2]. In the context of climate warming, the balance between sources and carbon sinks in permafrost regions is a key issue [1]. Longer growing seasons and higher temperatures in permafrost regions are expected to drive productivity gains (increased carbon sinks), which are partially offset by changes in soil moisture, physical and chemical properties, and increased soil respiration (increased carbon sources) as a result of permafrost degradation [2,3,4,5]. Tundra and coniferous forest are the main types of permafrost regions, which are mainly distributed in the middle and high latitudes of the northern hemisphere [1]. Due to the influence of climate warming, the Arctic tundra shrub has expanded in recent years, affecting the carbon balance of the permafrost region by improving the carbon absorption of the ecosystem [6]. At the same time, the study of the carbon cycle in Canada and the Tibetan Plateau after the thawing of the permafrost shows that the ecosystem in the permafrost region is transforming from a carbon sink to a carbon source [7,8]. As the southern boundary of the Eurasian permafrost zone, Xing’an Mountains is characterized by the interphase distribution of different permafrost types (including isolated patches of a permafrost zone, sporadic permafrost zone, and discontinuous permafrost zone). It has a high forest coverage rate and is dominated by mixed coniferous forest, rich vegetation types, and a wide distribution of peatlands, and is very sensitive to climate change [9,10]. As the main distribution area for discontinuous and island permafrost, peatland is easily affected by permafrost degradation, which causes plant stress and affects productivity [11,12]. Meanwhile, carbon sequestration by plants is an important carbon cycle process in peatlands [13,14]. Plants are important sources of organic carbon in the soil as they absorb CO2 to form photosynthetic carbon from plants and then transport it to the soil [15,16]. Changes in the composition of the vegetation community alter the carbon balance of ecosystems by affecting soil–plant interactions [6]. Therefore, the study of the plant–soil carbon allocation mechanism under permafrost degradation is a key issue regarding the carbon source/sink balance under climate change, which will contribute to the study of carbon cycles in permafrost regions.
Dynamic changes in root signaling substances can reflect the above-ground growth relationship of plants, regulate the redistribution and utilization of photosynthetic products (13C, soluble sugar, and starch) in different organs, and ultimately determine the growth strategy of plants and their productivity [17,18,19]. Plant organs use carbon for growth, defense, storage, and respiration [20,21]. Soluble sugar and starch are the main products of plant photosynthesis, and their content represents the formation and transformation process of carbohydrates in plants [22]. At the same time, the degradation of permafrost easily causes the plants in the peatland to be stressed. The physiological mechanism of plant growth in different permafrost areas under environmental stress can be explored through the physiological indexes of hormones, the anaerobic metabolism process, osmotic regulation substances, and the antioxidant system of plant root tissue [23,24,25]. Plants have a set of mechanisms for dealing with the damage caused by destructive substances in the body when dealing with stress. Hormones are important signaling molecules that respond first [26]. The interaction of ethylene, abscisic acid, and gibberellin is an important factor affecting the subflooding tolerance of plants [27]. The increase in ethylene content is the upstream signaling molecule that allows for most plants to cope with flood stress [26]. Abscisic acid is one of the important signal substances involved in plant stress resistance. It is involved in the transport process of photosynthates and plays a role in the regulation of stomatal opening in the mechanism of resistance to plant waterlogging [28]. A low-oxygen environment leads to the production of reactive oxygen species, and excessive reactive oxygen species can cause irreversible damage to plants [25]. Proline is one of the osmotic regulatory substances in plants. It regulates the osmotic balance and antioxidant system of cells and can improve resistance to plant stress [26]. Therefore, by studying whether plants activate the anaerobic metabolic pathway and what pathway they use to consume starch and soluble sugar, we can understand the distribution of photosynthetic products and plant growth in the mechanism of the removal of reactive oxygen by plants in peatlands under permafrost degradation.
Stable carbon isotopes are commonly used to track the plant–soil carbon distribution and transfer [29]. The use of in situ isotope labeling techniques to provide new insights into the fate of recently assimilated carbon in organs and carbon-containing compounds has been applied to crops, forest plants, and wetland plants [30,31]. Permafrost degradation plays a key role in the carbon allocation of plant–soil ecosystems. However, the mechanism of root signaling substances regulating the 13C allocation of plant–soil systems under permafrost degradation is rarely studied using ecological thinking. Therefore, we used stable isotope labeling in situ to study the regulation of plant root signaling substances on plant–soil system 13C allocation under permafrost degradation. The mechanism of the regulation of carbon allocation in the plant–soil system by root signaling substances in peatland plants (L. gemlini, V. uliginosum, C. schumidtii, and Sphagnum) in different permafrost regions (Yichun, isolated patches of the permafrost; Heihe, sporadic permafrost; Mohe, discontinuous permafrost) was analyzed. Two hypotheses were proposed: (i) the effects of root signaling substances on carbon allocation in plant and soil in peatlands in different permafrost regions change with labeling time; and (ii) with different degrees of permafrost degradation, climate change directly or indirectly affects root signaling substances through soil properties to regulate plant and soil carbon allocation.

2. Materials and Methods
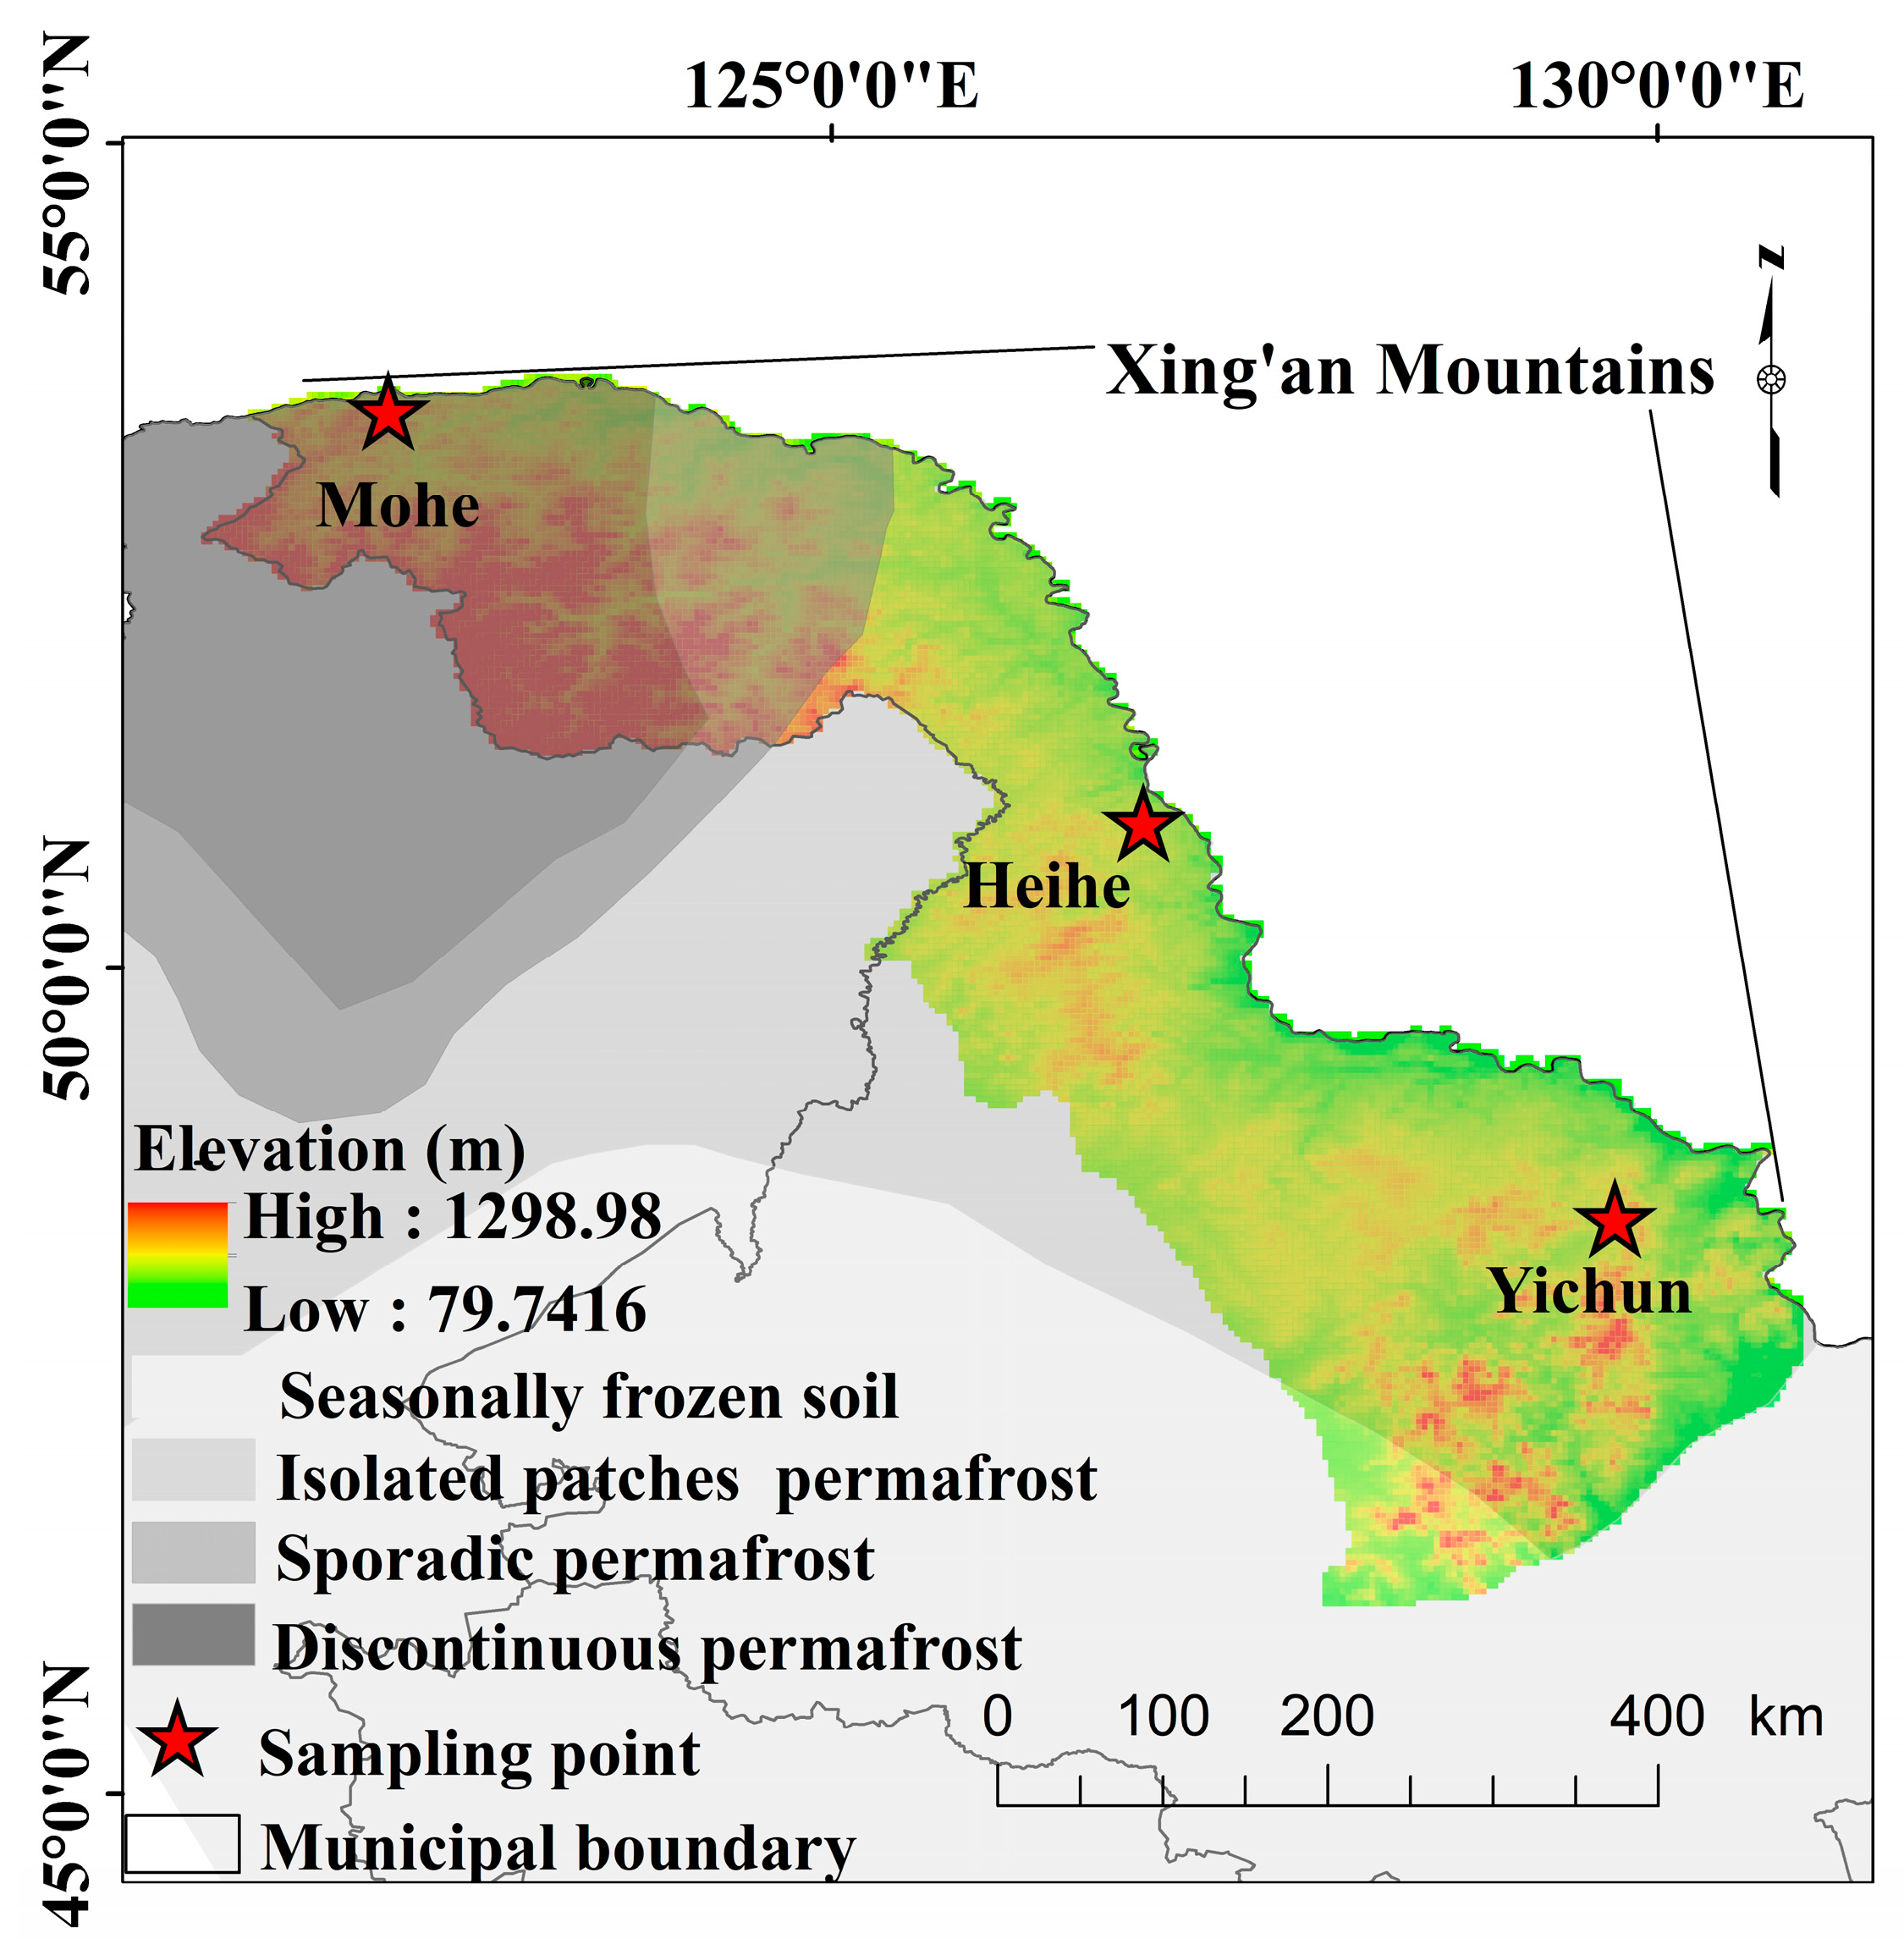
2.1. Study Area

Peatland carbon allocation mechanisms were studied in the Greater and Lesser Xing’an Mountains in northeast China (Figure 1). With an altitude of 300–700 m, the annual average temperature is −2.8 °C, the frost-free period is 90–110 days, and the annual average precipitation is 746 mm, demonstrating a cold temperate continental monsoon climate. Permafrost is mainly distributed in river valleys, foothills, shady slopes, and other areas, including discontinuous permafrost, sporadic permafrost, and isolated patches of permafrost [32,33]. The peatland is widely distributed, and the main tree species include L. gemlini, Betula platyphylla, and Pinus koraiensis.

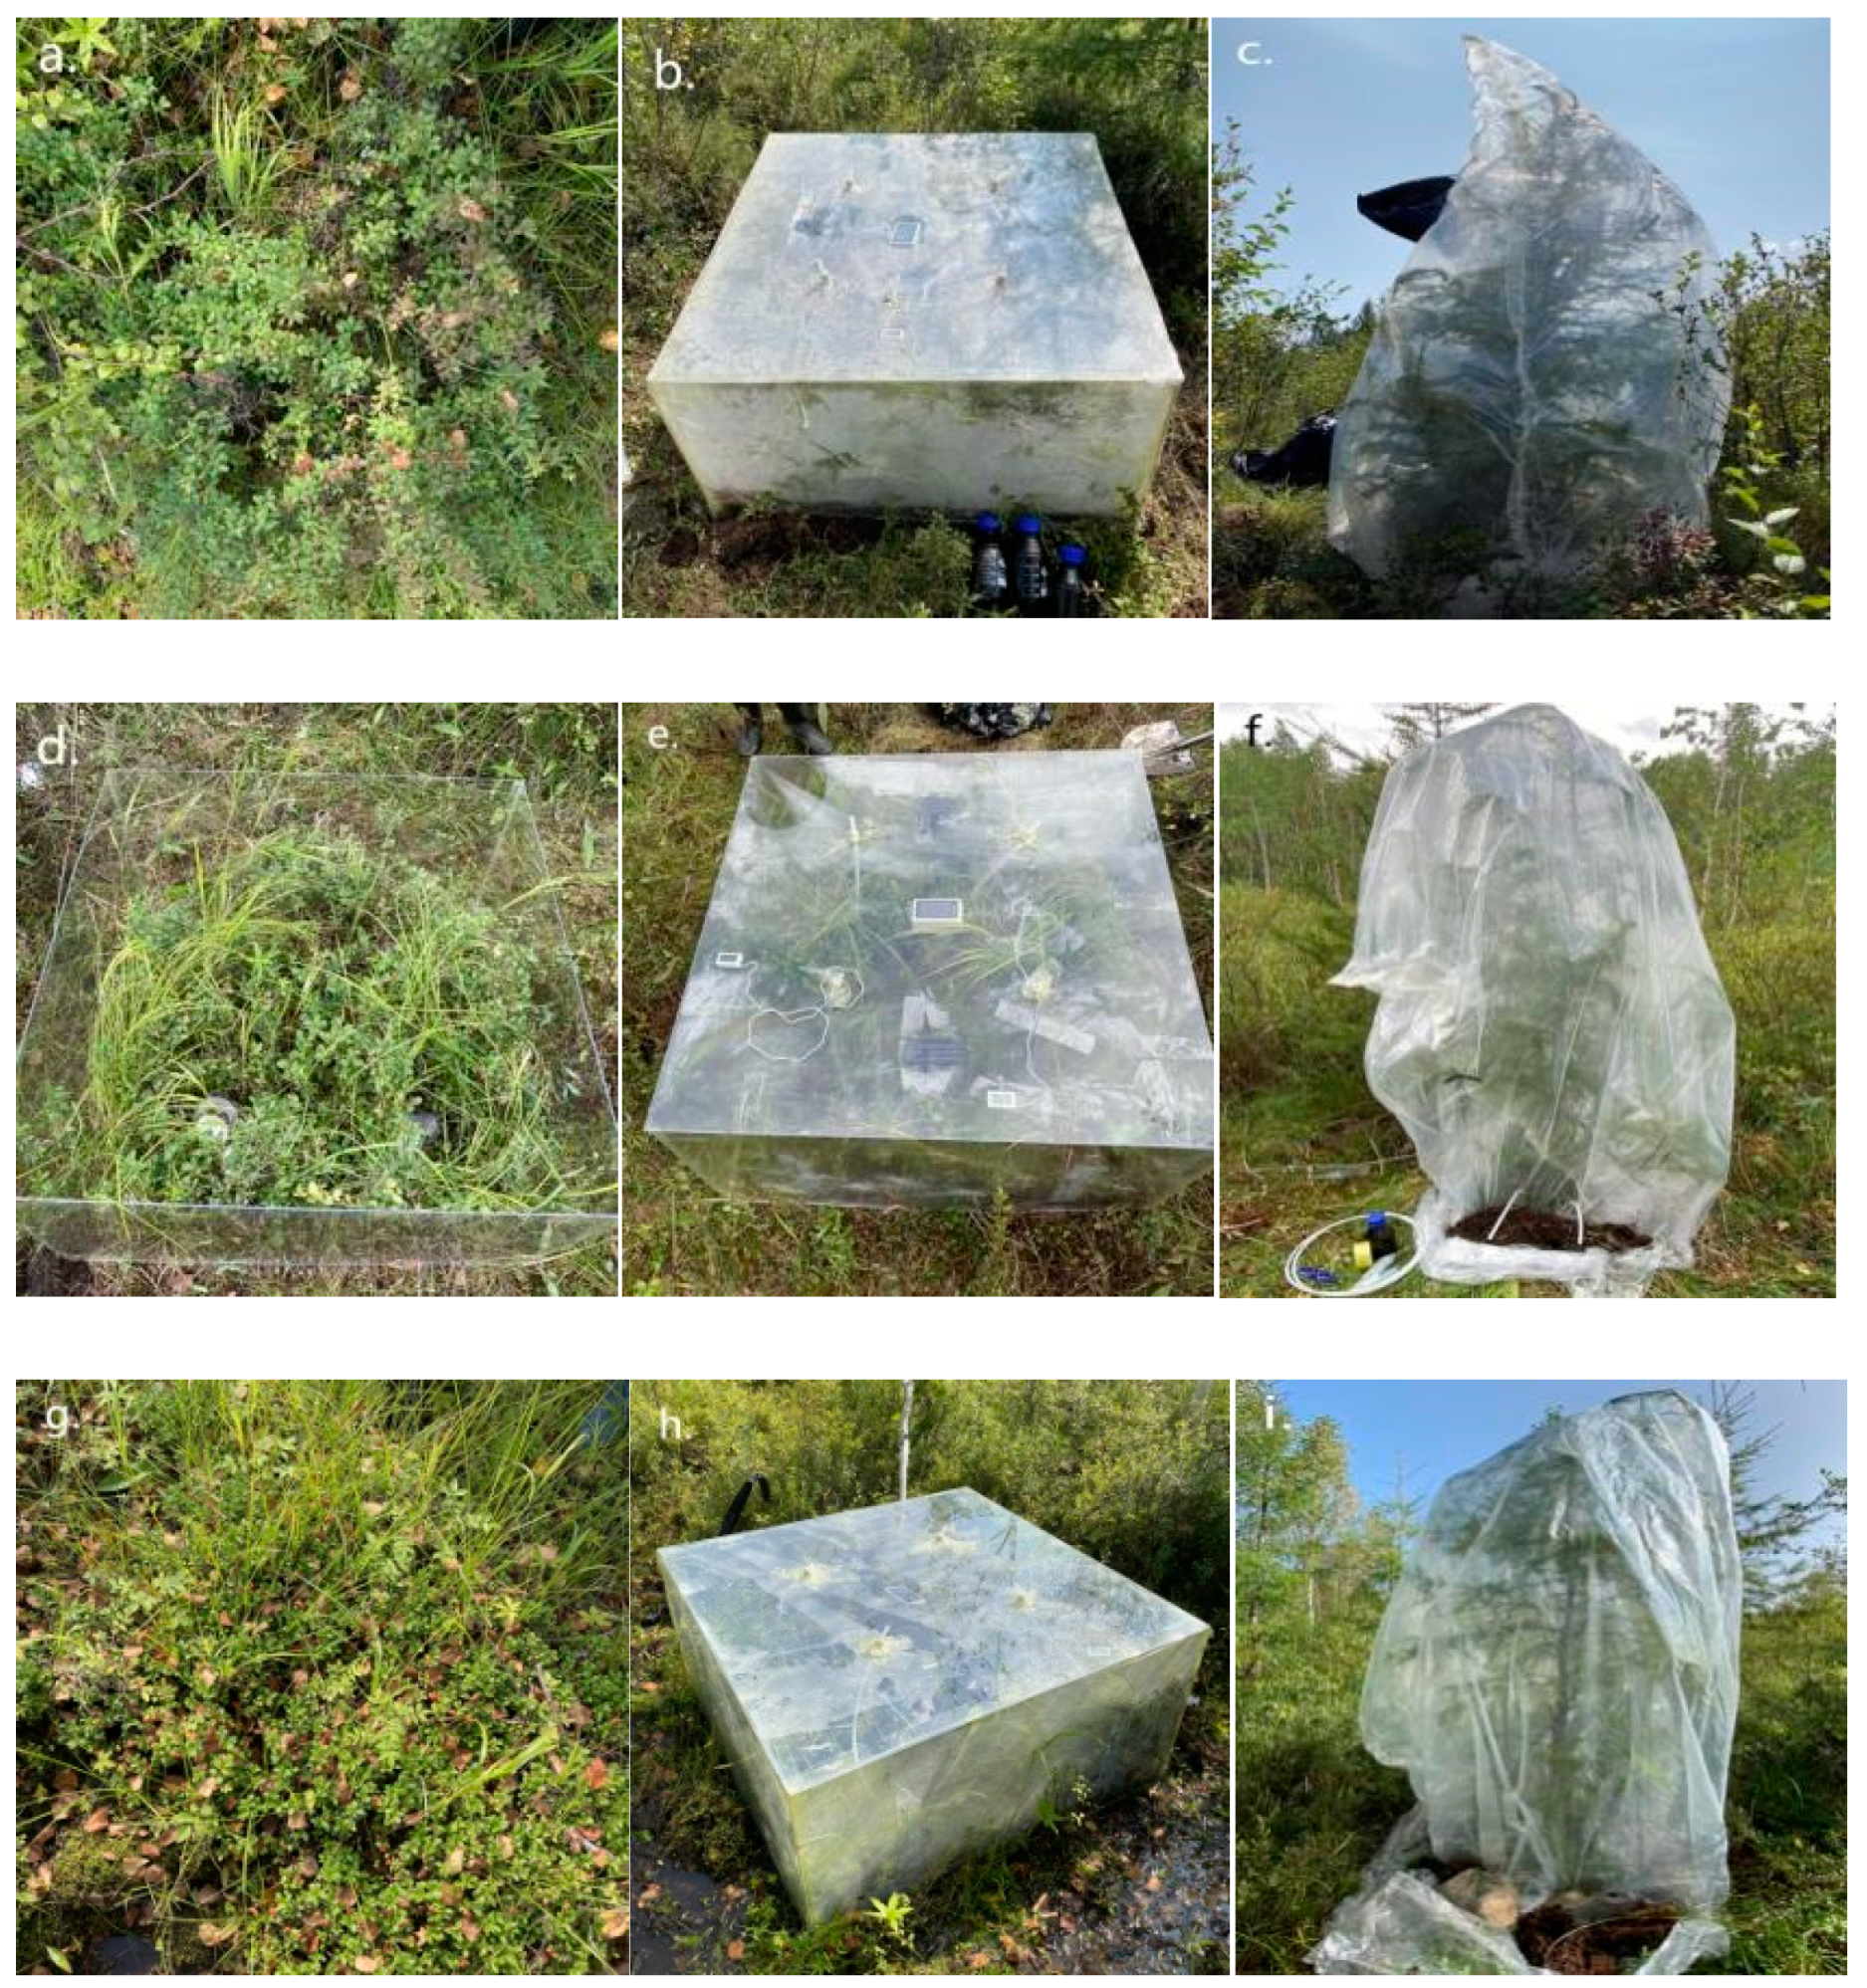
2.2. 13C Pulse Labeling

The pulse labeling of plants was performed on peatlands in Mohe (Figure 2a–c), Heihe (Figure 2d–f), and Yichun (Figure 2g–i), which represent different degrees of permafrost degradation (Table 1). Five grams of Na2CO3 were placed into a beaker before labeling, and the CO2 concentration in the labeling room was monitored using a CO2 monitor. The culture chamber was immediately sealed to prevent the soil from absorbing CO2 gas in the air, and a 13CO2 labeling test was started after standing for 5 min. At the beginning of labeling, a syringe was used to inject 13CO2 gas with an abundance of 99.9%. The initial concentration of CO2 in the labeling chamber was 450 μmol/mol, and the temperature was 27–28 °C. During the labeling process, the CO2 concentration in the labeling chamber was lower than 400 μmol/mol. After absorbing 1 mol·L−1 HCI with a needle and adding Na2CO3 from the entrance of the external catheter, 12CO2 gas was released for the CO2 concentration in the labeled gas chamber, reaching 450 μmol/mol. The marking time was 120 min. After marking, it was placed in a ventilated place for 10 min, and the sealed culture room was opened for use.

2.3. Sample Collection and Testing

The plant roots, stems, leaves, and soil of the labeled samples and control samples were collected 2, 24, 120, 216, and 360 h after the end of labeling. Three parallel samples were collected from each sample site. The sample was freeze-dried and pulverized with a ball mill. 13C isotope values of plant and soil samples were determined using IsoPrime-IRMS. The soil organic carbon (SOC) content was determined using the potassium dichromate oxidation method. Take 0.2 g of air-dried soil and add 10 mL 0.4 mol/L potassium dichromate sulfuric acid solution into the deboiling tube, deboil at 180 °C for 10 min, then transfer to a conical bottle after cooling, add 3–5 drops of phenanthroline indicator, and titrate with 0.2 mol/L ferric sulfate solution. The color changes from orange-yellow to blue-green to brick red, and brick red is the end point of the reaction. Total nitrogen (TN) was determined using the Kjeldahl method. Weigh 1 g air-dried soil and transfer it to the bottom of the Kjeldahl flask, add 2 g mixed catalyst, shake well and add 5 mL sulfuric acid, heat and boil with electric furnace. After boiling for 90 min, take off the Kjeldt flask, add 5 mL boric acid indicator solution into a 150 mL conical flask after cooling, open the condensate water, add 20 mL sodium hydroxide solution through the tee pipe, immediately close the distillation chamber, open the steam clip, and ensure steam distillation. Titrate with a standard solution of hydrochloric acid until the solution changes from blue-green to purple-red as the end point. Total phosphorus (TP) was determined using the perchloric acid–sulfuric acid method. Weigh 1 g of soil sample and place it in a 50 mL triangle bottle, add 48 mL concentrated H2SO2, shake it, and add 10 drops of 70% perchloric acid to shake well. After boiling for 60 min, wash the cooled liquid with water into a 100 mL volumetric bottle. Absorb 2–10 mL of filtrate into a 50 mL volumetric bottle, dilute it with water to 30 mL, add 2 drops of dinitrophenol indicator, and adjust the pH with dilute sodium hydroxide solution and dilute sulfuric acid solution until the solution is just slightly yellow. Add 5 mL of molybdenum–antimony color developer, with the colorimetric at 700 nm wavelength on a spectrophotometer, to read the absorption value. The soil pH and soil moisture content (SWC) were measured using a portable detector. The thickness of the active layer (ALT) was measured with a 1.5 m T-shaped metal rod. Mean annual temperature and precipitation data were obtained from Weather net (https://rp5.ru/, accessed on 25 May 2022). The contents of abscisic acid (ABA), ethylene (ETH), gibberellin (GA), peroxidase (POD), superoxide dismutase (SOD), pyruvate decarboxylase (PDC), ethanol dehydrogenase (ADH), and acetaldehyde decarboxylase (ALDH) in plant tissues were determined by enzyme-related immunoassay [34,35]. The contents of soluble sugar (SS) and starch (ST) were determined by anthrone colorimetry. The soluble sugar and starch in the sample can be separated by 80% ethanol, the starch can be decomposed into glucose by acid hydrolysis, and the glucose content can be determined by the anthrone colorimetric method [34]. Proline (Pro) was determined by ninhydrin colorimetry [34].

2.4. Statistical Analysis

To examine root signaling substances that regulate carbon allocation in the plant and soil of peatland under permafrost degradation, samples of four plant species were collected from three peatlands in three permafrost regions, and three parallel samples were collected for each plant (Table 2).
The δ 13C value and 13C abundance (F) were calculated as follows:
δ 13 C ( ) = R sample R PDB R PDB × 1000 ,
F ( % ) = ( δ 13 C + 1000 ) × R PDB ( δ 13 C + 1000 ) × R PDB + 1000 × 100 ,
where RPDB is the 13C/12C ratio of the standard substance, 0.0112372 is the Pee Dee Belemnite (PDB) (standard from the Cretaceous Pee Dee Formation, SC, USA), and Rsample is the 13C/12C ratio of the sample.
A principal component analysis (PCA) of the main physiological indicators affecting the growth of peatland plants in different permafrost areas was carried out using Origin Pro 2022. A linear mixed-effect model in a two-way analysis of variance was used to determine the difference in the main physiological indexes of different plant types in the peatlands of different frozen soil areas with a change in marking time. The effectiveness of the model was tested through a visual estimation of residuals and quantile plots. The model included the nested random factors of the sampling date within the sampling point ID as random effects. Logarithmic likelihood tests were used to determine fixed effects and possible interactions. The final model included species and permafrost types as fixed effects and sampling point IDs as nested random effects. The main effects were further explored by an expanded comparison of the mean and the p-value adjustment of Tukey’s significant difference. p < 0.05 showed a significant difference. Piecewise structural equation modeling (SEM) was used to assess the direct and indirect effects of key factors on carbon allocation in plant–soil systems in different permafrost regions. In the model, climate factors, soil’s physical properties, soil’s chemical properties, and plant root signaling substances were set as fixed effects, and plant types were set as random effects. The analysis was conducted using the “piecewiseSEM” package of R [36]. The linear mixed-effect model was fitted to the “lme” function of the “nlme” package.

3. Results

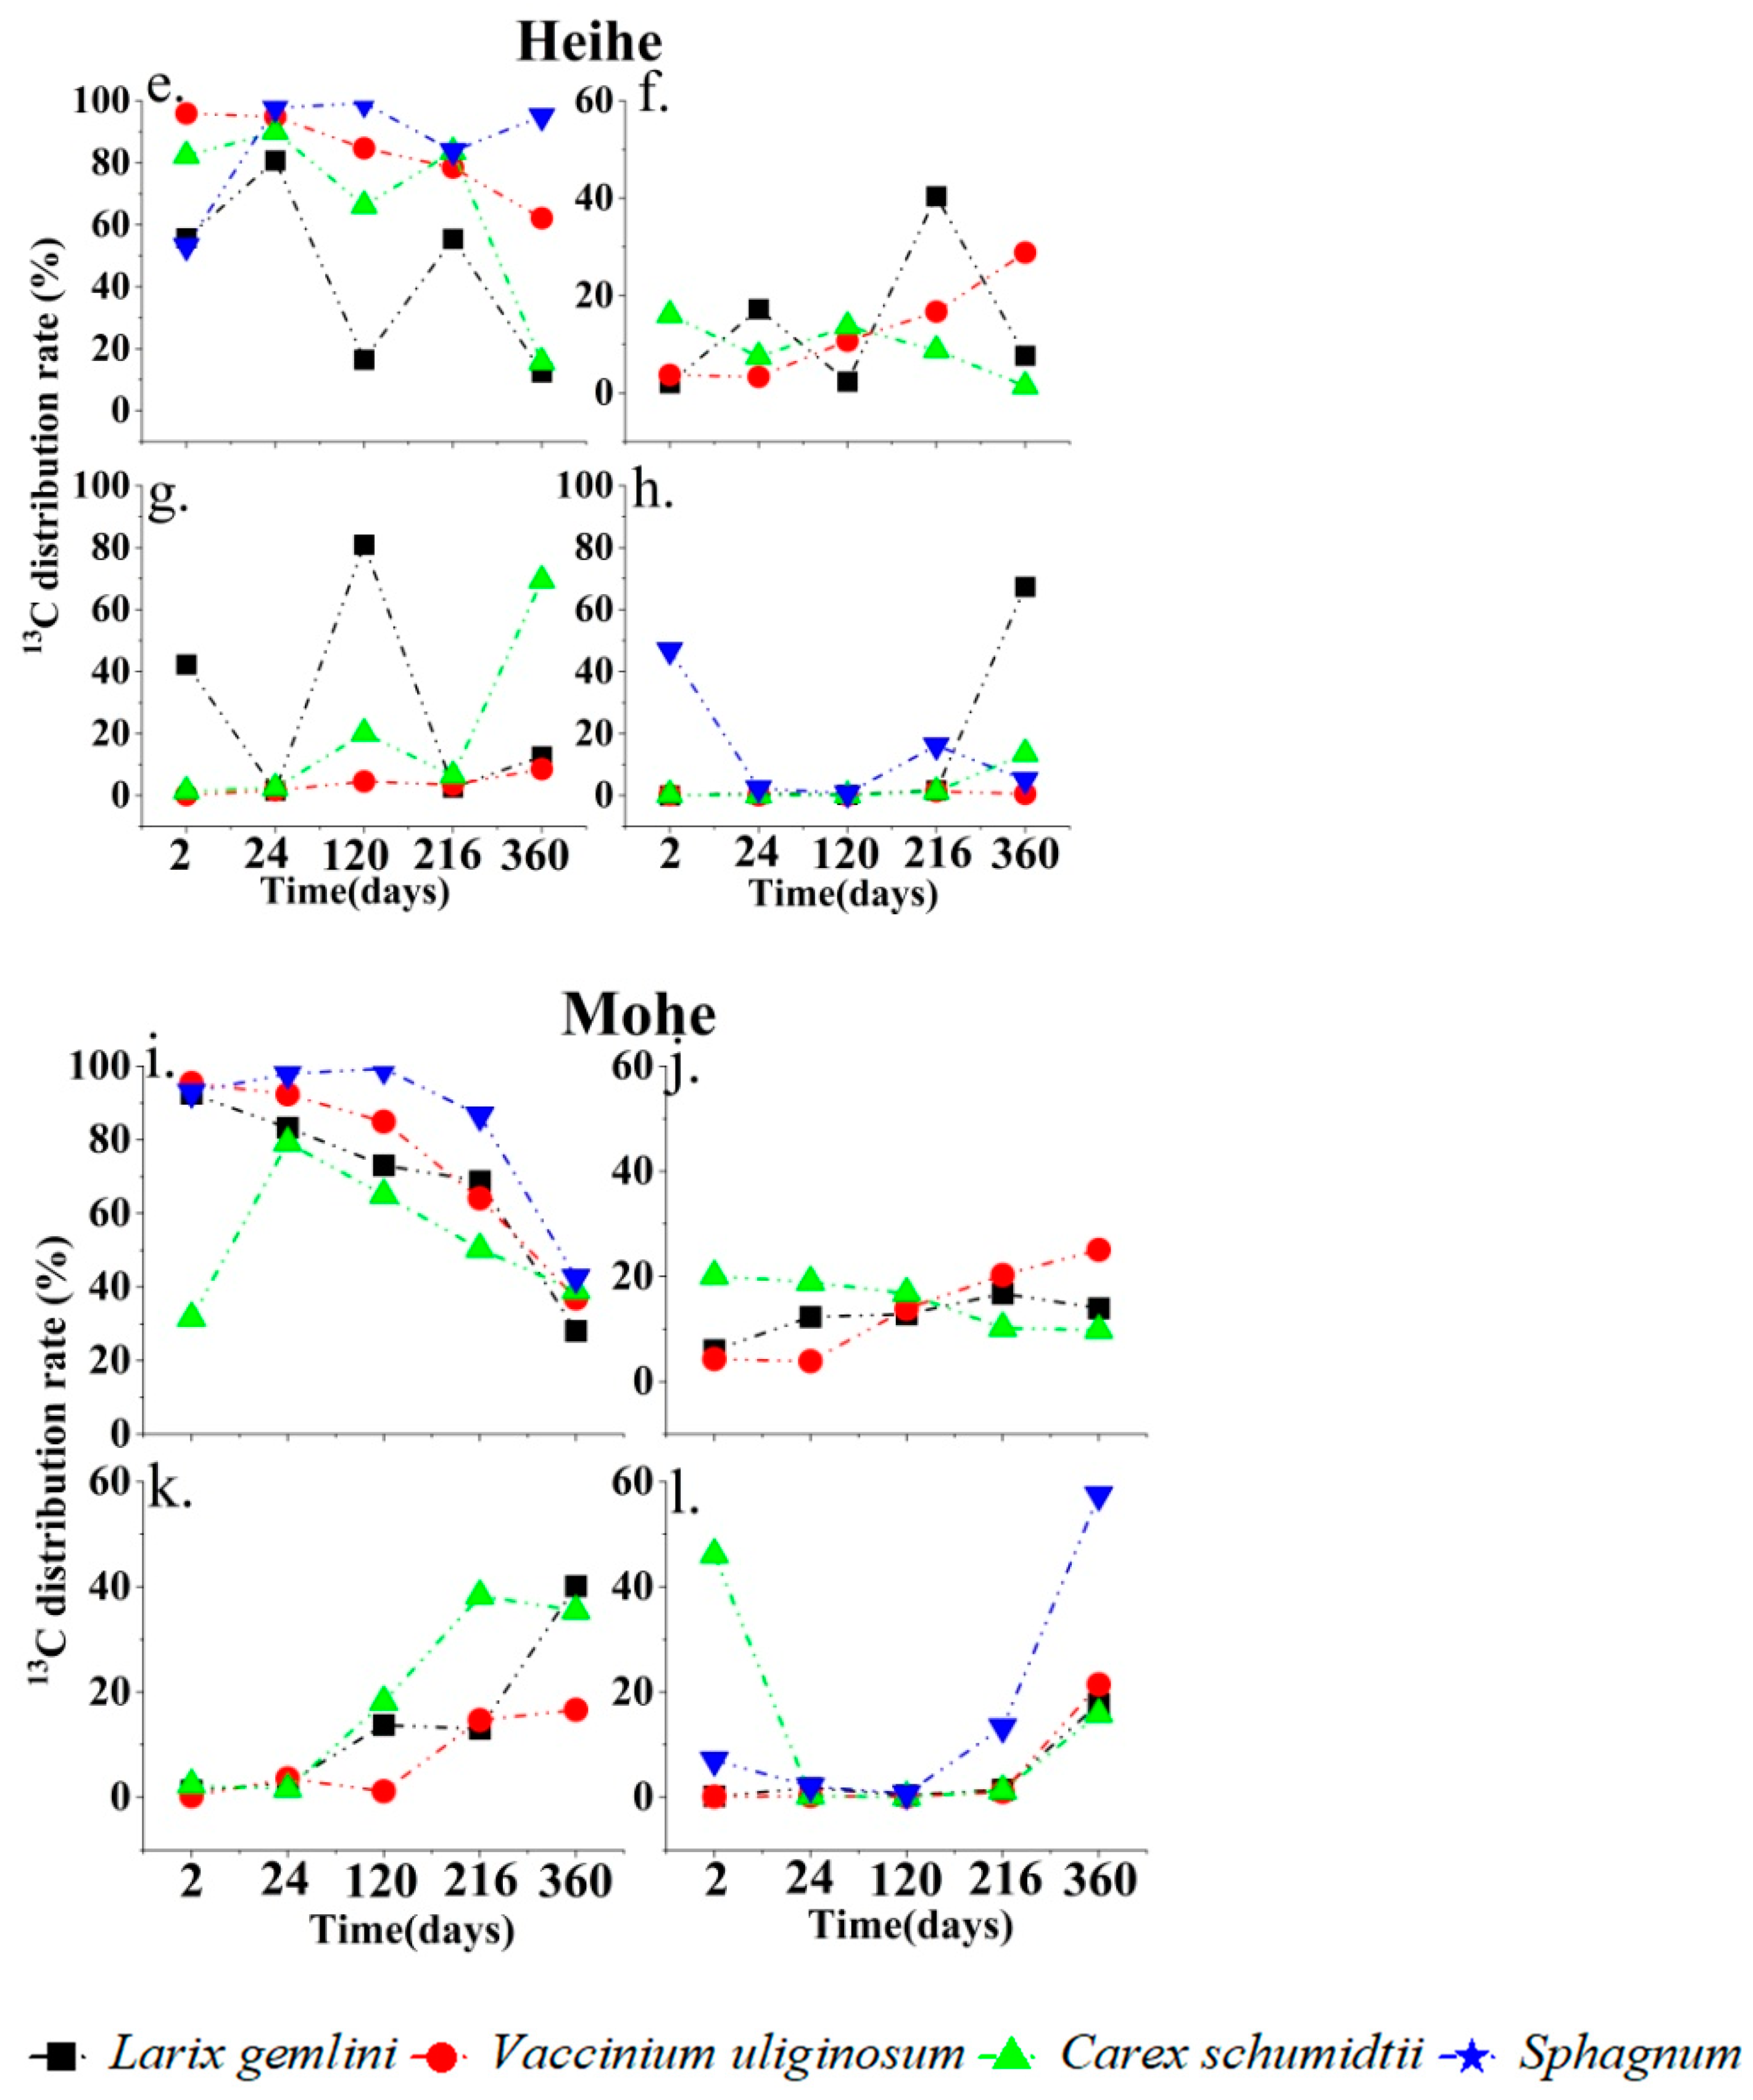
3.1. Carbon Allocation in the Plant–Soil System of Peatlands in Different Permafrost Regions

The leaf 13C allocation ratio of the four species in the three permafrost areas was the highest and decreased with an increase in marking time, while the stem, root, and soil increased with an increase in marking time (Figure 3). The leaf 13C allocation of L. gemlini was the highest in Mohe (discontinuous permafrost zone) (Figure 3i) and lowest in Yichun (isolated patches of the permafrost zone) (Figure 3a). L. gemlini had the lowest root 13C allocation at 120 h and the highest soil 13C allocation at 120 h in Yichun. L. gemlini had the highest root and soil 13C allocation at 120 and 360 h, respectively, in Heihe (sporadic permafrost zone). L. gemlini had the highest root and soil 13C allocation at 360 h in Mohe. V. uliginosum had the lowest leaf 13C allocation at 216 h and the highest stem 13C allocation at 216 h in Yichun. C. schumidtii had the highest leaf 13C allocation at 360 h and the highest stem 13C allocation at 216 h; root 13C allocation at 24 and 216 h was higher than at other marking times and soil allocation increased with marking time in Yichun. The 13C allocation in leaves of C. schumidtii was the highest at 24 h, and decreased with marking time in stems, and that in roots and soil increased with marking time in Heihe and Mohe. The 13C allocation of Sphagnum leaves changed little with marking time in Yichun and Heihe and decreased with marking time in Mohe. Sphagnum 13C allocation decreased with marking time in Yichun and Heihe and increased with marking time in Mohe.

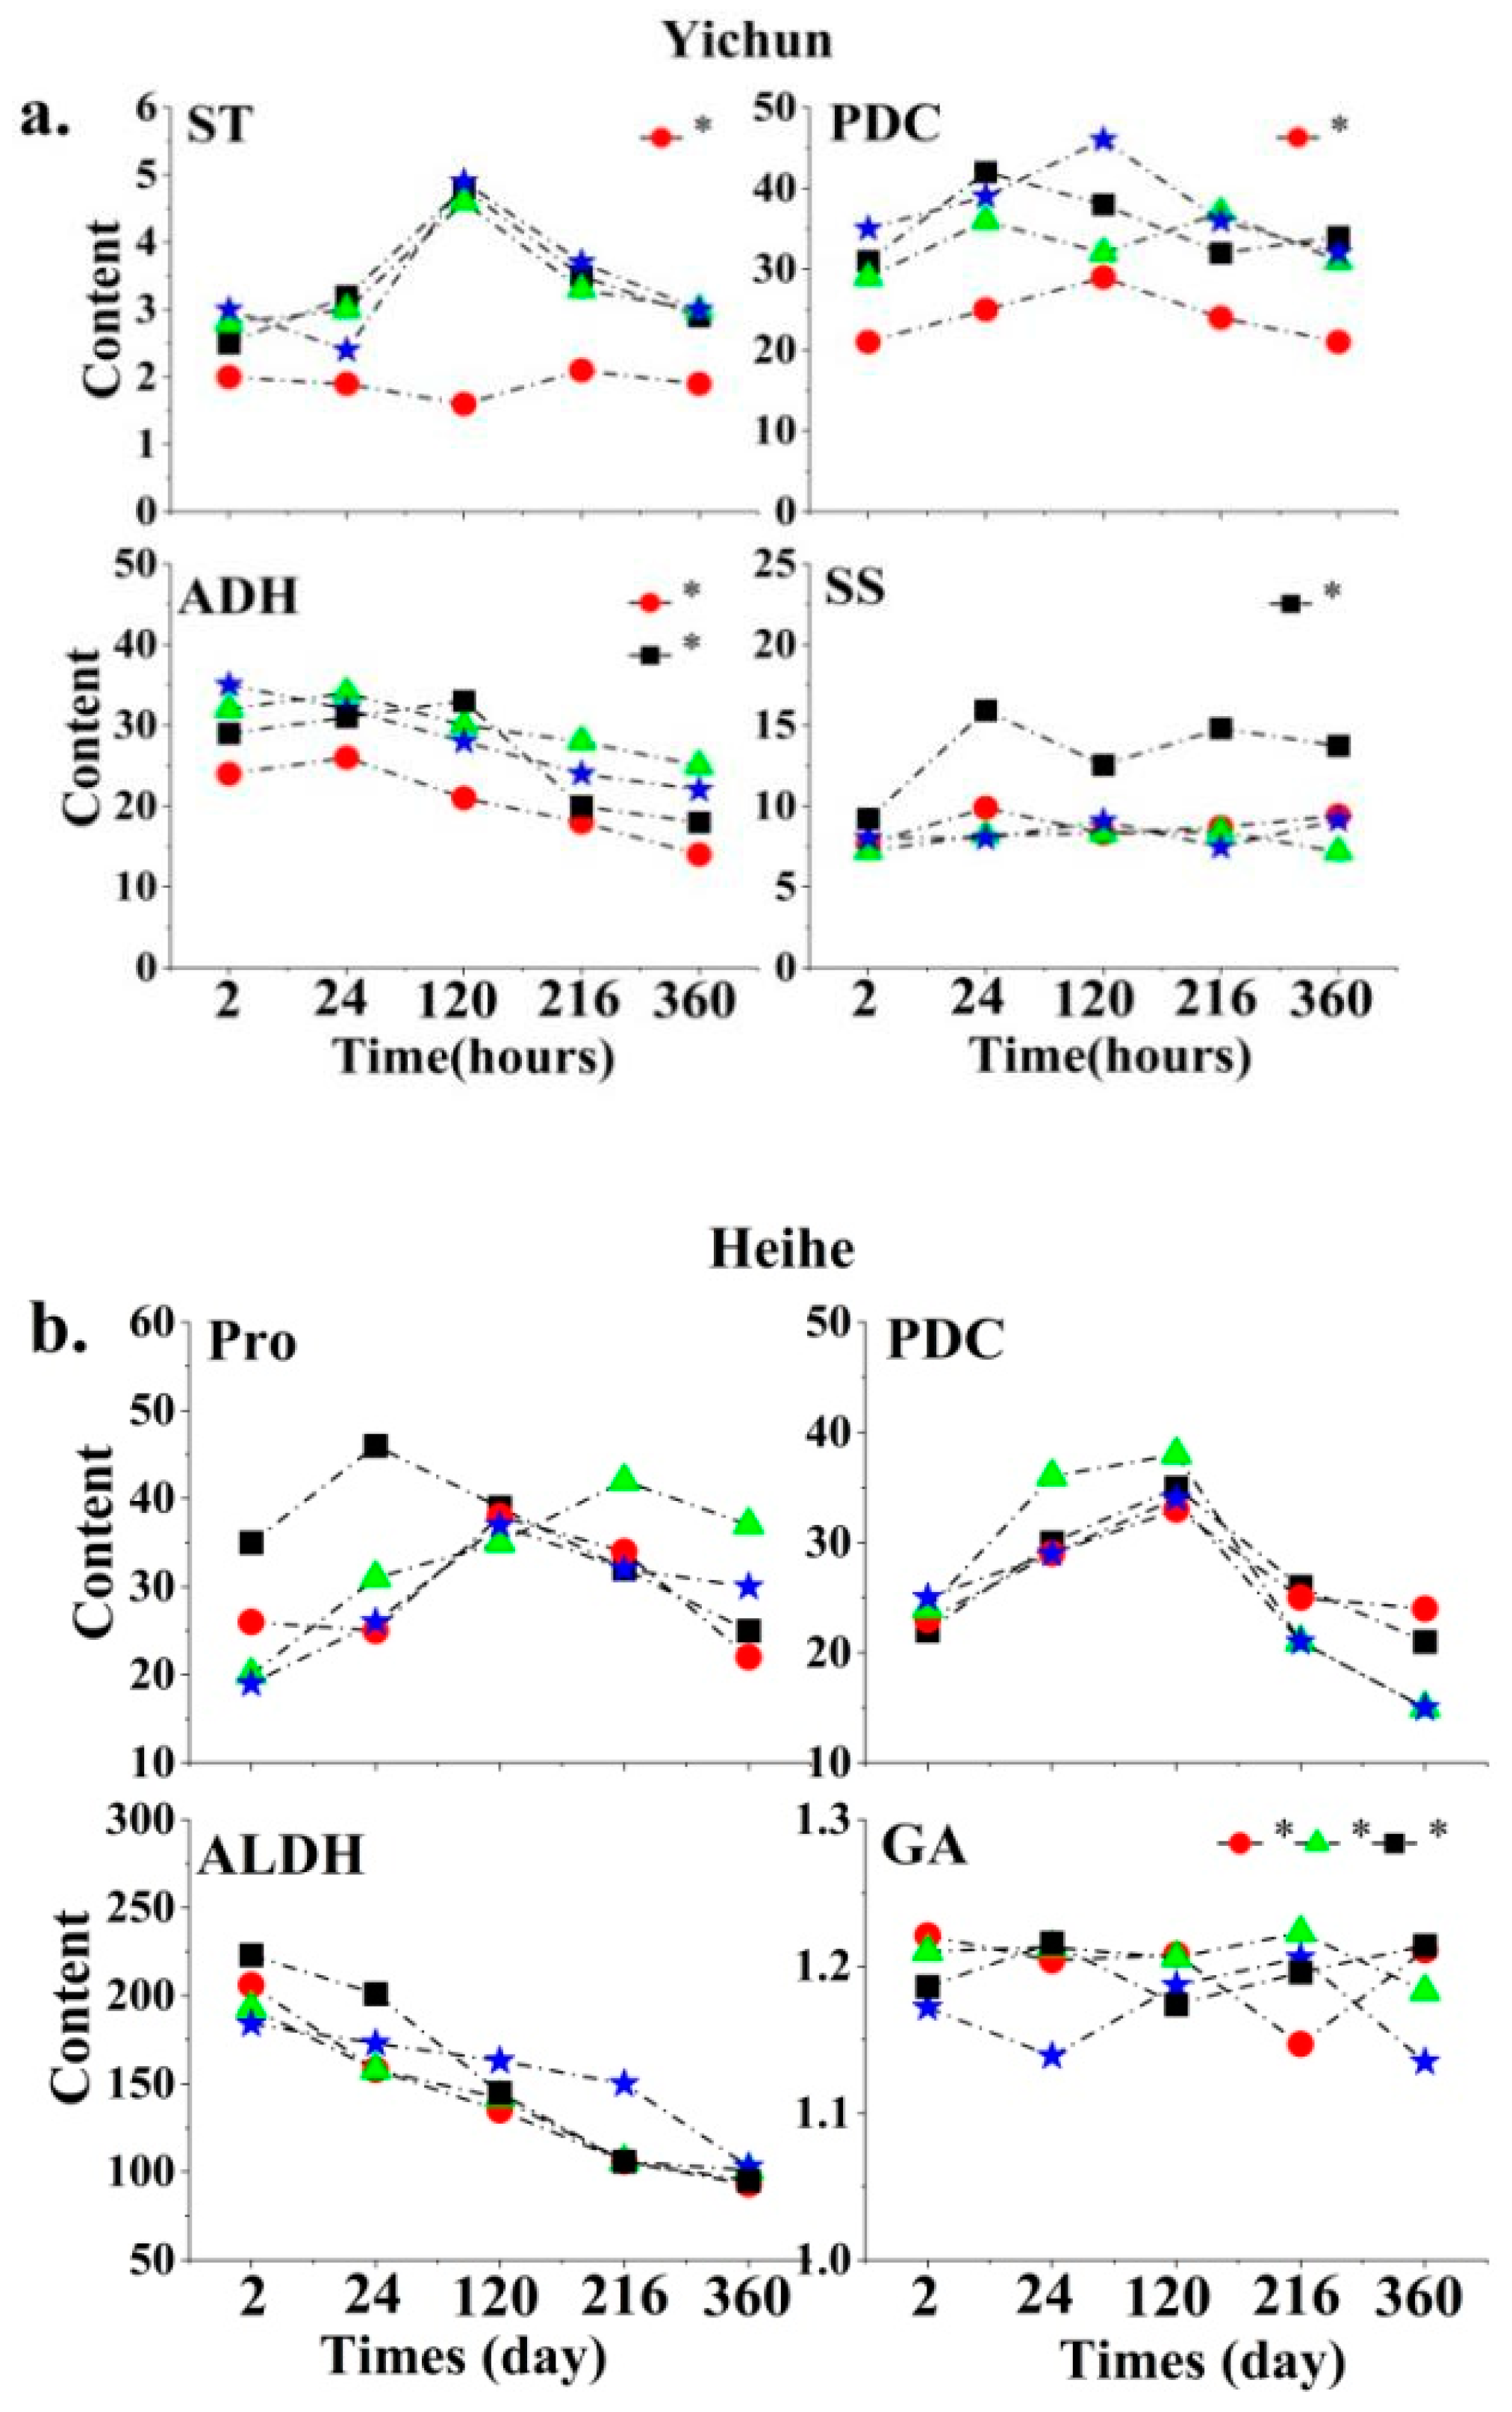
3.2. Main Root Signaling Substances Affecting Plant Growth in Peatlands in Different Permafrost Regions

A PCA was carried out of the physiological indexes (hormones, antioxidant system, anaerobic metabolism, non-structural carbohydrates, and osmotic regulatory substances) of peatland plants in different permafrost areas. At Yichun (isolated patches of the permafrost zone), PC1 and PC2 explained 51.8% of the variance (Figure 4a), and the indexes with high contribution rates were starch, pyruvate decarboxylase (PDC), alcohol dehydrogenase (ADH), and soluble sugar. At Heihe (sporadic permafrost zone), PC1 and PC2 together explained 43.9% of the variance (Figure 4b), and the indicators with higher contribution rates were proline, PDC, aldehyde decarboxylase (ALDH), and gibberellic acid (GA). At Mohe (discontinuous permafrost zone), PC1 and PC2 explained 41.4% of the variance (Figure 4c), and the indexes with high contribution rates were starch, proline, ADH, and ALDH.

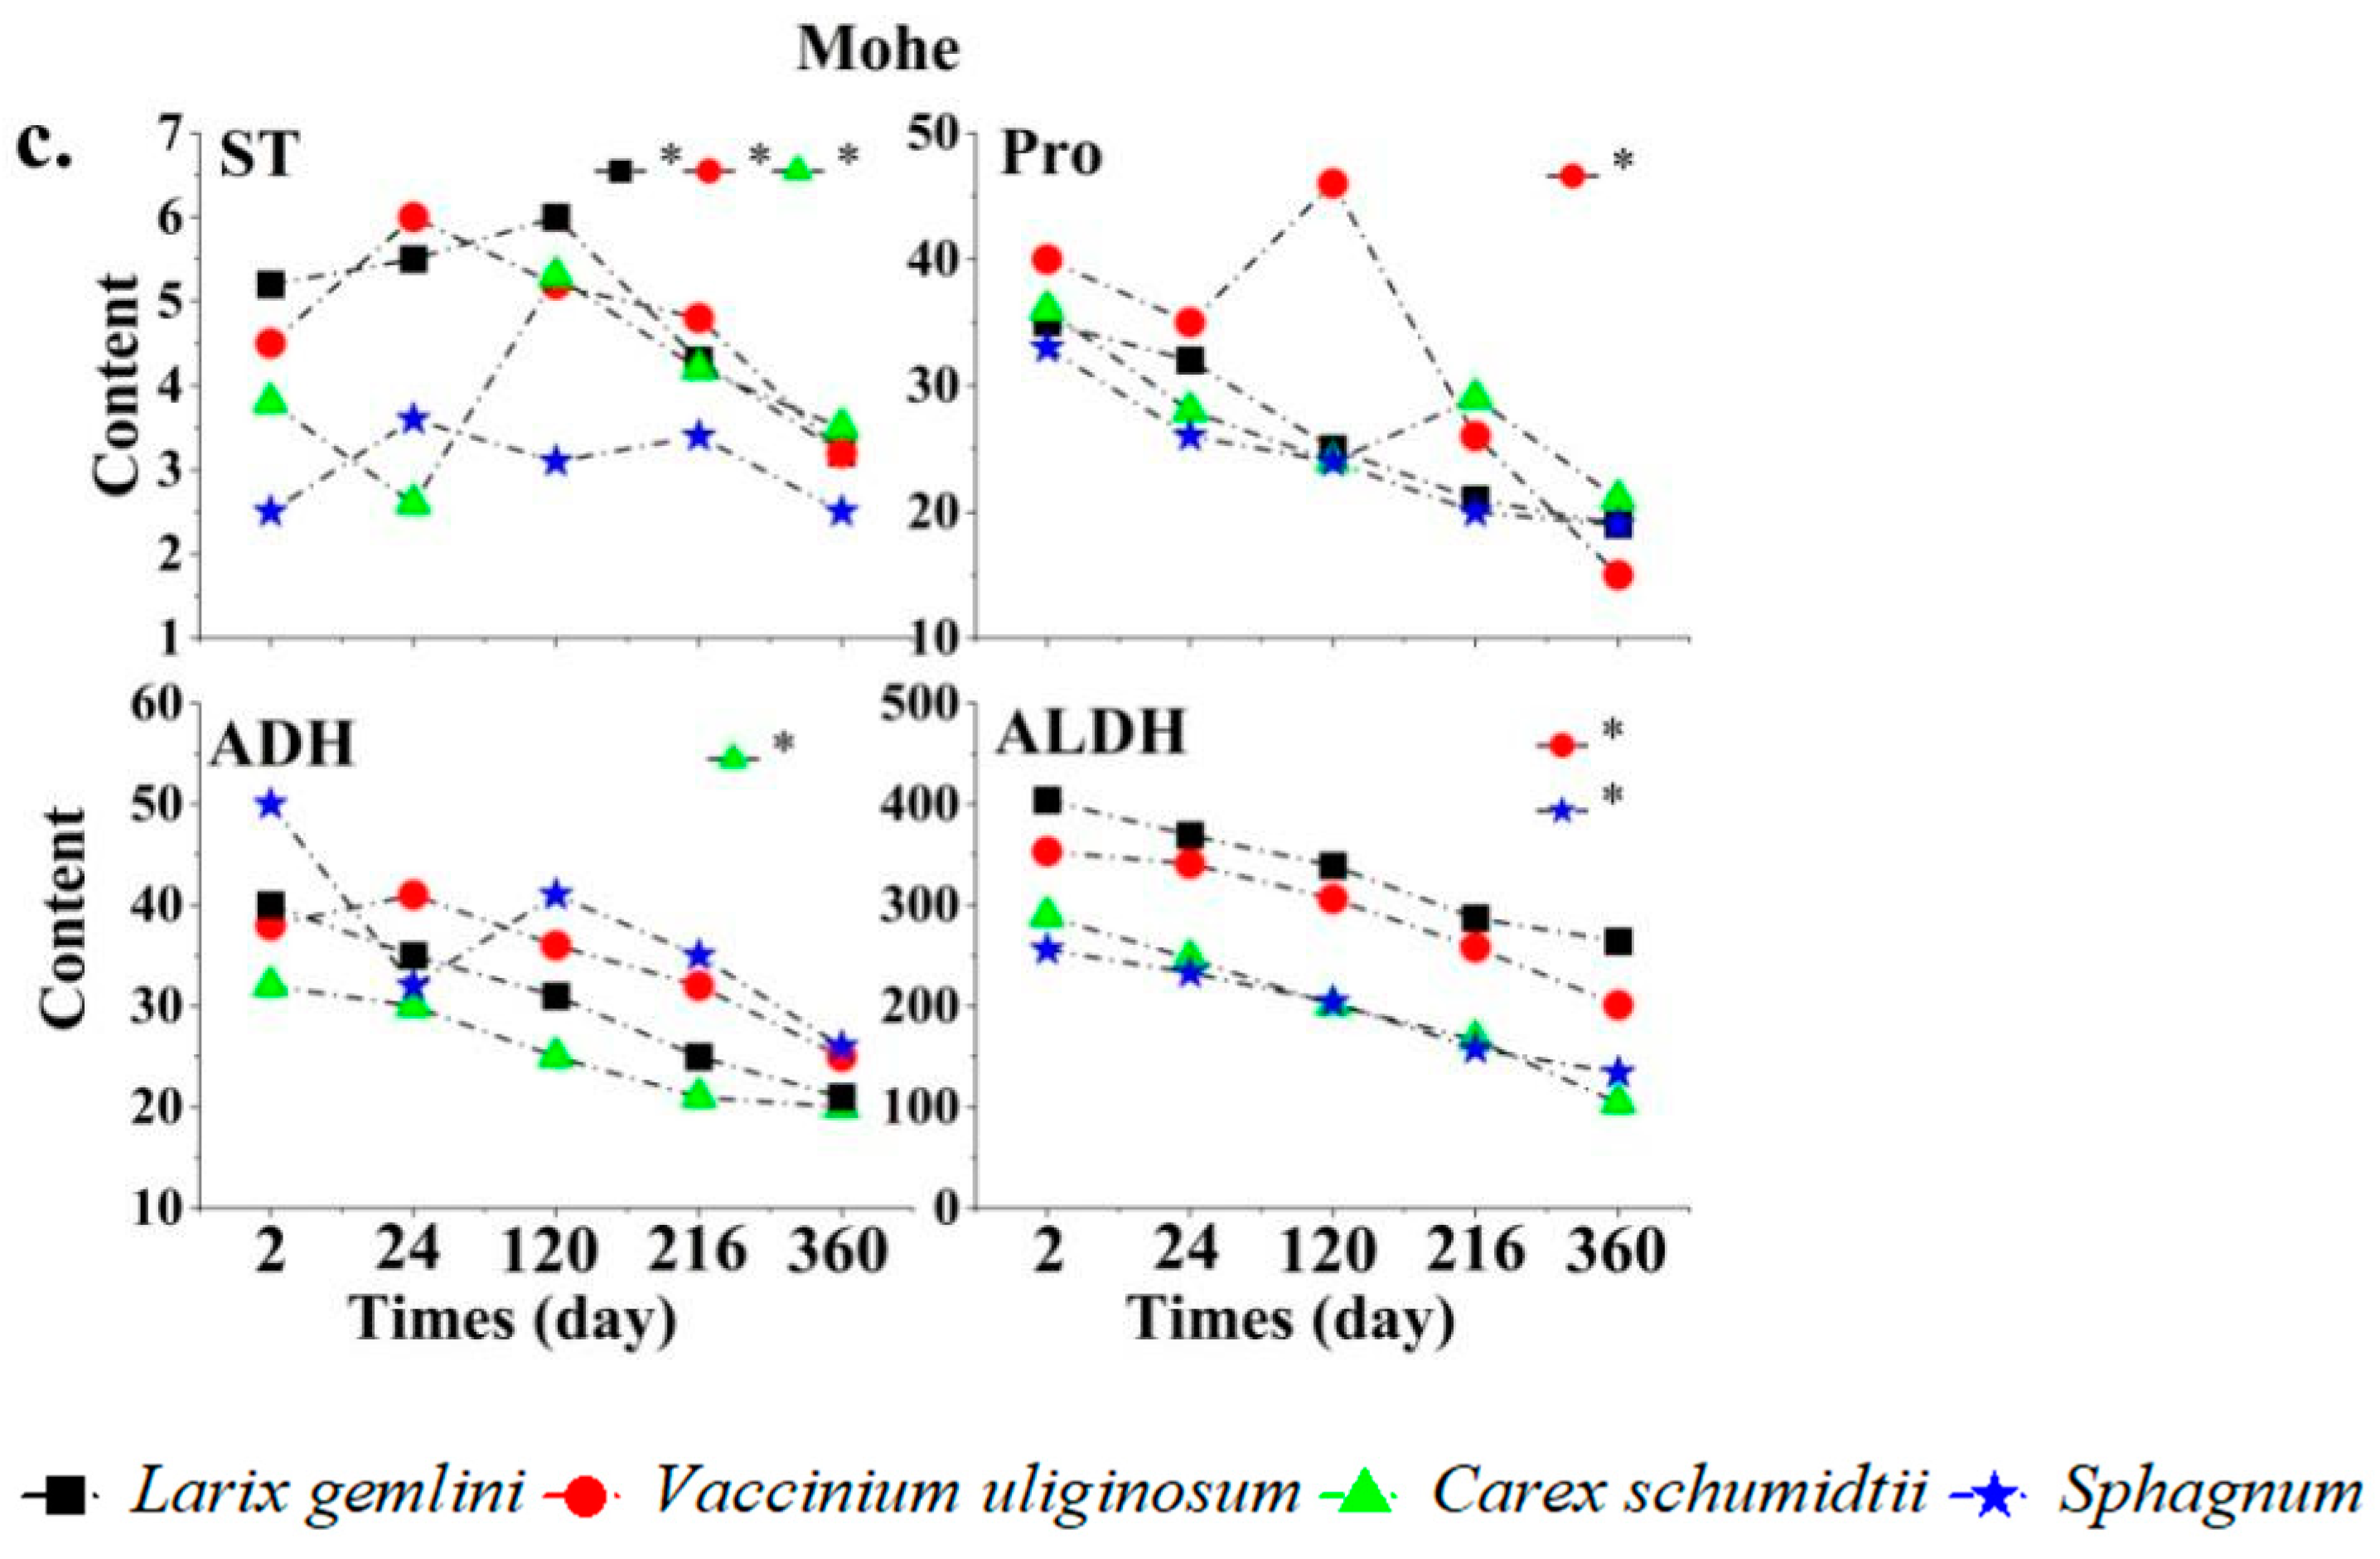
3.3. Changes in Plant Root Signaling Substances with Labeling Time in Different Permafrost Regions

The mixed effects of the main indexes affecting plant growth in different frozen soil areas were compared and analyzed (Figure 5). The starch content of V. uliginosum varied significantly with labeling time in Yichun (isolated patches of the permafrost zone) (p < 0.05). At 120 h, the starch content of V. uliginosum was the lowest and the starch content of the other three plants was the highest. The soluble sugar content of L. gemlini was higher in Yichun, and the difference with changes in labeling time was significant (p < 0.05). The PDC and ADH contents of V. uliginosum were low, and the difference was significant with the labeling time in Yichun (p < 0.05). The ADH of L. gemlini varied significantly with labeling time (p < 0.05), and the highest ADH content was found in Yichun at 120 h (Figure 5a). Proline and PDC first increased and then decreased with marking time, and ALDH decreased with marking time in Heihe (sporadic permafrost zone). The GA content of L. gemlini, V. uliginosum, and C. schumidtii significantly changed in the Heihe River with labeling time (p < 0.05) (Figure 5b). The starch content of L. gemlini, V. uliginosum, and C. schumidtii changed significantly with the labeling time (p < 0.05), and the lowest content of C. schumidtii was found in Mohe at 24 h. The proline content of V. uliginosum changed significantly with marking time (p < 0.05), and the highest content was found in Mohe (discontinuous permafrost zone) at 120 h. The ADH and ALDH of the four plants decreased with marking time, and the ALDH of L. gemlini and V. uliginosum significantly changed with marking time in Mohe (p < 0.05) (Figure 5c).

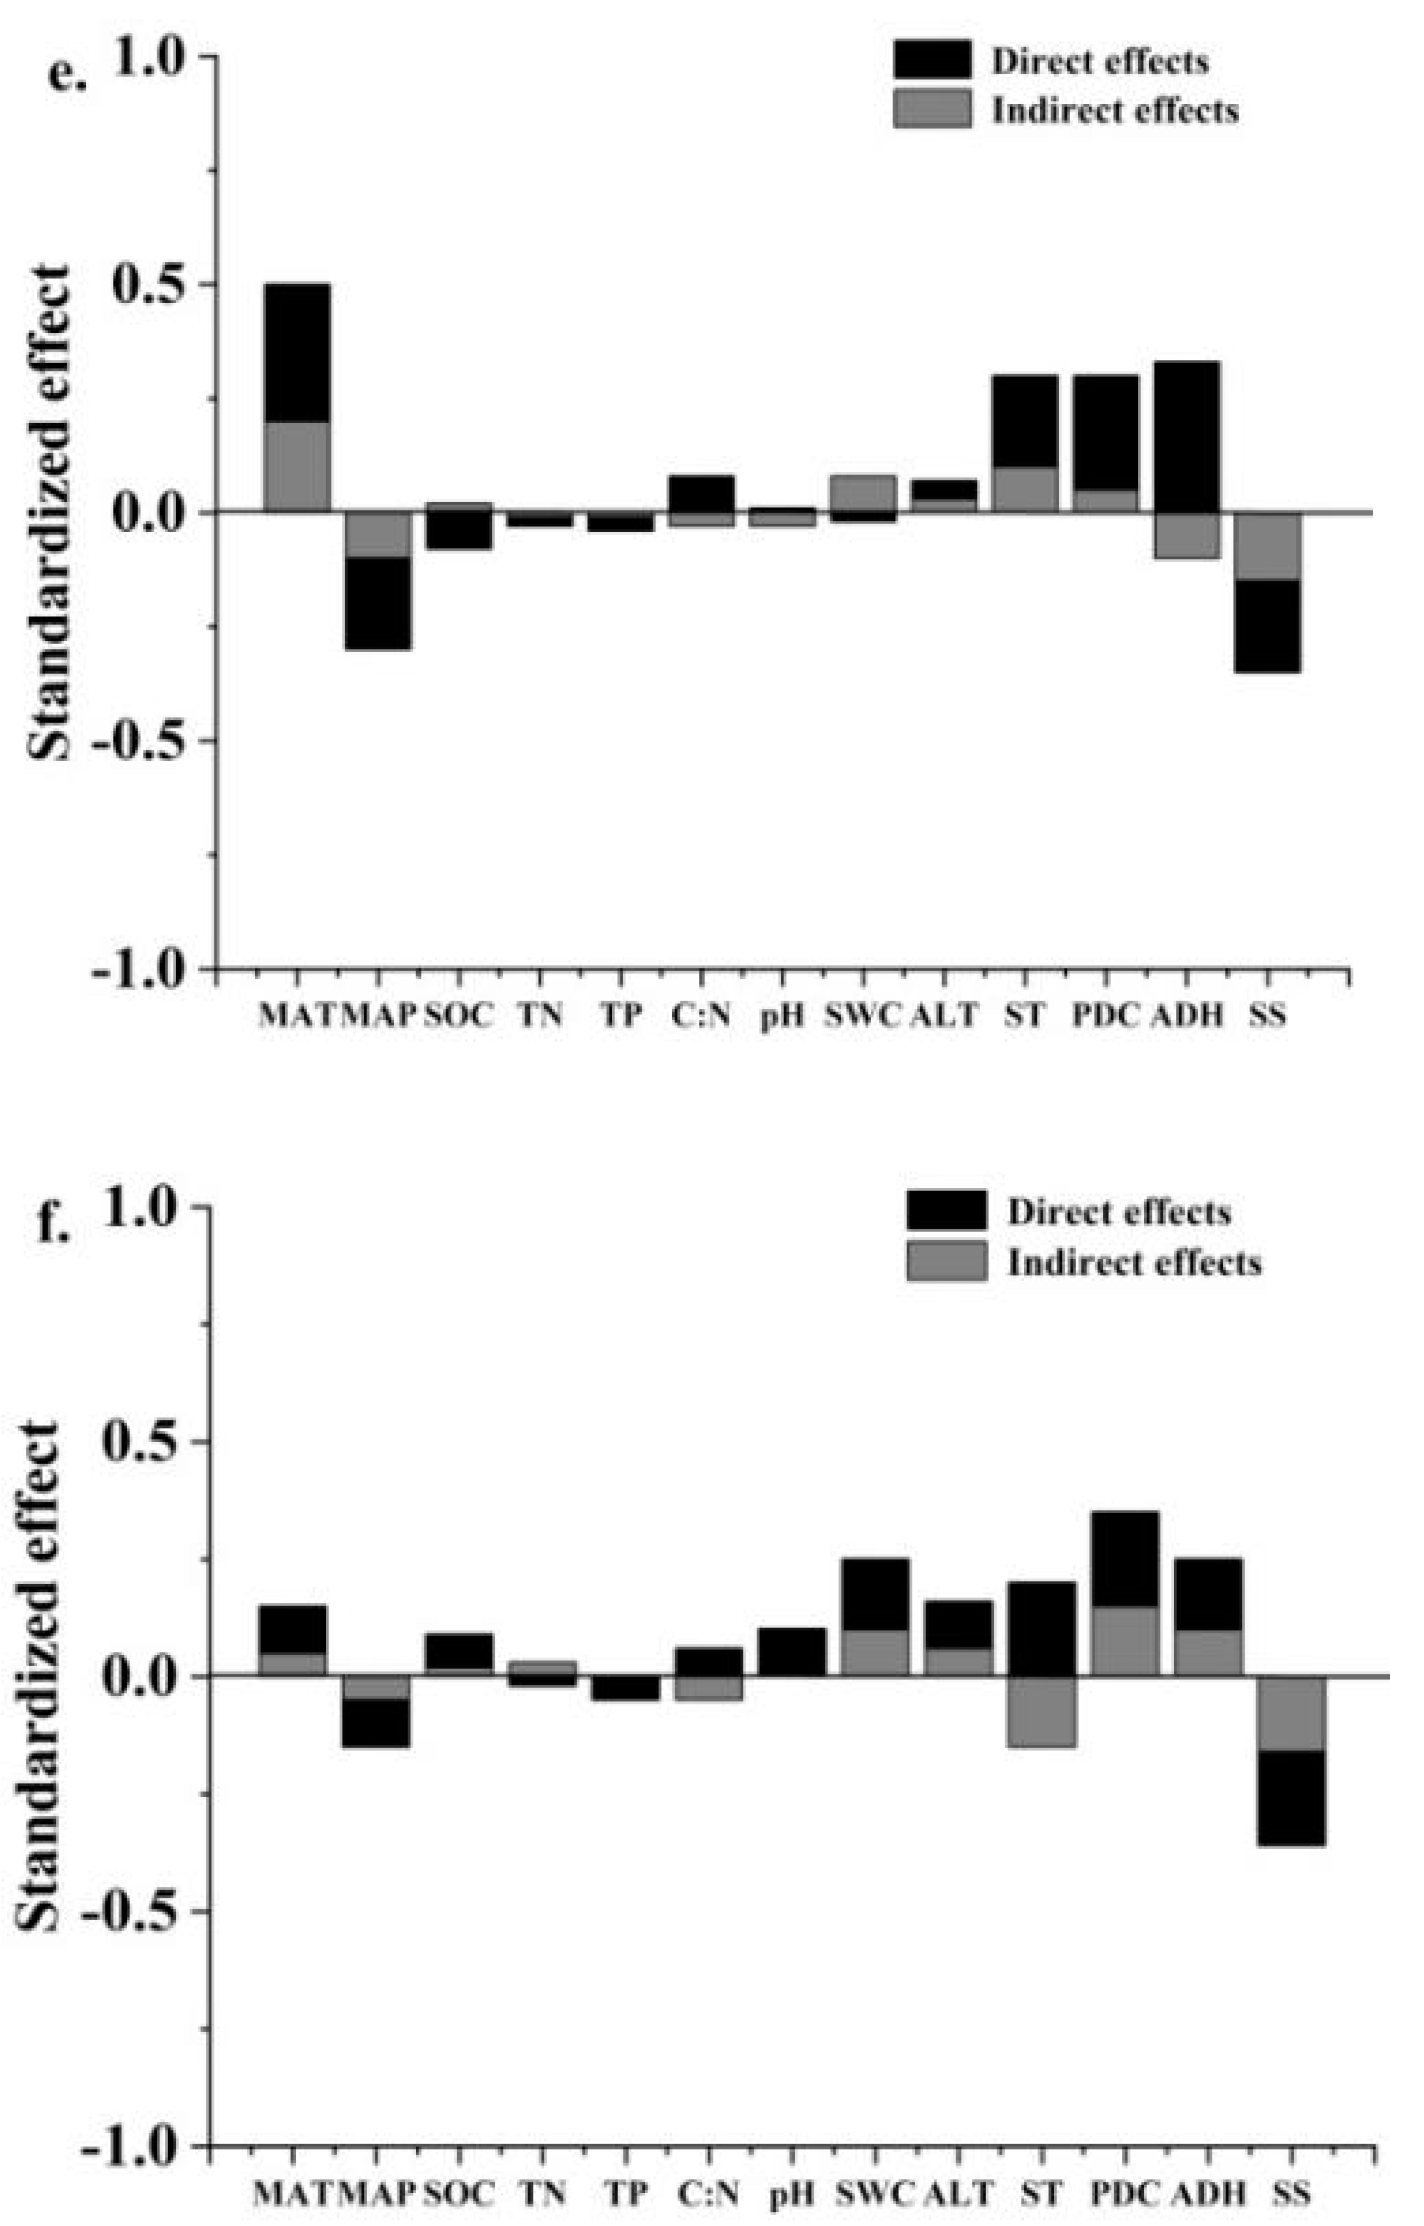
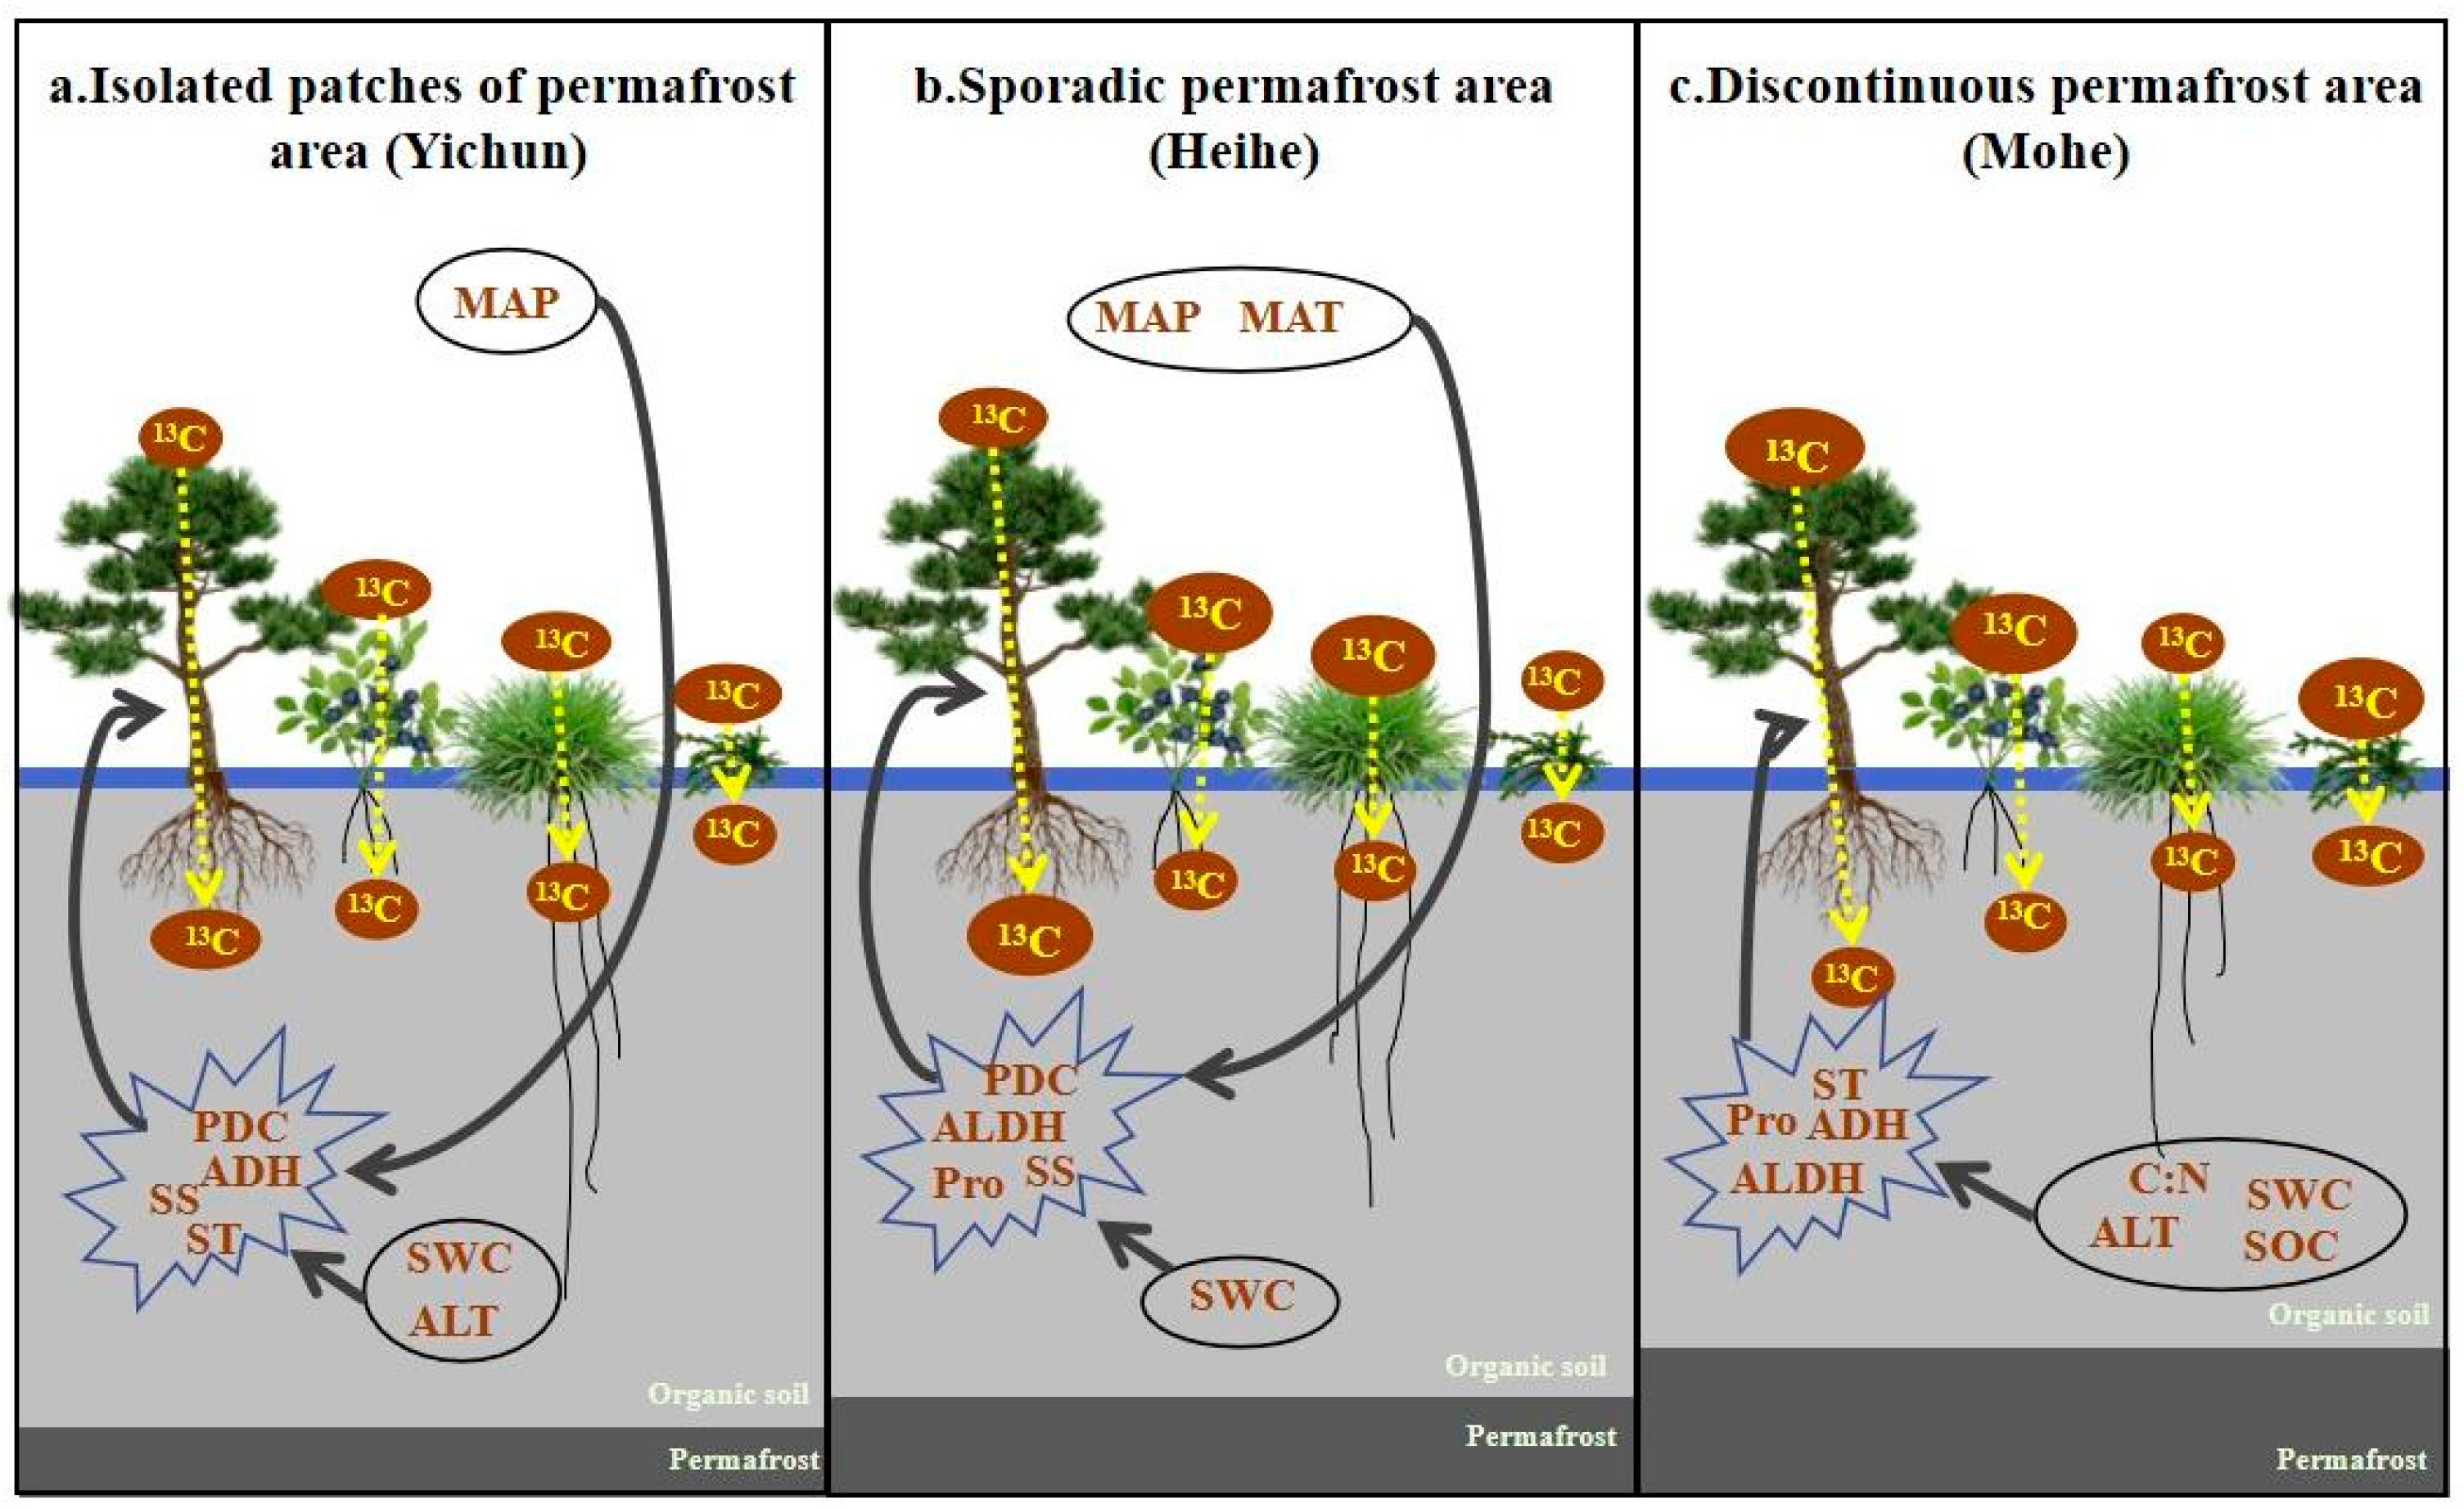
3.4. Root Signaling Substances Regulate Carbon Allocation in Plant–Soil Systems under Permafrost Degradation

Climate change has indirect effects on plant–soil carbon allocation by influencing soil’s physical properties in Yichun (isolated patches of the permafrost zone) (Figure 6a and Figure 7a). MAP and SWC affected carbon allocation in roots and stems through PDC, and SWC affected the carbon allocation of roots and soil through ADH. MAP affected the carbon allocation of leaf stems and roots through starch, and ALT affected the carbon allocation of roots and soil through SS in Yichun. Climate change had a significant impact on soil’s physical properties and indirectly affected plant–soil carbon allocation by affecting plant root signaling substances in Heihe (sporadic permafrost zone) (Figure 6b and Figure 7b). MAP affected stem and root carbon allocation through PDC, and SWC affected root carbon allocation through ALDH. MAT affected root carbon allocation through soluble sugar, and proline affected leaf and stem carbon allocation through Heihe. Root signaling substances significantly affected plant–soil carbon allocation in Mohe (discontinuous permafrost zone) through the indirect effects of climate change on soil’s physical and chemical properties (Figure 6c and Figure 7c). SOC and SWC affected root and soil carbon allocation through ADH, C:N and ALT affected leaf carbon allocation through starch. Proline affected stem and root carbon allocation, and ALDH affected root and soil carbon allocation in Mohe.

4. Discussion

4.1. 13C Allocation for Plant–Soil Systems in Peatlands in Permafrost Regions

The allocation of carbon to photosynthates in the plant–soil system after the photosynthesis of peatland plants in the permafrost area is the key to the influence on the size of the wetland carbon sink. A study of the seasonal carbon allocation of L. gemlini in Siberian permafrost suggests that carbon is stored primarily from the end of June until the end of the growing season [37]. In a study of grassland plant soil carbon allocation under grazing on the Qinghai–Tibet Plateau, the greater the underground carbon allocation of grassland plants, the lower the CO2 outflow from soil organic matter, and moderate grazing had a positive impact on soil carbon sequestration [38]. The peatlands in the Greater and Lesser Xing’an Mountain permafrost areas are greatly affected by the degradation of the permafrost under climate warming, which changes the physical and chemical properties of the peatland soil and therefore affects the growth of plants [10]. L. gemlini, as the main tree species, is widely distributed in the permafrost areas of the Xing’an Mountains. Compared to the other three species, 13C fluctuated more with the marking time, which may be related to the carbon cycle of the plant rhizosphere [37]. The 13C allocation of L. gemlini leaves was the highest in the discontinuous permafrost area and the lowest in the sporadic permafrost area, indicating that the 13C that was fixed in leaves after photosynthesis was affected by permafrost degradation. Compared to the island permafrost area, the L. gemlini has an increasing trend of 13C allocated to the root and soil with marking time in the discontinuous permafrost area, indicating that the trend of L. gemlini 13C allocated to the underground area is more stable in the continuous permafrost area. The 13C of V. uliginosum root and soil increased with the marking time in the three permafrost regions, indicating that the flooding state had little effect on 13C accumulation. The distribution of 13C from C. schumidtii and Sphagnum leaves was the highest during sporadic permafrost at 360 h and the highest during discontinuous permafrost at 120 h, indicating that the distribution of 13C to the ground was slower during sporadic permafrost and faster during discontinuous permafrost. The 13C in root and soil also showed fluctuations with marking time, which was probably related to the waterlogged state of the plants.

4.2. Effects of Permafrost Degradation on Plant Root Signaling Substances

In response to the stress brought about by environmental changes, plants usually use root signaling substances (hormones, antioxidant systems, anaerobic metabolites, and osmotic regulatory substances) to regulate nutrients and water in the plant–soil system [27]. The degradation of permafrost causes changes in the growth environment of plants in peatland [17], which can result in plants being in a state of stress. The main root signaling substances regulating plant growth in the peatlands of the three permafrost areas were nonstructural carbohydrates, osmotic regulatory substances, hormones, and anaerobic metabolites, indicating that plants’ root signaling substances started regulating growth under the degradation of permafrost. L. gemlini, C. schumidtii, and Sphagnum showed a decrease in ST content, an increase in PDC content, and a decrease in ADH content at the beginning of labeling, indicating that plants consume a small amount of starch and glucose through the glycolytic and anaerobic metabolism to ensure growth in isolated patches of the permafrost regions under water flooding stress. This may explain the slower distribution of 13C underground. Consistent with the results of 13C allocation with labeling time, V. uliginosum 13C accumulation was less affected by flooding in sporadic permafrost regions. The root signaling substances of V. uliginosum and L. gemlini varied significantly with the labeling time, indicating that tree roots in sporadic permafrost areas were more susceptible to environmental changes than other plants. The L. gemlini that grows in the permafrost is threatened by the loss of permafrost in isolated permafrost areas, which will have an impact on the carbon cycle of permafrost ecosystems [39]. Plants in the sporadic permafrost region use hormones to regulate plant growth after waterlogging. Ethylene-mediated GA drives starch and soluble sugar catabolism in plants, and the Pro content increases at 2–120 h to remove reactive oxygen species and maintain osmotic pressure. The results indicated that the growth of plants in the sporadic permafrost area was affected by transient flooding stress. The ST content of C. schumidtii in the discontinuous permafrost area decreased from 2 to 24 h, while that of other plants decreased after 120 h, indicating that C. schumidtii first reacted to stress and the Pro content increased at 120 h to remove ROS. Sphagnum’s ADH content decreased significantly at 2–24 h to resist hypoxia and quickly adapted to environmental changes. This is consistent with the fact that C. schumidtii and Sphagnum distributed 13C underground more rapidly in discontinuous permafrost regions, and they showed different defensive strategies during flooding stress.

4.3. Carbon Allocation in Plant–Soil System Affects Carbon Cycle under Permafrost Degradation

Against the background of global warming, permafrost degradation appears [40,41], which will lead to changes in soil’s physical and chemical properties and affect carbon allocation in the plant–soil system [42], thus affecting carbon cycling in permafrost regions [43,44]. Permafrost degradation manifests itself in the form of thermal collapse [14] and thickening of the active layer [10]. The study of the composition and productivity of plant species after permafrost thawing in the Alaskan tundra shows that the tundra ecosystem is changing to one dominated by shrubs and mosses [45]. Permafrost degradation releases more carbon dioxide than is absorbed by primary productivity and can lead to changes in the structure of the community, which in turn affects the hydrothermal processes in the permafrost and active layers [46]. A study of plant carbon allocation and soil organic matter turnover in Canadian permafrost found that recently synthesized photosynthates drive the mineralization of older SOC under tundra vegetation [14]. Located at the southern edge of the Eurasiatic permafrost, the Xing’an Mountains have three types of permafrost and rich vegetation types. Therefore, permafrost degradation is manifested by differences in latitude and the deepening of the thickness of the active layer [46]. The thickness of the active layer is the main factor affecting the distribution and sum of photosynthetic 13C. The distribution of 13C to the ground is mainly because the discontinuous permafrost area is larger than the island permafrost area [47]. SOC, C:N, ALT, and SWC regulate the allocation of plant carbon by influencing anaerobic metabolites and ST in the discontinuous permafrost region, indicating that root signaling substances in the continuous permafrost region are easily affected by soil’s physical and chemical properties (Figure 7a), which is consistent with the study on the Qinghai–Tibet Plateau [48]. In sporadic permafrost regions, MAP, MAT, and SWC affect plant carbon allocation by influencing anaerobic metabolites and SS, and are regulated by hormones and osmoregulatory substances when resisting anoxia (Figure 7b). These results indicate that the allocation of carbon from the plant soil in the sporadic permafrost region is susceptible to climate change and transient flooding stress. MAP and SWC affect plant–soil carbon allocation by influencing anaerobic metabolites, and MAP and ALT affect carbon allocation by regulating nonstructural carbohydrates in sporadic island permafrost regions (Figure 7c). Therefore, the water content and the thickness of the active layer are the key factors affecting carbon allocation, which is consistent with the findings of the study of the Arctic carbon cycle [49]. Plant–soil carbon allocation in isolated patches of permafrost regions is more susceptible to the indirect and direct effects of many factors. The physical properties of the soil are affected by climate change in sporadic permafrost regions, and the allocation of carbon is regulated by root signaling substances. Carbon allocation in the discontinuous permafrost areas is mainly regulated by root signaling substances that are affected by soil’s physical and chemical properties under climate change. Compared to the sporadic permafrost regions, the carbon allocation in discontinuous and isolated patches of the permafrost regions is more affected by the regulation of root signaling substances. Therefore, the mechanism of the regulation of carbon allocation between plants and soils is affected by permafrost degradation.

5. Conclusions

The carbon allocation mechanism of plant–soil systems in different permafrost regions is affected by permafrost degradation. In isolated patches of permafrost regions, plants consume a small amount of starch and glucose to ensure growth through glycolysis and anaerobic metabolism during flood stress. Tree roots are more susceptible to environmental changes than other plants. MAP and SWC affect plant–soil carbon allocation by influencing anaerobic metabolites, and MAP and ALT affect carbon allocation by regulating nonstructural carbohydrates. Plants use hormones to regulate plant growth after flooding. MAP, MAT, and SWC affect plant carbon allocation by influencing anaerobic metabolites and SS, and regulate this via hormones and osmoregulatory substances when resisting anoxia in the sporadic permafrost region. SOC, C:N, ALT, and SWC regulate plant–soil carbon allocation by influencing anaerobic metabolites and ST. Root signaling substances are easily affected by the physical and chemical properties of soil in discontinuous permafrost regions.

Author Contributions

Conceptualization, L.W.; methodology, S.Q.; data curation, S.L.; writing—original draft preparation, L.C. All authors have read and agreed to the published version of the manuscript.

Funding

This research was funded by National Natural Science Foundation of China, grant number 42071079, 41671100 and Natural Science Foundation of Heilongjiang Province of China, grant number TD2023D005.

Data Availability Statement

The data presented in this study are available upon request from the corresponding author.

Conflicts of Interest

The authors declare no conflicts of interest.

References

  1. Wu, T.; Wang, D.; Mu, C.; Zhang, W.; Zhu, X.; Zhao, L.; Li, R.; Hu, G.; Zou, D.; Chen, J.; et al. Storage, patterns, and environmental controls of soil organic carbon stocks in the permafrost regions of the Northern Hemisphere. Sci. Total Environ. 2022, 828, 154464. [Google Scholar] [CrossRef] [PubMed]
  2. Keuper, F.; van Bodegom, P.M.; Dorrepaal, E.; Weedon, J.T.; van Hal, J.; van Logtestijn, R.S.P.; Aerts, R. A frozen feast: Thawing permafrost increases plant-available nitrogen in subarctic peatlands. Glob. Chang. Biol. 2012, 18, 1998–2007. [Google Scholar] [CrossRef]
  3. Mao, C.; Kou, D.; Chen, L.; Qin, S.; Zhang, D.; Peng, Y.; Yang, Y. Permafrost nitrogen status and its determinants on the Tibetan Plateau. Glob. Chang. Biol. 2020, 26, 5290–5302. [Google Scholar] [CrossRef]
  4. Voigt, C.; Marushchak, M.E.; Mastepanov, M.; Lamprecht, R.E.; Christensen, T.R.; Dorodnikov, M.; Jackowicz-Korczynski, M.; Lindgren, A.; Lohila, A.; Nykanen, H.; et al. Ecosystem carbon response of an Arctic peatland to simulated permafrost thaw. Glob. Chang. Biol. 2019, 25, 1746–1764. [Google Scholar] [CrossRef] [PubMed]
  5. Yang, G.; Peng, Y.; Abbott, B.W.; Biasi, C.; Wei, B.; Zhang, D.; Wang, J.; Yu, J.; Li, F.; Wang, G.; et al. Phosphorus rather than nitrogen regulates ecosystem carbon dynamics after permafrost thaw. Glob. Chang. Biol. 2021, 27, 5818–5830. [Google Scholar] [CrossRef] [PubMed]
  6. Mekonnen, Z.A.; Riley, W.J.; Berner, L.T.; BouskiMAll, N.J.; Torn, M.S.; Iwahana, G.; Breen, A.L.; Myers-Smith, I.H.; Criado, M.G.; Liu, Y.; et al. Arctic tundra shrubification: A review of mechanisms and impacts on ecosystem carbon balance. Environ. Res. Lett. 2021, 16, 053001. [Google Scholar] [CrossRef]
  7. Dieleman, C.M.; Day, N.J.; Holloway, J.E.; Baltzer, J.; Douglas, T.A.; Turetsky, M.R. Carbon and nitrogen cycling dynamics following permafrost thaw in the Northwest Territories, Canada. Sci. Total Environ. 2022, 845, 157288. [Google Scholar] [CrossRef] [PubMed]
  8. Wang, Y.; Xu, Y.; Wei, D.; Shi, L.; Jia, Z.; Yang, Y. Different chemical composition and storage mechanism of soil organic matter between active and permafrost layers on the Qinghai–Tibetan Plateau. J. Soils Sediments 2019, 20, 653–664. [Google Scholar] [CrossRef]
  9. Li, X.; Jin, H.; Sun, L.; Wang, H.; He, R.; Huang, Y.; Chang, X. Climate warming over 1961–2019 and impacts on permafrost zonation in Northeast China. J. For. Res. 2021, 33, 767–788. [Google Scholar] [CrossRef]
  10. Che, L.; Cheng, M.; Xing, L.; Cui, Y.; Wan, L. Effects of permafrost degradation on soil organic matter turnover and plant growth. Catena 2022, 208, 105721. [Google Scholar] [CrossRef]
  11. Standen, K.M.; Baltzer, J.L. Permafrost condition determines plant community composition and community-level foliar functional traits in a boreal peatland. Ecol. Evol. 2021, 11, 10133–10146. [Google Scholar] [CrossRef] [PubMed]
  12. Guo, J.; Hu, Y.; Xiong, Z.; Yan, X.; Ren, B.; Bu, R. Spatiotemporal Variations of Growing-season NDVI Associated with Climate Change in Northeastern China’s Permafrost Zone. Pol. J. Environ. Stud. 2017, 26, 1521–1529. [Google Scholar] [CrossRef] [PubMed]
  13. Moore, T.R.; Alfonso, A.; Clarkson, B.R. Plant uptake of organic nitrogen in two peatlands. Plant Soil 2018, 433, 391–400. [Google Scholar] [CrossRef]
  14. Street, L.E.; Garnett, M.H.; Subke, J.A.; Baxter, R.; Dean, J.F.; Wookey, P.A. Plant carbon allocation drives turnover of old soil organic matter in permafrost tundra soils. Glob. Chang. Biol. 2020, 26, 4559–4571. [Google Scholar] [CrossRef]
  15. Wang, J.; Liu, D. Vegetation green-up date is more sensitive to permafrost degradation than climate change in spring across the northern permafrost region. Glob. Chang. Biol. 2021, 28, 1569–1582. [Google Scholar] [CrossRef] [PubMed]
  16. Chaudhary, N.; Westermann, S.; Lamba, S.; Shurpali, N.; Sannel, A.B.K.; Schurgers, G.; Miller, P.A.; Smith, B. Modelling past and future peatland carbon dynamics across the pan-Arctic. Glob. Chang. Biol. 2020, 26, 4119–4133. [Google Scholar] [CrossRef]
  17. Che, L.; Xuan, L.; Wan, L. Allocation and transfer of photosynthetic 13C in the vegetation-soil system and its response to permafrost degradation. Land Degrad. Dev. 2022, 34, 453–465. [Google Scholar] [CrossRef]
  18. Wan, X.; Yu, Z.; Wang, M.; Zhang, Y.; Huang, Z. Litter and root traits control soil microbial composition and enzyme activities in 28 common subtropical tree species. J. Ecol. 2022, 110, 3012–3022. [Google Scholar] [CrossRef]
  19. Yin, L.; Dijkstra, F.A.; Wang, P.; Zhu, B.; Cheng, W. Rhizosphere priming effects on soil carbon and nitrogen dynamics among tree species with and without intraspecific competition. New Phytol. 2018, 218, 1036–1048. [Google Scholar] [CrossRef]
  20. AbuQamar, S.; Moustafa, K.; Tran, L.S. Mechanisms and strategies of plant defense against Botrytis cinerea. Crit. Rev. Biotechnol. 2017, 37, 262–274. [Google Scholar] [CrossRef]
  21. Mundim, F.M.; Alborn, H.T.; Vieira-Neto, E.H.; Bruna, E.M. A whole-plant perspective reveals unexpected impacts of above- and belowground herbivores on plant growth and defense. Ecology 2017, 98, 70–78. [Google Scholar] [CrossRef]
  22. Desalme, D.; Priault, P.; Gerant, D.; Dannoura, M.; Maillard, P.; Plain, C.; Epron, D. Seasonal variations drive short-term dynamics and partitioning of recently assimilated carbon in the foliage of adult beech and pine. New Phytol. 2017, 213, 140–153. [Google Scholar] [CrossRef]
  23. Wang, X.; Li, M.; Jannasch, A.H.; Jiang, Y. Submergence stress alters fructan and hormone metabolism and gene expression in perennial ryegrass with contrasting growth habits. Environ. Exp. Bot. 2020, 179, 104202. [Google Scholar] [CrossRef]
  24. Gao, J.Q.; Gao, J.J.; Zhang, X.W.; Xu, X.L.; Deng, Z.H.; Yu, F.H. Effects of waterlogging on carbon assimilate partitioning in the Zoige alpine wetlands revealed by 13CO2 pulse labeling. Sci. Rep. 2015, 5, 9411. [Google Scholar] [CrossRef] [PubMed]
  25. Obersteiner, S.; Klein, T. Closing in on the last frontier: C allocation in the rhizosphere. Glob. Chang. Biol. 2022, 28, 6835–6837. [Google Scholar] [CrossRef]
  26. Li, L.; Shao, T.; Yang, H.; Chen, M.; Gao, X.; Long, X.; Shao, H.; Liu, Z.; Rengel, Z. The endogenous plant hormones and ratios regulate sugar and dry matter accumulation in Jerusalem artichoke in salt-soil. Sci. Total Environ. 2017, 578, 40–46. [Google Scholar] [CrossRef] [PubMed]
  27. Wu, X.; Ding, C.; Baerson, S.R.; Lian, F.; Lin, X.; Zhang, L.; Wu, C.; Hwang, S.Y.; Zeng, R.; Song, Y. The roles of jasmonate signalling in nitrogen uptake and allocation in rice (Oryza sativa L.). Plant Cell Environ. 2019, 42, 659–672. [Google Scholar] [CrossRef]
  28. Takahashi, F.; Suzuki, T.; Osakabe, Y.; Betsuyaku, S.; Kondo, Y.; Dohmae, N.; Fukuda, H.; Yamaguchi-Shinozaki, K.; Shinozaki, K. A small peptide modulates stomatal control via abscisic acid in long-distance signalling. Nature 2018, 556, 235–238. [Google Scholar] [CrossRef]
  29. Hikino, K.; Danzberger, J.; Riedel, V.P.; Hesse, B.D.; Hafner, B.D.; Gebhardt, T.; Rehschuh, R.; Ruehr, N.K.; Brunn, M.; Bauerle, T.L.; et al. Dynamics of initial carbon allocation after drought release in mature Norway spruce-Increased belowground allocation of current photoassimilates covers only half of the carbon used for fine-root growth. Glob. Chang. Biol. 2022, 28, 6889–6905. [Google Scholar] [CrossRef]
  30. Liu, Y.; Ge, T.; Ye, J.; Liu, S.; Shibistova, O.; Wang, P.; Wang, J.; Li, Y.; Guggenberger, G.; Kuzyakov, Y.; et al. Initial utilization of rhizodeposits with rice growth in paddy soils: Rhizosphere and N fertilization effects. Geoderma 2019, 338, 30–39. [Google Scholar] [CrossRef]
  31. Heinrich, S.; Dippold, M.A.; Werner, C.; Wiesenberg, G.L.; Kuzyakov, Y.; Glaser, B. Allocation of freshly assimilated carbon into primary and secondary metabolites after in situ 13C pulse labelling of Norway spruce (Picea abies). Tree Physiol. 2015, 35, 1176–1191. [Google Scholar] [PubMed]
  32. Che, L.; Zhang, H.; Wan, L. Spatial distribution of permafrost degradation and its impact on NDVI and vegetation phenology from 2000 to 2020. Sci. Total Environ. 2023, 887, 162889. [Google Scholar] [CrossRef] [PubMed]
  33. Obu, J.; Westermann, S.; Bartsch, A.; Berdnikov, N.; Christiansen, H.H.; Dashtseren, A.; Delaloye, R.; Elberling, B.; Etzelmüller, B.; Kholodov, A.; et al. Northern Hemisphere permafrost map based on TTOP modelling for 2000–2016 at 1 km2 scale. Earth-Sci. Rev. 2019, 193, 299–316. [Google Scholar] [CrossRef]
  34. Lefcheck, J.S.; Freckleton, R. piecewiseSEM: Piecewise structural equation modelling in r for ecology, evolution, and systematics. Methods Ecol. Evol. 2015, 7, 573–579. [Google Scholar] [CrossRef]
  35. Li, X.; Wen, B.; Yang, F.; Hartley, A.; Li, X. Effects of alternate flooding-drought conditions on degenerated Phragmites australis salt marsh in Northeast China. Restor. Ecol. 2022, 25, 810–819. [Google Scholar] [CrossRef]
  36. Zhao, T.; Sun, S.; Liu, Y. Regulating the drought-responsive element (DRE) mediated signaling pathway by synergic functions of transactive and trans-inactive DRE binding factors in Brassica napus. J. Biol. Chem. 2006, 281, 10752–10759. [Google Scholar] [CrossRef]
  37. Masyagina, O.; Prokushkin, A.; Kirdyanov, A.; Artyukhov, A.; Udalova, T.; Senchenkov, S.; Rublev, A. Intraseasonal carbon sequestration and allocation in larch trees growing on permafrost in Siberia after 13C labeling (two seasons of 2013–2014 observation). Photosynth. Res. 2016, 130, 267–274. [Google Scholar] [CrossRef]
  38. Hafner, S.; Unteregelsbacher, S.; Seeber, E.; Lena, B.; Xu, X.; Li, X.; Guggenberger, G.; Miehe, G.; Kuzyakov, Y. Effect of grazing on carbon stocks and assimilate partitioning in a Tibetan montane pasture revealed by 13CO2 pulse labeling. Glob. Chang. Biol. 2012, 18, 528–538. [Google Scholar] [CrossRef]
  39. Strauss, J.; Schirrmeister, L.; Grosse, G.; Fortier, D.; Hugelius, G.; Knoblauch, C.; Romanovsky, V.; Schädel, C.; Schneider von Deimling, T.; Schuur, E.A.G.; et al. Deep Yedoma permafrost: A synthesis of depositional characteristics and carbon vulnerability. Earth-Sci. Rev. 2017, 172, 75–86. [Google Scholar] [CrossRef]
  40. Schuur, E.A.G.; McGuire, A.D.; Schadel, C.; Grosse, G.; Harden, J.W.; Hayes, D.J.; Hugelius, G.; Koven, C.D.; Kuhry, P.; Lawrence, D.M.; et al. Climate change and the permafrost carbon feedback. Nature 2015, 520, 171–179. [Google Scholar] [CrossRef]
  41. Ping, C.L.; Jastrow, J.D.; Jorgenson, M.T.; Michaelson, G.J.; Shur, Y.L. Permafrost soils and carbon cycling. Soil 2015, 1, 147–171. [Google Scholar] [CrossRef]
  42. Li, F.; Peng, Y.; Chen, L.; Yang, G.; Abbott, B.W.; Zhang, D.; Fang, K.; Wang, G.; Wang, J.; Yu, J.; et al. Warming alters surface soil organic matter composition despite unchanged carbon stocks in a Tibetan permafrost ecosystem. Funct. Ecol. 2019, 34, 911–922. [Google Scholar] [CrossRef]
  43. Wei, H.; Man, X. Increased Litter Greatly Enhancing Soil Respiration in Betula platyphylla Forests of Permafrost Region, Northeast China. Forests 2021, 12, 89. [Google Scholar] [CrossRef]
  44. Liu, Y.; Ge, T.; Zhu, Z.; Liu, S.; Luo, Y.; Li, Y.; Wang, P.; Gavrichkova, O.; Xu, X.; Wang, J.; et al. Carbon input and allocation by rice into paddy soils: A review. Soil Biol. Biochem. 2019, 133, 97–107. [Google Scholar] [CrossRef]
  45. Schuur, E.A.G.; Crummer, K.G.; Vogel, J.G.; Mack, M.C. Plant Species Composition and Productivity following Permafrost Thaw and Thermokarst in Alaskan Tundra. Ecosystems 2007, 10, 280–292. [Google Scholar] [CrossRef]
  46. Jin, X.-Y.; Jin, H.-J.; Iwahana, G.; Marchenko, S.S.; Luo, D.-L.; Li, X.-Y.; Liang, S.-H. Impacts of climate-induced permafrost degradation on vegetation: A review. Adv. Clim. Chang. Res. 2021, 12, 29–47. [Google Scholar] [CrossRef]
  47. Fisher, J.P.; Estop-Aragones, C.; Thierry, A.; Charman, D.J.; Wolfe, S.A.; Hartley, I.P.; Murton, J.B.; Williams, M.; Phoenix, G.K. The influence of vegetation and soil characteristics on active-layer thickness of permafrost soils in boreal forest. Glob. Chang. Biol. 2016, 22, 3127–3140. [Google Scholar] [CrossRef] [PubMed]
  48. Liu, L.; Zhuang, Q.; Zhao, D.; Zheng, D.; Kou, D.; Yang, Y. Permafrost Degradation Diminishes Terrestrial Ecosystem Carbon Sequestration Capacity on the Qinghai-Tibetan Plateau. Glob. Biogeochem. Cycles 2022, 36, e2021GB007068. [Google Scholar] [CrossRef]
  49. Bruhwiler, L.; Parmentier, F.-J.W.; Crill, P.; Leonard, M.; Palmer, P.I. The Arctic Carbon Cycle and Its Response to Changing Climate. Curr. Clim. Chang. Rep. 2021, 7, 14–34. [Google Scholar] [CrossRef]
Figure 1. Overview of the study area.
Forests 15 01199 g001
Figure 2. Field in situ labeling experiments: Yichun (a). V. uliginosum, C. schumidtii, and Sphagnum unmarked; (b). V. uliginosum, C. schumidtii, and Sphagnum marked; (c). L. gemlini marked; Heihe (d). V. uliginosum, C. schumidtii, and Sphagnum unmarked; (e). V. uliginosum, C. schumidtii, and Sphagnum marked; (f). L. gemlini marked; Mohe (g). V. uliginosum, C. schumidtii, and Sphagnum unmarked; (h). V. uliginosum, C. schumidtii, and Sphagnum marked; and (i). L. gemlini marked.
Forests 15 01199 g002
Figure 3. Changes in carbon allocation in the plant–soil system of peatland in different permafrost regions with marking time (leaves: (a,e,i); stem: (b,f,j); roots: (c,g,k); soil: (d,h,l)).
Forests 15 01199 g003aForests 15 01199 g003b
Figure 4. Principal component analysis of plant root signaling substances in peatland under different permafrost areas ((a). Yichun; (b). Hehe; (c). Mohe). ABA = abscisic acid; ETH = ethylene; GA = gibberellic acid; POD = peroxidase; SOD = superoxide dismutase; SS = soluble sugar; ST = starch; Pro = proline; PDC = pyruvate decarboxylase; ADH = alcohol dehydrogenase; ALDH = aldehyde decarboxylase.
Forests 15 01199 g004
Figure 5. Changes in the major root signaling substances affecting plant growth in different permafrost regions with the marking time ((a) Yichun; (b) Hehe; (c) Mohe). *, p < 0.05 (Tukey’s significant test). SS = soluble sugar; ST = starch; Pro = proline; PDC = pyruvate decarboxylase; ADH = alcohol dehydrogenase; ALDH = aldehyde decarboxylase.
Forests 15 01199 g005aForests 15 01199 g005b
Figure 6. Piecewise SEM was used to evaluate the direct and indirect effects of changes in plant root signals on carbon allocation in different permafrost regions. The width of the arrow indicates the strength of the relationship. Red arrows indicate important paths and dotted arrows indicate non-important relationships (p > 0.1) (ac). Normalization effects between variables in different permafrost regions (direct and indirect normalization effects) (df). MAT = mean annual temperature; MAP = mean annual precipitation; SOC = soil organic carbon; C:N = soil carbon/nitrogen ratio; TN = total nitrogen; TP = total phosphorus; SWC = soil water content; ALT = active layer thickness; SS = soluble sugar; ST = starch; Pro = proline; PDC = pyruvate decarboxylase; ADH = alcohol dehydrogenase; ALDH = aldehyde decarboxylase; AIC = Akaike information criterion; BIC = Bayesian information criterion. R2C (conditional R2) represents the proportion of variance explained by fixed and random effects, R2M (marginal R2) represents the proportion of differences in fixed effect interpretation. * p < 0.05, ** p < 0.01, *** p < 0.001.
Forests 15 01199 g006aForests 15 01199 g006b
Figure 7. Carbon allocation mechanism of a plant–soil system regulated by root signaling substances under permafrost degradation.
Forests 15 01199 g007
Table 1. In-site measurement information.
SitesPermafrost ZoneForest TypeActive Layer Depth (m)
YichunSeasonally frozen soilShrub wetlands1.5
HeiheSparsely patched permafrostShrub wetlands1.2
MohePredominantly continuous and island permafrostShrub wetlands1
Table 2. Number of replicates at the appropriate scale.
Scale of InferenceScale at Which the Factor of Interest is AppliedNumber of Replicates at the Appropriate Scale
Permafrost zonesPlant3 permafrost zones, 3 peatlands, 4 plant species, 3 samples were collected from each species at each time
Disclaimer/Publisher’s Note: The statements, opinions and data contained in all publications are solely those of the individual author(s) and contributor(s) and not of MDPI and/or the editor(s). MDPI and/or the editor(s) disclaim responsibility for any injury to people or property resulting from any ideas, methods, instructions or products referred to in the content.

