Article

Spatio-Temporal Evolution of Vegetation Coverage and Eco-Environmental Quality and Their Coupling Relationship: A Case Study of Southwestern Shandong Province, China

1
School of Surveying and Geo-Informatics, Shandong Jianzhu University, Jinan 250101, China
2
Department of Geography, National University of Singapore, Singapore 117568, Singapore
*
Author to whom correspondence should be addressed.
Forests 2024, 15(7), 1200; https://doi.org/10.3390/f15071200
Submission received: 30 May 2024 / Revised: 29 June 2024 / Accepted: 9 July 2024 / Published: 11 July 2024
(This article belongs to the Special Issue Application of Remote Sensing in Vegetation Dynamic and Ecology)

Abstract

:
Propelled by rapid economic growth, the southwestern Shandong urban agglomeration (SSUA) in China has become a crucial industrial hub, but this process has somewhat hindered vegetation growth and environmental quality. Leveraging the functionalities of the Google Earth Engine (GEE) platform, we derived the fractional vegetation coverage (FVC) through the Normalized Difference Vegetation Index (NDVI) and assessed the eco-environmental quality using the Remote Sensing Ecological Index (RSEI). To examine the patterns and shifts in the SSUA, we employed the Theil–Sen median slope estimation, which provided robust estimates of linear trends, the Mann–Kendall trend test to determine the statistical significance of these trends, and the Hurst exponent analysis to evaluate the long-term persistence and predict future changes in the vegetation coverage and eco-environmental quality. Furthermore, to explore the interdependencies between vegetation coverage (VC) and environmental quality, we applied an improved coupling coordination degree model (ICCDM). This model allowed us to assess the co-evolution and synergy between these two factors over the study period, providing comprehensive insights for sustainable urban and ecological planning in the region. The VC and eco-environmental quality improved consistently across most of the SSUA from 2000 to 2020. The dominance of VC had transitioned from being predominantly characterized by relatively high VC to being mainly characterized by high VC. A substantial portion of the SSUA is predicted to experience improvements in its VC and environmental quality moving forward. Furthermore, the coupling coordination relationship between VC and environmental conditions in the southwest of Shandong Province generally exhibited a state of orderly coordinated development. With the passage of time, there was a clear tendency toward expansion in the coupled uncoordinated areas distributed in a network within each regional economic center. Our research unveils the dynamics and spatial-temporal patterns of VC and ecological quality in the southwestern Shandong urban agglomeration (SSUA) and elucidates the coupling and coordination mechanism between these two aspects, which provides theoretical support for understanding the healthy development of vegetation and ecology in urban agglomerations in an industrial context.

1. Introduction

In recent decades, urban green spaces have increasingly been replaced by impermeable surfaces. This shift has exacerbated the conflict between the increasing demand for green spaces from citizens and the diminishing availability of urban green areas [1], and eco-environmental conditions have been deteriorating. Taking the example of southwestern Shandong Province, the southwestern Shandong urban agglomeration (SSUA) sits in the southwestern region of Shandong Province [2]. In 2020, the Shandong Provincial Government enacted “the Guiding Opinions on Accelerating the Integrated Development of the southwest Shandong province Economic Circle”, which stated that the collaborative management of the ecological environment and the ecological preservation and restoration of the SSUA should be promoted. As a key breakthrough area in the Shandong Comprehensive Pilot Zone for Replacing Old Growth Drivers with New Ones, the SSUA is undergoing a transition in traditional industrial services that must align with ecological conservation and coordinated development. Vegetation, collectively referring to plant communities covering the Earth’s surface [3], is a vital metric for evaluating vegetation health and alterations in ecological systems [4], offering insights into the alterations of the eco-environment to a specific degree [5]. Investigating the vegetation coverage (VC) and eco-environmental quality of urban agglomerations, along with their coupling coordination relationships (CCRs), contributes to a rational resolution of conflicts between economic growth and ecological integrity.
The extraction of vegetation [6,7], assessment of ecological environment quality [8], spatio-temporal patterns of vegetation and eco-environmental quality [9,10,11], and coupling analysis of vegetation coverage or eco-environmental quality with other factors [12,13] are the four major research themes in the current research on VC and ecological quality (EQ). In terms of vegetation extraction, although there are vegetation extraction indices (e.g., Enhanced Mangrove Vegetation Index (EMVI) [14]; Vegetation Index (VI) [15]) and machine learning-based algorithms such as random forests applied to different scenarios [16], the Normalized Difference Vegetation Index (NDVI) has been tested to be more universally applicable in different types of data sources [17,18,19] and at different spatial scales [20]. Secondly, EQ assessment methods are mainly divided into two categories: evaluation through specific ecological indicators [18] and indirect evaluation relying on approximate indicators such as vegetation cover or urbanization level [21]. Specific ecological indicators are mainly divided into the Remote Sensing Ecological Index (RSEI) [22,23] and Improved RSEI [24,25]. Chen et al. [26] introduced seasonal change factors when constructing an IRSEI, and although the IRSEI is more regionally representative, the RESI avoids the interference of subjective human factors, and the results are more objective. In the examination of spatial and temporal fluctuations in the VC and eco-environmental quality, geographic spatial analysis techniques such as Moran’s index, coefficient of variation, linear regression, and the Hurst exponent have been widely applied [9,23,27]. Although Moran’s index and the standard deviational ellipse often analyze data at county or district levels, methods like trend analysis and the Hurst exponent can extend their analysis to the resolution of source data, allowing for a more detailed observation of regional changes. Finally, most of the current analyses on the coupling of fractional vegetation cover (FVC) and ecological conditions concentrate on investigating the coupling relationship between the two and their influencing factors [28], and few studies have concentrated on the coupling relationship between vegetation cover and ecological environment, so it is groundbreaking to investigate the interplay between vegetation and ecology in the context of industry.
In summary, there are several shortcomings in the research of regional VC and ecological environment quality: (1) The data processing based on abundant sources such as Landsat and MODIS faces challenges related to the large volume of data [10]. (2) The study areas of the existing studies are mostly focused on watershed wetland ecological protection areas [8], with limited studies focusing on the long-term dynamics of industrial urban agglomeration. (3) Many studies focus solely on the factors influencing VC or changes in ecological conditions [21,28]. There is insufficient research on the coordination relationship between VC and ecological conditions. Over the past two decades, the Chinese government has implemented a sequence of ecological restoration and protection policies [29], aimed at restoring ecological balance and improving environmental quality. However, the early models of urban development excessively consumed ecological resources [30], causing significant negative impacts on the environment.
In this research, based on the characteristics of the SSUA, our study focuses on two main aspects: First, we investigated whether there has been an improvement in the FVC and RSEI in the SSUA from 2000 to 2020. Second, we examined whether there are significant differences in the coupling relationship between the FVC and RSEI across different cities and between urban and rural areas within the SSUA. Using the Google Earth Engine (GEE) platform, we applied Theil–Sen median slope estimation, Mann–Kendall trend analysis, and Hurst exponent persistence analysis to examine the spatial and temporal dynamics and prospective developmental trajectories of VC in the study area. Additionally, the linkage coordination correlation amid VC and environmental quality in industrial urban agglomerations was investigated using the improved coupled coordination degree model (ICCDM). Our research offers a logical foundation for urban ecological environment preservation and planning, guiding the sustainable and robust advancement of the eco-environmental condition in the SSUA.

2. Materials and Method
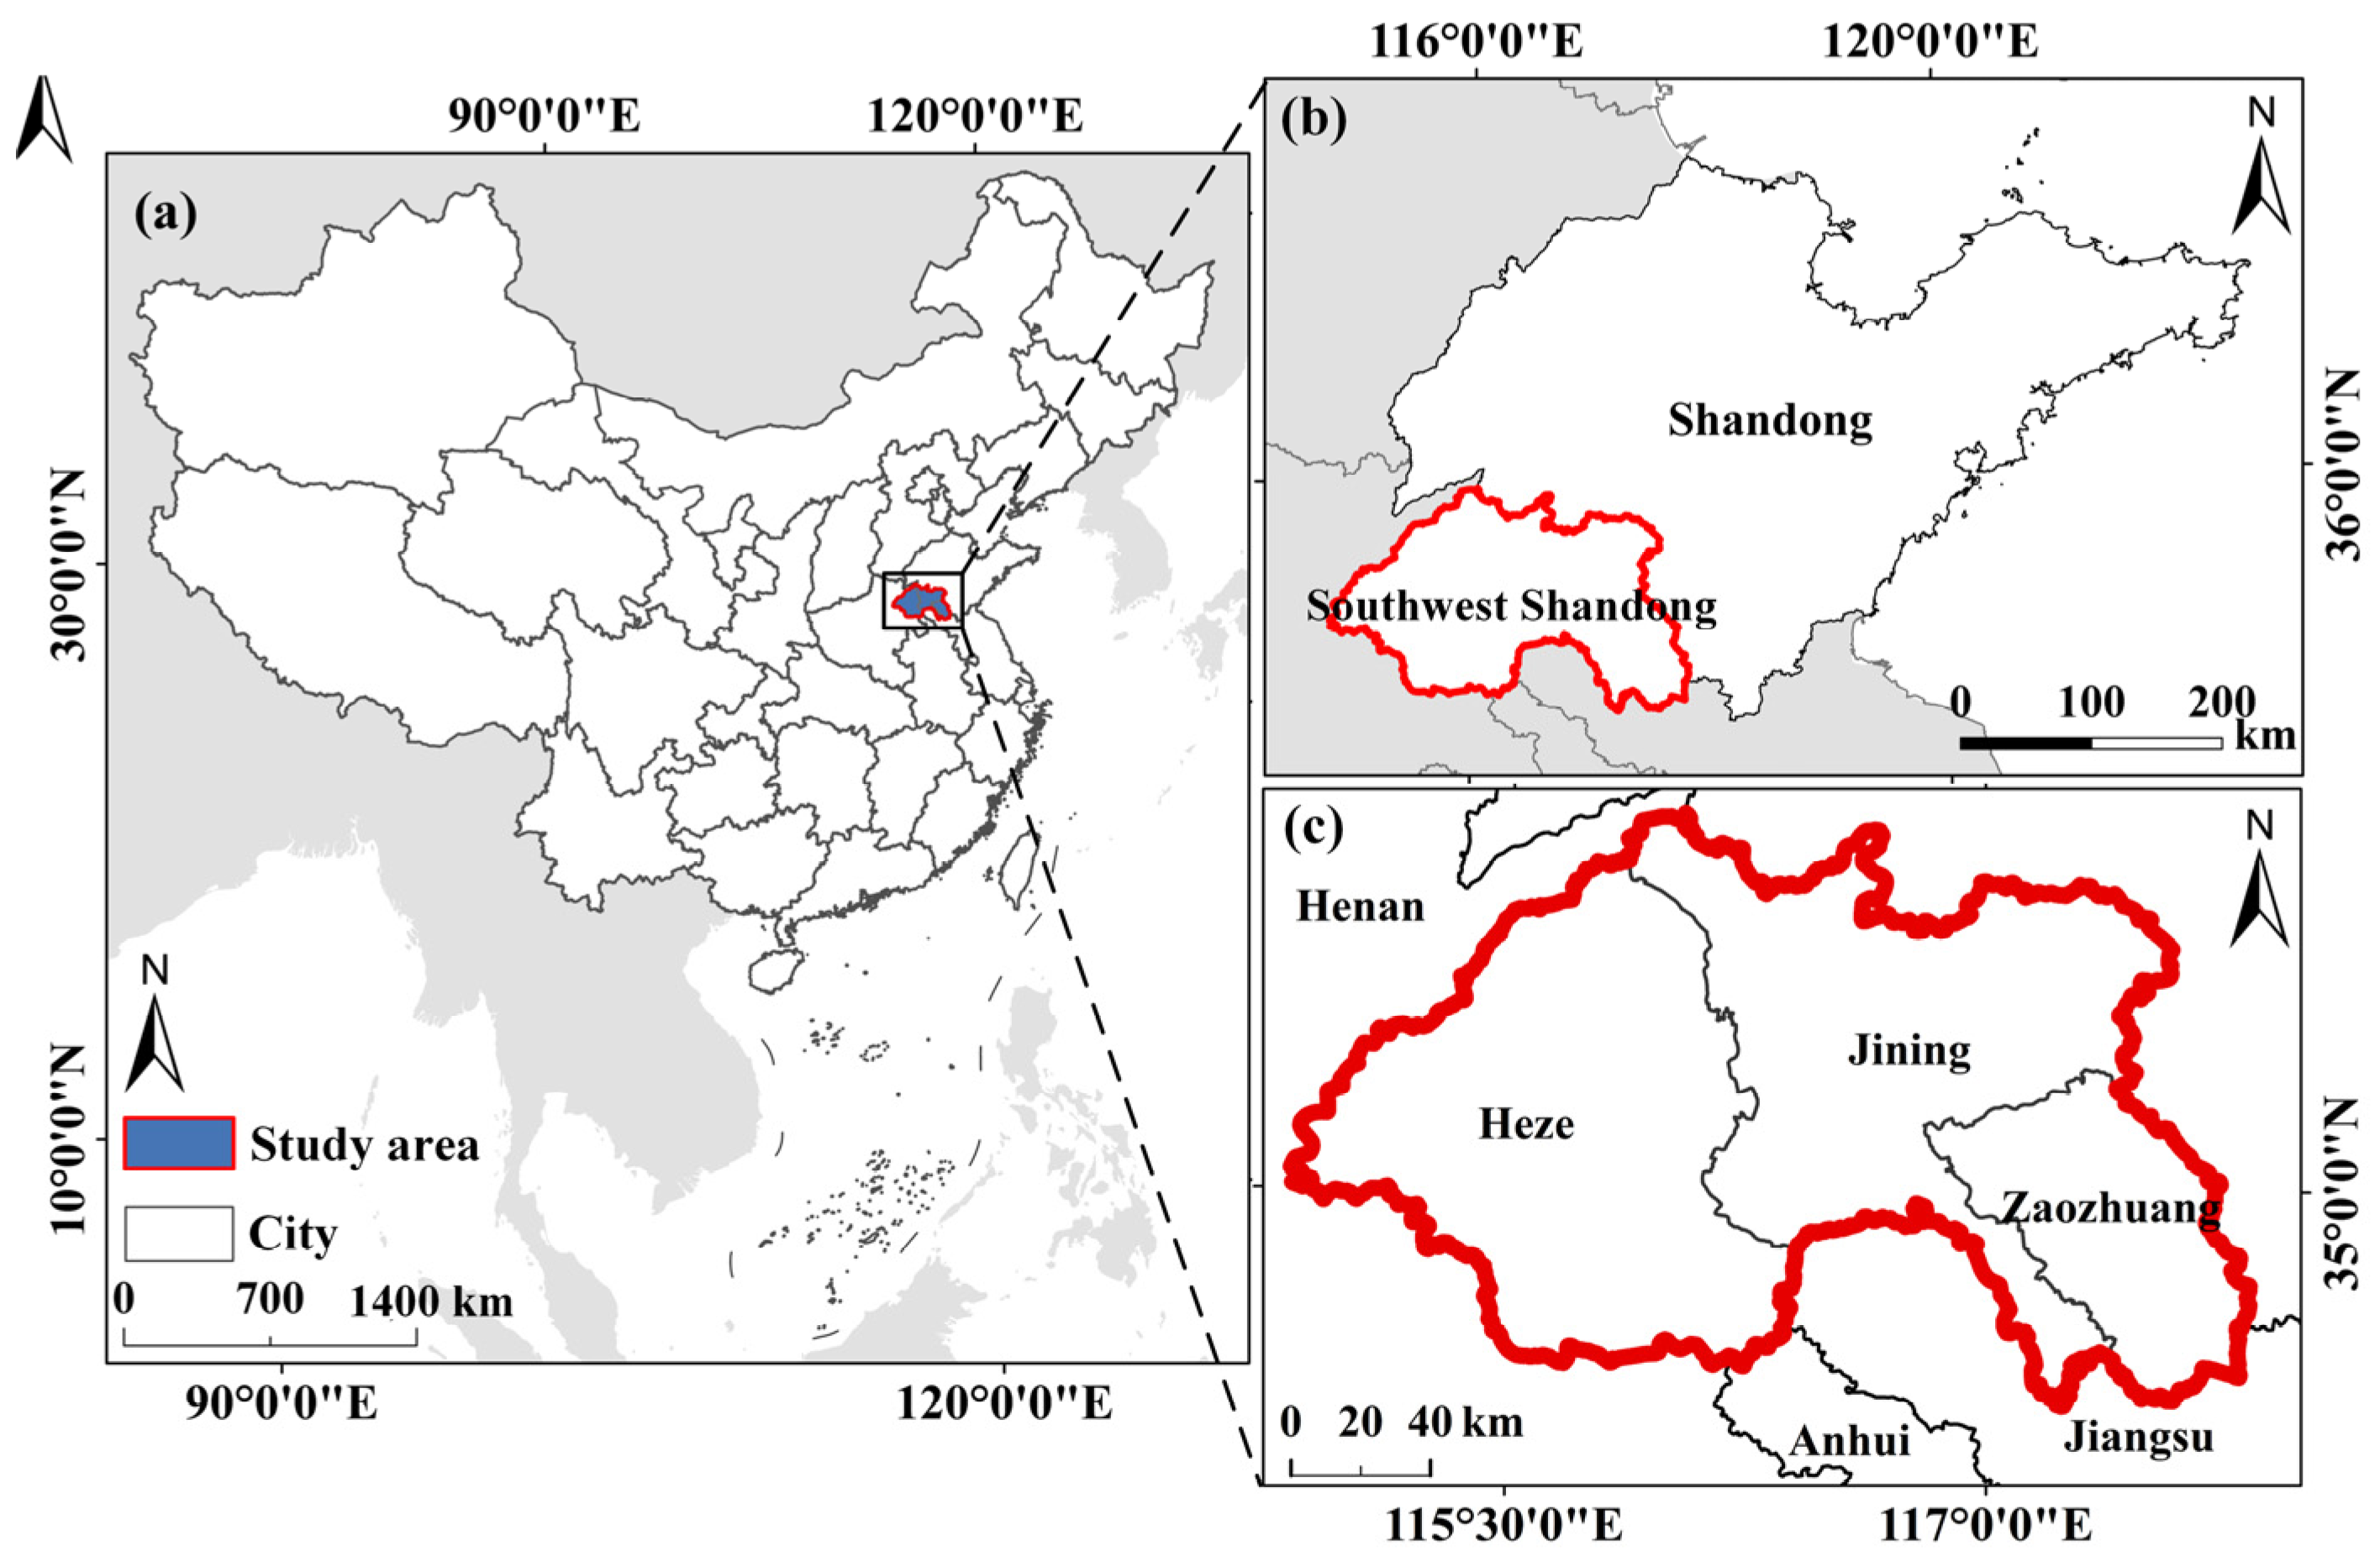
2.1. Study Area

The SSUA (114°45′ E–117°49′ E, 34°26′ N–35°57′ N) covers the southwest region of Shandong Province, China, encompassing the cities of Heze, Jining, and Zaozhuang, with a total area of about 27,803 km2 (as shown in Figure 1). The region experiences a warm temperate, semi-humid monsoon continental climate, characterized by ample sunshine. The mean yearly temperature is 13.6 °C [31]. The terrain primarily comprises plains and depressions, followed by lakes, mountains, and hills [32]. This diverse landscape supports a rich array of vegetation, including broad-leaved forests, coniferous forests, shrublands, and wetland vegetation. In addition to its ecological diversity, the SSUA is endowed with significant underground resources, such as coal, iron, salt minerals, and gas, which have established it as a vital industrial hub within Shandong Province. As of 2023, the regional gross domestic product (GDP) totaled CNY 1213.77 billion. Given its economic and ecological importance, examining the spatio-temporal fluctuations in the VC and ecological quality in the SSUA, and their coupling coordination relationship, is vital for fostering enduring and robust urban development.

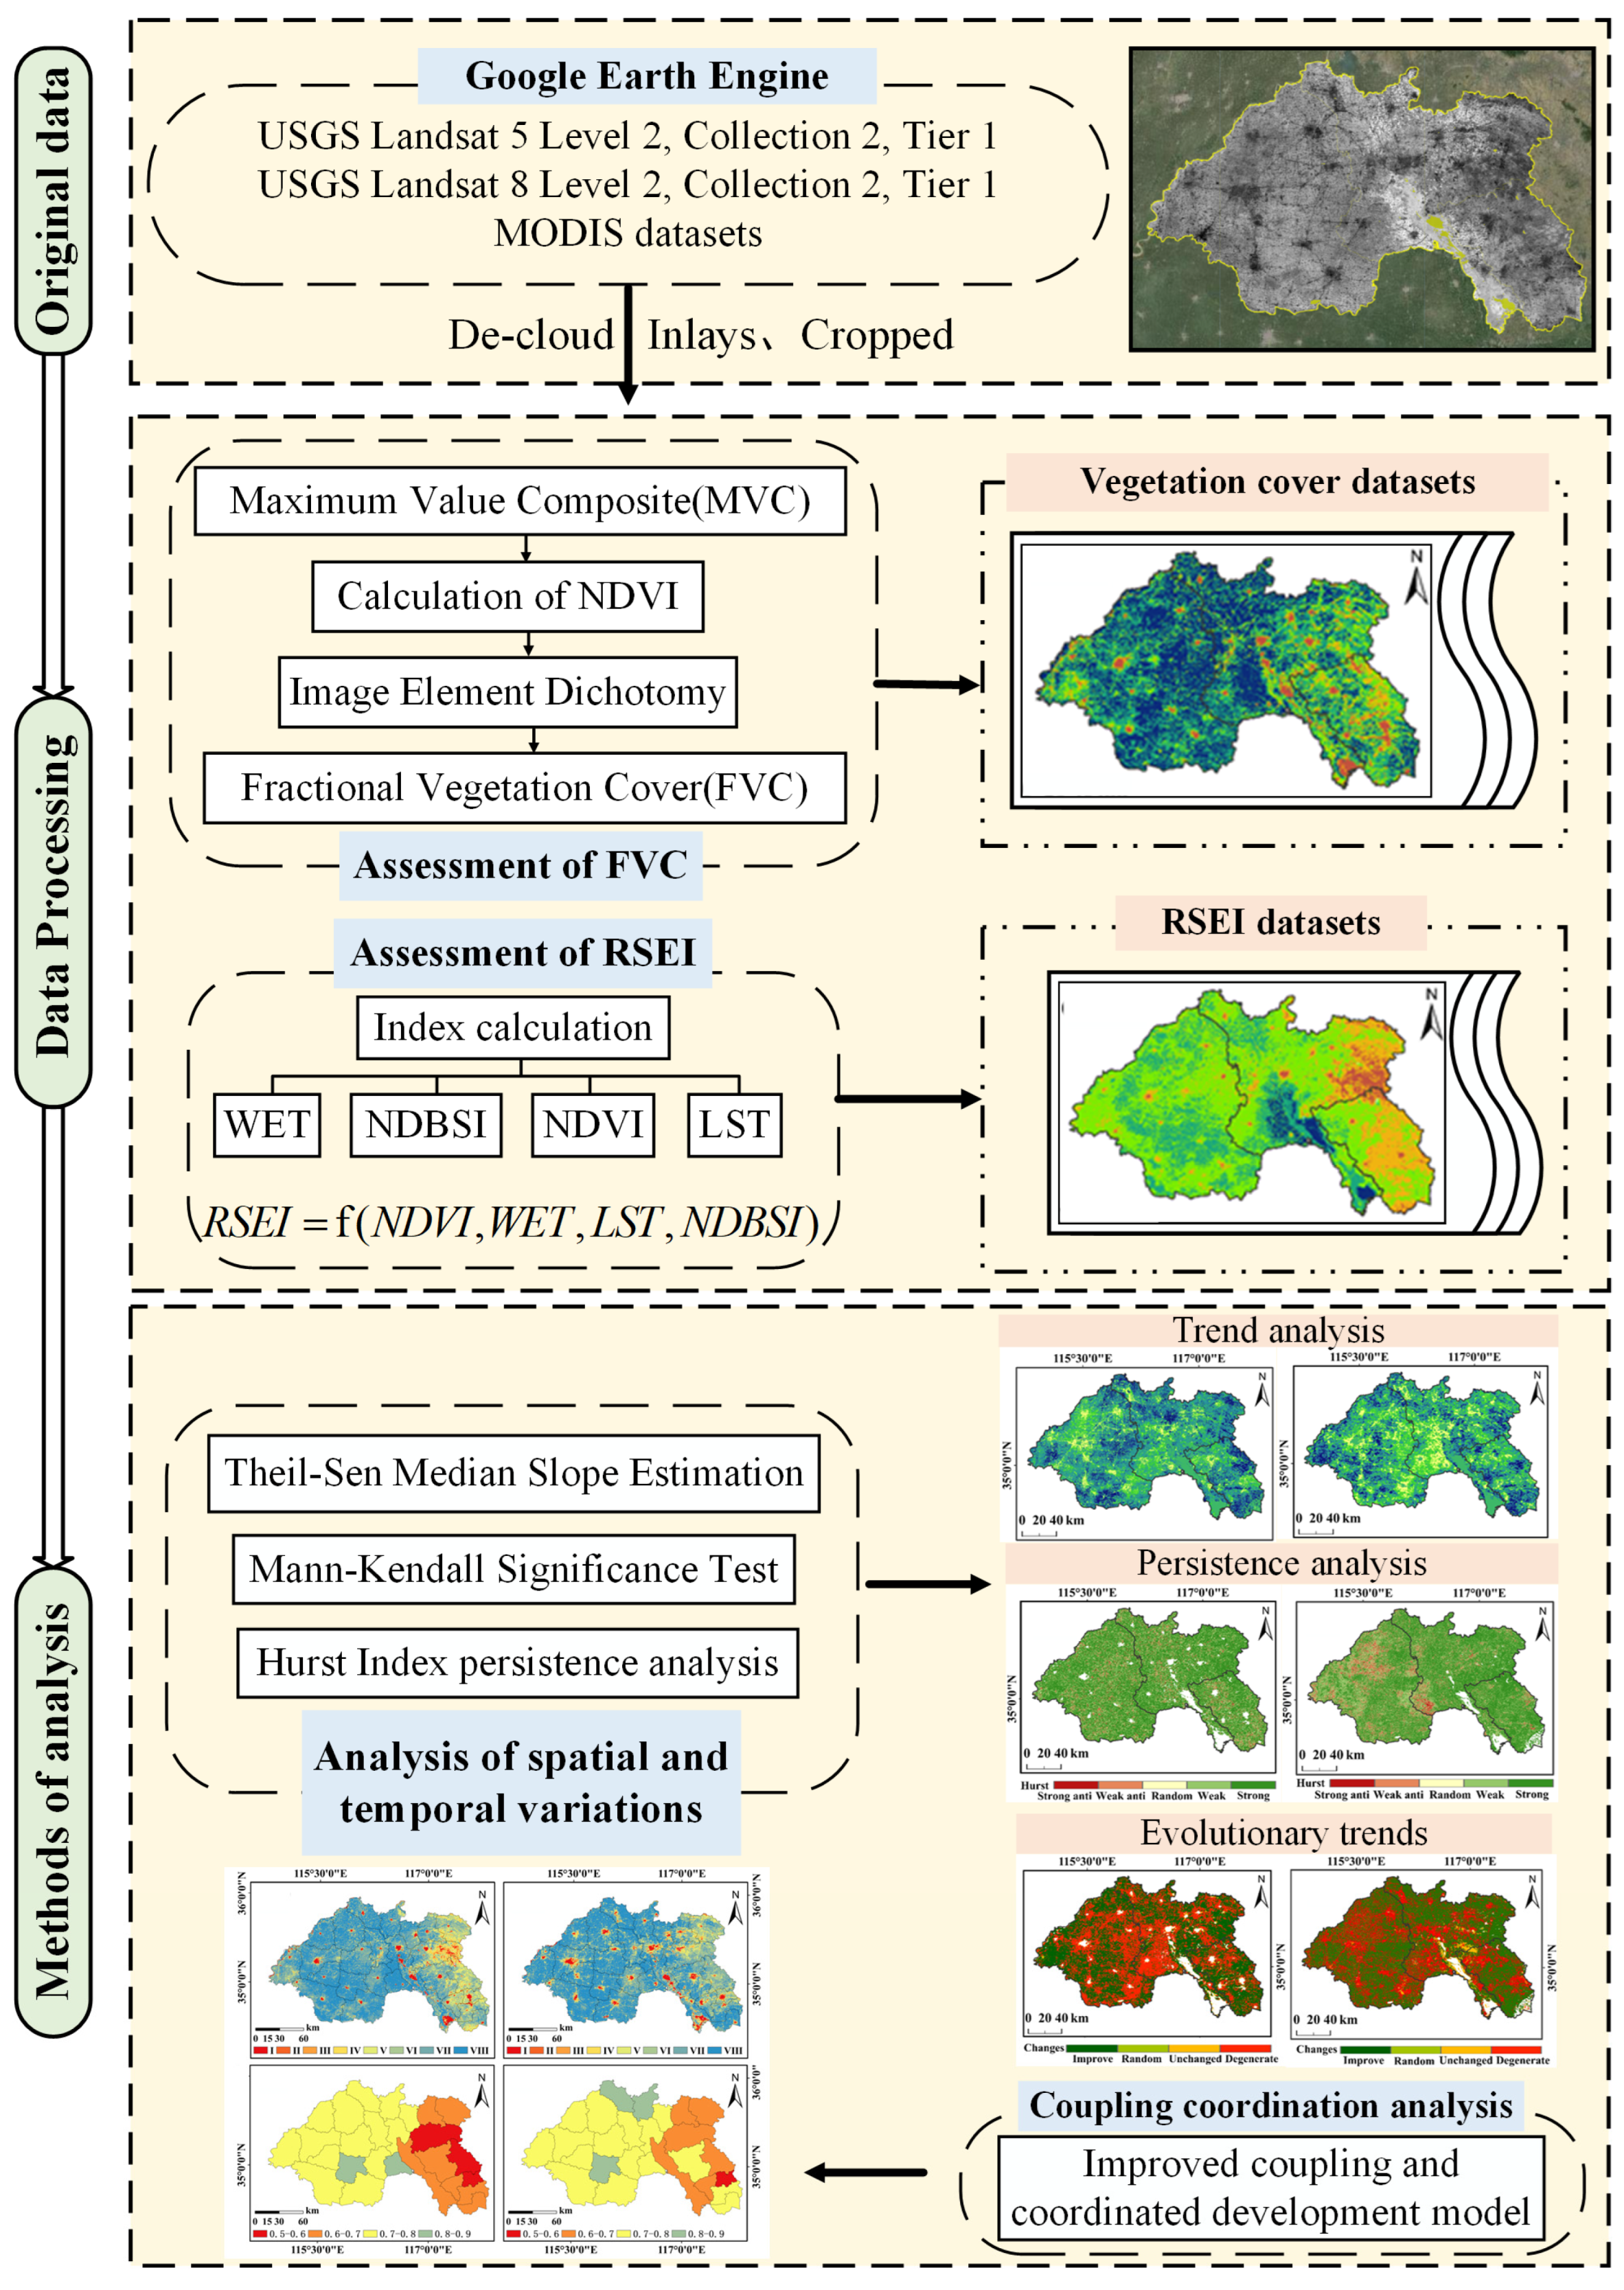
2.2. Data Preparation

Yu et al. [10] utilized Landsat data to analyze changes in the vegetation cover in mining areas, while Xiong et al. [22] conducted a comprehensive assessment of the ecological quality of rubber plantations using Landsat data. Numerous studies have demonstrated that the Landsat dataset is broadly applicable for detailed observations over large spatial extents [33]. GEE is a cloud computing platform that utilizes global-scale data for cloud analysis, which can conduct online analyses of long time-series geographic big data [32]. It is particularly appropriate for the spatio-temporal analysis of vegetation cover and ecological environment quality over a 20-year time series, large spatial extent, and large volume of data in this study. Therefore, we used the GEE platform to select the MODIS dataset from 2000 to 2020, Landsat 5 Collection 2, Tier 1 data from 2000 to 2011, and Landsat 8 Collection 2, Tier 1 data from 2013 to 2020 (see Table 1) for the study area (less than 5% cloud cover). The cloud removal (mask function) [23], mosaicking, and cropping operations on the dataset were conducted on the GEE platform. Furthermore, as vegetation has a better growth pattern during the growing season, its environmental quality also tends to be better, so images between May and September annually were chosen to compile the remote sensing image collection VC for the respective year using the pixel dichotomy technique [8]. Meanwhile, images between April and October annually were chosen to calculate the RSEI by calculating the Greenness index, Dryness index, and Wetness index to synthesize the ecological environment quality images for the target year.

2.3. Experimental Methodology

In this study, we use multi-temporal Landsat data and MODIS data from GEE to extract the VC and RSEI in southwestern Shandong Province. Trend analysis and persistence analysis were conducted using Theil–Sen median slope estimation [35], the Mann–Kendall significance test [35], and Hurst index [36]. Additionally, the ICCDM [37] was employed to assess their coupling coordination. The workflow is illustrated in Figure 2. Firstly, Landsat and MODIS data were preprocessed on the GEE platform, involving cloud removal, mosaicking, and cropping operations, performed separately. Then, relevant characteristic parameters were computed, yielding the VC dataset and RSEI dataset for the research region for 20 years. Subsequently, utilizing Theil–Sen median slope estimation and the Mann–Kendall statistical test, we performed trend analysis, investigating the variations in the VC and environmental quality in the SSUA over the two decades. Additionally, employing the Hurst index method, we conducted persistence analysis to explore the future variations in the FVC and RSEI in the same region across the 20 years. Building on this, a coupling coordination analysis of the interrelation for FVC and the RSEI was conducted using the ICCDM, investigating the interdependent coupling relationship in the study area.

2.3.1. Pixel Dichotomy Technique

NDVI is the Normalized Vegetation Index, which assesses vegetation health by measuring the disparity between the near-infrared light reflected by vegetation and red light absorbed by it [38]. The NDVI method, based on the pixel dichotomy model, is currently one of the most common and accurate techniques for extracting VC data [9]. For instance, Zhang et al. [6] utilized this method to extract VC information for the Inner Mongolia segment of the Yellow River, and similarly, Jiang et al. [20] applied it to assess the VC in the Nansi Lake region. These examples demonstrate the broad applicability of the NDVI method based on the pixel dichotomy model for vegetation extraction across different scales. In this method, the pixel’s information includes fractions of pure vegetation and soil [1], and the mixed pixel’s value is the weighted average of these two components’ Vegetation Index values [39]. The formula for the calculation is as follows:
f v = ( N D V I N D V I s o i l ) / ( N D V I v e g N D V I s o i l )
where N D V I s o i l represents the minimum value for pure soil pixels, theoretically close to 0; N D V I v e g represents the maximum value for pure vegetation pixels, theoretically close to 1.

2.3.2. RSEI Method

The RSEI is a comprehensive ecological assessment index that effectively reflects the ecological quality status of a region [40]. It is broadly utilized for ecological environment quality assessment in the field of remote sensing data [18,22,23]. This comprehensive metric incorporates four key components: Greenness (NDVI), Wetness (LST), Dryness (NDBSI), and Heat (WET) [35]. Given the variation in dimensions and value ranges among these indicators, normalization is necessary [41]. Here, the RSEI is used to assess the ecological environmental quality in southwestern Shandong Province. The RSEI ranges between 0 and 1, where higher values indicate better ecological and environmental quality in the region. The Heat index is derived from the MODIS dataset in the GEE platform, and the other formulas are shown in Table 2.
Table 2. RSEI and internal index formula.
IndexFormulasBibliographic Reference
Remote Sensing Ecological Index (RSEI) R S E I = f ( N D V I , W E T , L S T , N D B S I ) (2)[40]
Greenness Index N D V I = ( ρ N I R ρ R ) / ( ρ N I R + ρ R ) (3)[42]
Wetness Index W E T T M = 0.0315 ρ B + 0.2021 ρ G + 0.3102 ρ R + 0.1594 ρ N I R 0.6806 ρ S W I R 1 0.6109 ρ S W I R 2 (4)[43]
W E T O L I = 0.1511 ρ B + 0.1972 ρ G + 0.3283 ρ R + 0.3407 ρ N I R 0.7117 ρ S W I R 1 0.4559 ρ S W I R 2 (5)[44]
Dryness Index N D B S I = ( I B I + S I ) / 2 (6)
I B I = [ 2 ρ S W I R 1 ρ S W I R 1 + ρ N I R ρ N I R ( ρ N I R + ρ R ) ρ G ρ G + ρ S W I R 1 ] [ 2 ρ S W I R 1 ρ S W I R 1 + ρ N I R + ρ N I R ( ρ N I R + ρ R ) ρ G ρ G + ρ S W I R 1 ] (7)[45]
S I = [ ( ρ S W I R 1 + ρ R ) ( ρ N I R + ρ B ) ] [ ( ρ S W I R 1 + ρ R ) + ( ρ N I R + ρ B ) ] (8)[46]
Here, N D V I is the Vegetation Index, W E T is the Wetness index, N D B S I is the building and bare soil index; ρ B , ρ G , ρ R , ρ N I R , ρ S W I R 1 , and ρ S W I R 2 are reflectance data in the blue, green, red, near-infrared (NIR), short-wave infrared 1 (SWIR1), and short-wave infrared 2 (SWIR2) bands for the TM and OLI, respectively.

2.3.3. Trend Analysis

The Theil–Sen Median is a robust, non-parametric statistical technique commonly used for trend analysis [47]. This method is particularly effective in describing subtle trends in the improvement or degradation of parameters at the pixel level, which is essential for capturing fine-scale regional changes [9]. For example, Zhang et al. [48] and Liu et al. [9] have conducted dynamic analyses of regional vegetation based on this method. In this research, the Theil–Sen median slope estimation and the Mann–Kendall significance test are utilized to assess the changing trends of the VC and eco-environmental condition in the SSUA over the past two decades. The equations for these analyses are as follows [35]:
T s l o p e = m e d i a n ( x j x i j i ) , j > i
where x i and x j represent the average values for the i-th and j-th years; median denotes the median function. If T s l o p e > 0, it signifies a statistically significant increasing trend in the dataset over the specified time period, whereas T s l o p e < 0 indicates a decreasing trend. A larger absolute value of T s l o p e indicates a more pronounced trend in data variability.
The Mann–Kendall statistical test is employed alongside Theil–Sen median slope estimation to investigate the trend characteristics of raster data over extended time series [35]. The equations for these analyses are as follows:
Z M K = S 1 n ( n 1 ) ( 2 n + 5 ) / 18 , S > 0 0 , S = 0 S + 1 n ( n 1 ) ( 2 N + 5 ) / 18 , S < 0
S = k = 1 n 1 j = k + 1 n sgn ( x j x k )
sgn ( x j x k ) = + 1 , x j x k > 0 0 , x j x k = 0 1 , x j x k < 0
where n represents the length of the data series; S stands for the Mann–Kendall test statistic; x k and x j denote the corresponding data across the temporal data; sgn ( x j x k ) is the sign function.
The trend classification in this manuscript is presented in Table 3.

2.3.4. Persistence Analysis

In this research, the rescaled range (R/S) technique is utilized to compute the Hurst exponent [9], which is utilized to evaluate the persistence of VC and eco-environmental quality in Shandong Province [36]. The Hurst exponent can characterize the persistence of lengthy time-series raster data and is extensively employed for forecasting future data [27,49]. The equations for these analyses are as follows:
For the given time series { Y ( t ) } , t = 1 , 2 , , n , the sequence of average values is explicated as follows:
Y ¯ ( τ ) = 1 τ t = 1 τ Y t , τ = 1 , 2 , n
Accumulated dispersion:
X ( t , τ ) = u = 1 t ( Y ( u ) Y ¯ ( τ ) ) , 1 t τ ( 7 )
Range:
R ( τ ) = X 1 t τ max ( t , τ ) X 1 t τ min ( t , τ ) , τ = 1 , 2 , n
Standard deviation:
S ( τ ) = [ 1 τ t = 1 t ( Y ( u ) Y ¯ ( τ ) ) 2 ] 1 2 , τ = 1 , 2 , , n
R ( τ ) S ( τ ) = ( c τ ) H
where H is the Hurst index; c is a constant; τ denotes the length of the time series. Where 0.5 < H < 1, the data exhibit persistence, meaning future trends align with the past; a higher H indicates stronger persistence. Conversely, when 0 < H < 0.5, the data show anti-persistence, indicating that future trends oppose the past, and a lower H value indicates stronger anti-persistence. If H = 0.5 or is a null, the data behave as random fluctuations, with no connection to the past.

2.3.5. Improved Coupled Coordination Degree Model

The coupling relationship can effectively reveal the extent of benign interaction between two systems [50]. However, traditional coupling coordination models exhibit a certain degree of subjectivity, with equal weights assigned to the contribution coefficients of each subsystem, lacking scientific rigor [50]. To objectively evaluate the coupling relationship for the VC and eco-environmental condition, it is essential to consider the specific circumstances of the region. The relatively underdeveloped subsystem should be given a higher weight [51]. The ICCDM can effectively narrow the gap between the two systems and provide a comprehensive evaluation of their respective contribution coefficients [37]. Therefore, in this research, we employ an ICCDM to facilitate a more objective and accurate assessment of the coupling coordination relationship between the FVC and RSEI in southwestern Shandong Province. The equations for the ICCDM analyses are as follows [37]:
C = 2 U × A U + A 2 1 2
T = α U + β A
α = A U + A
β = U U + A
D = C × T
where C represents the level of coupling for the FVC and RSEI; U and A , respectively, indicate the integrated scores of the FVC and RSEI; α and β , respectively, represent the improved contribution coefficients of the FVC and RSEI; T and D , respectively, represent the improved comprehensive levels of the FVC and RSEI and the improved coupling coordination.
Referring to relevant studies [37,52] and utilizing the specific data from the ICCM in the SSUA, the coupling coordination relationship between the VC and eco-environmental condition can be classified into three categories and eight subtypes (Table 4).

3. Results

3.1. Characteristics of Vegetation Coverage in SSUA

3.1.1. Patterns of Spatio-Temporal Fluctuations in Vegetation Coverage

To visually depict the spatial and temporal fluctuations in vegetation across SSUA, this study conducted a classification assessment of the VC. The classification was based on five categories: 0–0.2 representing low FVC, 0.2–0.4 representing relatively low FVC, 0.4–0.6 representing moderate FVC, 0.6–0.8 representing relatively high FVC, and 0.8–1 representing high FVC. Figure 3 presents the classified distribution of the vegetation density in the SSUA. Figure 4 depicts the distribution of vegetation cover in the cities of Heze, Jining, and Zaozhuang within the southwest of Shandong Province.
As observed from Figure 3, during the period 2000 to 2020, the FVC in the western sector of the study region exhibited elevated levels compared to the eastern sector. Regions characterized by high vegetation cover were predominantly concentrated in the cities Heze and Jining, while areas with relatively higher and moderate vegetation cover were mainly concentrated in Zaozhuang City. The share of the primary sector in Heze City and Jining City was much greater than that in Zaozhuang City. Typically, the greater share of the agricultural industry, the higher the VC tends to be. This suggests that the economic focus on agriculture is a significant factor driving the higher vegetation cover in these regions.
According to Figure 4, it can be observed that over the past two decades, most regions of the SSUA have experienced improvements in the VC, especially in Zaozhuang, where the extent of high VC has notably increased, rising from 14% to 30%. On the other hand, Heze and Jining exhibited even higher levels of VC compared to Zaozhuang, both surpassing 60%. These changes indicate that the adoption of ecological policies, especially with the gradual enforcement of initiatives like of the policy of converting cultivated land back to grove and ecological compensation, has greatly increased the VC.
Simultaneously, during the 2000 to 2020 period, as economic development and infrastructure gradually improved, economic interactions among regions became increasingly intimate. The regions with low VC in Jining and Heze have gradually expanded outward towards urban economic centers and transportation routes. But VC in the SSUA exhibited a trend of gradual transition from lower to higher levels over the years. This trend reflects the impact of urbanization and improved connectivity on the spatial distribution of VC.

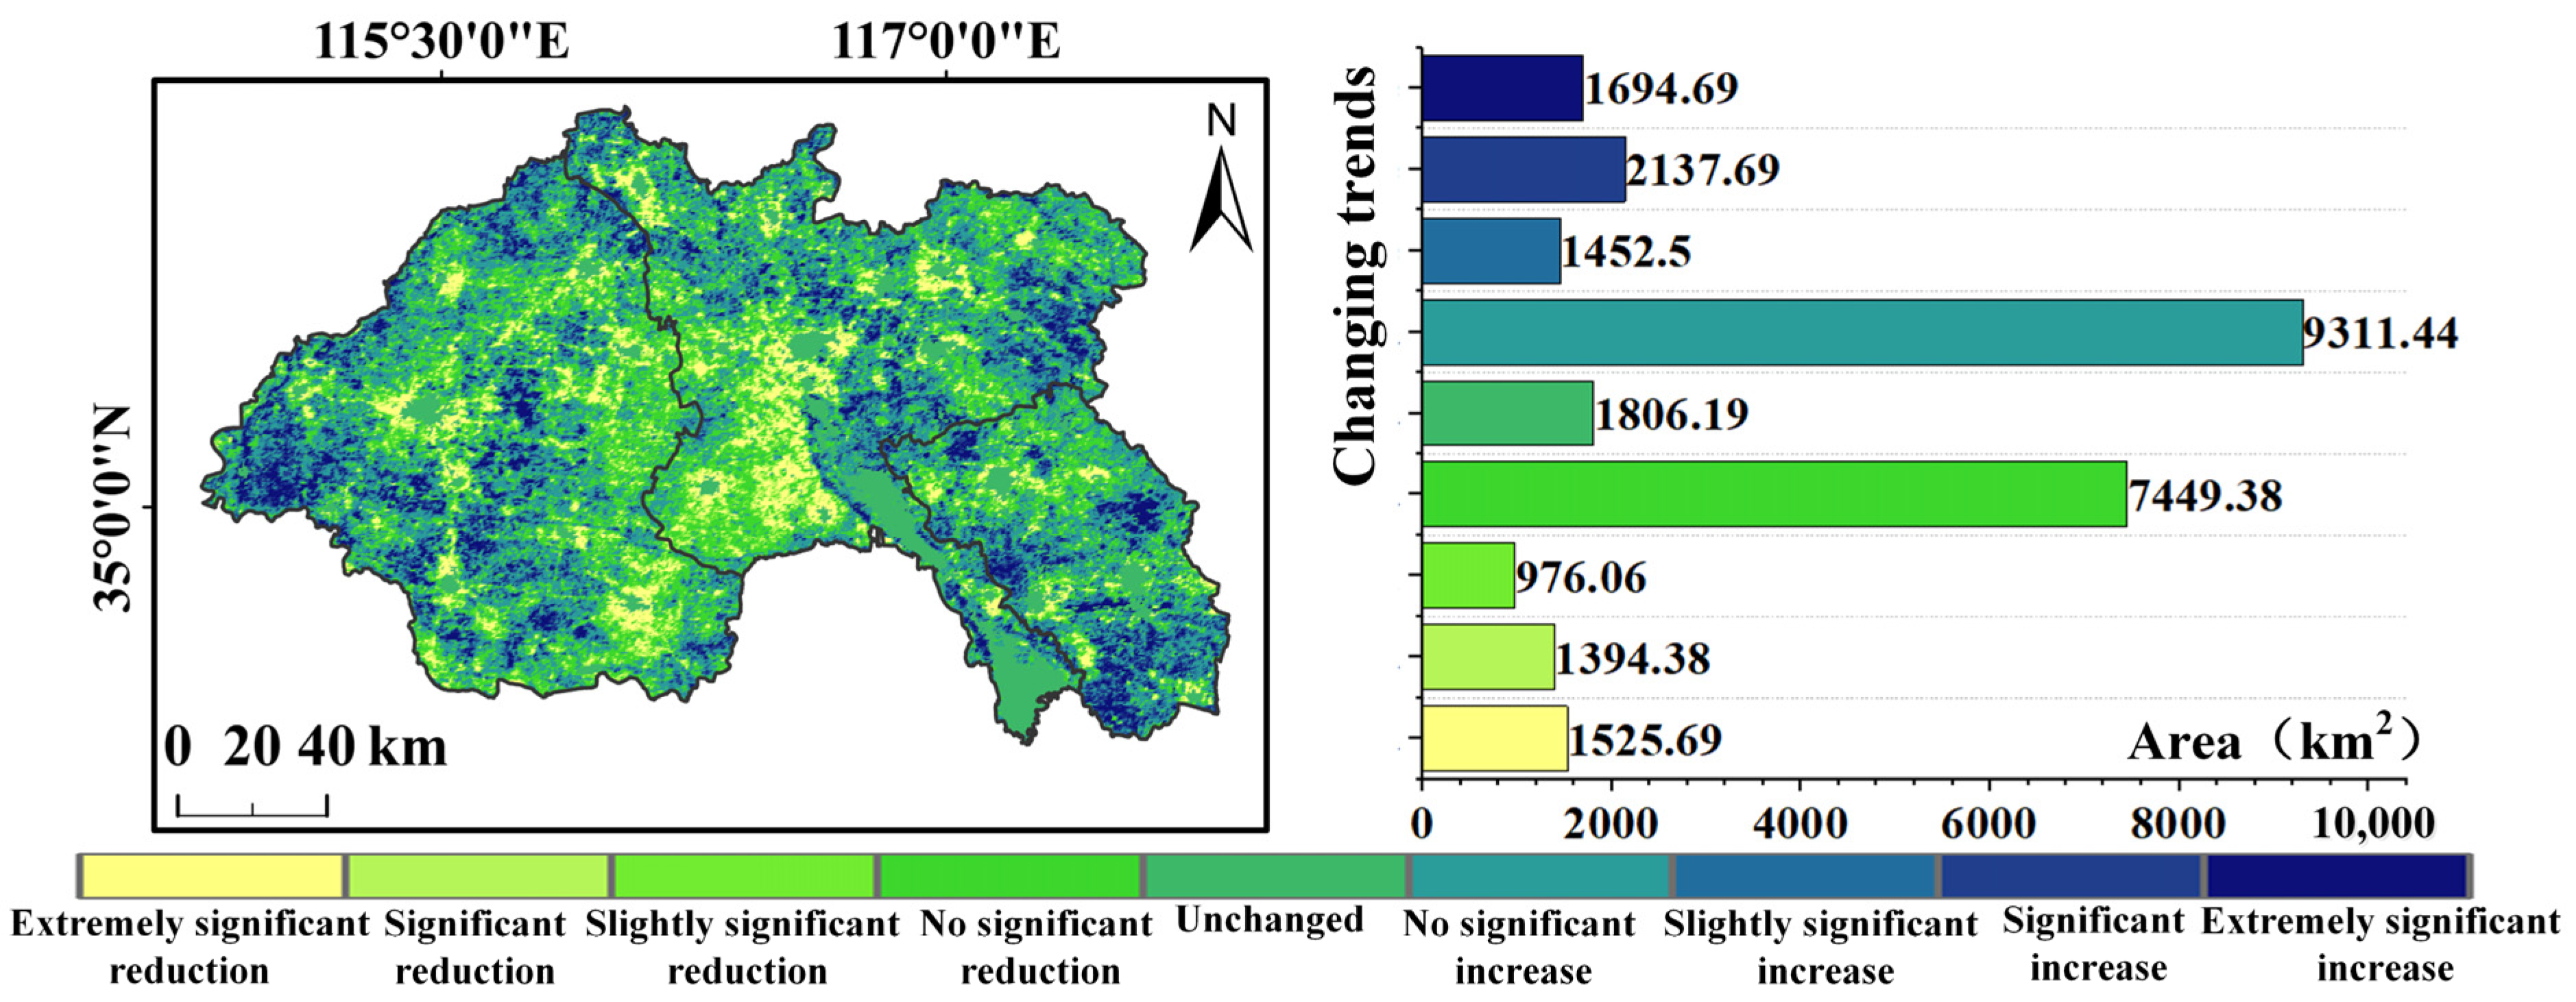
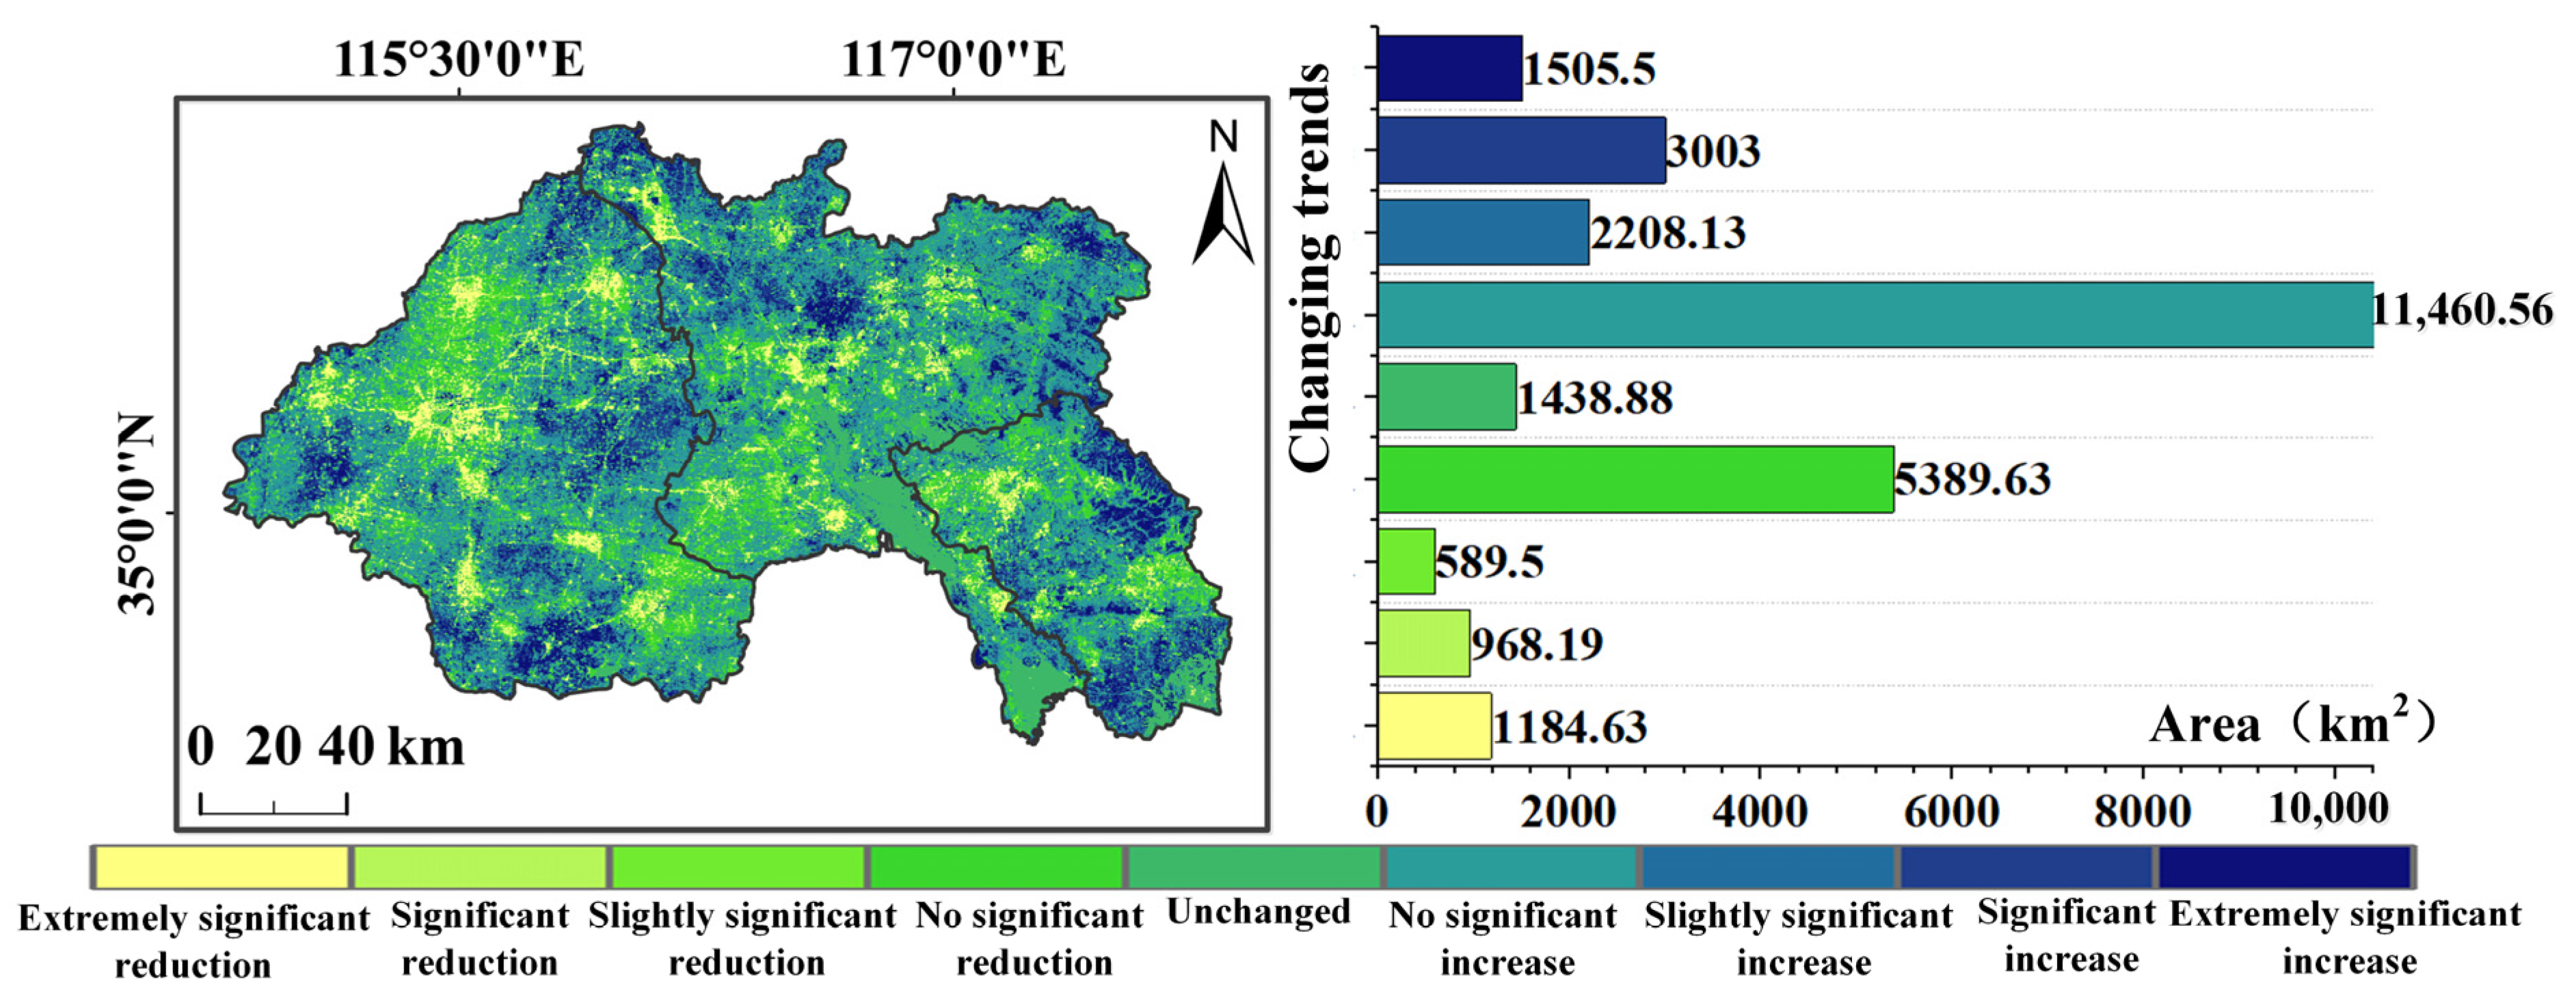
3.1.2. Trend Patterns of Vegetation Coverage

The Theil–Sen median slope estimation and Mann–Kendall significance test were employed to conduct trend analysis on VC in the southwest of Shandong Province. Figure 5 illustrates these changes, showing that approximately 34% of the region demonstrated a non-significant increase in VC over the two decades. This indicates a general trend of vegetation recovery in these areas. Conversely, areas expanding outward from urban centers showed a non-significant decreasing trend in the VC, comprising about 27% of the region. This highlights the impact of urban expansion on local vegetation. Examining specific cities, Heze and Zaozhuang largely showed notable vegetation improvements, except for some degradation near their city centers, where economic development is concentrated. In contrast, Jining exhibited substantial vegetation degradation, indicating a pronounced trend of vegetation deterioration. Urban development in Jining appears to be significantly affecting vegetation health.

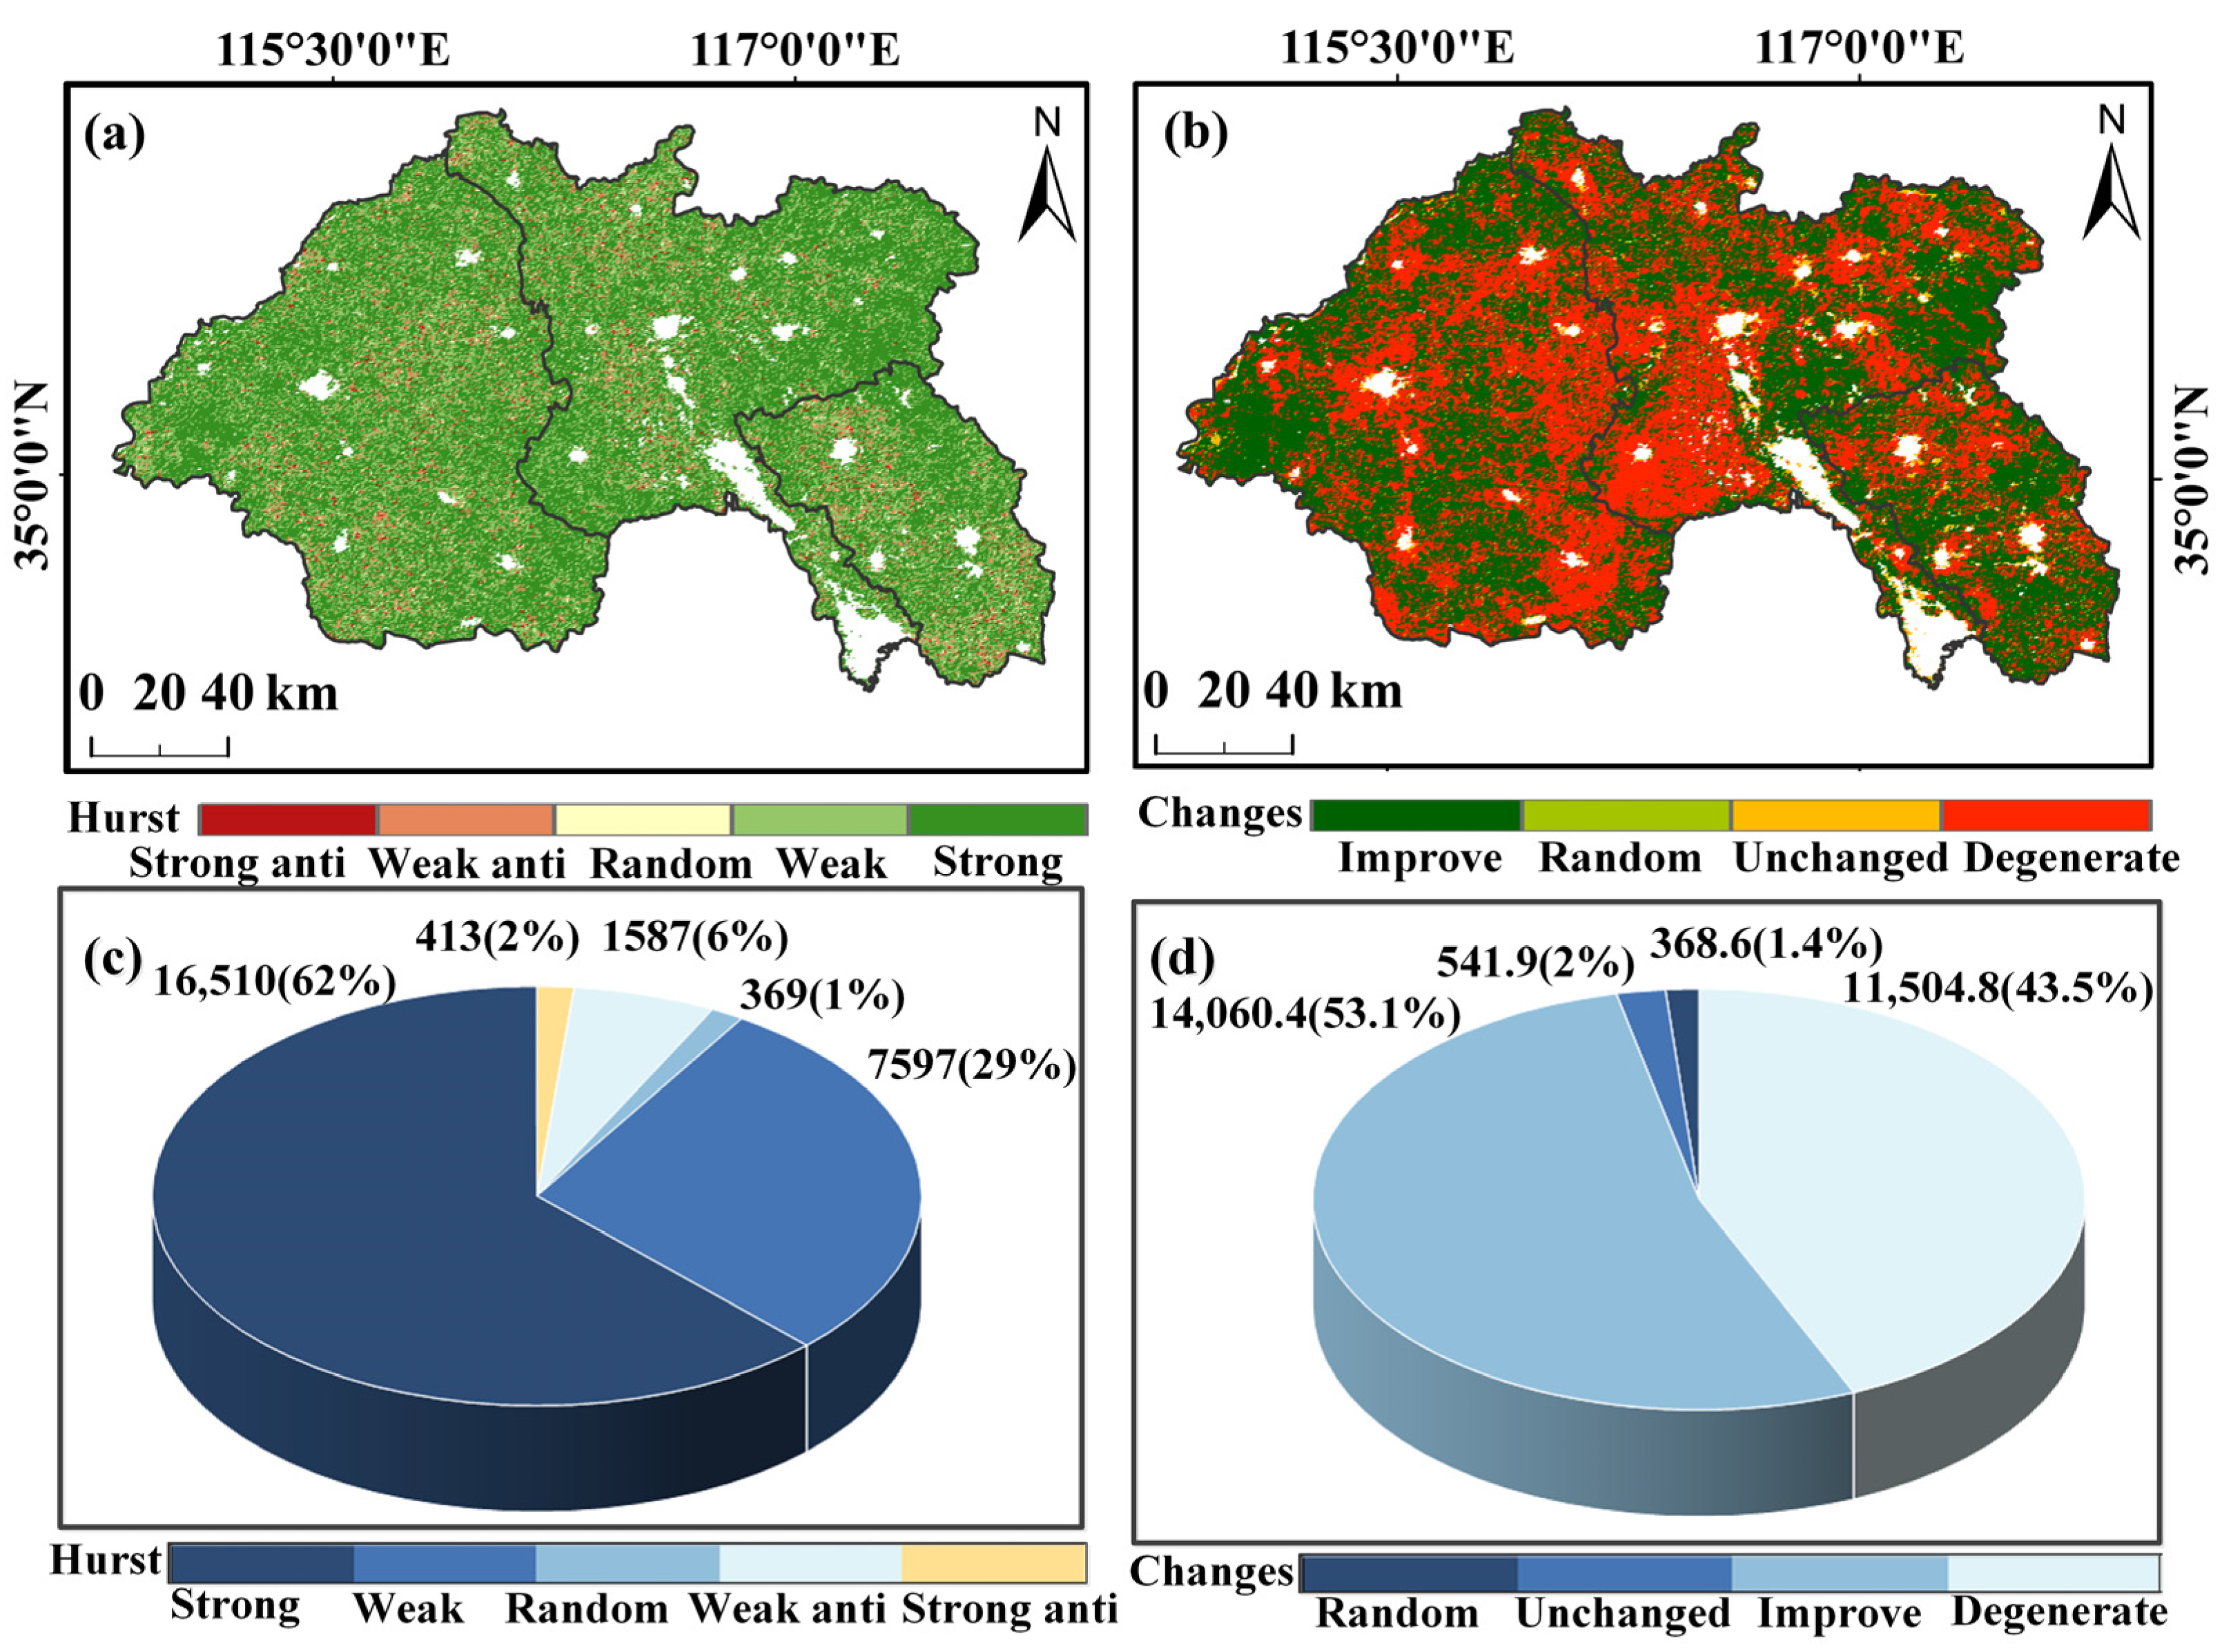
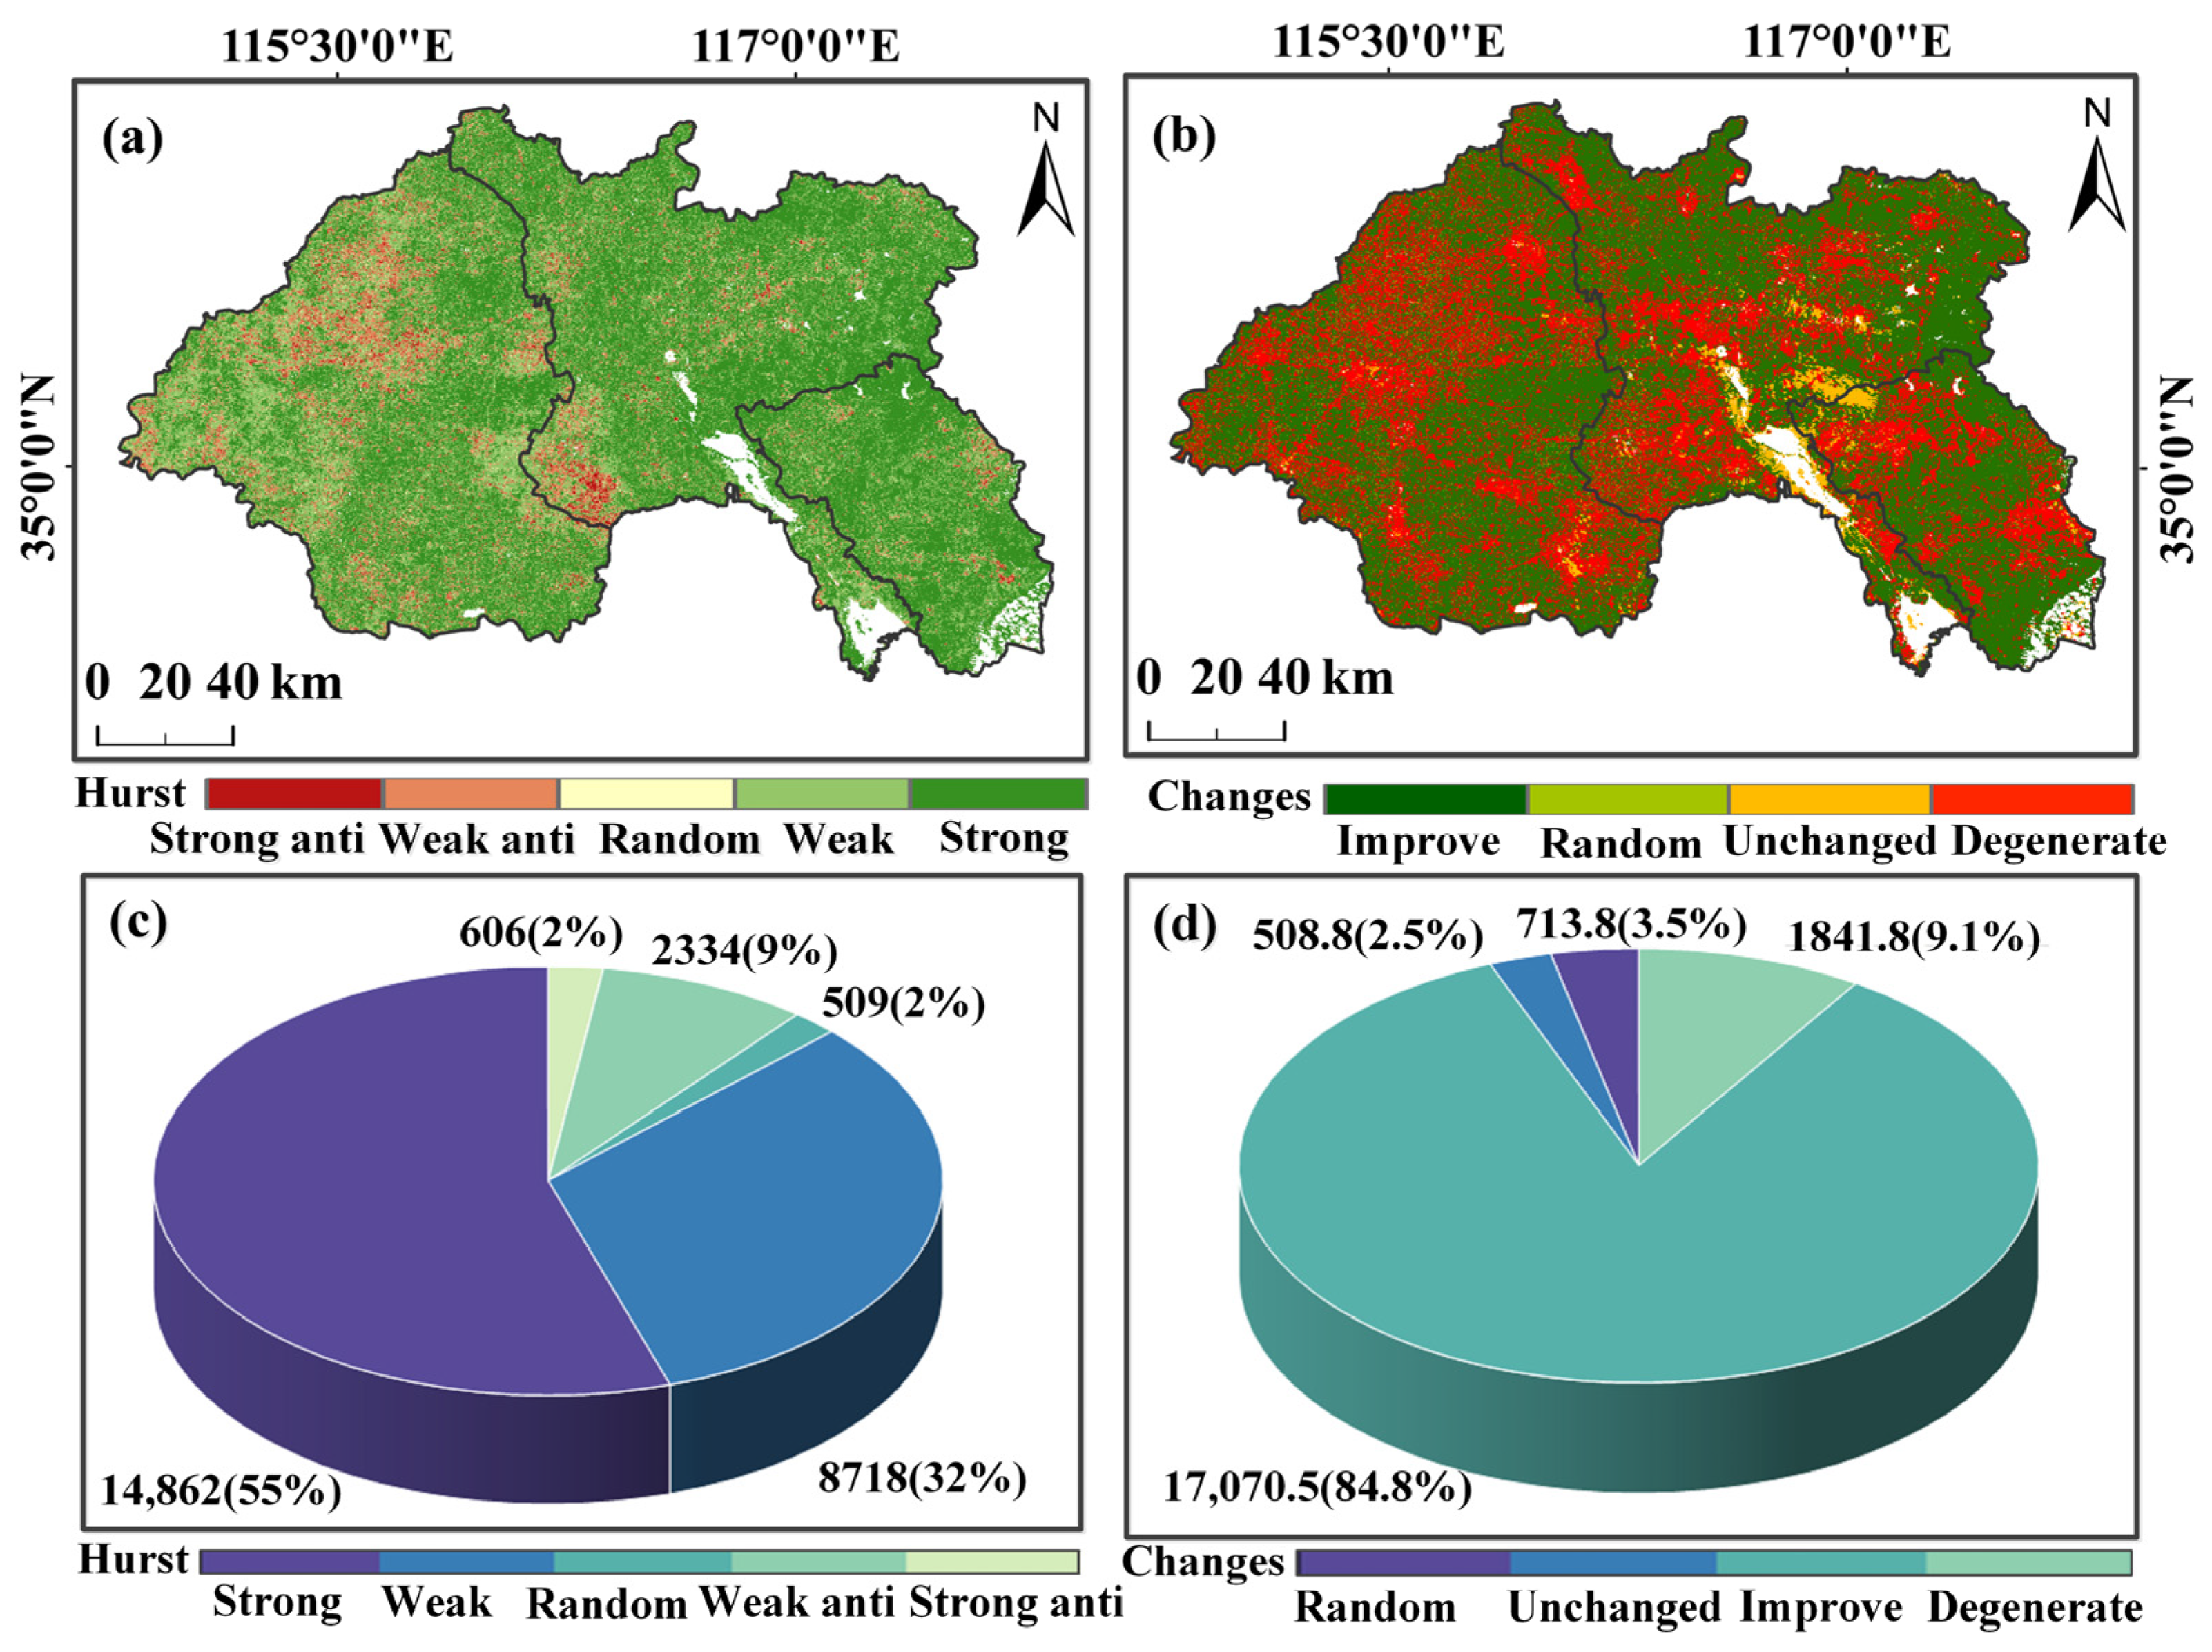
3.1.3. Persistence Analysis of Vegetation Coverage

Persistence analysis provides insights into future vegetation trends in southwestern Shandong Province, aiding regional coordination and sustainable development. The Hurst index, ranging from 0.06 to 0.99, was classified into different categories (0.05–0.3, strong anti-persistence; 0.3–0.49, weak anti-persistence; 0.49–0.51, random; 0.51–0.7, weak persistence; 0.7–0.99, strong persistence). Figure 6 shows VC persistence patterns and future development from 2000 to 2020 and statistical insights into these persistence categories and future VC. Understanding these persistence patterns helps predict future vegetation changes and supports informed regional planning.
The analysis revealed that about 62% of southwestern Shandong exhibits a strong persistence in VC, totaling approximately 16,510 km2. Areas with weak persistence covered around 7597 km2, representing 29% of the region. Strong persistence is mainly found in areas radiating outward from city centers, indicating resilient vegetation. This suggests that regions with strong persistence are better equipped to maintain or improve vegetation over time.
In Heze, Jining, and Zaozhuang, the persistence distribution is relatively uniform, with strong persistence concentrated around urban centers. Overall, future predictions indicate that 53.1% of the area (about 14,060 km2) will see vegetation improvements, while 43.5% (approximately 11,504 km2) might experience degradation, particularly in expanding economic centers. The challenge lies in balancing urban expansion with ecological preservation to ensure sustainable development.
Controlling soil desertification and restoring vegetation are key future trends. Southwestern Shandong’s urban agglomeration must align with these trends, promoting industrial structural reform to harmonize economic and ecological development. Successful integration of these priorities will determine the region’s sustainable future.

3.2. Characteristics of Environmental Quality in Southwestern Shandong Province

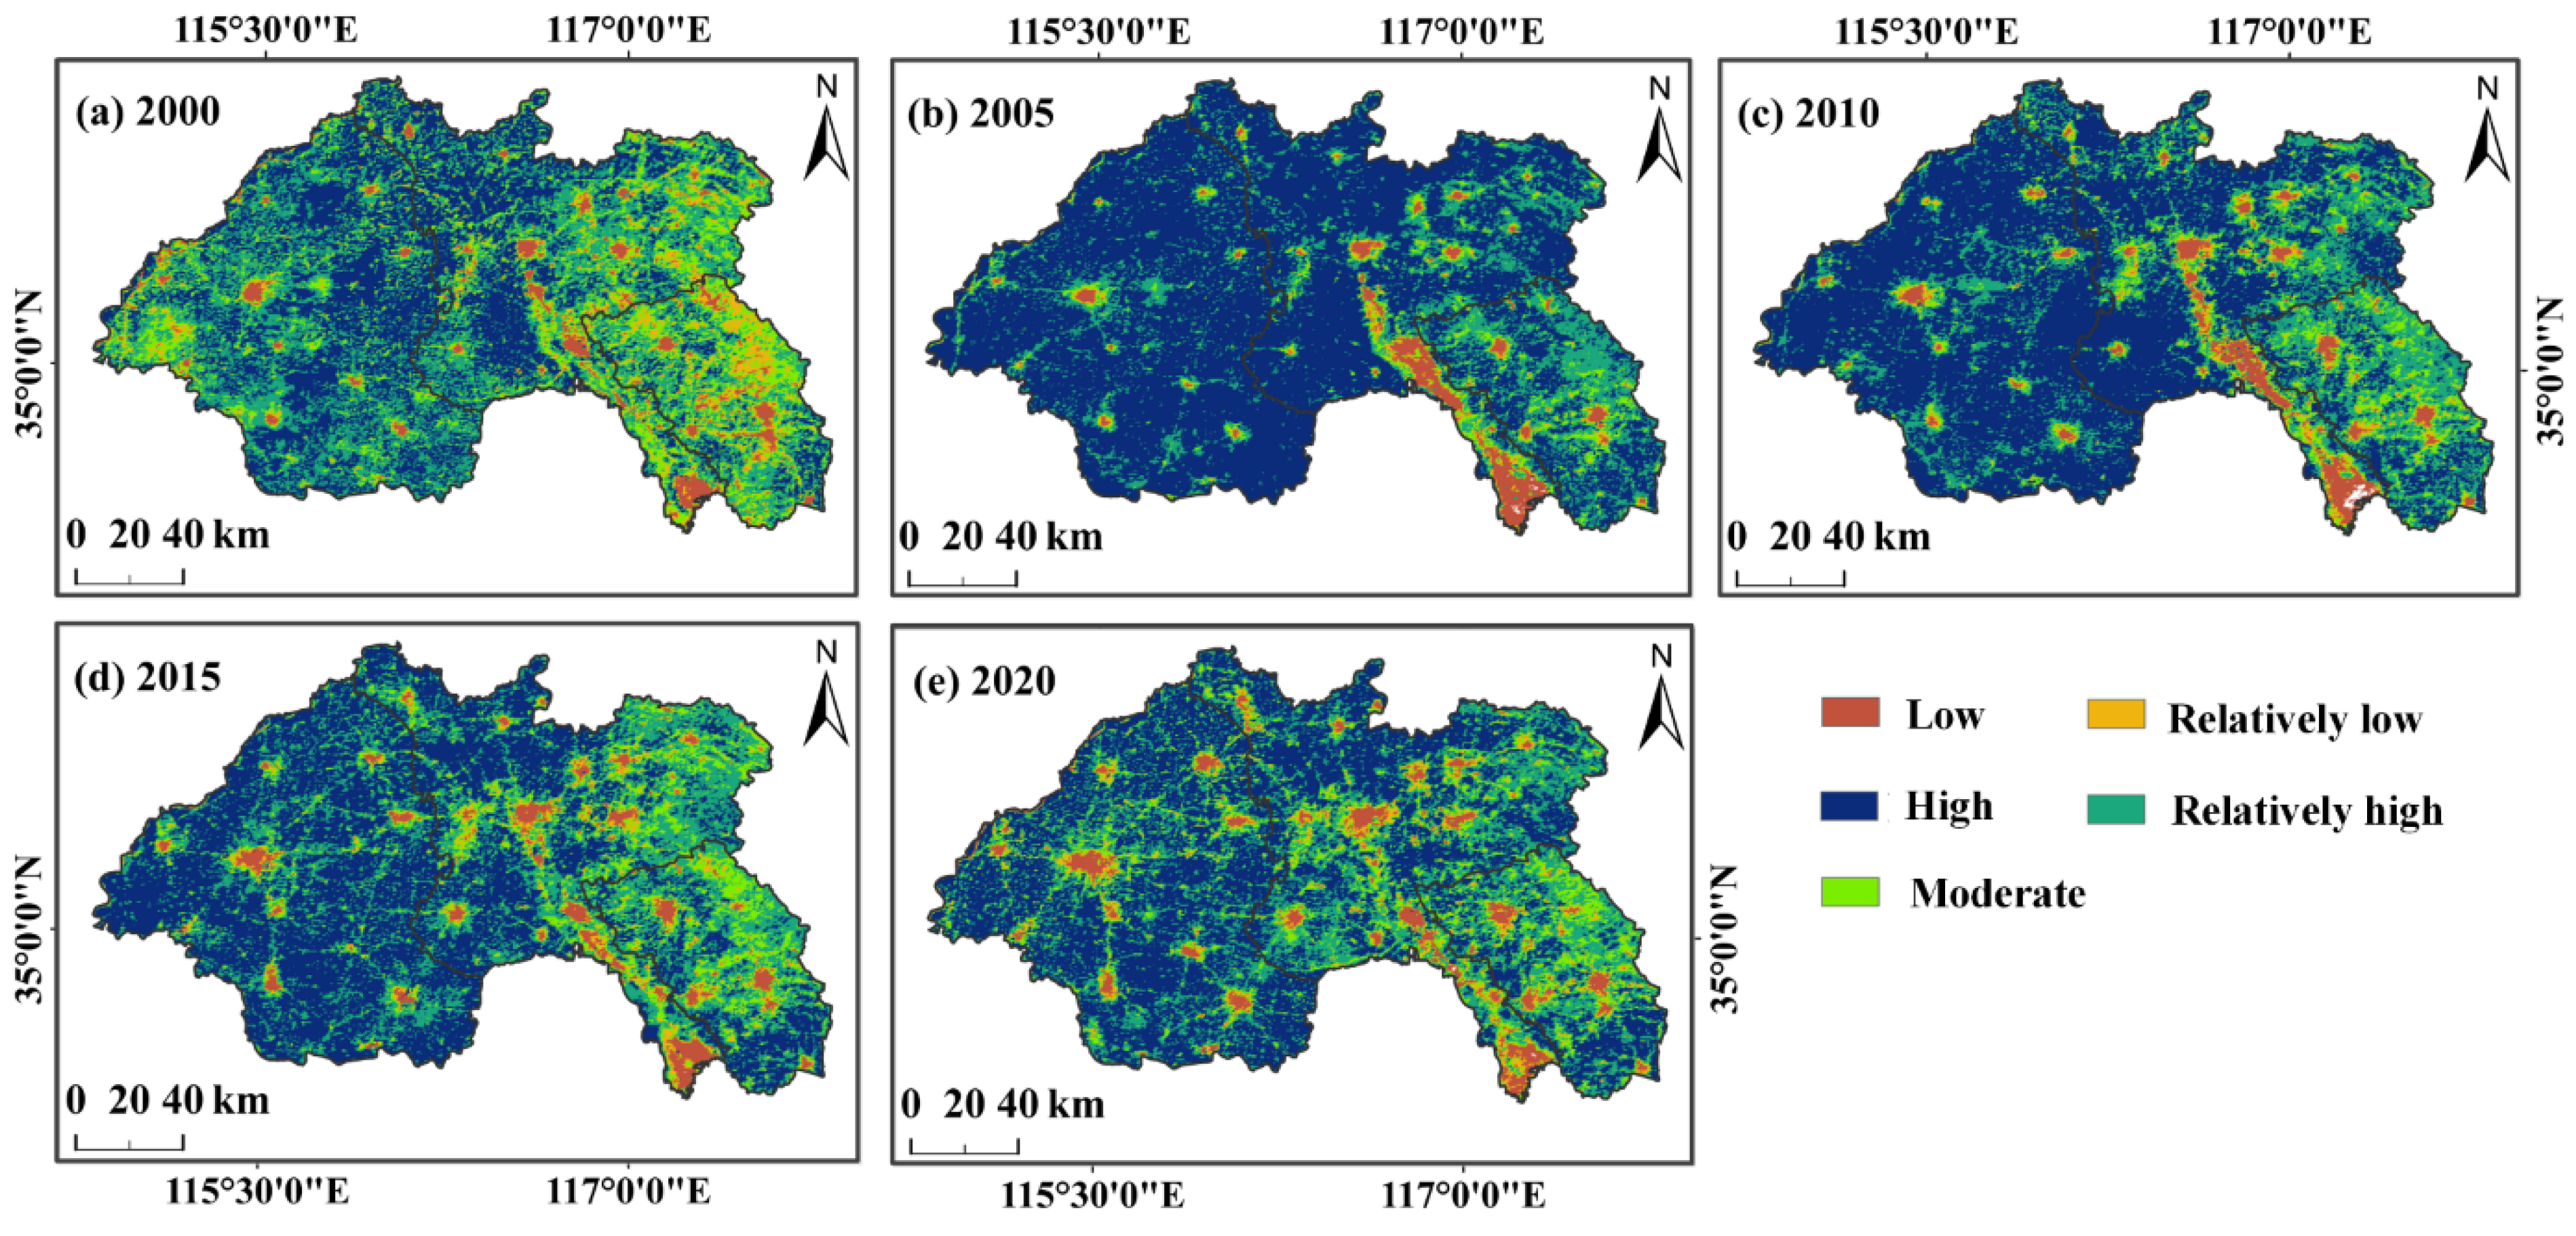
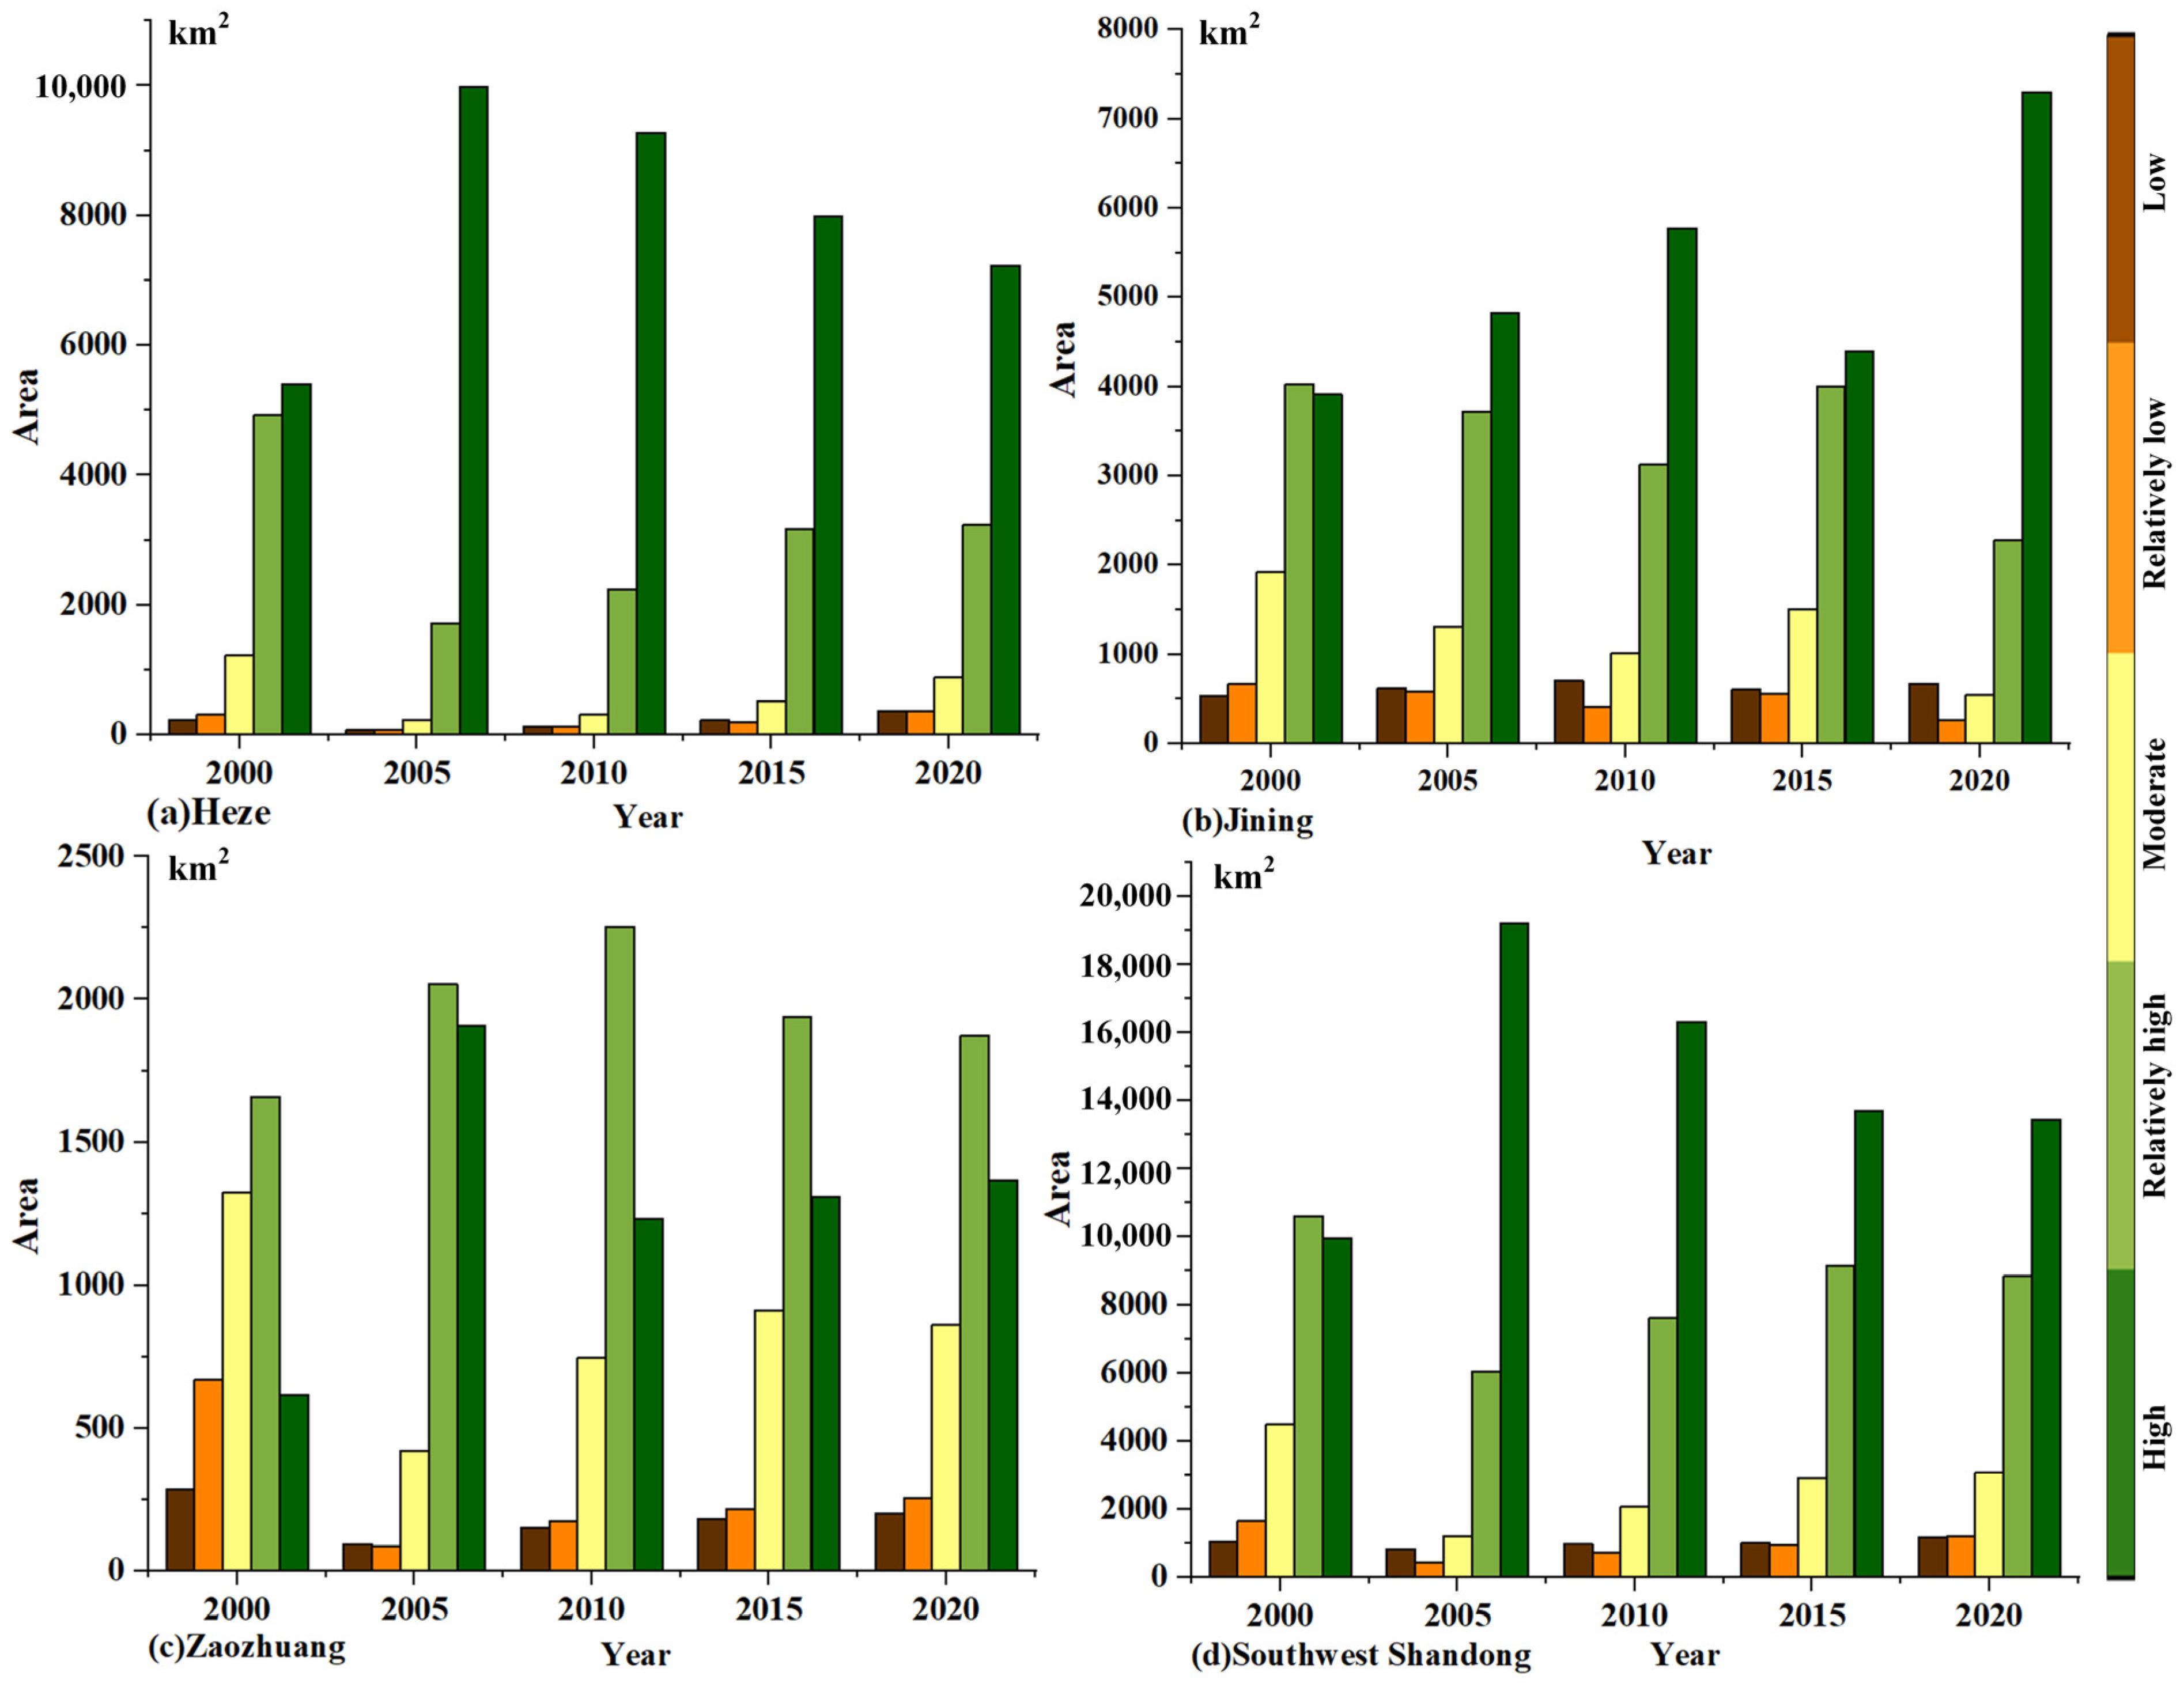
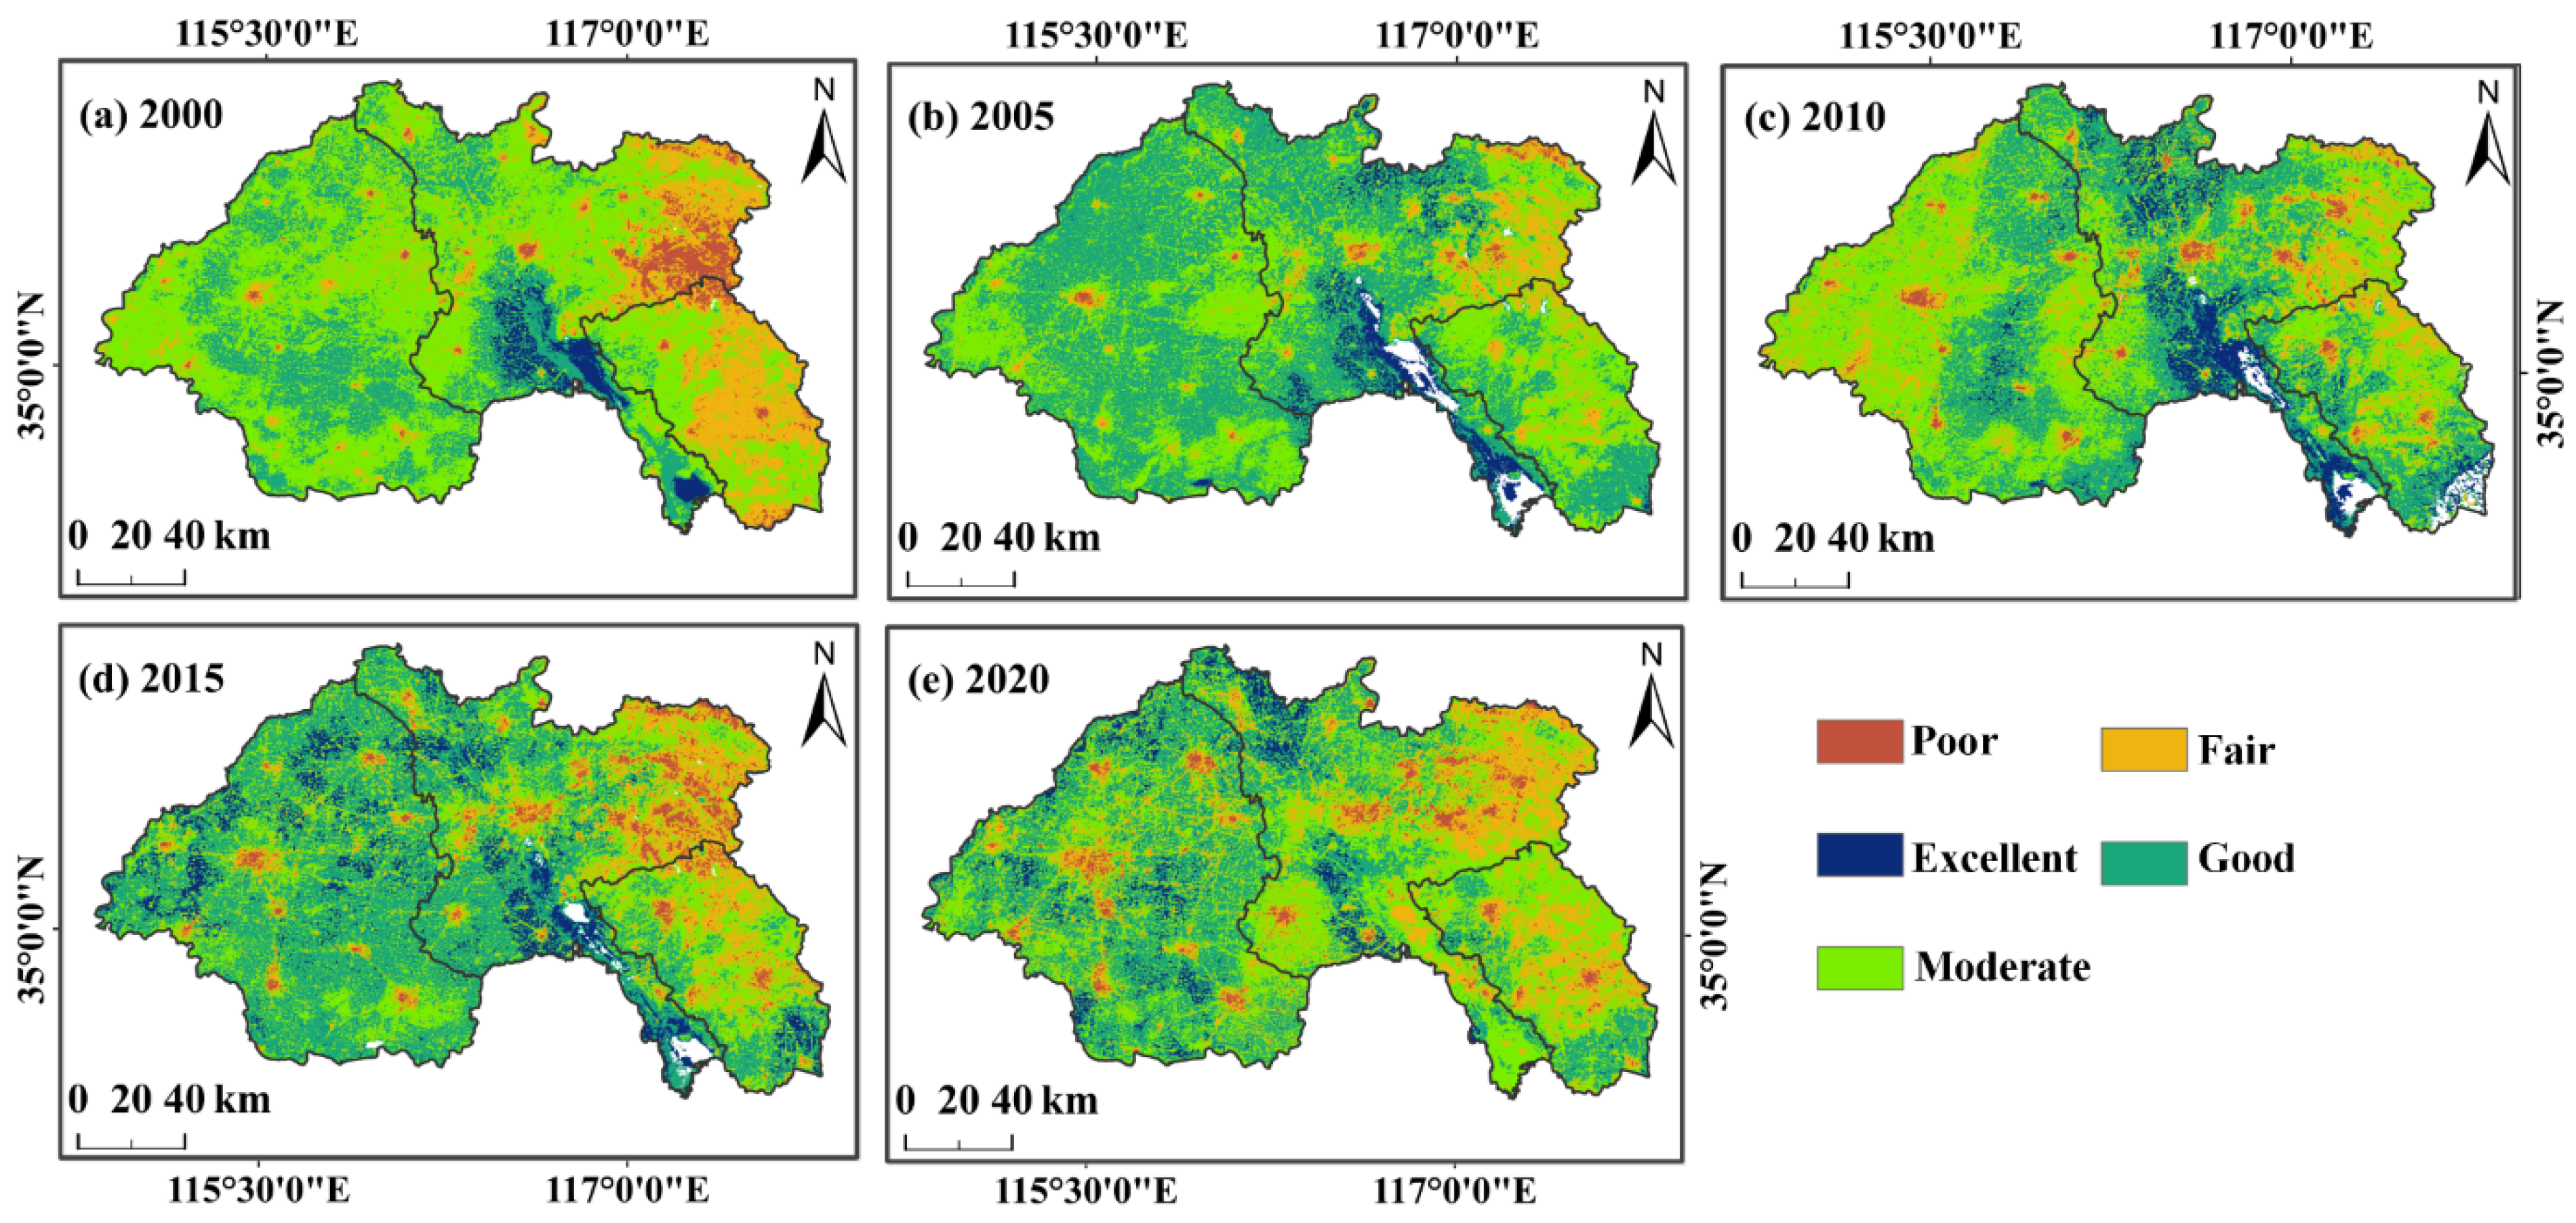
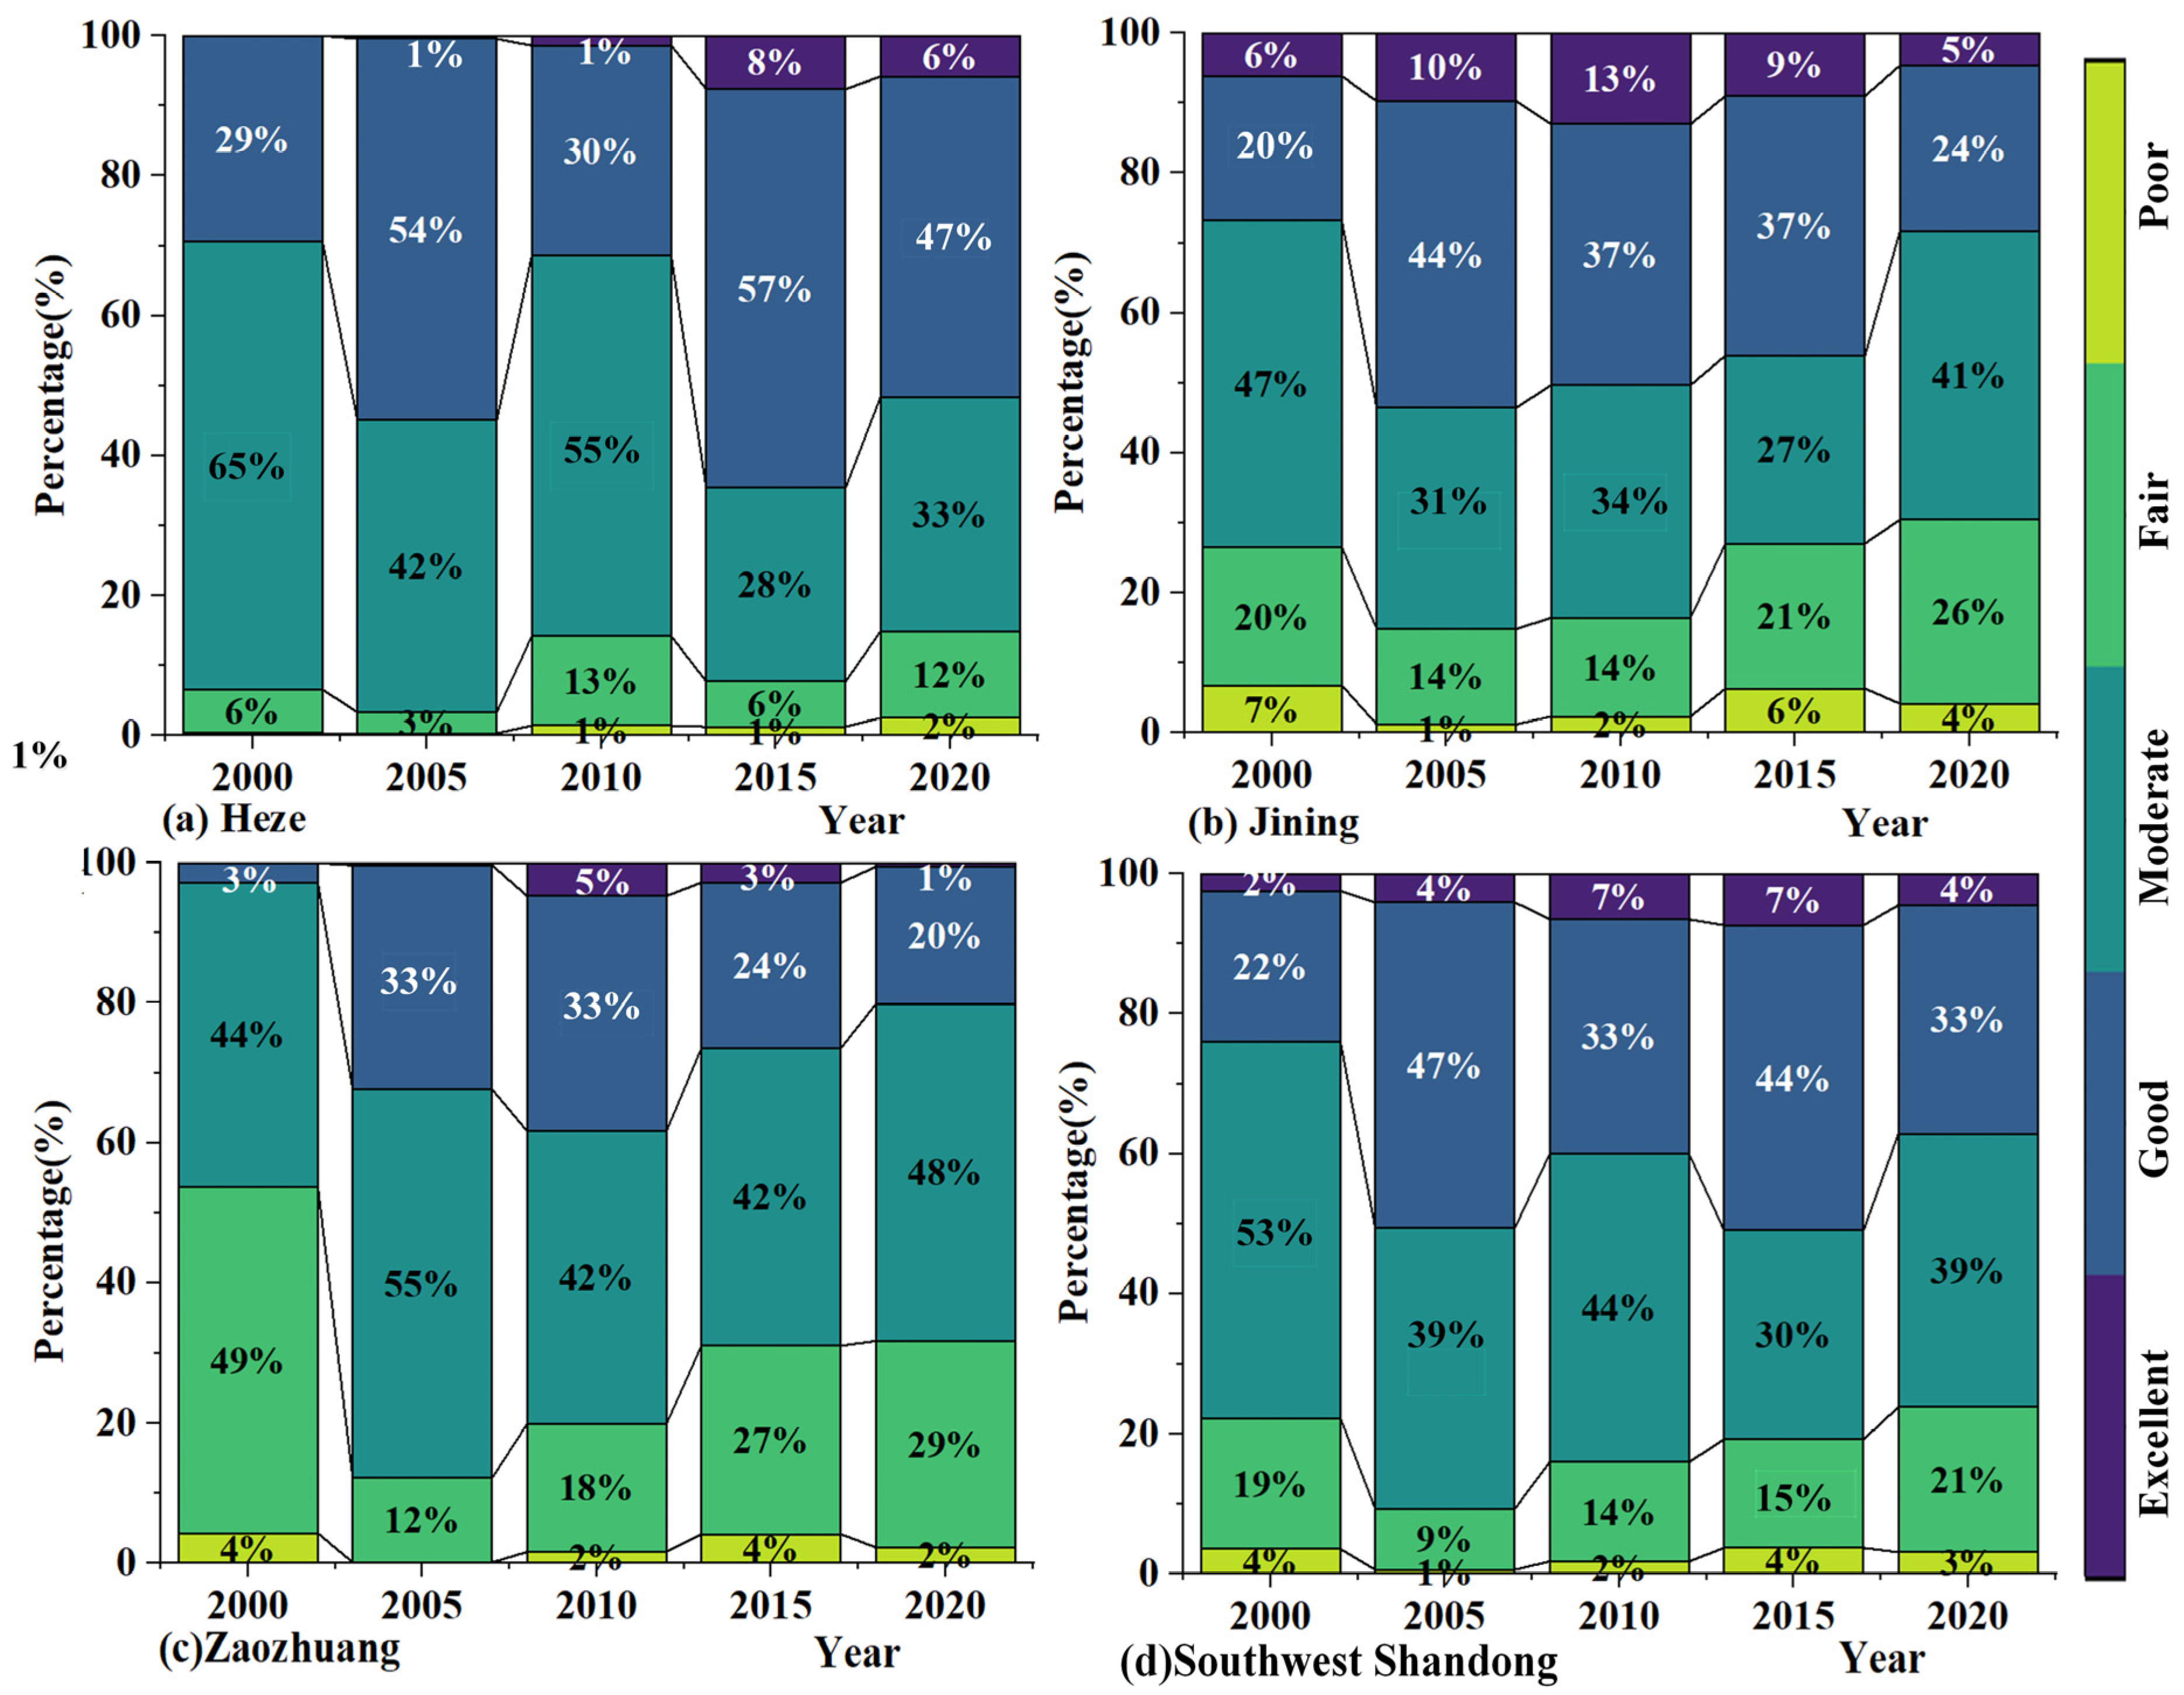
3.2.1. Characteristics of Spatio-Temporal Distribution of Environmental Condition

The RSEI provides a clear view of the fluctuations in eco-environmental quality in the SSUA. We categorized the RSEI into five degrees: poor (0–0.2), fair (0.2–0.4), moderate (0.4–0.6), good (0.6–0.8), and excellent (0.8–1). These classifications helped visualize the eco-environmental quality in southwestern Shandong Province (Figure 7) and the changes over time in specific cities like Heze, Jining, and Zaozhuang (Figure 8). This classification system is crucial for understanding and monitoring ecological health.
Over the past two decades, the western part of the SSUA has consistently shown a better eco-environmental quality than the eastern part. This trend is closely linked to the industrial structure in the region. Zaozhuang, with its high industrial activity, exhibited a lower eco-environmental quality due to significant air pollution and reduced ecological land. In contrast, Heze and Jining generally maintained a higher eco-environmental quality. Industrial activity directly impacts regional eco-environmental quality, with more pollution-intensive industries leading to poorer outcomes.
Throughout the past two decades, most regions in southwestern Shandong have seen improvements in their eco-environmental quality. Heze and Jining have shifted from a moderate to good eco-environmental quality, while Zaozhuang has moved from fair to moderate. The prevalence of good and moderate eco-environmental qualities around urban economic centers emphasizes the uneven distribution of environmental benefits. The overall trend suggests a positive shift towards better eco-environmental quality, especially in less industrialized areas.
With ongoing ecological projects, the ecological condition in the SSUA has generally enhanced, transitioning from lower to higher levels. Areas with good and moderate qualities are expanding, while regions with poor quality are shrinking. However, urban expansion and industrial development continue to pose challenges. Balancing ecological restoration with urban and industrial growth is essential for sustainable development in the region.

3.2.2. Trend Characteristics of Eco-Environmental Condition

In this study, Theil–Sen median slope estimation and the Mann–Kendall significance test are used to conduct the trend analysis and statistics on the RSEI of the SSUA to obtain the changing trends in environmental conditions during the twenty years of study. As shown in Figure 9, most regions exhibited an improving trend in eco-environmental quality, covering approximately 11,460.563 km2 or 41.30% of the total area. Moving outward from the urban centers, there was a decreasing trend in the VC, though most declines were non-significant, covering about 5389.625 km2 or 19.42% of the area. In Heze, eco-environmental quality degradation was more pronounced but still largely non-significant, aligning with urban development trends. This indicates that urban expansion has had a more noticeable influence on surrounding areas.
Heze experienced the most severe degradation in eco-environmental quality among the cities studied, which is largely due to its higher proportion of agricultural land and less industrialization compared to Jining and Zaozhuang. Jining’s degradation ranked second, while Zaozhuang mostly saw improvements. Heze’s predominantly agricultural base has made it more vulnerable to eco-environmental decline amidst urbanization.
Overall, while the majority of southwestern Shandong Province shows an increasing trend in eco-environmental quality, urban zones have experienced a decline. This trend is closely tied to the contrasting impacts of urbanization and industrialization. Balancing urban development with ecological preservation remains a key challenge for sustainable growth in the region.

3.2.3. Persistence Analysis of Eco-Environmental Condition

With the aim of forecasting the future trajectory of ecological conditions in southwestern Shandong Province, we performed a persistence examination of the RSEI using the Hurst index, which varied from 0.06 to 0.99. This index was categorized into five levels: strong anti-persistence (0.06–0.3), weak anti-persistence (0.3–0.49), random (0.49–0.51), weak persistence (0.51–0.7), and strong persistence (0.7–0.99). The results, shown in Figure 10, illustrate the persistence of ecological conditions from 2000 to 2020 and the projected future trends and statistical examination of the temporal persistence and projected future alterations in eco-environmental quality.
Over the past two decades, most areas in the southwest of Shandong Province exhibited strong persistence in eco-environmental quality, covering approximately 114,862 km2 or 55% of the entire region. This suggests that more than half of the region has maintained a stable and strong eco-environmental quality.
Weak persistence was observed in a significant portion of the region, covering about 8718 km2 or 32% of the area. Areas with anti-persistence were smaller and mainly situated in the northern sector of Heze City and the western zone of Jining City. Zaozhuang showed minimal anti-persistence. This pattern suggests varying degrees of eco-environmental stability across different regions.
Looking ahead, most areas in the southwest of Shandong Province are expected to improve in eco-environmental quality, covering around 17,070.5 km2 or 84.8% of the entire area. Improvements will primarily occur in the eastern sector of Heze and the northern part of Jining. This optimistic forecast highlights the effectiveness of ongoing environmental restoration efforts.
However, some areas are predicted to experience eco-environmental quality degradation, affecting approximately 1841.8 km2 or 9.1% of the total area. These areas are primarily around economic centers and transportation hubs, with the most severe degradation near Jining City. Targeted measures are needed to address environmental challenges in these vulnerable areas.

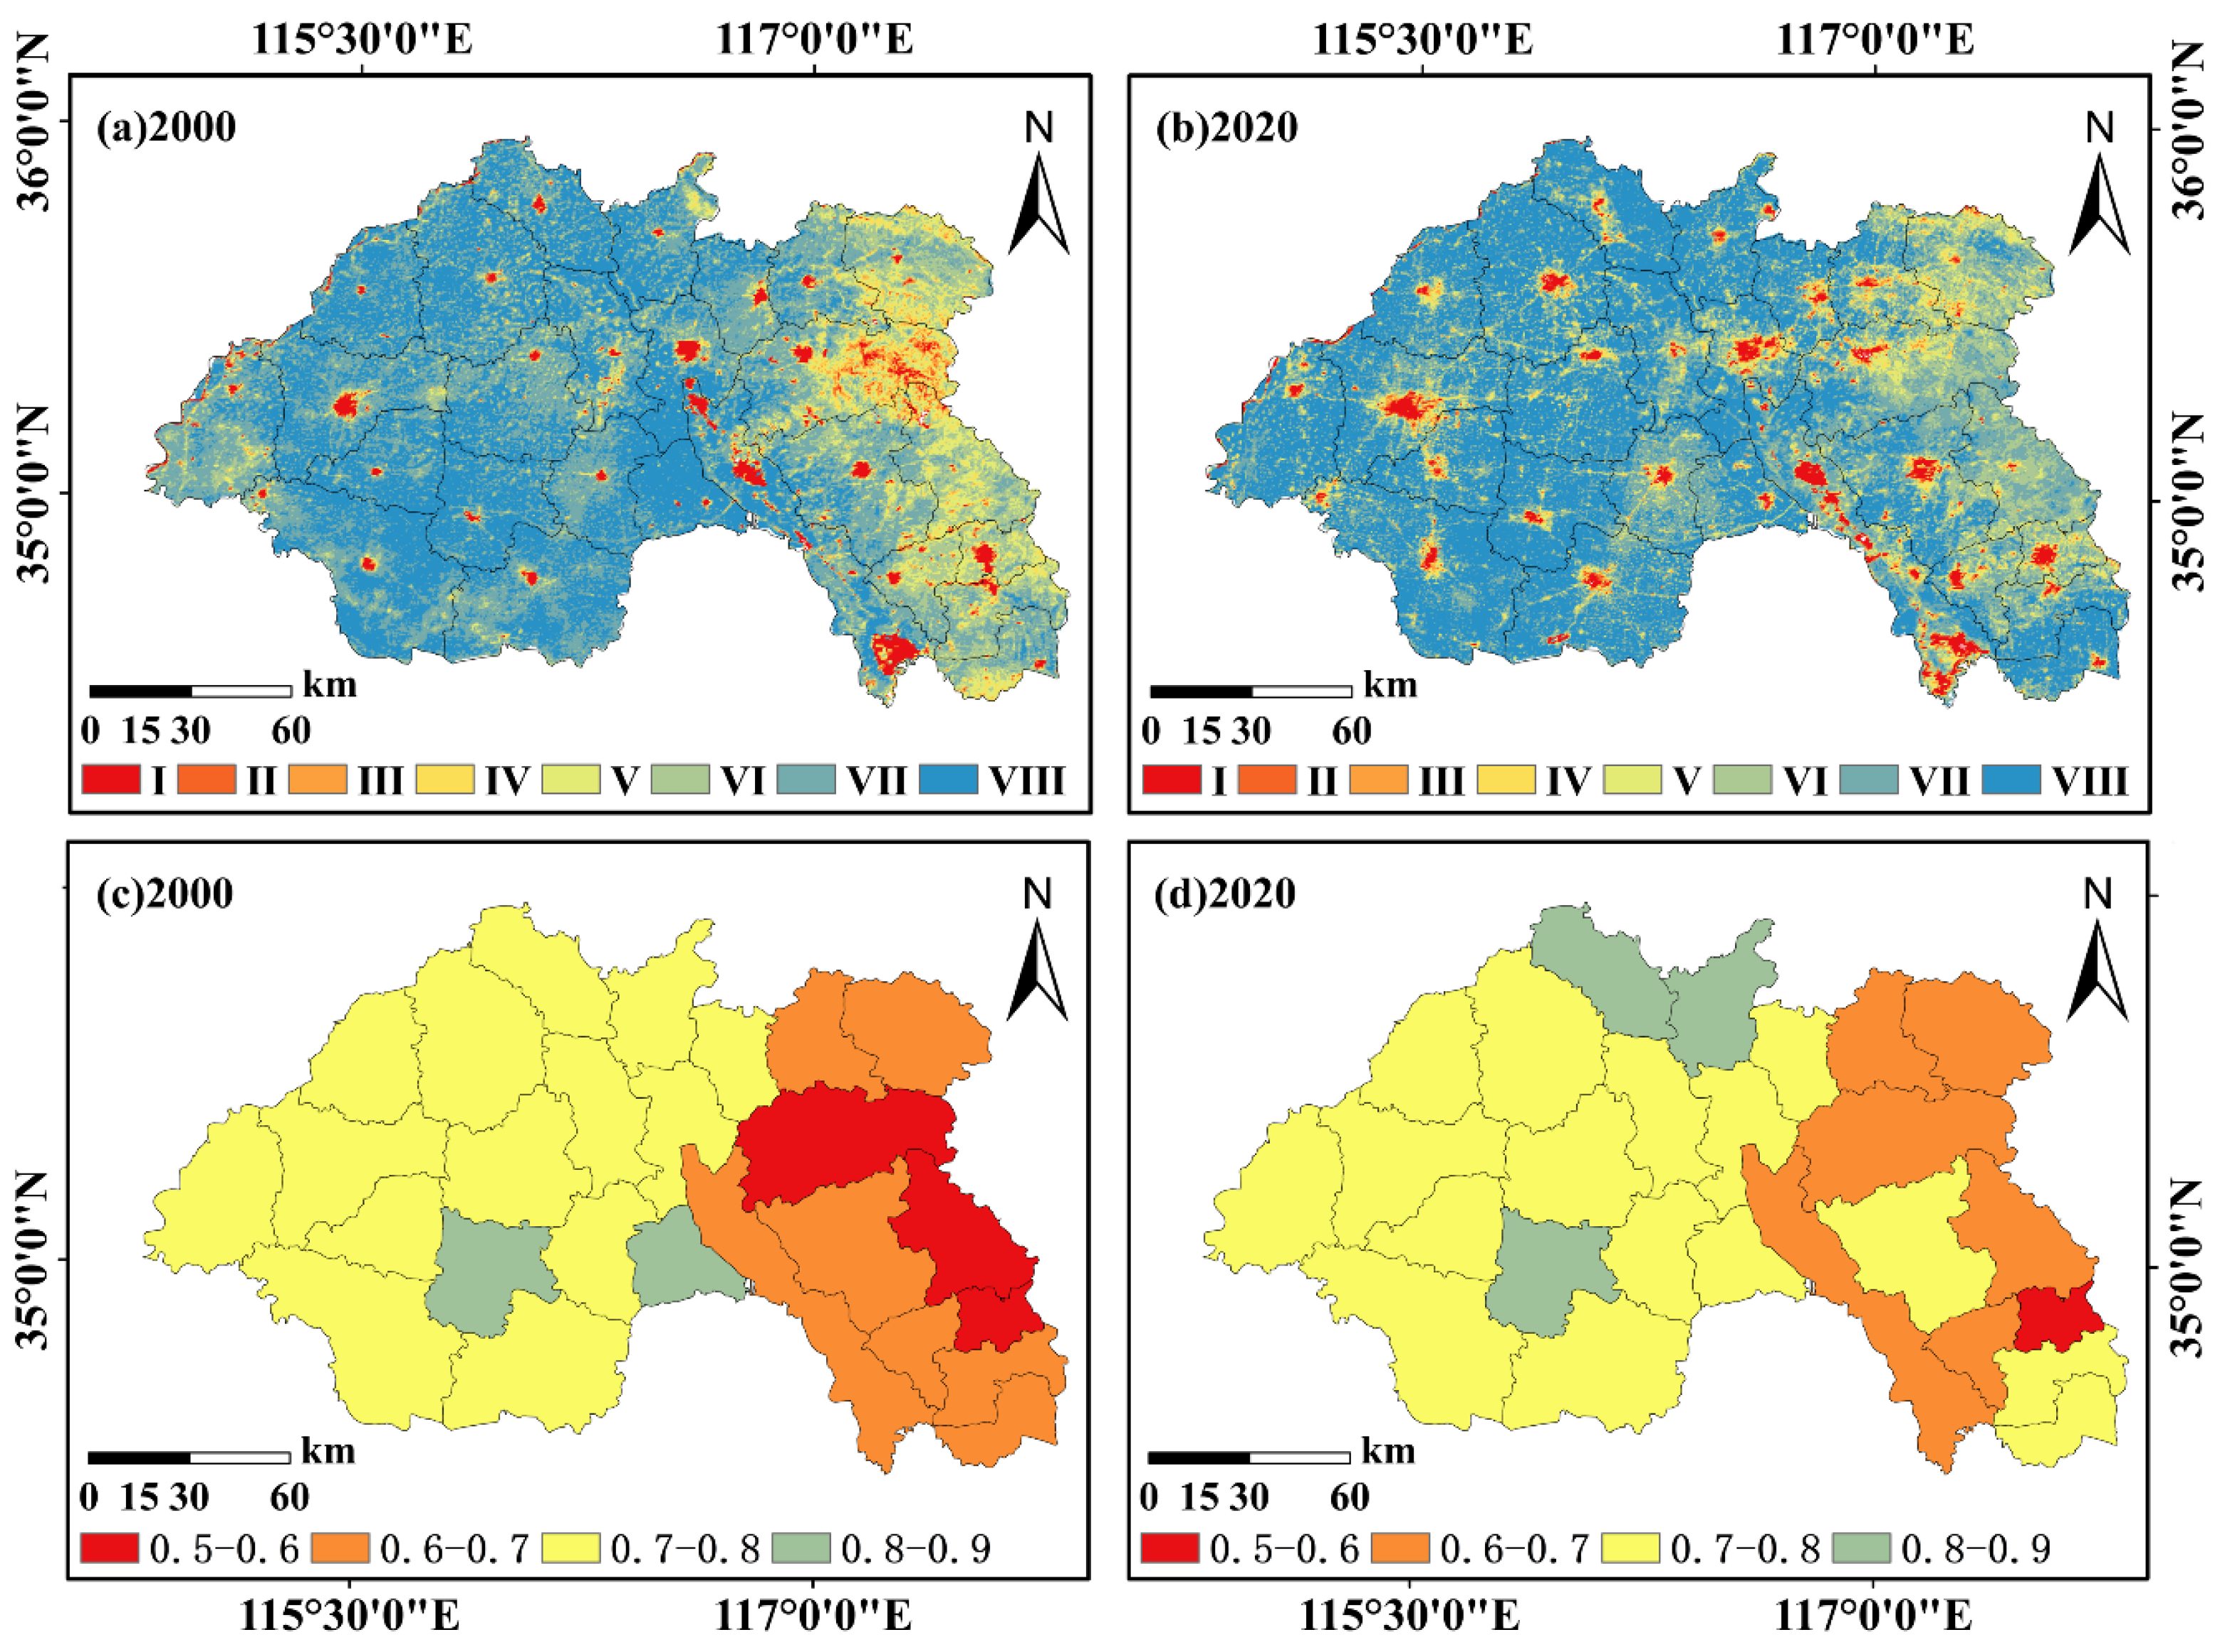
3.3. Assessment of the Coupling Coordination between Vegetation Coverage and Eco-Environmental Condition

Based on the ICCDM, the coordination analysis of VC and environmental conditions in southwestern Shandong Province was conducted, and this effectively explores the interactive relationship between VC and environmental quality in the study region. The results of this analysis in southwestern Shandong are depicted in Figure 11. The results indicate that over the past twenty years, the overall coupling coordination between the VC and RESI in southwestern Shandong has remained stable in an orderly and coordinated development state, with mean values transformed from 0.72 (2000) to 0.74 (2020).
Specifically, in terms of time trends (Figure 11a,b), during the 2000 to 2020 period, various regions, such as Zones I and II, exhibited a state of joint expansion in their coupling coordination status, with their development direction aligning closely with urban planning direction. With the expansion of areas exhibiting coupling coordination imbalance in the economic core region of southwestern Shandong, the coupling coordination status in the Zaozhuang area gradually improved. The dominant status shifted from Zones I, II, III, and IV to Zones V, VI, and VII, indicating that with the implementation of the environmental regulations and the ecological civilization construction concept, further improvements had been made in the modification of the regional landscape and industrial composition, promoting a noticeable improvement trend in both the VC and eco-environmental quality. This progress indicated a further development in the beneficial interaction between the two.
Geographically, the coupling coordination relationship between the FVC and RSEI in the SSUA exhibited a network-like distribution pattern characterized by low coupling coordination degrees among various economic development centers (Figure 11a,b). Regions with imbalanced development in coupling coordination were mainly concentrated around the economic centers of each county. On one hand, with the progress of urbanization, urbanization and industrialization activities in the economic core areas, accompanied by pollution and land degradation, may have negative impacts on both VC and environmental quality to some degree. On the other hand, unreasonable land-use practices such as excessive cultivation and soil erosion may destroy habitats for vegetation and organisms, exacerbating the expansion of areas with imbalanced coupling coordination between economic centers and VC and ecological environment quality.
When analyzed at the county level (Figure 11c,d), from 2000 to 2020, the dynamic coupling interaction between the FVC and RSEI in southwestern Shandong Province was mainly in an orderly and coordinated development state, primarily distributed in Heze City and Jining City, while most areas of Zaozhuang City exhibited a slightly coordinated development state. There was no significant change in the coupling relationship between the FVC and RSEI in each county of Heze City. The coupling relationship between the FVC and RSEI in Liangshan County and Wenshang County of Jining City had shifted from an orderly coordinated development to a dominant complementary and coordinated development, while Zoucheng City had transitioned from a scarcely coordinated development to a marginally coordinated development. However, there were also instances of degradation in the coupling coordination relationship between the VC and eco-environmental condition in some parts of Jining City, where Yutai County had shifted from a dominant complementary coordinated development to an orderly coordinated development. In Zaozhuang City, the coupling coordination relationship between the VC and eco-environmental quality in Shanting County had changed from barely coordinated to slightly coordinated, and in Tengzhou City, Yicheng County, and Taierzhuang County, the coupling coordination relationship had shifted from slightly coordinated development to orderly coordinated development. Zaozhuang City is an industrial city mainly focusing on chemical, machinery, and building materials industries, and it is also one of the important energy bases in East China. Although Heze City and Jining City had relatively diverse industrial structures, their agricultural industries still account for higher proportions compared to Zaozhuang City, leading to a lower level of economic development. Agricultural activities result in relatively lower damage to the ecological environment, and cities with higher proportions of agriculture often have a higher VC and ecological quality compared to cities with higher levels of industrialization. Therefore, the level of coordination between the FVC and RSEI in Zaozhuang City is slightly lower than that in the other two cities. With the improvement of regional vegetation conditions and environmental quality, there is also further improvement in the coupling coordination relationship among various counties.

4. Discussion

In terms of research methodology, we employed Theil–Sen trend analysis [35] and Hurst index analysis [36] to explore the spatio-temporal variations and future trends in vegetation and environmental conditions in the SSUA. Compared to spatial analysis methods such as elliptical variance and spatial autocorrelation analysis, which typically focus on city, county, or small-scale regions [23,27], these methods offer greater precision, allowing for a more detailed observation of subtle changes within the region [36]. However, the limited resolution of Landsat imagery ignores, to some extent, the fragmented regional vegetation cover and ecological quality [30]. Future research could utilize multisource high-resolution data to conduct more refined monitoring at a smaller scale. Moreover, most studies have been confined to the singular coupling relationship between VC, ecological environment quality, and their driving factors [28]. This research enhanced our understanding by employing an improved coupled coordination model to explore the interaction mechanisms between the FVC and RSEI, thereby supplementing the understanding of vegetation ecological relationships. Nevertheless, the current findings on the coupled effects in the industrial city cluster of southwestern Shandong lack sufficient representativeness. Future studies could compare multiple typical industrial city clusters to explore the coupling mechanisms and internal dynamics of vegetation and ecology in greater depth.
In terms of the research findings, the spatio-temporal evolution of FVC and the RSEI across different regions of the SSUA in the past 20 years exhibits a general trend of improvement in VC and ecological quality. This observation aligns with the results reported by He [53] and Dong [54]. The improvements can be largely attributed to policies such as the change of cultivated land to forest or grassland and the afforestation of barren hills [29]. However, it is notable that areas around urban economic centers tend to have lower VC and ecological quality, with some areas even experiencing significant declines. This phenomenon mirrors findings in similar studies, where high ecological quality is typically found in urban green spaces and remnants of natural landscapes, while lower values are observed in areas undergoing extensive urban development [55]. The increase in construction land has resulted in a corresponding decrease in ecological land use [56]. Intense urbanization processes hinder vegetation and ecological development and tend to accelerate these issues with the expansion of urban areas [57]. Urban construction also leads to landscape fragmentation, disrupting existing ecological connectivity. Overall, there is a spatially joint pattern of high vegetation cover and good ecological quality in the southwestern Shandong urban agglomeration (SSUA). Regions with high vegetation cover generally exhibit better ecological quality. This positive correlation between vegetation and ecological quality is supported by studies by Aizizi [56] and Yuan [58]. However, significant spatial heterogeneity exists between FVC and the RSEI, with Jining and Heze showing markedly higher ecological quality and vegetation cover compared to Zaozhuang. The primary reason for this disparity is the geographical positioning of Jining and Heze at the base of the Taihang Mountains. The orographic lift effect of the mountains causes moist air masses to rise and cool, leading to increased precipitation on the windward slopes. Studies indicate that vegetation cover responds sensitively and timely to precipitation variations [59], and there is a positive correlation between rainfall and ecological quality [58]. Additionally, Heze and Jining’s predominant agricultural land use further enhances the regions’ responsiveness to climatic changes, amplifying this effect [59]. Regarding the coupling and coordination relationship between vegetation cover and ecological quality, most regions exhibit orderly and coordinated development. However, economic centers often show signs of discoordination. In megacities and supercities, higher levels of coordination are observed [60]. This suggests a bipolar impact of economic development on regional coordination. In economically underdeveloped areas, economic activities may adversely affect regional coordination. This pattern indicates potential conflicts between economic activities and ecological systems in many industrially transitioning cities, necessitating further intervention by relevant authorities to promote harmonious development.
In the context of rapid urbanization, this research provides a fresh perspective on ecological research in the SSUA. It offers robust data support for the orderly and coordinated development and planning of heavy industrial agglomeration and urban areas, promoting the integration of ecological protection with economic growth. Future strategies should fully account for regional differences and be adaptable to the evolving environmental conditions.

5. Conclusions

This research sought to investigate the changes over time and across different areas of vegetation cover and ecological quality in the SSUA in China, as well as the coupling coordination relationship between these two factors. The principal results are summarized as follows:
(1)
Over the past two decades, the vegetation coverage and eco-environmental quality in the study area has a certain degree of improvement. These aspects have demonstrated a consistent shift from lower to higher levels. This discovery backs the hypothesis that urban and regional development policies have positively influenced ecological quality in the area.
(2)
Following the trend analysis results, most areas in the SSUA have exhibited an improving trend in both VC and ecological conditions over the past twenty years. This confirmation suggests that while overall trends are positive, urban expansion can negatively impact specific regions.
(3)
There will be a tendency towards improved VC and ecological conditions in the future in the majority of regions within the SSUA. However, there are still some regions where degradation is anticipated. Future changes in vegetation cover and ecological quality require researchers to continuously monitor and develop adaptive management strategies.
(4)
The coupling relationship between vegetation cover and ecological conditions in the southwestern Shandong region predominantly manifests as an orderly and coordinated state of development. However, there is a growing trend of discoordination near economic centers, indicating that urbanization and economic activities increasingly challenge the ecological balance. Areas with high economic activity are more susceptible to ecological imbalances.
This study still has several limitations that may influence the comprehensiveness and precision of the findings. Primarily, the reliance on a single dataset with a uniform resolution of 250 m after resampling may not capture the fine-scale variations in vegetation cover and eco-environmental quality. Additionally, while summer data highlight peak vegetation growth, they do not fully capture annual ecological trends. In regions like Shandong Province, with significant seasonal variations, this approach may miss crucial seasonal dynamics that are essential for a holistic understanding of the ecosystem.
To address these limitations, future research should integrate higher-resolution and more diverse remote sensing datasets to enhance the granularity of spatial analysis. Additionally, expanding the temporal scope to include data from all seasons will provide a more comprehensive view of annual ecological dynamics.

Author Contributions

Conceptualization, D.M.; methodology, D.M. and Q.W.; software, Q.H. and Y.Y.; data curation, Z.L.; writing—original draft preparation, D.M.; writing—review and editing, Q.W.; visualization, Q.W. and Q.H.; supervision, Z.L.; project administration, D.M.; funding acquisition, D.M. All authors have read and agreed to the published version of the manuscript.

Funding

This research was supported by the National Natural Science Foundation of China (grant number [42171435]); the Natural Science Foundation of Shandong Province (grant number [ZR2020MD025]); and the Doctoral Fund Projects of Shandong Jianzhu University (grant number [X21079Z]).

Data Availability Statement

The datasets generated and analyzed during the current study are not publicly available but are available from the corresponding author upon reasonable request.

Conflicts of Interest

The authors declare no conflict of interest.

References

  1. Liu, C.; Li, X.; Han, D. Accessibility analysis of urban parks: Methods and key issues. Acta Ecol. Sin. 2010, 30, 5381–5390. [Google Scholar]
  2. Hao, X. Analysis of meteorological factors affecting the autumn phenology of woody plants in southwest part of Shandong Province. J. Shaanxi Meteorol. 2022, 3, 53–59. [Google Scholar]
  3. Wei, Q.; Ling, L.; Chai, C.; Zhang, G.; Yan, P.; Tao, J.; Xue, R. Soil physical and chemical properties in forest succession process in Xinglong Mountain of Gansu. Acta Ecol. Sin. 2012, 32, 4700–4713. [Google Scholar] [CrossRef]
  4. Xie, Q.; Yang, X.; Hao, L. Spatio-temporal Variation of Vegetation Cover and Its Driving Factors in Three-River Headwaters Region during 2001–2020. Bull. Soil Water Conserv. 2022, 42, 202–212. [Google Scholar] [CrossRef]
  5. Yang, S.; Liu, J.; Wei, R.; Dong, X.; Lin, Q.; Zhang, C. Spatiotemporal variation characteristics and causes of vegetation coverage in growing season in the upper reaches of the Yangtze River Basin. Resour. Environ. Yangtze Basin 2021, 31, 1523–1533. [Google Scholar]
  6. Zhang, X.; Wang, G.; Xue, B.; Yinglan, A. Changes in vegetation cover and its influencing factors in the inner Mongolia reach of the yellow river basin from 2001 to 2018. Environ. Res. 2022, 215, 114253. [Google Scholar] [CrossRef] [PubMed]
  7. Liu, J.; Fan, J.; Yang, C.; Xu, F.; Zhang, X. Novel vegetation indices for estimating photosynthetic and non-photosynthetic fractional vegetation cover from Sentinel data. Int. J. Appl. Earth Obs. Geoinf. 2022, 109, 102793. [Google Scholar] [CrossRef]
  8. Yang, Z.; Tian, J.; Su, W.; Wu, J.; Liu, J.; Liu, W.; Guo, R. Analysis of ecological environmental quality change in the Yellow River Basin using the remote-sensing-based ecological index. Sustainability 2022, 14, 10726. [Google Scholar] [CrossRef]
  9. Liu, C.; Zhang, X.; Wang, T.; Chen, G.; Zhu, K.; Wang, Q.; Wang, J. Detection of vegetation coverage changes in the Yellow River Basin from 2003 to 2020. Ecol. Indic. 2022, 138, 108818. [Google Scholar] [CrossRef]
  10. Yu, H.; Zahidi, I.; Liang, D. Spatiotemporal variation of vegetation cover in mining areas of Dexing City, China. Environ. Res. 2023, 225, 115634. [Google Scholar] [CrossRef]
  11. Zhao, X.; Han, D.; Lu, Q.; Li, Y.; Zhang, F. Spatiotemporal variations in ecological quality of Otindag Sandy Land based on a new modified remote sensing ecological index. J. Arid Land. 2023, 15, 920–939. [Google Scholar] [CrossRef]
  12. Yao, H. Coupling Degree Model for Urbanization and Ecological Environment. Ekoloji. Derg. 2019, 28, 1481–1485. [Google Scholar]
  13. Wu, M.; Vico, G.; Manzoni, S.; Cai, Z.; Bassiouni, M.; Tian, F.; Zhang, J.; Ye, K.; Messori, G. Early growing season anomalies in vegetation activity determine the large-scale climate-vegetation coupling in Europe. J. Geophys. Res. Biogeosci. 2021, 126, e2020JG006167. [Google Scholar] [CrossRef]
  14. Yang, G.; Huang, K.; Sun, W.; Meng, X.; Mao, D.; Ge, Y. Enhanced mangrove vegetation index based on hyperspectral images for mapping mangrove. ISPRS J. Photogramm. Remote Sens. 2022, 189, 236–254. [Google Scholar] [CrossRef]
  15. Yan, K.; Gao, S.; Chi, H.; Qi, J.; Song, W.; Tong, Y.; Mu, X.; Yan, G. Evaluation of the vegetation-index-based dimidiate pixel model for fractional vegetation cover estimation. IEEE Trans. Geosci. Remote Sens. 2021, 60, 1–14. [Google Scholar] [CrossRef]
  16. Feng, Q.; Liu, J.; Gong, J. UAV remote sensing for urban vegetation mapping using random forest and texture analysis. Remote Sens. 2015, 7, 1074–1094. [Google Scholar] [CrossRef]
  17. Feng, F.; Yang, X.; Jia, B.; Li, X.; Li, X.; Xu, C.; Wang, K. Variability of urban fractional vegetation cover and its driving factors in 328 cities in China. Sci. China Earth Sci. 2024, 67, 466–482. [Google Scholar] [CrossRef]
  18. Satti, Z.; Naveed, M.; Shafeeque, M.; Ali, S.; Abdullaev, F.; Ashraf, T.M.; Irshad, M.; Li, L. Effects of climate change on vegetation and snow cover area in Gilgit Baltistan using MODIS data. Environ. Sci. Pollut. Res. 2023, 30, 19149–19166. [Google Scholar] [CrossRef] [PubMed]
  19. Xie, L.; Meng, X.; Zhao, X.; Fu, L.; Sharma, R.P.; Sun, H. Estimating Fractional Vegetation Cover Changes in Desert Regions Using RGB Data. Remote Sens. 2022, 14, 3833. [Google Scholar] [CrossRef]
  20. Jiang, J.; Yu, Q.; Niu, Z.; Liang, C.; Gao, Y.; ZHANG, L.; ZHANG, H. Remote Sensing Extraction of Potamogeton crispus L. in Nansi Lake based on Sentinel-2. Remote Sens. Technol. Appl. 2023, 38, 1192–1202. [Google Scholar]
  21. Yao, J.; Li, X.; Zhang, J. Evaluation and analysis of ecological environment quality based on information entropy. Fresenius Environ. Bull. 2021, 30, 9128–9134. [Google Scholar]
  22. Xiong, Y.; Xu, W.; Huang, S.; Wu, C.; Dai, F.; Wang, L.; Lu, N.; Kou, W. Ecological environment quality assessment of Xishuangbanna rubber plantations expansion (1995–2018) based on multi-temporal Landsat imagery and RSEI. Geocarto Int. 2022, 37, 3441–3468. [Google Scholar] [CrossRef]
  23. Xiong, Y.; Xu, W.; Lu, N.; Huang, S.; Wu, C.; Wang, L.; Dai, F.; Kou, W. Assessment of spatial–temporal changes of ecological environment quality based on RSEI and GEE: A case study in Erhai Lake Basin, Yunnan province, China. Ecol. Indic. 2021, 125, 107518. [Google Scholar] [CrossRef]
  24. Zhang, H.; Wang, W.; Song, Y.; Miao, L.; Ma, C. Ecological index evaluation of arid inflow area based on the modified remote sensing ecological index: A case study of Tabu River Basin at the northern foot of the Yin Mountains. Acta Ecol. Sin. 2024, 44, 38–58. [Google Scholar] [CrossRef]
  25. Yang, W.; Zhou, Y.; Li, C. Assessment of Ecological Environment Quality in Rare Earth Mining Areas Based on Improved RSEI. Sustainability 2023, 15, 2964. [Google Scholar] [CrossRef]
  26. Chen, N.; Cheng, G.; Yang, J.; Ding, H.; He, S. Evaluation of Urban Ecological Environment Quality Based on Improved RSEI and Driving Factors Analysis. Sustainability 2023, 15, 8464. [Google Scholar] [CrossRef]
  27. Gu, F.; Xu, G.; Wang, B.; Jia, L.; Xu, M. Vegetation cover change and restoration potential in the Ziwuling Forest Region, China. Ecol. Eng. 2023, 187, 106877. [Google Scholar] [CrossRef]
  28. Luo, Z.; Liu, Y.; Zhou, H. The vegetation–topography heterogeneity coupling in the Loess Plateau, China. Front. Environ. Sci. 2024, 12, 1343215. [Google Scholar] [CrossRef]
  29. He, L.; Guo, J.; Jiang, Q.; Zhang, Z.; Yu, S. How did the Chinese Loess Plateau turn green from 2001 to 2020? An explanation using satellite data. Catena 2022, 214, 106246. [Google Scholar] [CrossRef]
  30. Lei, X.; Liu, H.; Li, S.; Luo, Q.; Cheng, S.; Hu, G.; Wang, X.; Bai, W. Coupling coordination analysis of urbanization and ecological environment in Chengdu-Chongqing urban agglomeration. Ecol. Indic. 2024, 161, 111969. [Google Scholar] [CrossRef]
  31. Zhao, Y.; Hou, P.; Jiang, J.; Zhai, J.; Chen, Y.; Wang, Y.; Bai, J.; Zhang, B.; Xu, H. Coordination study on ecological and economic coupling of the Yellow River Basin. Int. J. Environ. Res. Public Health 2021, 18, 10664. [Google Scholar] [CrossRef] [PubMed]
  32. Gao, Z.; Liu, J.; Feng, J.; Wang, M.; Wu, G. Hydrogeochemical Characteristics and the Suitability of Groundwater in the Alluvial-Diluvial Plain of Southwest Shandong Province, China. Water 2019, 11, 1577. [Google Scholar] [CrossRef]
  33. Luo, M.; Zhang, S.; Huang, L.; Liu, Z.; Yang, L.; Li, R.; Lin, X. Temporal and Spatial Changes of Ecological Environment Quality Based on RSEI: A Case Study in Ulan Mulun River Basin, China. Sustainability 2022, 14, 13232. [Google Scholar] [CrossRef]
  34. Yang, X.; Meng, F.; Fu, P.; Zhang, Y.; Liu, Y. Spatiotemporal change and driving factors of the Eco-Environment quality in the Yangtze River Basin from 2001 to 2019. Ecol. Indic. 2021, 131, 108214. [Google Scholar] [CrossRef]
  35. Chen, W.; Xia, L.; Xu, G.; Yu, S.; Chen, H.; Chen, J. Dynamic variation of NDVI and its influencing factors in the Pearl River Basin from 2000 to 2020. Ecol. Environ. 2022, 31, 1306. [Google Scholar] [CrossRef]
  36. Liu, M.; Liu, Y.; Chen, M.; Li, Q.; Liang, Q.; Zou, J.; Tuerhong, J. Spatiotemporal Evolution of Vegetation Coverage and Its Response to Climate Change in Upper Reaches of Ganjiang River Basin during 2000–2018. Bull. Soil Water Conserv. 2020, 40, 284–290. [Google Scholar] [CrossRef]
  37. Dong, G.; Ge, Y.; Liu, J.; Kong, X.; Zhai, R. Evaluation of coupling relationship between urbanization and air quality based on improved coupling coordination degree model in Shandong Province, China. Ecol. Indic. 2023, 154, 110578. [Google Scholar] [CrossRef]
  38. Li, X.; Shi, Z.; Yu, J.; Liang, J. Study on the Change in Vegetation Coverage in Desert Oasis and Its Driving Factors from 1990 to 2020 Based on Google Earth Engine. Appl. Sci. 2023, 13, 5394. [Google Scholar] [CrossRef]
  39. Gong, Z.; Zhao, S.; Gu, J. Correlation analysis between vegetation coverage and climate drought conditions in North China during 2001–2013. J. Geogr. Sci. 2017, 27, 143–160. [Google Scholar] [CrossRef]
  40. Xu, H. A remote sensing index for assessment of regional ecological changes. Remote Sens. Technol. Appl. 2013, 22, 301–308. [Google Scholar]
  41. Yang, H.; Yu, J.; Xu, W.; Wu, Y.; Lei, X.; Ye, J.; Geng, J.; Ding, Z. Long-time series ecological environment quality monitoring and cause analysis in the Dianchi Lake Basin, China. Ecol. Indic. 2023, 148, 110084. [Google Scholar] [CrossRef]
  42. Li, M.; Wu, B.; Yan, C.; Zhou, W. Estimation of vegetation fraction in the upper basin of Miyun reservoir by remote sensing. Resour. Sci. 2004, 26, 153–159. [Google Scholar] [CrossRef]
  43. Crist, E.P. A TM tasseled cap equivalent transformation for reflectance factor data. Remote Sens. Environ. 1985, 17, 301–306. [Google Scholar] [CrossRef]
  44. Baig, M.H.A.; Zhang, L.; Shuai, T.; Tong, Q. Derivation of a tasselled cap transformation based on Landsat 8 at-satellite reflectance. Remote Sens. Lett. 2014, 5, 423–431. [Google Scholar] [CrossRef]
  45. Xu, H. A new index-based built-up index (IBI) and its eco-environmental significance. Remote Sens. Technol. Appl. 2011, 22, 301–308. [Google Scholar] [CrossRef]
  46. Rikimaru, A.; Roy, P.; Miyatake, S. Tropical forest cover density mapping. Trop. Ecol. 2002, 43, 39–47. [Google Scholar]
  47. Wang, S.; Gao, M.; Li, Z.; Ma, J.; Peng, J. How Do Driving Factors Affect Vegetation Coverage Change in the Shaanxi Region of the Qinling Mountains? Remote Sens. 2023, 16, 160. [Google Scholar] [CrossRef]
  48. Zhang, D.; Ge, W.; Zhang, Y. Evaluating the vegetation restoration sustainability of ecological projects: A case study of Wuqi County in China. J. Clean. Prod. 2020, 264, 121751. [Google Scholar] [CrossRef]
  49. Jiang, W.; Yuan, L.; Wang, W.; Cao, R.; Zhang, Y.; Shen, W. Spatio-temporal analysis of vegetation variation in the Yellow River Basin. Ecol. Indic. 2015, 51, 117–126. [Google Scholar] [CrossRef]
  50. Zhang, L.; Wu, M.; Bai, W.; Jin, Y.; Yu, M.; Ren, J. Measuring coupling coordination between urban economic development and air quality based on the Fuzzy BWM and improved CCD model. Sustain. Cities Soc. 2021, 75, 103283. [Google Scholar] [CrossRef]
  51. Shen, L.; Huang, Y.; Huang, Z.; Lou, Y.; Ye, G.; Wong, S.-W. Improved coupling analysis on the coordination between socio-economy and carbon emission. Ecol. Indic. 2018, 94, 357–366. [Google Scholar] [CrossRef]
  52. Zhang, Z.; Li, Y. Coupling coordination and spatiotemporal dynamic evolution between urbanization and geological hazards–A case study from China. Sci. Total Environ. 2020, 728, 138825. [Google Scholar] [CrossRef] [PubMed]
  53. Nie, T.; Dong, G.; Jiang, X.; Lei, Y. Spatio-temporal changes and driving forces of vegetation coverage on the loess plateau of Northern Shaanxi. Remote Sens. 2021, 13, 613. [Google Scholar] [CrossRef]
  54. Dong, H.; Liu, Y.; Cui, J.; Zhu, M.; Ji, W. Spatial and temporal variations of vegetation cover and its influencing factors in Shandong Province based on GEE. Environ. Monit. Assess. 2023, 195, 1023. [Google Scholar] [CrossRef] [PubMed]
  55. Wei, W.; Bao, Y.; Wang, Z.; Chen, X.; Luo, Q.; Mo, Y. Response of habitat quality to urban spatial morphological structure in multi-mountainous city. Ecol. Indic. 2023, 146, 109877. [Google Scholar] [CrossRef]
  56. Aizizi, Y.; Kasimu, A.; Liang, H.; Zhang, X.; Zhao, Y.; Wei, B. Evaluation of ecological space and ecological quality changes in urban agglomeration on the northern slope of the Tianshan Mountains. Ecol. Indic. 2023, 146, 109896. [Google Scholar] [CrossRef]
  57. Mu, W.; Zhu, X.; Ma, W.; Han, Y.; Huang, H.; Huang, X. Impact assessment of urbanization on vegetation net primary productivity: A case study of the core development area in central plains urban agglomeration, China. Environ. Res. 2023, 229, 115995. [Google Scholar] [CrossRef]
  58. Yuan, B.; Fu, L.; Zou, Y.; Zhang, S.; Chen, X.; Li, F.; Deng, Z.; Xie, Y. Spatiotemporal change detection of ecological quality and the associated affecting factors in Dongting Lake Basin, based on RSEI. J. Clean. Prod. 2021, 302, 126995. [Google Scholar] [CrossRef]
  59. Duo, A.; Zhao, W.; Qu, X.; Jing, R.; Xiong, K. Spatio-temporal variation of vegetation coverage and its response to climate change in North China plain in the last 33 years. Int. J. Appl. Earth Obs. Geoinf. 2016, 53, 103–117. [Google Scholar] [CrossRef]
  60. Xu, D.; Yang, F.; Yu, L.; Zhou, Y.; Li, H.; Ma, J.; Huang, J.; Wei, J.; Xu, Y.; Zhang, C. Quantization of the coupling mechanism between eco-environmental quality and urbanization from multisource remote sensing data. J. Clean. Prod. 2021, 321, 128948. [Google Scholar] [CrossRef]
Figure 1. Study area in southwest Shandong Province. (a) Geographic location, (b) location of study area in Shandong Province, and (c) surrounding provinces.
Forests 15 01200 g001
Figure 2. Research flowchart.
Forests 15 01200 g002
Figure 3. Spatial distribution of FVC in southwestern Shandong Province from 2000 to 2020. (a) 2000, (b) 2005, (c) 2010, (d) 2015, and (e) 2020.
Forests 15 01200 g003
Figure 4. Proportional statistics of FVC classification in each city of the southwestern Shandong urban agglomeration from 2000 to 2020. (a) Heze, (b) Jining, (c) Zaozhuang, and (d) southwestern Shandong Province.
Forests 15 01200 g004
Figure 5. Spatial distribution and statistical analysis of FVC trends in southwestern Shandong Province from 2000 to 2020.
Forests 15 01200 g005
Figure 6. Persistence characteristics of FVC in southwestern Shandong Province from 2000 to 2020. (a) Spatial distribution of FVC Hurst index, (b) future trends of FVC, (c) statistics on the grading of FVC Hurst index, and (d) statistics on the future trend of FVC.
Forests 15 01200 g006
Figure 7. Spatial distribution of RSEI in southwestern Shandong Province from 2000 to 2020. (a) 2000, (b) 2005, (c) 2010, (d) 2015, and (e) 2020.
Forests 15 01200 g007
Figure 8. Proportional statistics of RSEI classification in each city of the southwestern Shandong urban agglomeration from 2000 to 2020. (a) Heze, (b) Jining, (c) Zaozhuang, and (d) southwestern Shandong Province.
Forests 15 01200 g008
Figure 9. Spatial distribution and statistical analysis of RSEI trends in southwestern Shandong Province from 2000 to 2020.
Forests 15 01200 g009
Figure 10. Persistence characteristics of RSEI in southwestern Shandong Province from 2000 to 2020. (a) Spatial distribution of RSEI Hurst index, (b) future trends of RSEI, (c) statistics of the grading of RSEI Hurst index, and (d) statistics of the future trend of RSEI.
Forests 15 01200 g010
Figure 11. Coupling coordination relationship results of FVC and RSEI in southwestern Shandong Province from 2000 to 2020. (a,b) Spatial distribution of coupling and coordination relationship between FVC and RSEI in 2000 and 2020, respectively. (c,d) Spatial distribution of coupling and coordination relationship between FVC and RSEI at county level in 2000 and 2020, respectively.
Forests 15 01200 g011
Table 1. Remote sensing data information and sources.
Data NameResolutionData Sources
USGS Landsat 5 Level 2, Collection 2, Tier 130 mUSGS
(https://www.usgs.gov/) [33] accessed on 15 July 2023
USGS Landsat 8 Level 2, Collection 2, Tier 130 mUSGS
(https://www.usgs.gov/) [33] accessed on 15 July 2023
MOD11A21000 mUSGS
(https://www.usgs.gov/) [34] accessed on 15 July 2023
Table 3. Principles for classifying the degree of change in the FVC and RSEI [35].
βZTrend CategoriesTrend Characteristics
β > 02.58 < Z4Extremely significant increase
1.96 < Z ≤ 2.583Significant increase
1.65 < Z ≤ 1.962Slightly significant increase
Z ≤ 1.651No significant increase
β = 0Z0Unchanged
β < 0Z ≤ 1.65−1No significant reduction
1.65 < Z ≤ 1.96−2Slightly significant reduction
1.96 < Z ≤ 2.58−3Significant reduction
2.58 < Z−4Extremely significant reduction
Table 4. Principles for classifying the coupling and coordination relationship between the FVC and RSEI [37,52].
TypeDSubtypeCode
Balanced development0.8 < D < 1Complementary and coordinated developmentVIII
0.7 < D < 0.8Orderly and coordinated developmentVII
0.6 < D < 0.7Slightly coordinated developmentVI
Transformative development0.5 < D < 0.6Barely coordinated developmentV
0.4 < D < 0.5Slightly uncoordinated developmentIV
0.3 < D < 0.4Moderately uncoordinated developmentIII
Imbalanced development0.2 < D < 0.3Low-level uncoordinated developmentII
0 < D < 0.2Seriously uncoordinated developmentI
Disclaimer/Publisher’s Note: The statements, opinions and data contained in all publications are solely those of the individual author(s) and contributor(s) and not of MDPI and/or the editor(s). MDPI and/or the editor(s) disclaim responsibility for any injury to people or property resulting from any ideas, methods, instructions or products referred to in the content.

