Abstract
The introduction of wood-boring insects to non-native areas can pose a significant threat to global forest ecosystems. Aromia bungii and Massicus raddei, native to Asia including Korea but potentially important in urban forestry worldwide, are severe trunk borers that have recently infested host trees in urban landscapes of Korea. The signs of external injury can help identify cerambycid-infested trees. However, assessing the internal condition of trees without causing damage is challenging, which hinders the management of infested trees that are still alive. This study evaluated the potential use of sonic tomography to assess injury characteristics in the woody parts of trees, such as Prunus × yedoensis and Quercus palustris infested by A. bungii and M. raddei, respectively. Among the 45 investigated trees, the number of holes on external parts was recorded by visual examination. Sonic tomography images revealed decayed areas, allowing for a comparison of internal damage between infested and non-infested trees. The internal status of trees infested by the two cerambycid beetles differed from that of healthy trees. While some healthy trees exhibited minimal internal damage, those that were not infested by beetles showed decayed areas, potentially caused by non-biological factors such as frozen cracks. In conclusion, sonic tomography equipment can potentially be used for non-invasive assessment of internal injuries caused by wood-boring insects in urban trees.
1. Introduction
Wood-boring insects have become significant pests in forest ecosystems globally when they have invaded non-native regions. Certain species, such as the Asian long-horned beetle, Anoplophora glabripennis (Coleoptera: Cerambycidae), and emerald ash borer, Agrilus planipennis (Coleoptera: Buprestidae), have posed a substantial threat to billions of dollars’ worth of forest resources in North America [1,2,3] and Europe [4,5,6]. Other wood-boring insects, such as the red neck longhorn beetle, Aromia bungii and oak longhorn beetle, Massicus raddei, are recently recognized as serious trunk borers of broadleaved trees [7,8]. Additionally, several clearwing moth borers, such as Synanthedon hector and Sphecodoptera sheni, are also infesting Prunus trees and Quercus trees, respectively [9,10]. Notably, A. bungii is classified as a quarantine pest globally [11,12].
Aromia bungii, native to Korea, China, Mongolia, Taiwan, and other regions [13], invaded Japan in 2012 [14]. Since the invasion, this has led to significant mortality among host trees in various isolated regions of Japan [15,16]. Furthermore, A. bungii has expanded its range to Europe [17,18]. This wood-boring insect targets a diverse range of trees belonging to the Rosaceae family, with a particular preference for Prunus × yedoensis [19]. The adult female of A. bungii lays eggs in the crevices of host trees, and hatched larvae feed on the inner tissues of the host trees [20,21]. After 2 to 3 years, older larvae bore into the sapwood and create a pupal chamber, where they then undergo pupation to spend the winter [22]. The life cycle of the insect generally consists of one generation every two years [20,22]. In native ranges, newly emerged adults are typically found in July and August [21].
Massicus raddei has been prominently observed in oak forests, specifically Quercus spp. forests not only in northeastern China [8,23] but also in Korea [24]. While M. raddei has not yet been officially classified as an invasive species in non-native ranges [23], there is a potential for invasion through the trade of wood materials, posing a threat to oak species [8]. Adults of the insect are active from June to August and female adults lay their eggs in weakened trees. Larvae feed beneath the bark and bore into xylem areas to create pupal chambers [21].
In recent times, infestations of A. bungii and M. raddei in their host trees raised management issues in urban landscapes in Korea [24]. The larvae of these beetles, like other wood-boring insects, feed on the interior part of trees, targeting the cambium, phloem, and xylem, thereby disrupting the flow of nutrients and moisture [18,25]. Persistence of this damage may cause the development of hollow spaces within the affected trees, leading to their weakening and death [21,26]. The damage inflicted by cerambycid beetle larvae can typically be identified through external characteristics, although there are various wood borer species, such as Curculionidae (Coleoptera), Buprestidae (Coleoptera), and Cossidae (Lepidoptera). These external characteristics include the presence of a substantial amount of frass, sawdust-like wood materials, and resin exudation. Moreover, cerambycid beetles usually create larger-sized holes associated with adult emergence. These distinctive symptoms are easily noticeable by inspectors or managers, particularly in dead or dying trees.
Traditionally, assessing internal injuries caused by wood-boring pests has necessitated the cutting of trees [27,28]. This poses a challenge in predicting the internal condition of trees that are infested but still living, such as protective trees, roadside trees and so on. Because the internal status of trees affected by wood-boring insects is significant, various methods have been employed to assess the internal status of trees, including the use of increment borers and wood drilling resistance devices [29,30]. An increment borer is a tool used to drill holes into the tree’s internal tissue to collect samples for inspection, but this can cause damage to the sampled tree [30]. On the other hand, wood drilling resistance devices can only assess areas in the line of insertion of the drill, and thus cannot provide a comprehensive evaluation of damage. However, these conventional methods may not be well-suited for detecting internal damage caused by wood-boring insects, particularly cerambycid beetles, that create multiple galleries in various directions. Sonic tomography (hereinafter abbreviated as ST) has recently emerged as a non-destructive method for assessing the internal condition of trees. This technique measures the speed of sound waves transmitted within the woody tissue to identify features such as decay and hollow spaces [31,32,33,34,35]. While ST has primarily been used for diagnosing decay and the health state of trees, no studies have investigated its potential applicability for detecting injuries caused by wood-boring insects.
Therefore, this study was conducted to explore the internal damage status of roadside trees, specifically, P. × yedoensis infested with A. bungii and Quercus palustris infested with M. raddei, in urban landscapes using non-invasive ST imaging. Additionally, we analyzed the correlation between external signs of infestation caused by cerambycid beetles and the extent of interior damage based on ST.
2. Materials and Methods
2.1. Study Areas and Tree Species
This study was conducted in three different cities: Chuncheon-si, Wonju–si, and Gapyeong-gun in the Republic of Korea. The selection of study trees was based on the presence of evidence of infestation by cerambycid beetles in P. × yedoensis and Q. palustris, respectively. In Korea, P. × yedoensis is a native species and is abundant in both urban and rural landscapes, while Q. palustris is an introduced species from North America that has shown a rapid increase in prevalence as roadside and ornamental trees in recent years. In 2022, P. × yedoensis accounted for 52% (16,768 trees), 18% (6377 trees), and 25% (8890 trees) in Gapyeong-gun, Chuncheon-si, and Wonju-si, respectively [36,37,38]. Although Q. palustris was not dominant, it was planted at a rate of 1% (601 trees) and 3% (1082 trees) in Chuncheon-si and Wonju-si, respectively [37,38].
Between July 2022 and July 2023, fifty-six P. × yedoensis trees were investigated in the three cities: Chuncheon-si (127.740351° E in longitude; 37.868148° N in latitude), Gapyeong-gun (127.514813° E; 37.814210° N), and Wonju-si (127.944330° E; 37.338455° N). Additionally, 40 Q. palustris trees were investigated in Wonju-si (127.922363° E; 37.333960° N). In total, 96 trees were investigated, all of which were planted as roadside trees in all three cities. The diameter at breast height (DBH, cm) was measured in all investigated trees.
2.2. Visual Investigation for External Part of Trees
In the studied areas, several adult beetles of A. bungii and M. raddei were found in some roadside trees of P. yedoensis and Q. palustris, respectively (Figure 1a,e). For visual investigation, each tree was examined based on external signs of infestation by cerambycid beetles, specifically the number of holes, related to the activity of larvae or adults. In general, most holes infested were concentration below 1.5 m in height of the investigated trees and individual larvae were attacking areas of several square centimeters under the bark. Thus, the number of holes was recorded for each tree from ground level to 1.5 m in height at 0.5 m intervals. Additionally, emergence holes, formed during adult emergence after the conclusion of larval activity, were counted per tree. Due to the low occurrence of emergence holes or the absence of injury in some trees, emergence holes were assessed comprehensively along with entrance holes. The number of injuries was counted in the most severely damaged section out of the three sections at a height of 1.5 m from the base. For example, if the damage was most severe at 40 cm, the number of injuries between 0 and 50 cm was counted. Each tree was visually examined for external signs of infestation by cerambycid beetles. The number of entrance and emergence holes was caused by larvae and adults, respectively. Larval entrance holes were examined associated with the expulsion of frass (Figure 1b,f), indicative of damage likely caused by the most active larvae (Figure 1c,g).
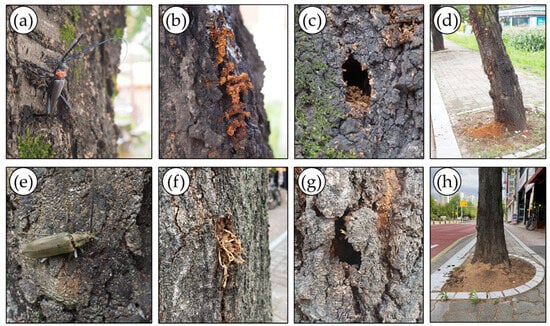
Figure 1.
External characteristics of infestation by two cerambycid beetles. (a) Aromia bungii adult and (b) infestation symptoms of larval frass with woody fibers on the trunk of Prunus × yedoensis; (c) an adult emergence hole and (d) sawdust on the ground. (e) Massicus raddei adult and (f) infestation symptoms of larval frass with woody fibers on the trunk of Quercus palustris; (g) an adult emergence hole and (h) sawdust on the ground.
2.3. Sonic Tomography
To investigate the internal condition of trees and injuries caused by cerambycid beetles, we used the PiCUS® Sonic Tomograph 3 (hereinafter abbreviated as PiCUS3; Argus electronic GmbH, Rostock, Germany). The operating principle of this device involves the generation of a sound at a specific point on the tree trunk or woody part and the measurement of the time it takes for the sound to travel to a receiver placed at another point [39,40]. Each ST scan was sequentially numbered, starting with measurement point #1 placed on the north-facing side of each investigated tree. The height at which ST measurements were taken varied for each tree. In general, it was not feasible to standardize the measurement height due to the large variation in attack heights by cerambycid beetles in the studied trees. Thus, all ST scans in each tree were conducted at different heights where injuries caused by cerambycid beetles were concentrated (Table 1). The tomography-measured heights (TH, cm) and circumference at those heights (CH, cm) for all cross-sections were recorded.

Table 1.
Summary of the characteristics of the investigated trees, such as diameter at breast height (DBH), tomography-measured height (TH), and circumference at tomography-measured height (CH). TH and CH indicate the height at which entrance and emergence holes made by cerambycid beetles were concentrated.
The internal condition of the tree based on ST was analyzed using Q74 ver. 74.02.003.1 software. Based on the speed of the sonic wave, a visual display of the internal condition of the assessed trees was generated using five colors: black and brown indicated solid wood, i.e., non-damaged areas; green indicated areas to be assessed in relation to the overall damage; and violet and blue indicated damaged areas, i.e., hollowed or decayed areas [41]. The ST results were categorized into four levels according to the severity of injury: none (0%); low (1%–20%); moderate (21%–50%); and severe (51%–100%). A total of 96 ST images was acquired: 30 A. bungii-infested P. × yedoensis and 26 non-infested P. × yedoensis; 15 M. raddei-infested Q. palustris and 25 non-infested Q. palustris.
For one infested tree of each tree species, P. × yedoensis in Gapyeong-gun and Q. palustris in Wonju-si, we compared ST and actual cross-sections. In 2022, we obtained ST scans and actual cross-sectional photographs for each P. × yedoensis and Q. palustris. Initially, we measured the ST scan where infestations were concentrated before the tree was cut down by local government tree managers. Subsequently, we took cross-sectional photographs at the same height as that of the ST scan. However, we confirmed some differences between the ST results and the actual cross-section, particularly in P. × yedoensis, which were presumed to be due to height differences and sensor placements. In April 2024, we acquired an additional ST scan and an actual cross-sectional photograph of P. × yedoensis in Gapyeong-gun that was also damaged by A. bungii. Therefore, unlike other ST scan results, the additional ST scan result for P. × yedoensis obtained in 2024 was excluded in the data analyses.
2.4. Data Analysis
The non-solid wood areas were considered as the basis for calculating internal injury rates. The correlation between visual investigation (i.e., the number of entrance and emergence holes) and ST findings (i.e., the rate of damaged area) was assessed by calculating Spearman’s correlation coefficient. Due to the low number or absence of adult emergence holes in the measured trees, these holes were combined with larval entrance holes for the correlation analysis.
The proportion of internal damaged area based on ST results was categorized into five severity classes according to the number of holes (entrance and emergence holes) identified during the visual investigation. The number of holes—entrance, emergence, and both—identified during the visual investigation was converted into natural logarithms (LNs) to classify damage levels incrementally by 1 as follows: 0 (normal), 0.1 to 1.0 (low), 1.1 to 2.0 (moderate), 2.1 to 3.0 (high), and 3.1 to 4.0 (very high).
Principal component analysis (PCA) was performed to explore the relationships among the variables acquired from visual investigation, sonic tomography, and tree characteristics for both Prunus × yedoensis and Quercus palustris. PCA is a dimensionality reduction technique that transforms the original variables into a set of uncorrelated principal components (PCs) while preserving the maximum amount of variance in the data. Due to the small sample sizes in the low and very high severity classes, some groups were combined for the PCA, resulting in three severity classes: N–L (normal to low), M (moderate), and H–VH (high to very high).
Due to the non-normal distribution of variables, an independent sample Wilcoxon test was used to assess differences in the internal condition of trees based on the presence or absence of infestation caused by cerambycid beetles.
All statistical analyses were conducted using the program R, ver. 4.3.1 [42]. The normality of distribution of variables was assessed using the ‘shapiro.test’ function and non-parametric comparative analysis was conducted using the ‘wilcox.test’ function. Correlation analysis was performed using the ‘cor.test’ function. PCA was conducted using the ‘prcomp’ function and the PCA biplot was drawn using the ‘ggbiplot’ function in the ‘ggbiplot’ package. For correlation coefficients between variables and principal components, we acquired coordinates of individual trees using the ‘get_pca_ind’ function in the ‘factoextra’ package, and then correlation coefficients with probability were calculated using the ‘rcorr(as.matrix)’ function in the ‘Hmisc’ package.
3. Results
3.1. Infestation Characteristics
The external characteristics of A. bungii-infested P. × yedoensis and M. raddei-infested Q. palustris exhibited similar patterns. The average number (± standard deviation) of larval entrance holes in all samples was 8.5 (±5.8, n = 30), while adult emergence holes were observed only in five trees with relatively lower numbers (2.0 ± 2.5, n = 5). In Q. palustris, the average number of entrance and emergence holes was 7.5 (±4.4, n = 15) and 1.4 (±2.1, n = 5), respectively.
3.2. Relationship between Visual Investigations and ST
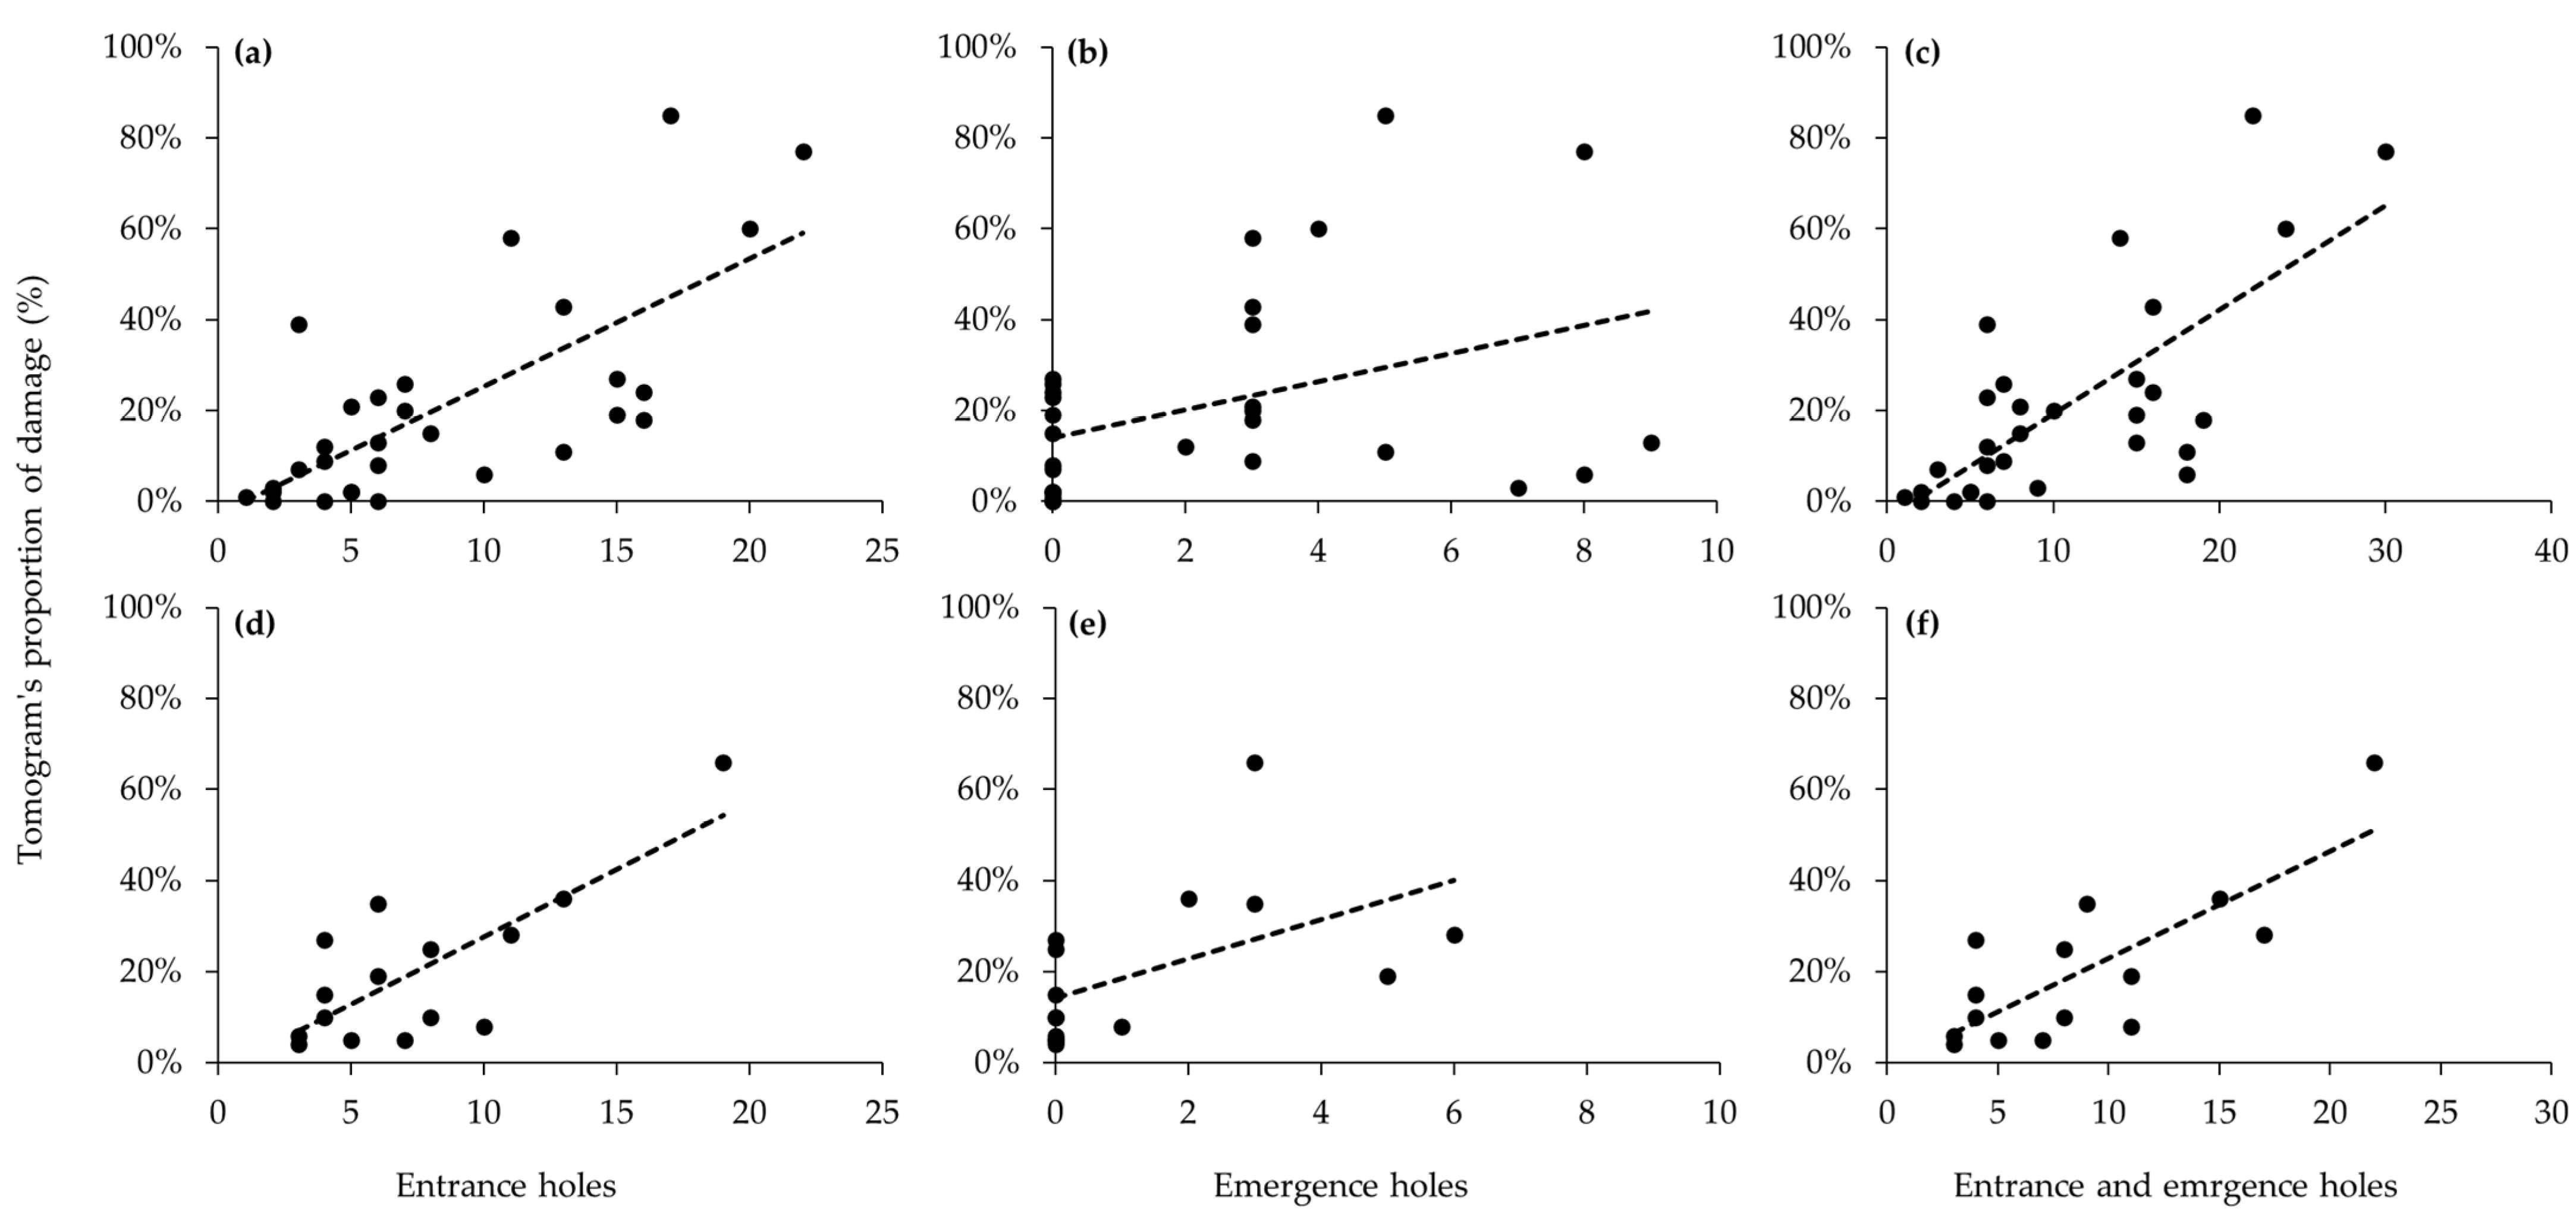
For both tree species, moderate positive correlations were observed between visual investigations and internal injury rates based on ST results (Figure 2). For larval entrance holes, correlation coefficients were significantly positively correlated with internal injury rates (P. × yedoensis, r = 0.70, p < 0.001; Q. palustris, r = 0.58, p = 0.022) (Figure 2a,d). Similarly, adult emergence holes showed positive correlations in both tree species, although correlation coefficients were somewhat decreased (P. × yedoensis, r = 0.40, p = 0.02; Q. palustris, r = 0.65, p = 0.009) (Figure 2b,e). Both infested tree species, total infestation, combining larval entrance holes and adult emergence holes, was exhibited higher in positive correlation coefficients with internal injury rates (P. × yedoensis, r = 0.70, p < 0.001; Q. palustris, r = 0.68, p = 0.005) (Figure 2c,f).
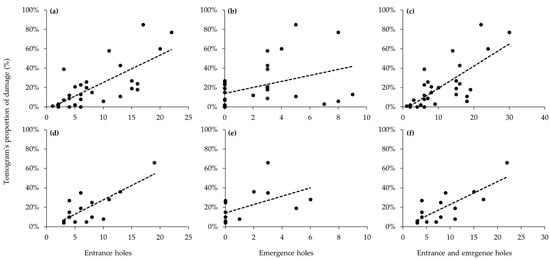
Figure 2.
Correlations between the number of holes based on visual investigation and the damage rates based on sonic tomography: (a–c) measurement of Prunus × yedoensis infested by Aromia bungii; (d–f) measurement of Quercus palustris infested by Massicus raddei. (a,d) number of entrance holes against damage rates; (b,e) number of emergence holes against damage rates; and (c,f) number of entrance and emergence holes against damage rates. Dashed lines indicate linear regression lines.
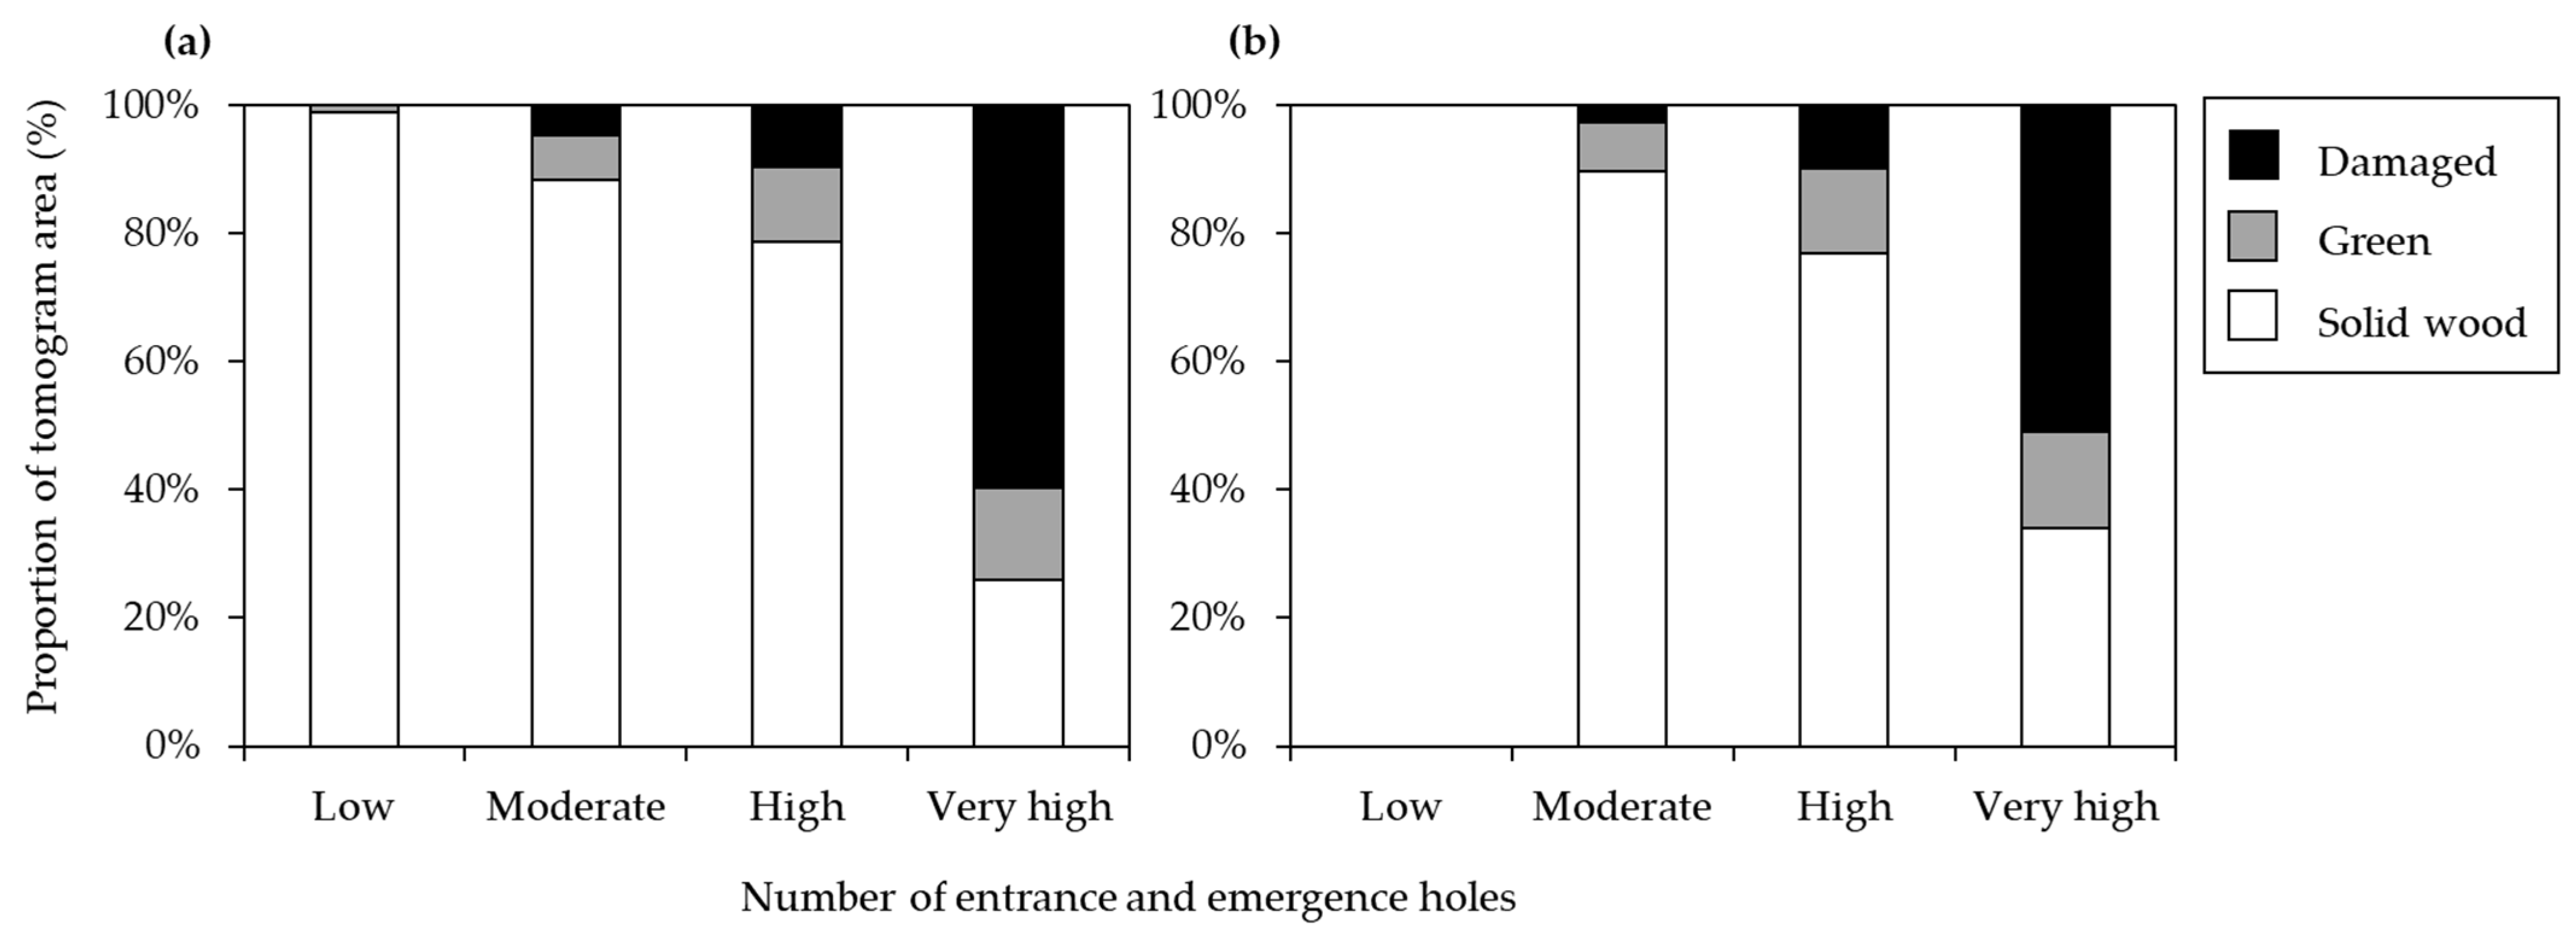
As a result of visual investigation, both P. × yedoensis and Q. palustris showed similar patterns in terms of their internal state ratios. The more the number of holes increased, the more the ratio of internal damage also increased. Particularly in the damage grade of level 4, the solid wood area decreased to less than 50%, and the damaged area increased (Figure 3).
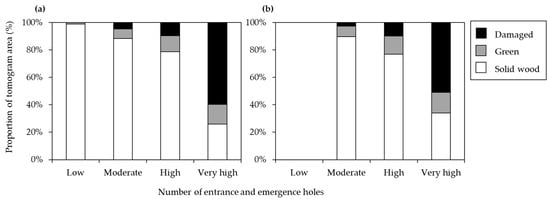
Figure 3.
The proportion of tomogram areas in three categories (solid wood, green, and damaged) in relation to the number of entrance and emergence holes caused by cerambycid beetle larvae in (a) Prunus × yedoensis (n = 30) and (b) Quercus palustris (n = 15). Damage level categories based on the natural logarithm-transformed number of holes are as follows: low (0.1 to 1.0), moderate (1.1 to 2.0), high (2.1 to 3.0), and very high (3.1 to 4.0).
The principal component analysis (PCA) revealed that the eigenvalue (proportion of variance) of PC1 for P. × yedoensis PC1 was 4.580 (57.2%), followed by PC2 (eigenvalue 1.490, proportion of variance 18.6%), PC3 (eigenvalue 0.720, proportion of variance 9%), and PC4 (eigenvalue 0.641, proportion of variance 8%) (Table 2). For Q. palustris, the eigenvalue of PC1 was 4.752 with a proportion of variance of 59.4%, followed by PC2 (eigenvalue 1.109, proportion of variance 13.9%), PC3 (eigenvalue 0.901, proportion of variance 11.3%), and PC4 (eigenvalue 0.535, proportion of variance 6.7%) (Table 3). For both species, more than 70% of the total variance was explained by PC1 and PC2.
Table 2.
A result of PCA for Prunus × yedoensis showing eigenvalues, proportion of variance, and variable loadings for the first four principal components (PC1 to PC4) and correlation coefficients between variables, i.e., visual investigation, sonic tomography, and tree characteristics, and first four principal components (PC1 to PC4). Asterisks indicate statistical significance of correlations: * p < 0.05, ** p < 0.01, *** p < 0.001.
Table 3.
A result of PCA for Quercus palustris showing eigenvalues, proportion of variance, and variable loadings for the first four principal components (PC1 to PC4) and correlation coefficients between variables, i.e., visual investigation, sonic tomography, and tree characteristics, and first four principal components (PC1 to PC4). Asterisks indicate statistical significance of correlations: ** p < 0.01, *** p < 0.001.
The PCA biplots allowed for visual assessment of the influence of each variable on the principal components and the distribution of individual samples (Figure 4). In P. × yedoensis, some variables were showed strongly negative correlations with principal components: entrance hole (r = −0.90), emergence hole (r = −0.70), entrance and emergence hole (r = −0.94), green (r = −0.72), and damaged rates (r = −0.85) against PC1 (Figure 3a, Table 2). Similarly, some variables for Quercus palustris, such as entrance hole (r = −0.93), emergence hole (r = −0.77), entrance and emergence hole (r = −0.96), green (r = −0.81), and damaged rates (r = −0.85), showed strongly negative correlations with PC1 (Figure 3b, Table 3). Against PC2, tree characteristics for both tree species were positively or negatively correlated at 95 % significant level (Table 2 and Table 3).
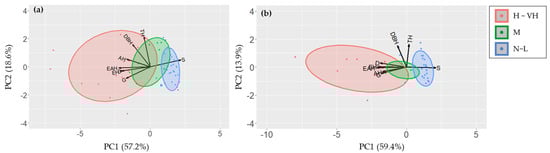
Figure 4.
PCA biplots displaying the first two principal components (PC1 and PC2) for different tree health assessment methods applied to (a) Prunus × yedoensis and (b) Quercus palustris. Arrows represent the loadings of the original variables, i.e., visual investigation, sonic tomography, and tree data, on the principal components, while points represent individual trees, colored by their damage levels. The damage level was basically classified by the LN-transformed number of holes, such as 0 (normal), 0.1 to 1.0 (low), 1.1 to 2.0 (moderate), 2.1 to 3.0 (high), and 3.1 to 4.0 (very high), but three groups, i.e., N-L (normal-low), M (moderate), and H-VH (high-very high), were represented in biplot because number of trees for normal and very high groups were too low to represent. Abbreviations: EH—larval entrance holes; AH—adult emergence holes; EAH—entrance and emergence holes; S—solid wood; G—green; D—damaged; DBH—diameter at breath height; TH—tree height.
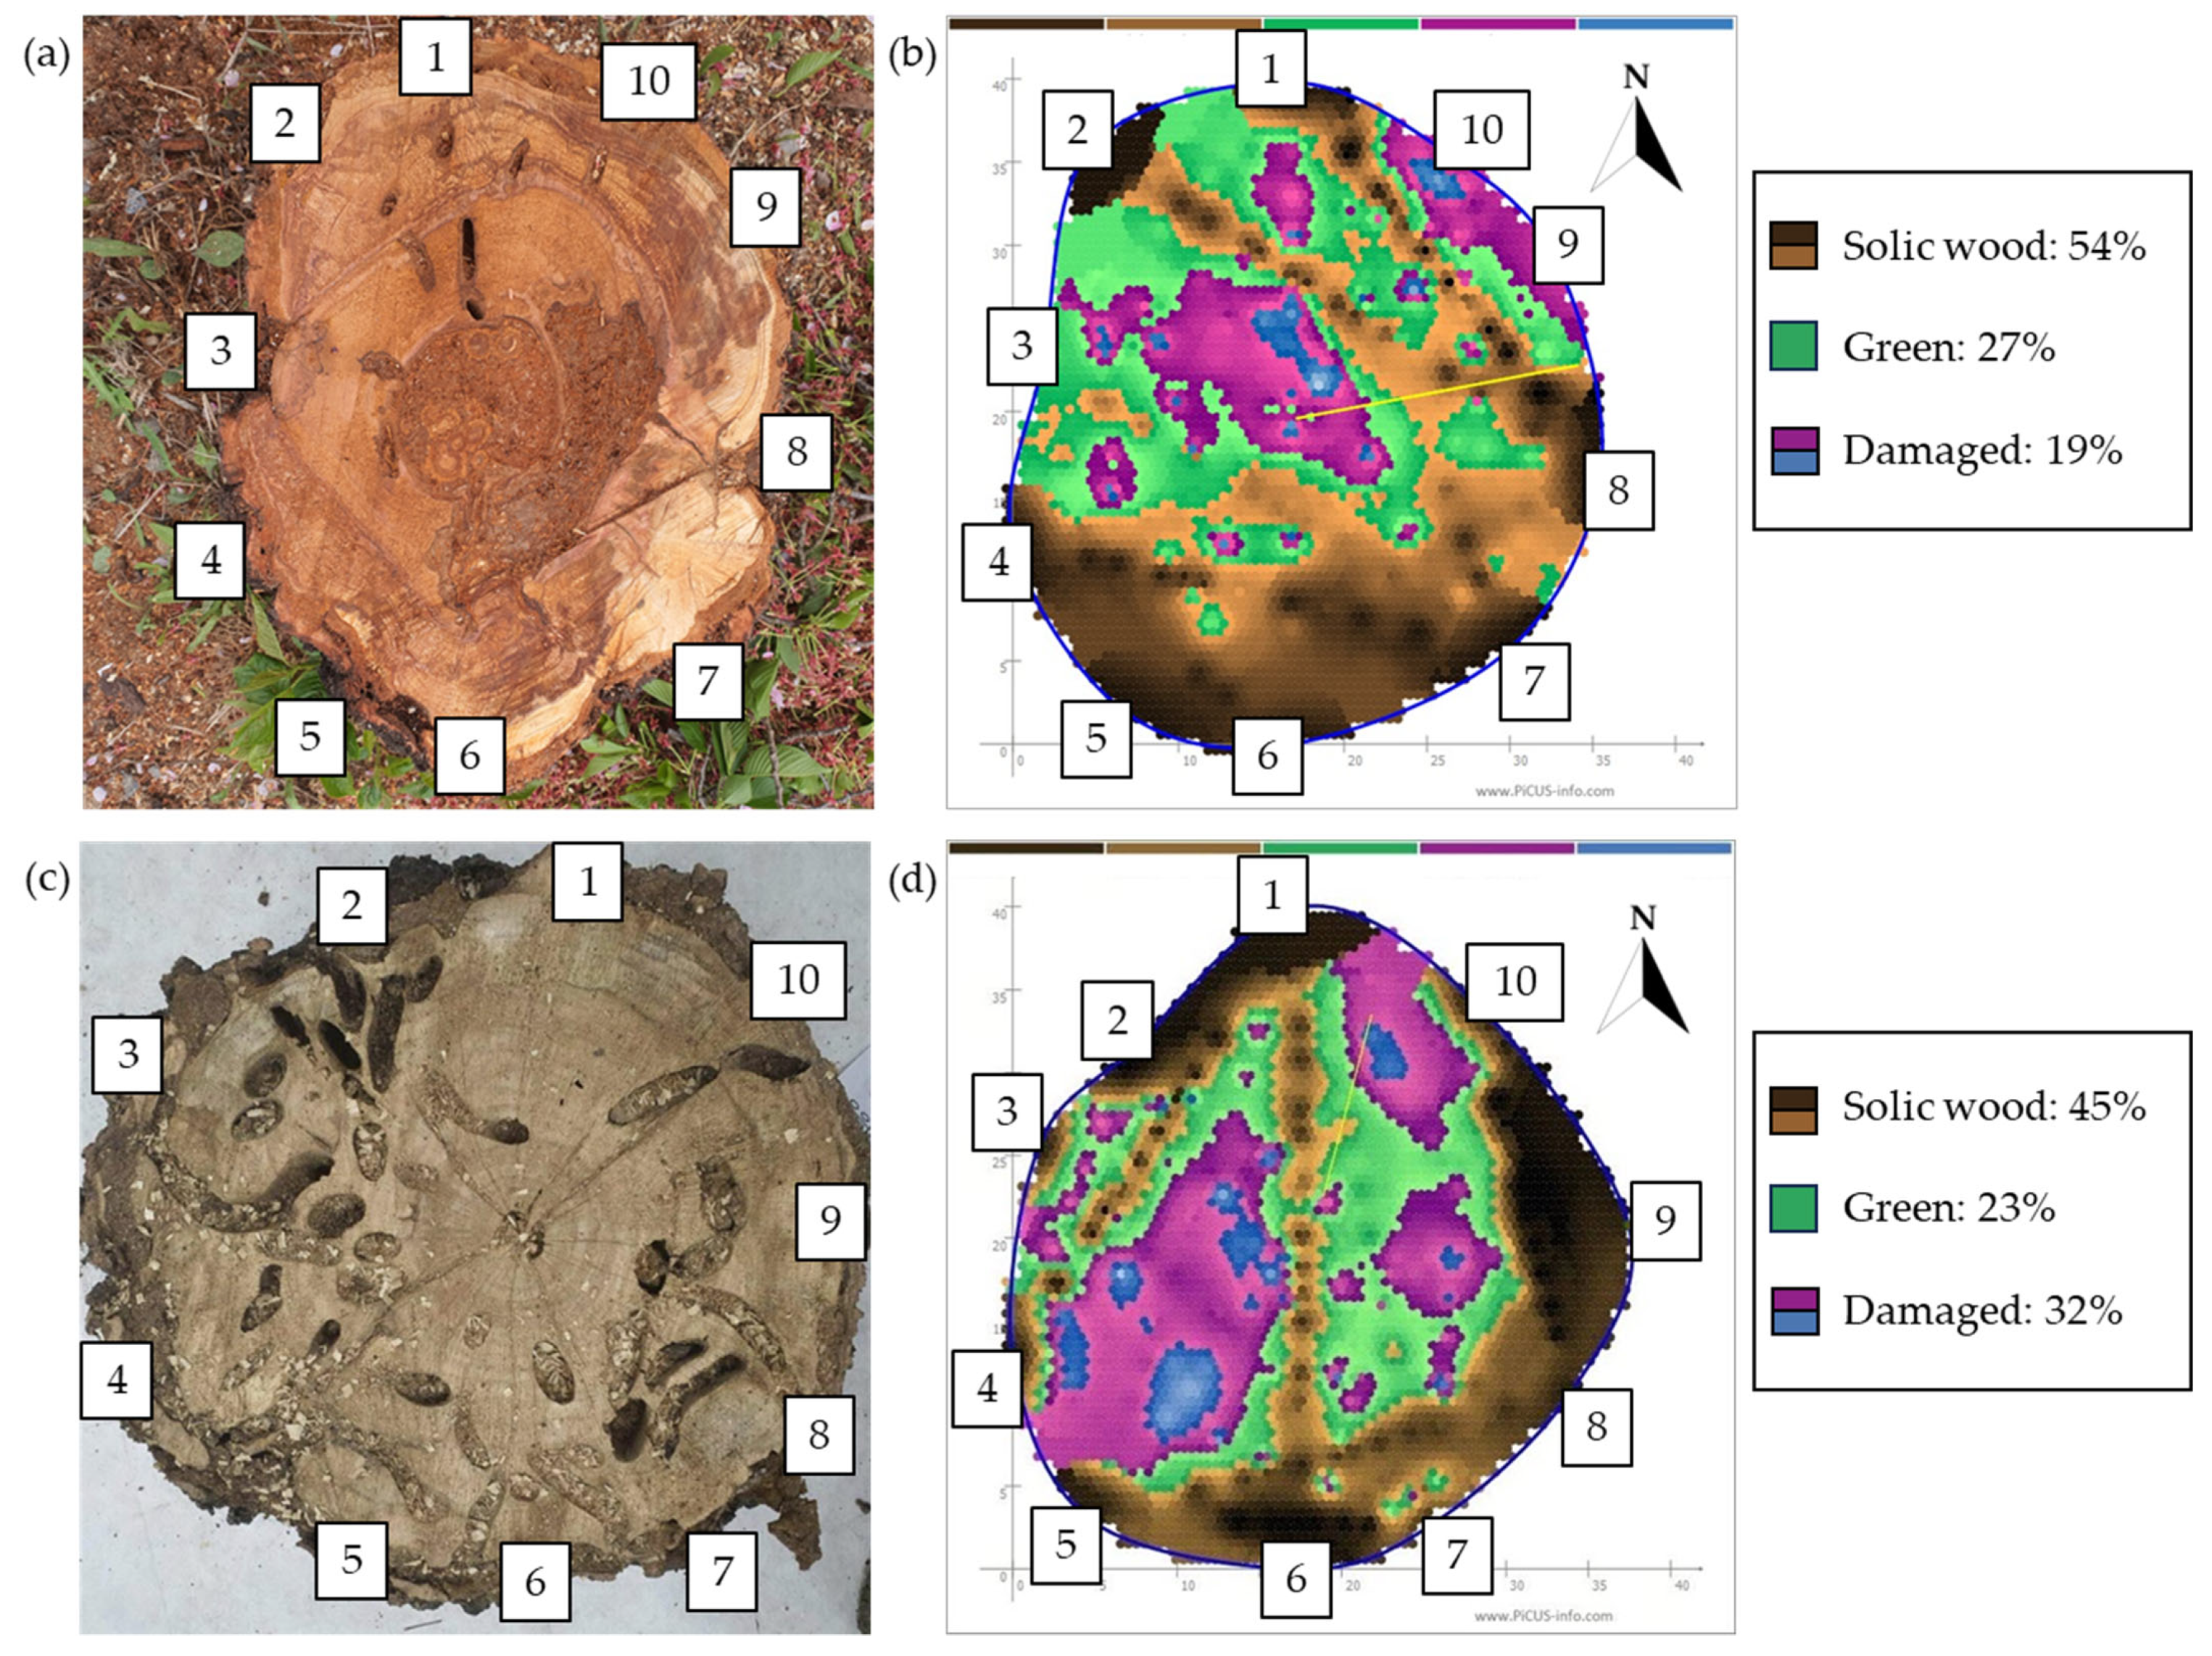
Tomograms of individual trees from each species facilitated the detection of borer galleries, suggesting their potential to accurately depict cross-sectional conditions (Figure 5). A single gallery caused by cerambycid larvae appeared as a green area in the tomograms due to their higher sound velocity compared to healthy tissue. Clustering of multiple galleries expanded the affected area, resulting in blue or violet colors on the tomograms. However, tomograms depicting internal injuries (Figure 5b,d) tended to overestimate the extent compared to cross-sectional images without defects (Figure 5a,c).

Figure 5.
Comparison of the sonic tomograms and the cross-sections of dead trees. (a) Dead P. × yedoensis infested by Aromia bungii and (b) its sonic tomogram; (c) dead Q. palustris infested by M. raddei and (d) its sonic tomogram. The numbers indicate the position of the sensor, with #1 facing north. Different colors indicate wood decay severities: black and brown indicate solid wood (non-damaged areas); green is assessed in relation to the overall damage; and violet and blue indicate damaged areas (hollowed or decayed areas).
3.3. Comparison of Tomograms between Infested and Non-Infested Trees
The internal injured area based on tomograms was significantly higher in infested trees compared to non-infested trees (P. × yedoensis, w = 610, p < 0.001; Q. palustris, w = 357, p < 0.001). Among the thirty P. × yedoensis trees infested by A. bungii, most infested trees showed low severity levels, although some trees were highly injured (Figure 6 and Figure A3). Three trees infested by A. bungii exhibited obvious external symptoms of infestation, but internal injury rates were not observed (Figure A3b). Similarly, among the fifteen Q. palustris trees infested by M. raddei, most trees showed low severity levels, while some trees were highly injured, exhibiting external signs such as sawdust-like woody fibers with larval frass on the ground (Figure 7 and Figure A4).

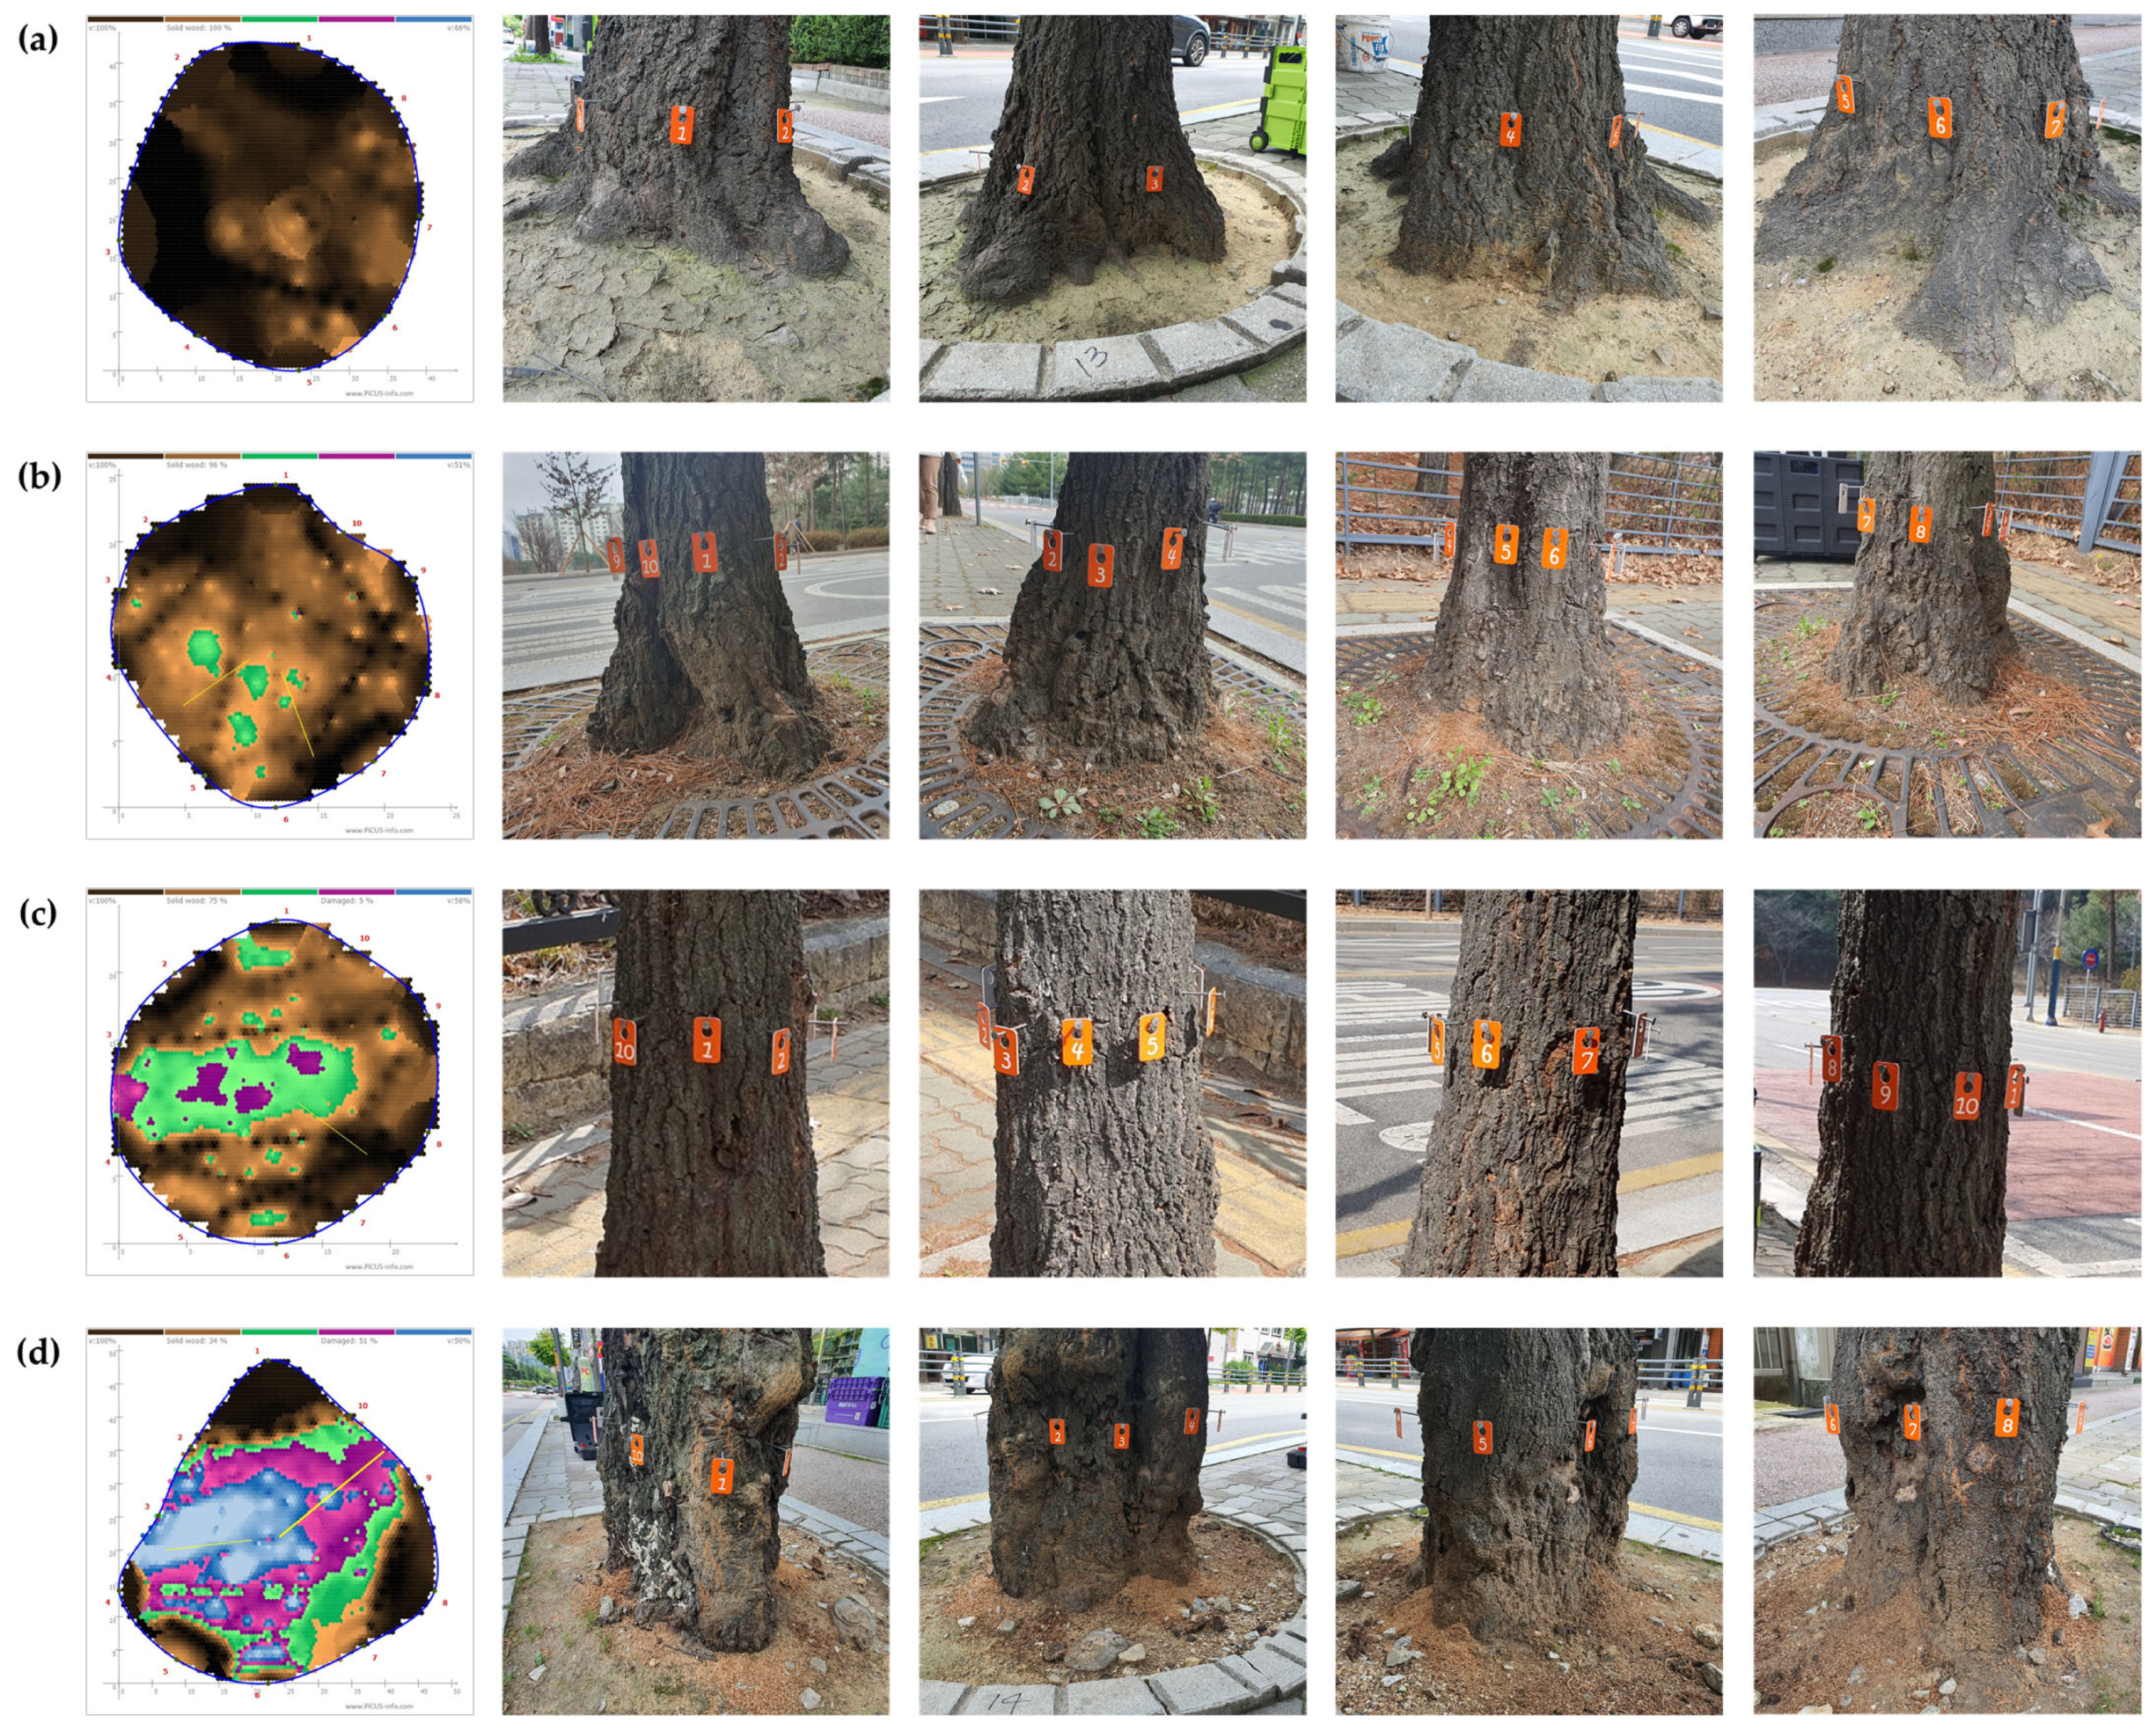
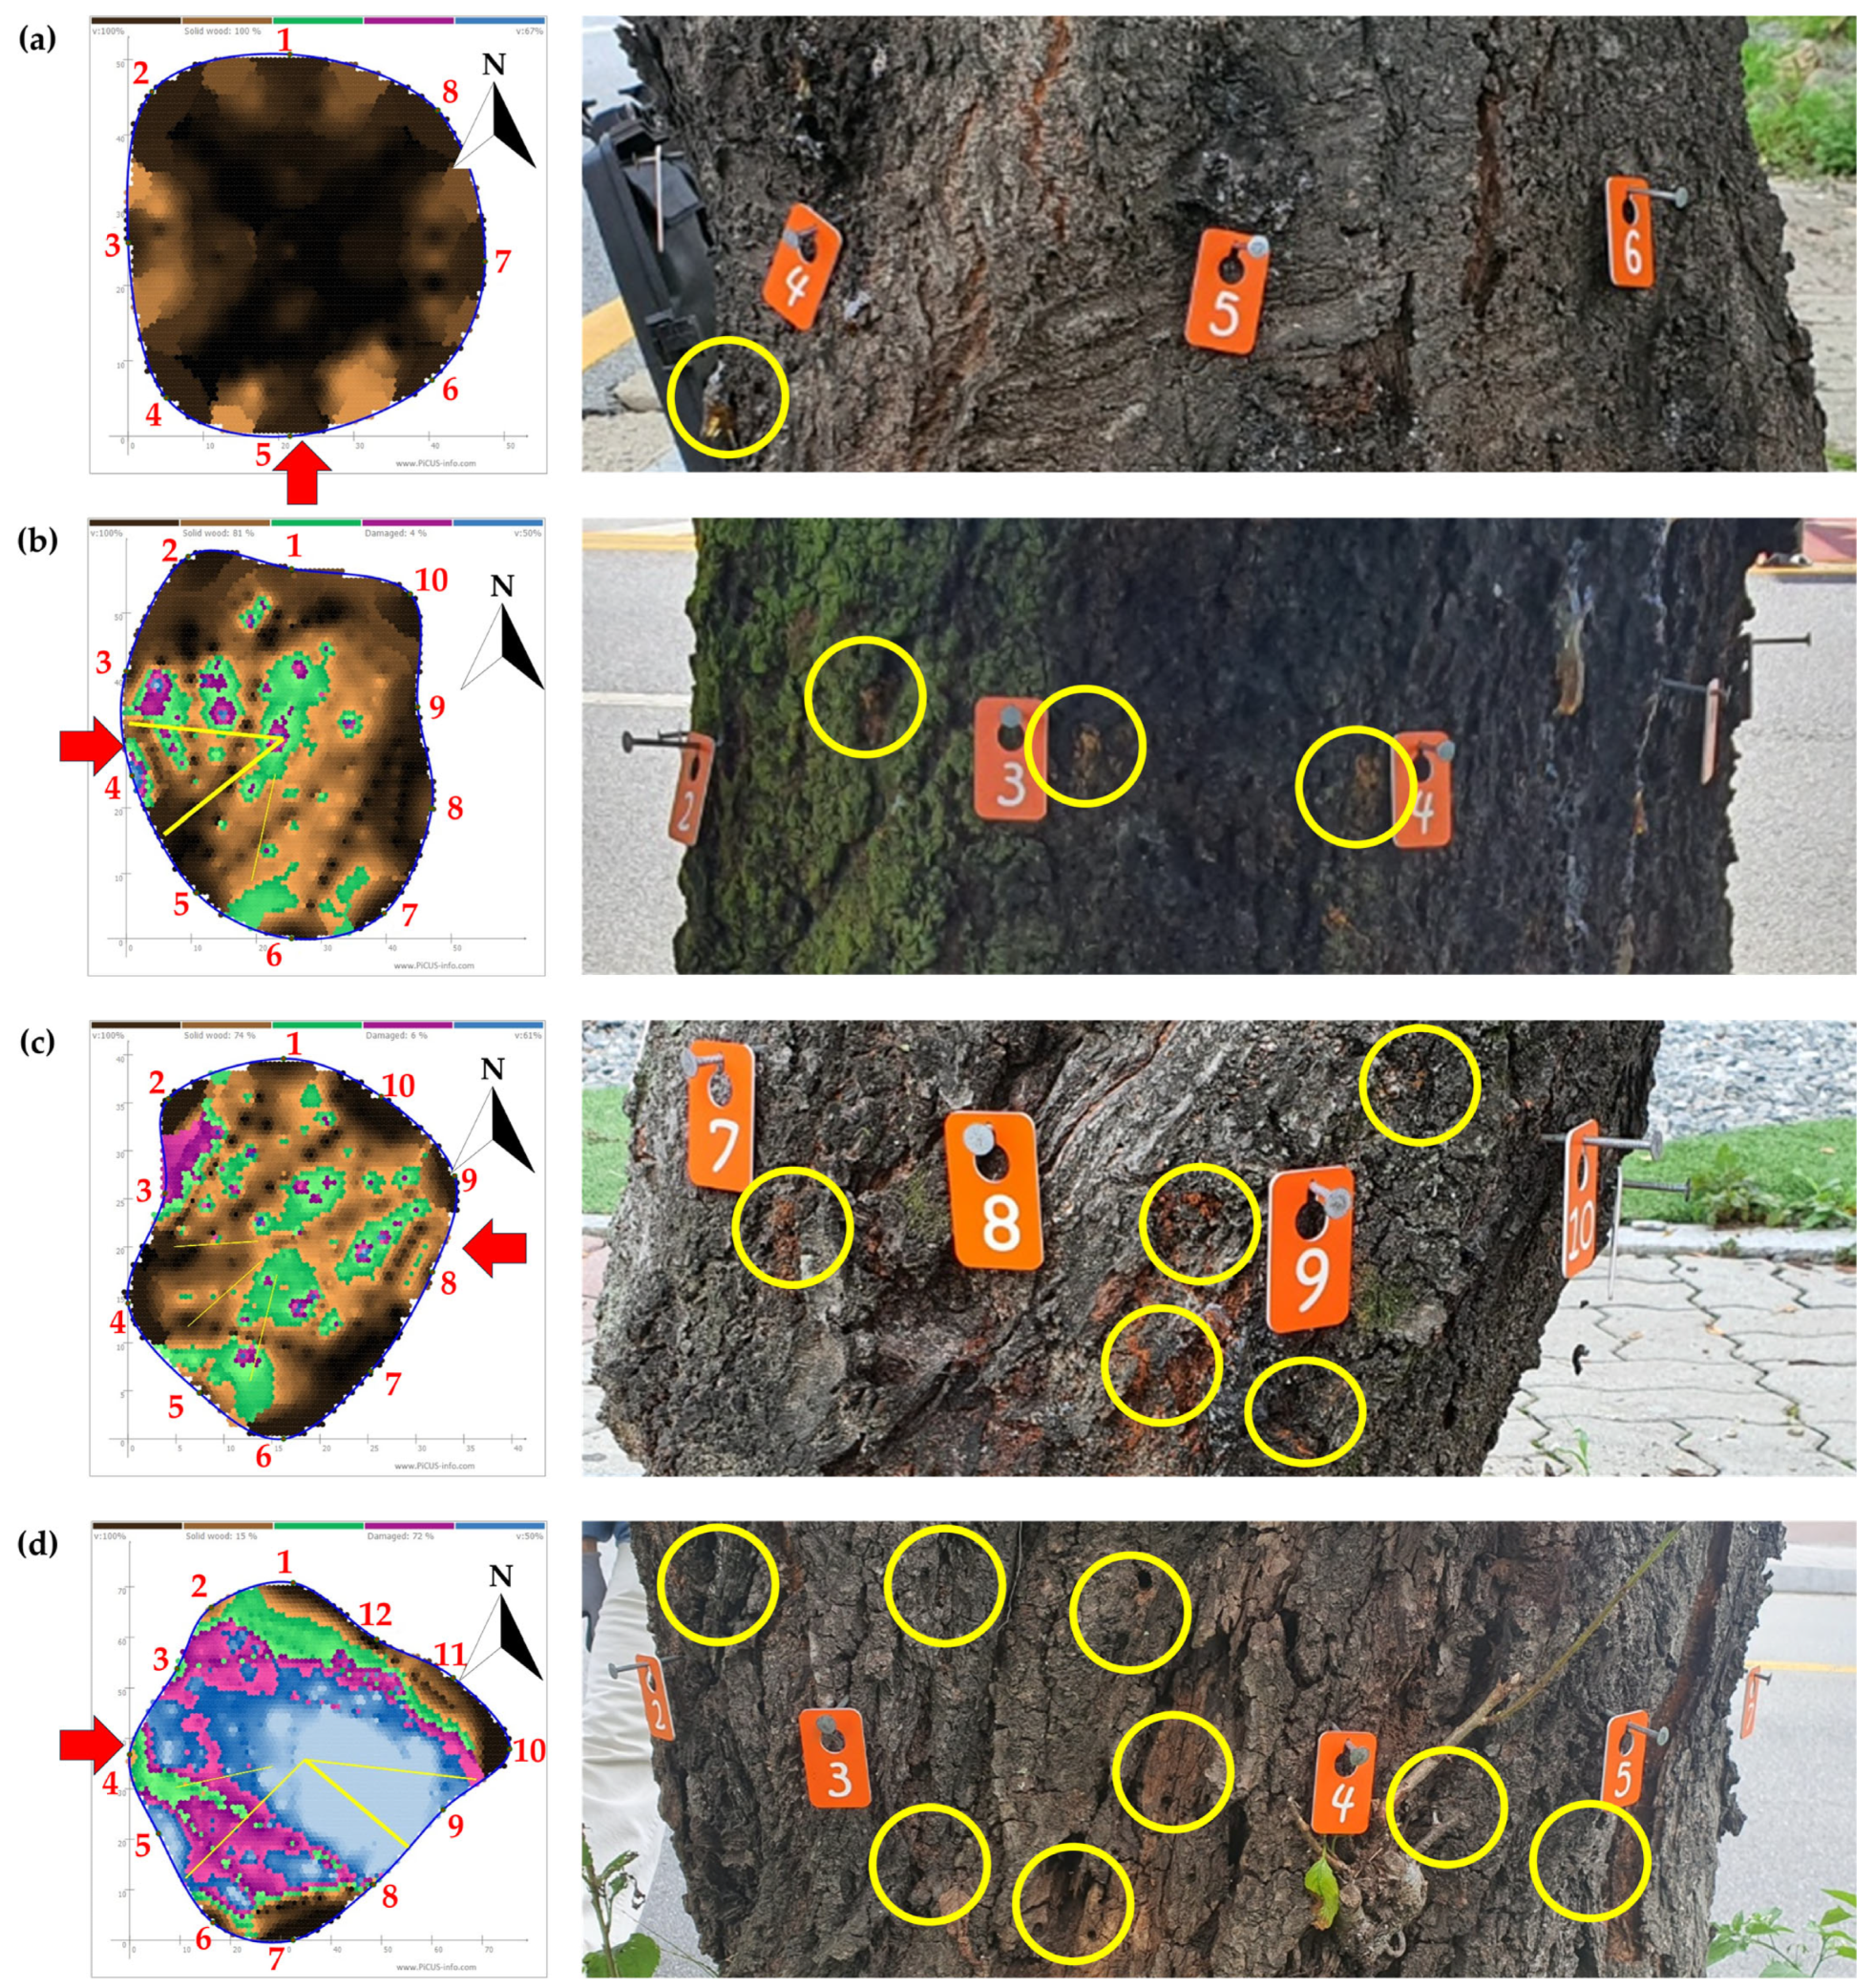
Figure 6.
Representative examples of tomography of measured Prunus × yedoensis trees (left panel) with visual images of the area indicated by the red arrow (right panels). Yellow circles on the right panels indicate entrance or emergence holes caused by Aromia bungii: (a) weakly infested but 0% in injury rates in tomogram; (b) moderately infested and 19% in injury rate in tomogram; (c) severely infested and 26% in injury rate in tomogram; (d) severely infested in the past and 85% in injury rate in tomogram. The red numbers in left panels indicate the positions of sensors. Different colors indicate wood decay severities: black and brown indicate solid wood (non-damaged areas); green is assessed in relation to the overall damage; and violet and blue indicate damaged areas (hollowed or decayed areas). To see all four directions of the photographs, refer to Figure A3.
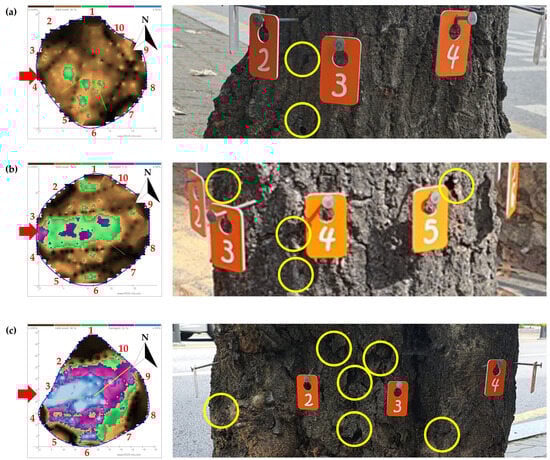
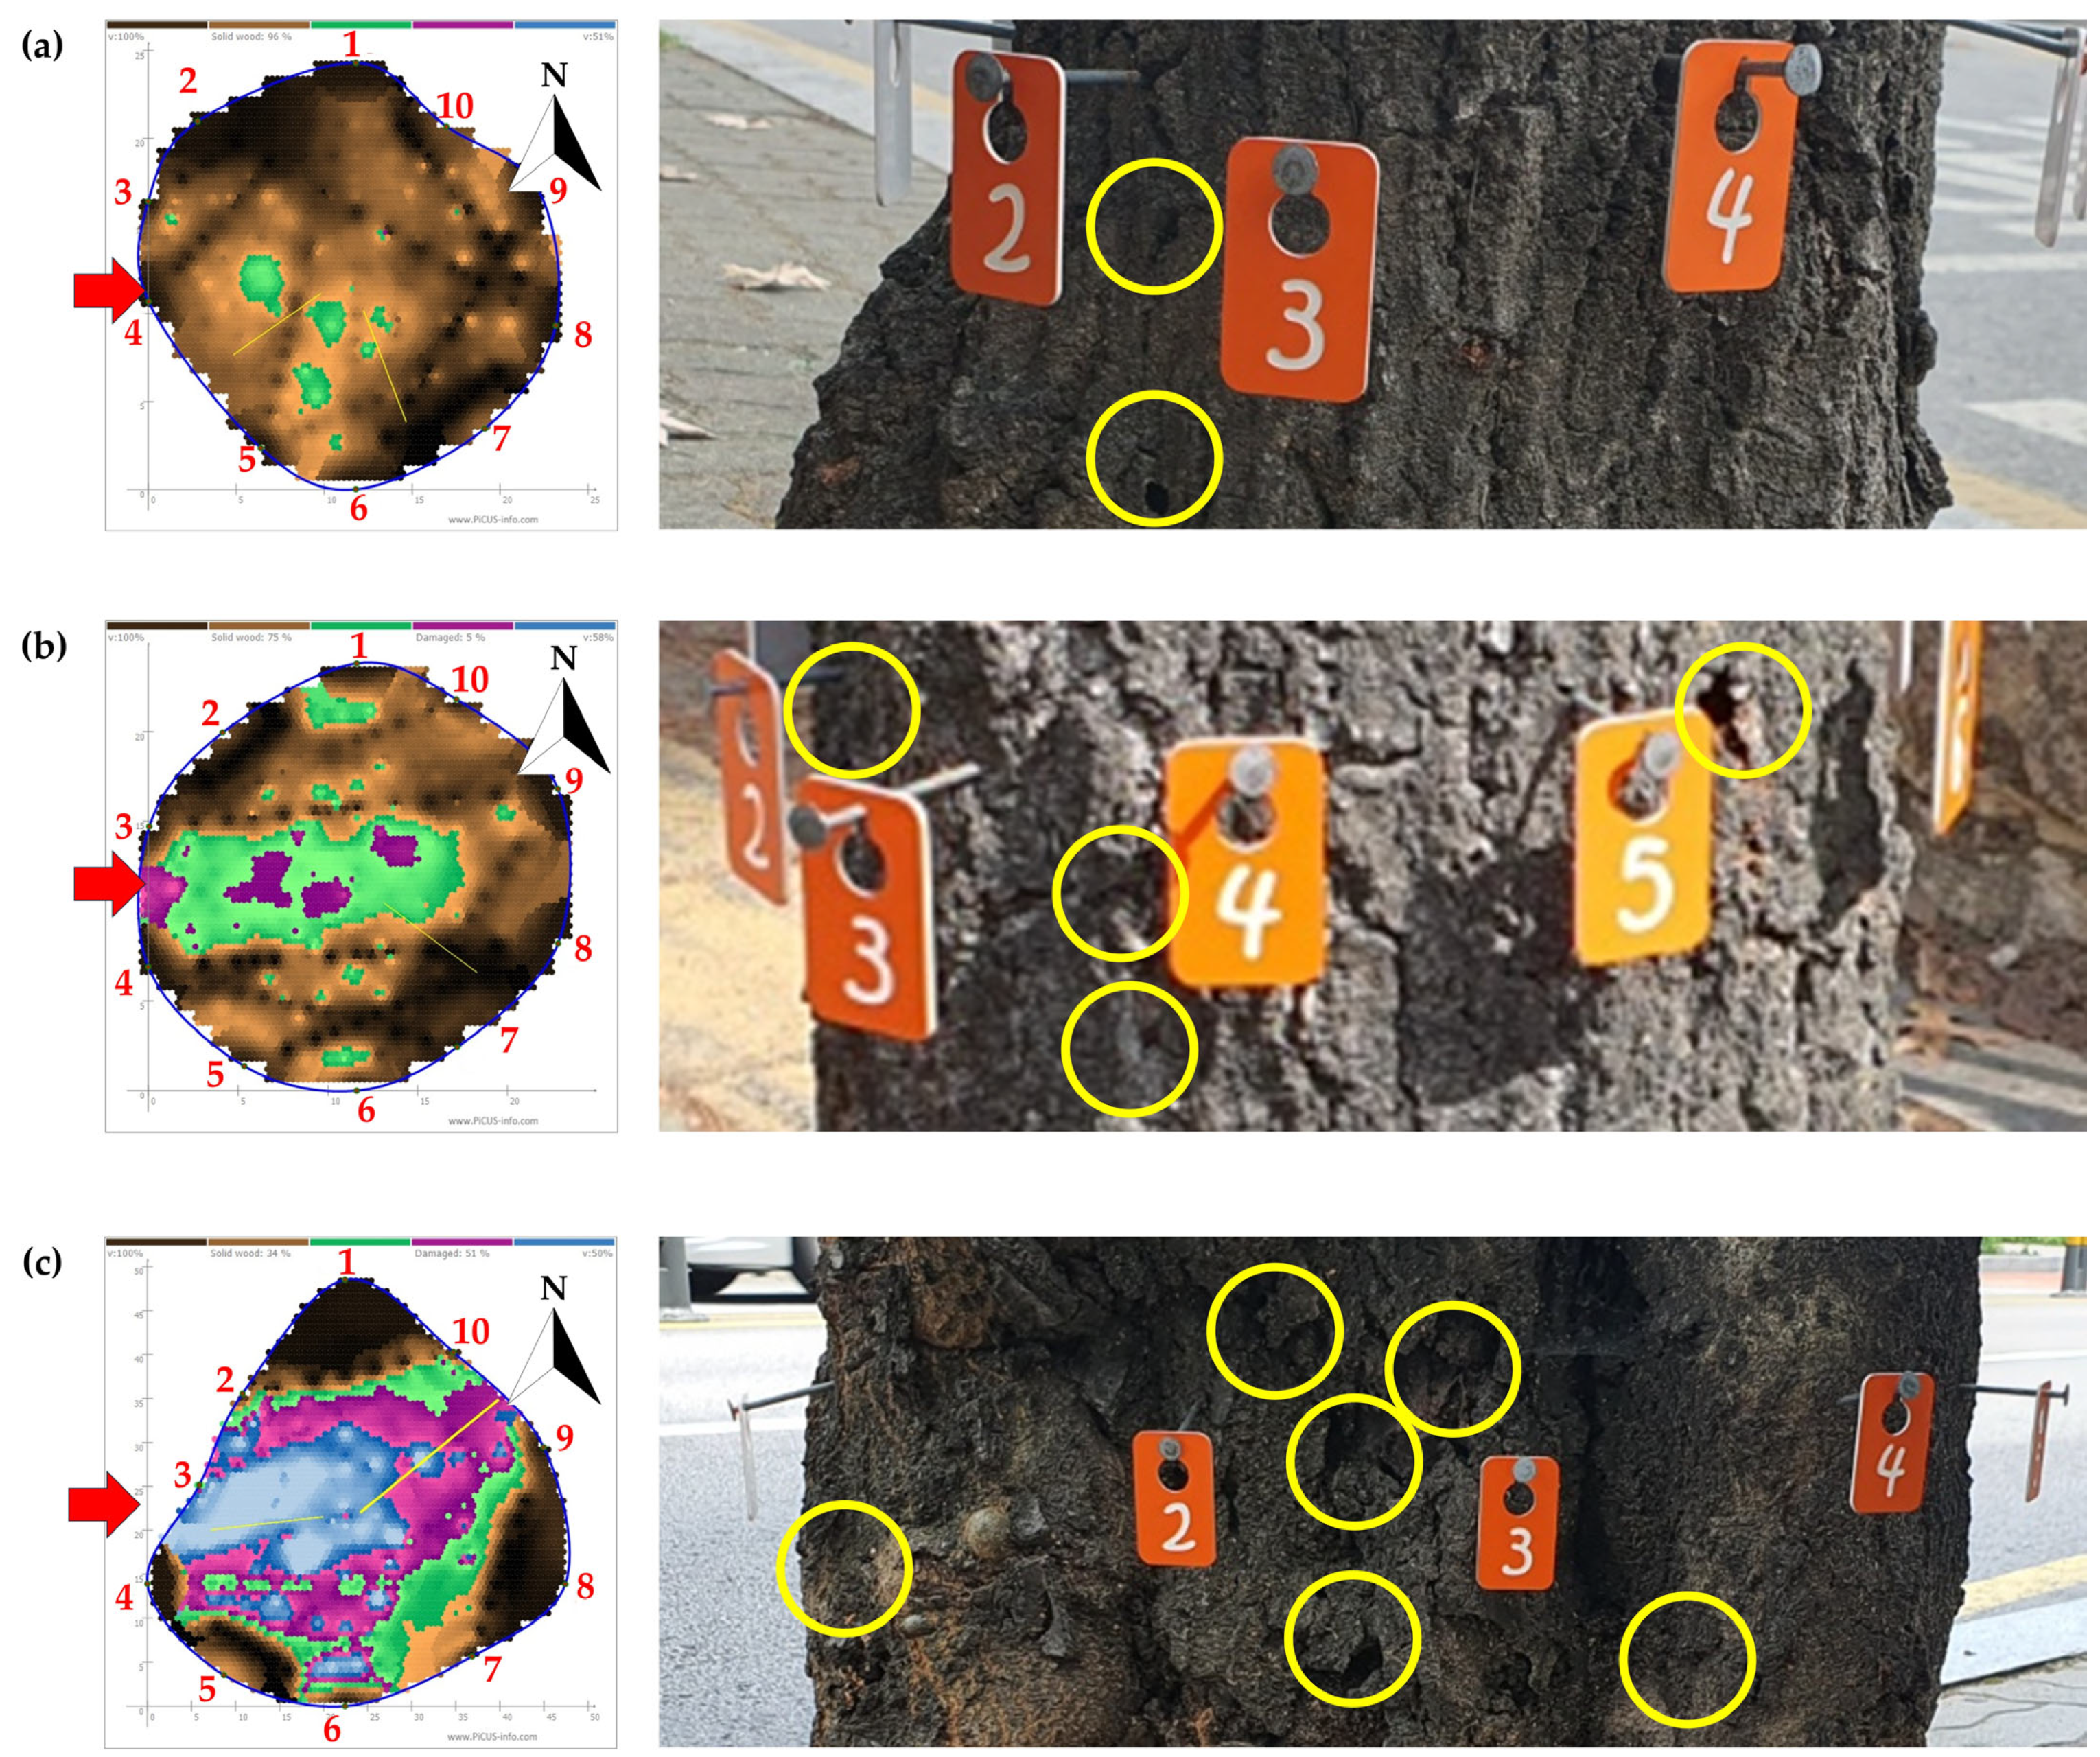
Figure 7.
Representative examples of tomography of measured Quercus palustris tree (left panel) with visual images of the area indicated by the red arrow (right panels). Yellow circles on the right panels indicate entrance or emergence holes caused by Massicus raddei: (a) weakly infested and 4% in injury rates in tomogram; (b) moderately infested and 25% in injury rate in tomogram; and (c) severely infested and 66% in injury rate in tomogram. The red numbers in left panels indicate the positions of sensors. Different colors indicate wood decay severities: black and brown indicate solid wood (non-damaged areas); green is assessed in relation to the overall damage; and violet and blue indicate damaged areas (hollowed or decayed areas). To see all four directions of the photographs, refer to Figure A4.
4. Discussion
4.1. Usefulness of ST in Diagnosing Wood Decay in Borer-Infested Trees
To the best of our knowledge, this study is the first to use ST to report that trees infested by cerambycid beetles in both P. × yedoensis and Q. palustris exhibit higher internal decay, particularly in trees with accumulated infestations. A moderate positive correlation was observed between the visual inspection, i.e., external signs of infestation by two cerambycid beetle species (A. bungii and M. raddei), and the sonic tomography, which measures internal injury rates. This suggests that these external signs of borer infestation can serve as the severity indicators of internal damage caused by borers. In some trees, however, diagnosing tree health solely based on the number of holes on the tree trunk externally may underestimate the extent of internal infestation rates. In other words, some trees showing high levels of infestation on visual examination did not exhibit severe internal decay. We speculate that this discrepancy between visual examination and internal decay may be partly due to larval development stages. Specifically, young larvae of both cerambycid beetle species may attack the cambium areas of host trees after hatching, whereas more developed larvae drill into sapwood or heartwood areas, causing tree decay. These findings suggest that external symptoms observed in cerambycid beetle-infested trees may not necessarily indicate severe internal woody injuries.
The tomography results for infestation-accumulated trees mimic those caused by wood-decaying fungi [32,33,35,43]. Based on these observations, it is speculated that cerambycid beetle larvae may serve as vectors for wood decay fungi, transporting them from the bark to woody areas. Several borers, such as Anoplophora glabripennis, Glischrochilus quadripunctatus, and Rhizophagus spp., are known vectors of tree pathogenic fungi [44,45,46]. In addition, cerambycid larvae generally consume plant diets that are poor in available nutrients but rich in cellulose, hemicellulose, and lignin. Consequently, transient or symbiotic microorganisms are known for synthesizing many important enzymes to digest in the insect gut systems [47]. Some wood decay fungi associated with these microorganisms in or on bodies of cerambycid larvae could be transported by larval activities, such as feeding and defecation. Considering the ecological characteristics of the two investigated cerambycid beetle species mentioned earlier, larvae of both A. bungii and M. raddei may act as potential vectors of wood decay fungi. After growing for some period, larvae of both species bore into woody parts and repeatedly move between woody parts and bark to extract sawdust-like woody fibers with frass. This process may facilitate the simultaneous invasion of wood decay fungi into the woody parts, gradually inducing the process of decay in addition to physical damage in the woody parts. Therefore, our tomography results in cerambycid beetle-infested trees may be similar with those of decayed trees. However, further research is required for an in-depth characterization of the relationship between internal damage in trees and wood-boring insects, as well as their interactions with wood-decaying fungi.
4.2. Limitation of ST Diagnosing Wood Decay in Borer-Infested Trees
Our results suggest that tree diagnostic equipment using sonic tomography, specifically PiCUS3, can be used for the non-invasive analysis of the internal condition of trees affected by wood-boring insects, although this device has some limitations. Aromia bungii-infested trees in the early stage showed external signs of infestation, but there was no internal injury based on sonic tomographs. This may be attributed to a combination of device limitations and the complex ecological characteristics of cerambycid beetles. Ensuring appropriate placement of sensor and precise measurement of the distance between sensors is crucial for the accuracy of tomography. In fact, capturing the true shape of measured trees largely depends on adequate triangulation based on sensor placement and distance [48]. Moreover, in the case of long-horned beetles, the extent and areas of injury inflicted, as well as the particle size of the sawdust-like woody fibers with frass, may vary depending on the developmental stage of the larvae [20,22,49]. The position of larvae in trees also varies with the developmental stage [18,20,50]. In A. bungii, young larvae in the first year of hatching are under the bark and typically feed on cambiums, while ≥1-year-old larvae bore into woody parts for their overwintering [24]. However, sonic tomographs mainly detect decay in woody parts rather than in bark areas [51]. Therefore, trees showing external symptoms of infestation, especially caused by young larvae, may not have internal injuries. These findings highlighted that there are the limitations in sonic tomography when assessing early-stage infestations. While sonic tomography is valuable for detecting advanced internal damage, as evidenced by the correlation between external holes and internal damage rates in our study, it may not be sensitive enough to identify the initial stage of cerambycid larval activities confined to the bark and cambium layers. For accurate assessment and timely management of wood-boring insect infestations in urban trees, therefore, a comprehensive approach would be needed, combining visual inspection and sonic tomography by considering the life cycle of pests.
The comparison between the trees’ cross-sectional and tomographic images showed similarities, although there were some limitations in obtaining the actual cross-sections of investigated trees that were measured by ST. However, tomographic images did not exactly match the actual cross-sections of the trees. This difference may be attributed to the device characteristics, as the ST findings can vary based on the position of the sensor [46]. Therefore, diagnosing internal injury of a tree caused by borer insects with wood decay fungi using ST equipment would only be possible when the damage has progressed significantly. In the early stages of infestation, diagnosing the extent of damage through external symptoms may be more efficient.
4.3. Importance of Cerambycid Beetles in Urban Trees and Wood Trade Worldwide
In general, many cerambycid beetle species are known to be agricultural and forestry pests, with some species posing significant economic and environmental threats, particularly when they are invasive alien species [52,53]. However, a lot of trees have been planted along roadsides in urban landscapes. Recently, some cerambycid beetle species have become invasive alien pests, such as A. bungii in Japan [14,15,16] and Europe [17,18], A. glabripennis in north America [1], Anoplophora horsfieldii in Korea [54], and so on. Although M. raddei is known to be a native species in Korea [24] and China [8,23], and is sometimes a threat to forestry in native ranges [55], it could also be a potential invasive alien pest of urban landscapes in non-native ranges in future. Because M. raddei is a pest of broadleaved deciduous trees in native ranges, trees in urban landscapes may be under threat. In fact, the planting of Q. palustris has rapidly increased in urban areas of Korea in recent times, and M. raddei-infected trees were newly found in other cities in 2023 [24].
5. Conclusions and Prospects
This study provided valuable new evidence regarding evaluation of the internal status of trees infested by two cerambycid beetle species. Conventional damage detection methods, such as increment borers and wood drilling resistance devices, inevitably cause physical damage to trees similar to that of wood-boring insects. However, ST can potentially be used for non-invasive assessment of internal injuries caused by wood-boring insects, in addition to wood decay and cracks in urban trees. These results suggest that evaluating the internal condition using ST equipment could be beneficial for the management of trees, especially protected, ornamental, and roadside trees. Nonetheless, further research will be necessary, encompassing various host trees for the studied cerambycid beetles, because their infestation characteristics may differ according to host tree species. In fact, A. bungii attacks various trees belonging to genus Prunus, while M. raddei attacks a variety of broadleaved deciduous trees. However, wood decay may depend on the developmental stage of the insects and their host tree condition. The early stage of infestation may not be detected by ST because young cerambycid larvae are too small to impact on tree health. On the other hand, more developed larvae may carry various microorganisms on or in their bodies that affect wood decay. Consequently, more ST sampling of cerambycid-infested trees, considering the developmental stages of the insects and a variety of host tree species, would be helpful to understand the infestation mechanism of these insects in trees.
Author Contributions
Conceptualization, B.-j.L. and J.-k.J.; Data curation, B.-j.L., S.S., Y.P. and J.-k.J.; Formal analysis, B.-j.L., S.S., Y.P. and J.-k.J.; Investigation, B.-j.L., S.S., and J.-k.J.; Methodology, B.-j.L. and J.-k.J.; Resources, J.-k.J.; Supervision, Y.P. and J.-k.J.; Visualization, B.-j.L. and J.-k.J.; Validation, Y.P.; Writing—original draft, B.-j.L., S.S. and J.-k.J.; Writing—review and editing, Y.P. and J.-k.J. All authors have read and agreed to the published version of the manuscript.
Funding
This research was supported by a National Research Foundation of Korea (NRF) grant funded by the Korean government (MSIT) (project no. “2022R1F1A10596811222182102130102”), and a 2023 Research Grant from Kangwon National University and the National Institute of Forest Science (Management of Tree Diagnostic Center, project no. “202306040001”).
Data Availability Statement
Data used in this study can be requested from the corresponding author via email.
Conflicts of Interest
The authors declare no conflicts of interest.
Appendix A
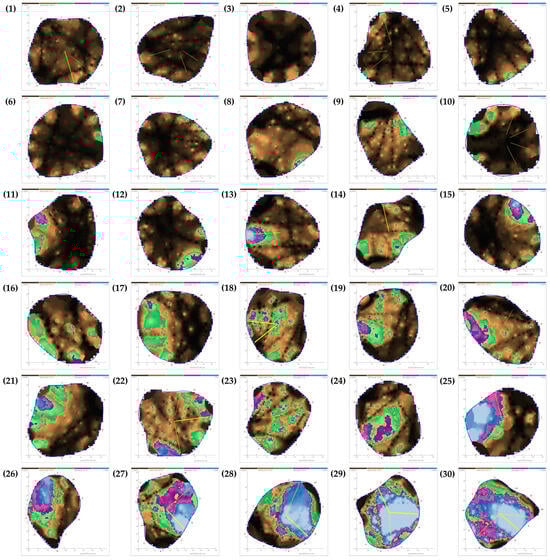
Figure A1.
Results of tomograms of Prunus × yedoensis trees infested by Aromia bungii larvae. The red numbers in the image indicate the positions of the sensors. Different colors indicate wood decay severities: black and brown indicate solid wood (non-damaged areas); green is assessed in relation to the overall damage; and violet and blue indicate damaged areas (hollowed or decayed areas). Numbers in parenthesis indicate individual tree measured sonic tomograms.

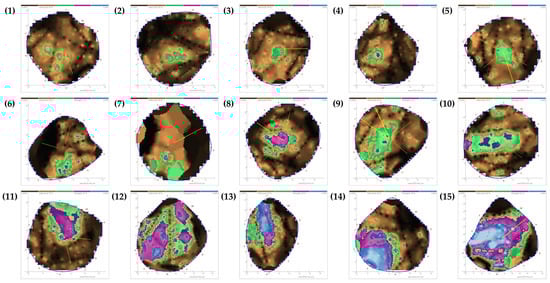
Figure A2.
Results of tomograms of Quercus palustris trees infested by Massicus raddei larvae. The red numbers in the image indicate the positions of the sensors. Different colors indicate wood decay severities: black and brown indicate solid wood (non-damaged areas); green is assessed in relation to the overall damage; and violet and blue indicate damaged areas (hollowed or decayed areas). Numbers in parenthesis indicate individual tree measured sonic tomograms.
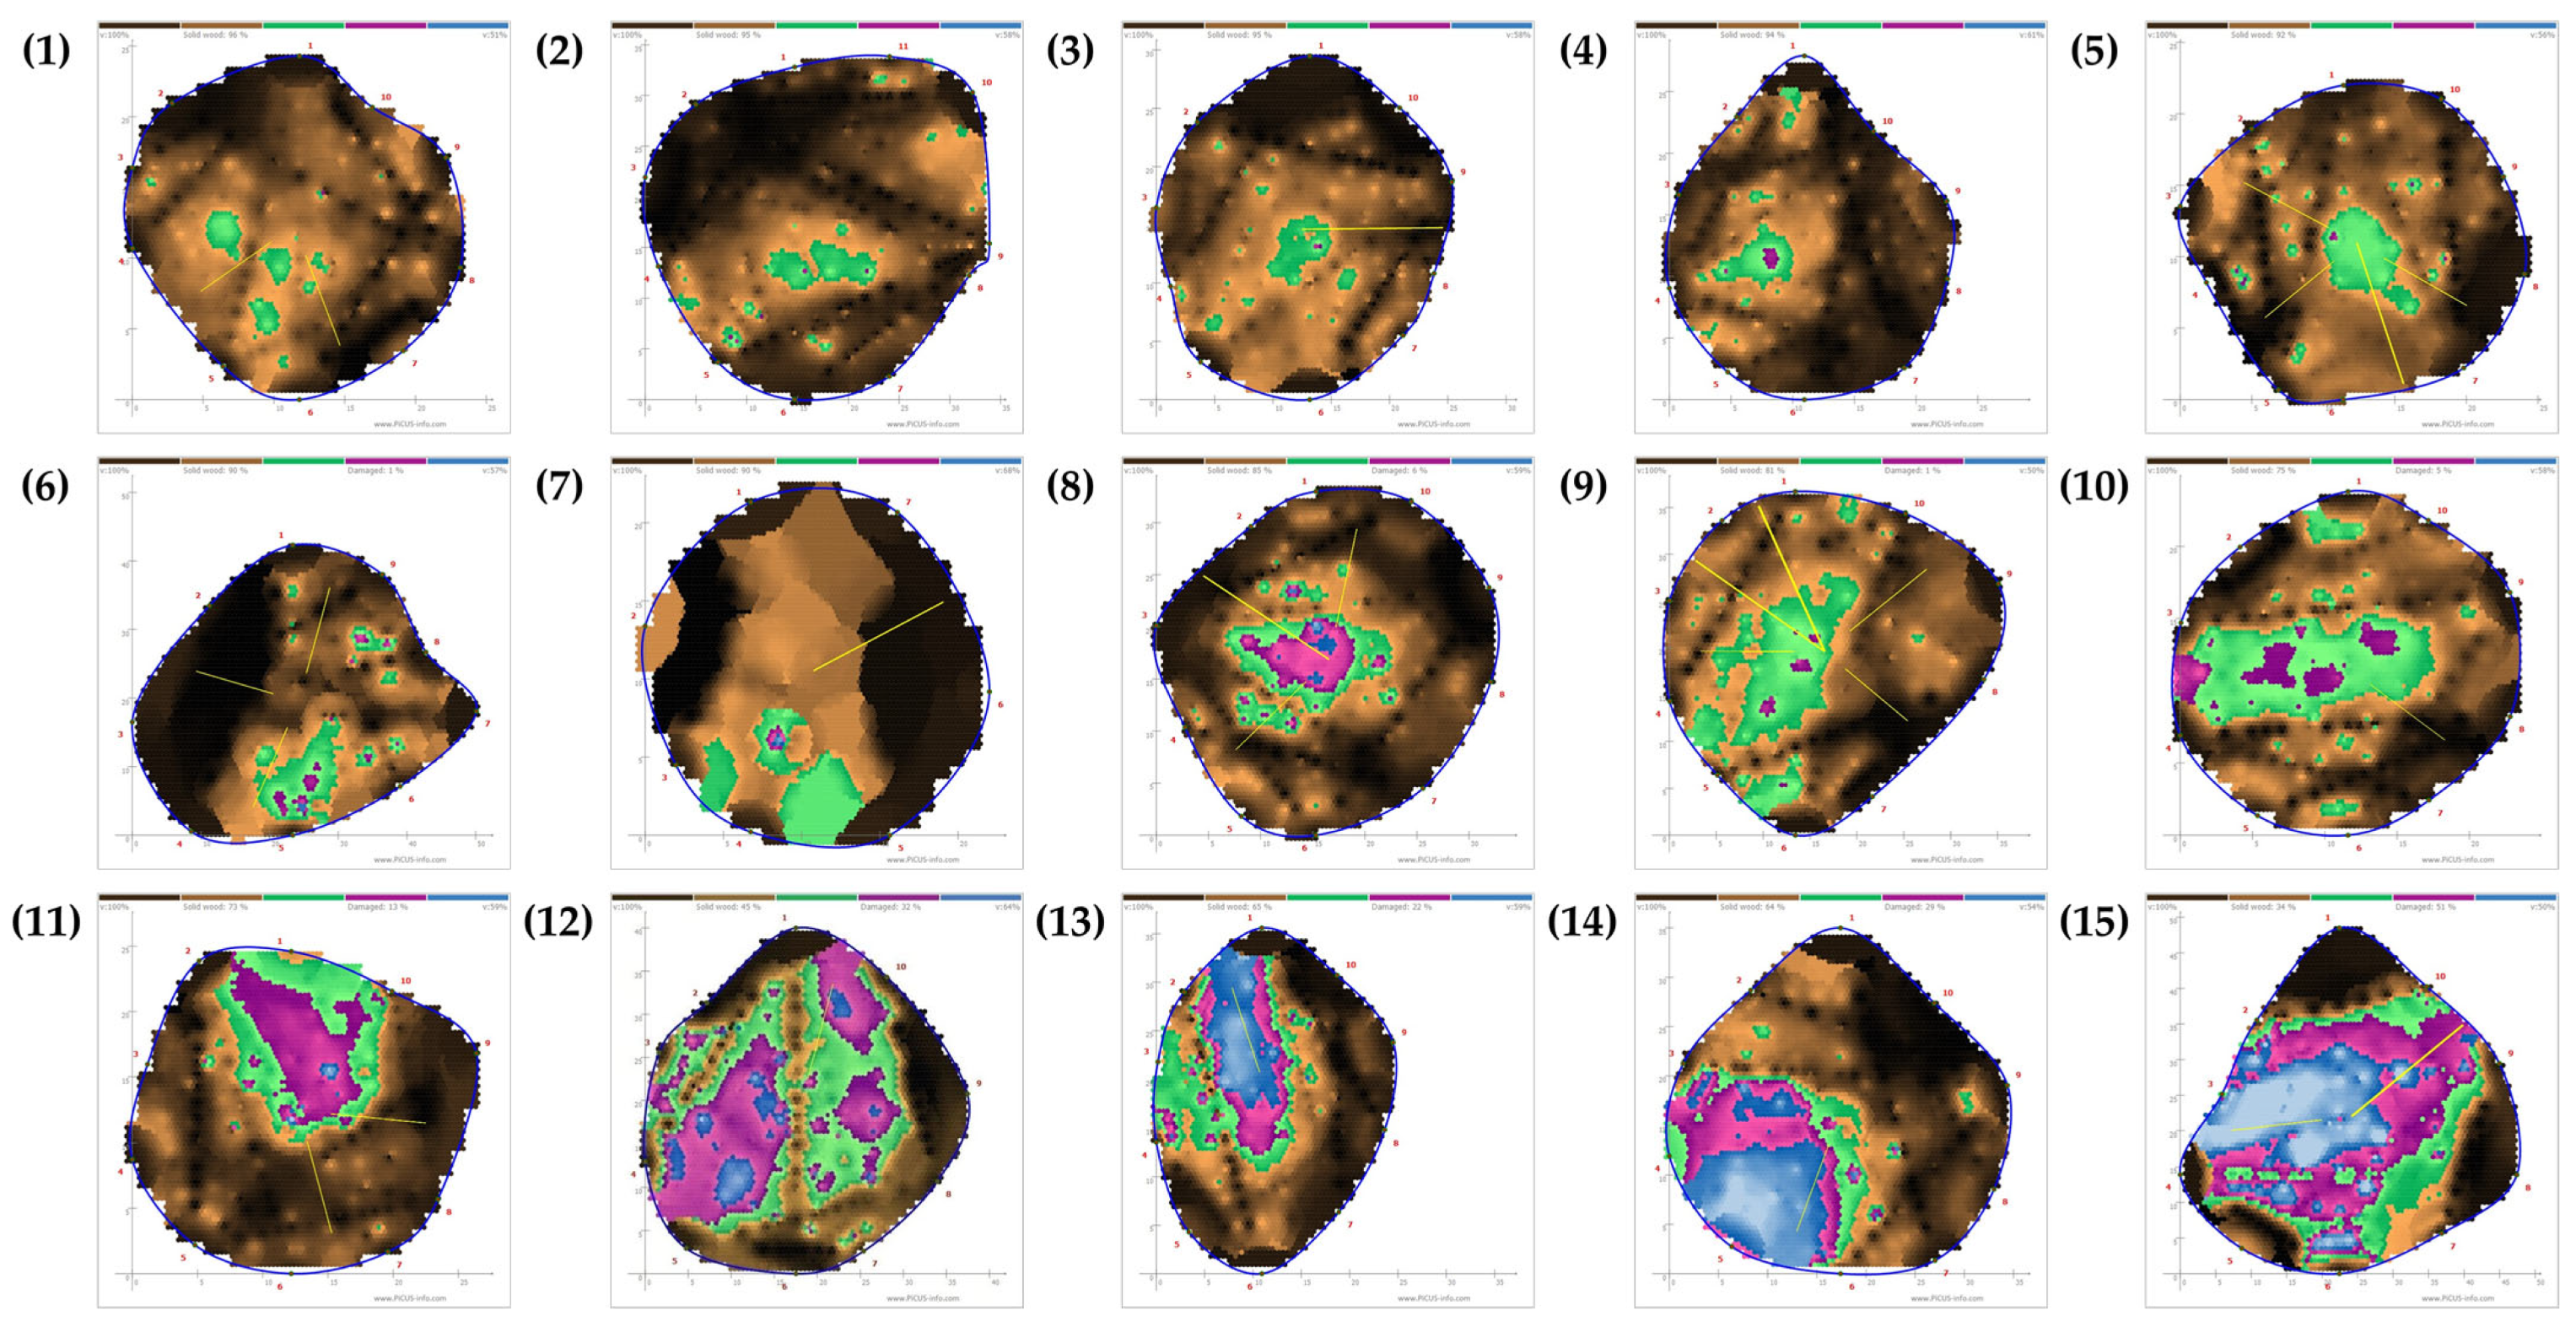
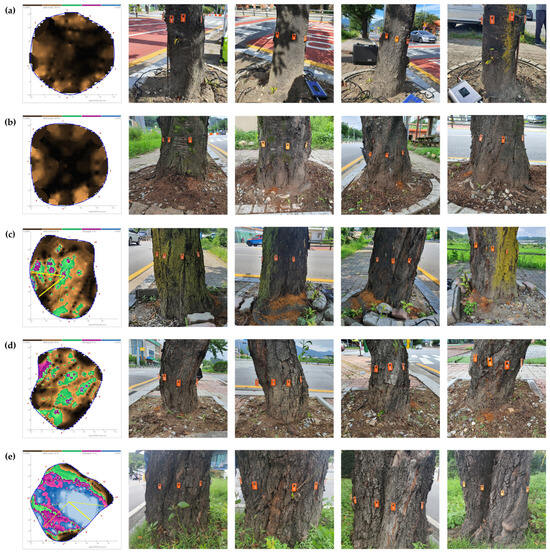
Figure A3.
Representative examples of tomography of measured Prunus × yedoensis tree (left panel) with visual images from four directions (right 4 panels): (a) non-infested tree; (b) weakly infested but 0% in injury rates in tomogram; (c) moderately infested and 19% in injury rate in tomogram; (d) severely infested and 26% in injury rate in tomogram; (e) severely infested in the past and 85% in injury rate in tomogram. The red numbers in left panels indicate the positions of the sensors. Different colors indicate wood decay severities: black and brown indicate solid wood (non-damaged areas); green is assessed in relation to the overall damage; and violet and blue indicate damaged areas (hollowed or decayed areas).


Figure A4.
Representative examples of tomography of measured Quercus palustris tree (left panel) with visual images from four directions (right 4 panels): (a) non-infested tree; (b) weakly infested and 4% in injury rates in tomogram; (c) moderately infested and 25% in injury rate in tomogram; and (d) severely infested and 66% in injury rate in tomogram. The red numbers in left panels indicate the positions of the sensors. Different colors indicate wood decay severities: black and brown indicate solid wood (non-damaged areas); green is assessed in relation to the overall damage; and violet and blue indicate damaged areas (hollowed or decayed areas).
References
- Nowak, D.J.; Pasek, J.E.; Sequeira, R.A.; Crane, D.E.; Mastro, V.C. Potential effect of Anoplophora glabripennis (Coleoptera: Cerambycidae) on urban trees in the United States. J. Econ. Entomol. 2001, 94, 116–122. [Google Scholar] [CrossRef] [PubMed]
- Cappaert, D.; McCullough, D.G.; Poland, T.M.; Siegert, N.W. Emerald ash borer in North America: A research and regulatory challenge. Am. Entomol. 2005, 51, 152–165. [Google Scholar] [CrossRef]
- Aukema, J.E.; Leung, B.; Kovacs, K.; Chivers, C.; Britton, K.O.; Englin, J.; Frankel, S.J.; Haight, R.G.; Holmes, T.P.; Liebhold, A.M. Economic impacts of non-native forest insects in the continental United States. PLoS ONE 2011, 6, e24587. [Google Scholar] [CrossRef]
- MacLeod, A.; Evans, H.; Baker, R. An analysis of pest risk from an Asian longhorn beetle (Anoplophora glabripennis) to hardwood trees in the European community. Crop Prot. 2002, 21, 635–645. [Google Scholar] [CrossRef]
- Baranchikov, Y.; Mozolevskaya, E.; Yurchenko, G.; Kenis, M. Occurrence of the emerald ash borer, Agrilus planipennis in Russia and its potential impact on European forestry. EPPO Bull. 2008, 38, 233–238. [Google Scholar] [CrossRef]
- Valenta, V.; Moser, D.; Kuttner, M.; Peterseil, J.; Essl, F. A high-resolution map of emerald ash borer invasion risk for southern central Europe. Forests 2015, 6, 3075–3086. [Google Scholar] [CrossRef]
- Lee, S.; Cha, D.; Nam, Y.; Jung, J. Genetic diversity of a rising invasive pest in the native range: Population genetic structure of Aomia bungii (Coleoptera: Cerambycidae) in South Korea. Diversity 2021, 13, 582. [Google Scholar] [CrossRef]
- Sun, Y. Control Techniques of Massicus raddei (Blessig); Liaoning Science and Technology Publishing House: Shenyang, China, 2001. [Google Scholar]
- Naka, H.; Horie, Y.; Mochizuki, F.; Le, V.V.; Yamamoto, M.; Saito, T.; Watarai, T.; Tsuchida, K.; Arita, Y.; Ando, T. Identification of the sex pheromone secreted by Synanthedon hector (Lepidoptera: Sesiidae). Appl. Entomol. Zool. 2008, 43, 467–474. [Google Scholar] [CrossRef]
- Kim, S.; Jung, J.-K.; Park, I.; Lee, B.-W.; Kim, Y.-H. Integrated Identification and Genetic Diversity of Potentially Invasive Clearwing Moths (Lepidoptera: Cossoidea: Sesiidae) in Korea. Insects 2024, 15, 79. [Google Scholar] [CrossRef]
- EPPO. Pest Risk Analysis for Aromia bungii. 2014. Available online: https://www.eppo.int/ACTIVITIES/plant_quarantine/pra_activities (accessed on 10 January 2024).
- Cocquempot, C. Aromia bungii. EPPO datasheet on pests recommended for regulation. EPPO Bull. 2015, 45, 4–8. [Google Scholar]
- EPPO. EPPO Global Database. 2023. Available online: https://gd.eppo.int (accessed on 6 March 2024).
- The First Longicorn Beetle in Japan Confirmed in Aichi. Damaging Cherry and Japanese Apricot Trees. 2013. Available online: http://english.agrinews.co.jp/?p=482 (accessed on 6 March 2024).
- Kano, M.; Nonaka, T.; Kiriyama, S.; Iwata, R. Aromia bungii (Coleoptera: Cerambycidae), an invasive cerambycid, found at Soka, Saitama Pref., Japan, infesting cherry trees, Cerasus× yedoensis ‘Somei-yoshino’. For. Pests 2014, 63, 101–105. [Google Scholar]
- Tamura, S.; Shoda-Kagaya, E. Genetic differences among established populations of Aromia bungii (Faldermann, 1835) (Coleoptera: Cerambycidae) in Japan: Suggestion of multiple introductions. Insects 2022, 13, 217. [Google Scholar] [CrossRef] [PubMed]
- Burmeister, E.G.; Hendrich, L.; Balke, M. Der asiatische moschusbock Aromia bungii (Faldermann, 1835)—Erstfund für Deutschland (Coleoptera: Cerambycidae). Nachrichtenblatt Bayer. Entomol. 2012, 61, 29–31. [Google Scholar]
- Russo, E.; Nugnes, F.; Vicinanza, F.; Garonna, A.P.; Bernardo, U. Biological and molecular characterization of Aromia bungii (Faldermann, 1835) (Coleoptera: Cerambycidae), an emerging pest of stone fruits in Europe. Sci. Rep. 2020, 10, 7112. [Google Scholar] [CrossRef]
- Urano, T.; Taki, H.; Shoda-Kagaya, E. Comparison of the ecological traits and boring densities of Aromia bungii (Faldermann, 1835) (Coleoptera: Cerambycidae) in two host tree species. Insects 2022, 13, 151. [Google Scholar] [CrossRef] [PubMed]
- Authority, E.F.S.; de la Peña, E.; Schrader, G.; Vos, S. Pest survey card on Aromia bungii. EFSA Support. Publ. 2019, 16, 1731E. [Google Scholar]
- Jang, H.K.; Lee, S.H.; Choi, W. Cerambycidae of Korea; Geobook: Seoul, Republic of Korea, 2015; 400p. [Google Scholar]
- Iwata, R. Aromia bungii (Coleoptera: Cerambycidae): Taxonomy, distribution, biology and eradication. For. Pests 2018, 67, 189–216. [Google Scholar]
- EPPO (European and Mediterranean Plant Protection Organization). Pest Risk Analysis for Massicus raddei (Coleoptera: Cerambycidae), Oak Longhorn Beetle; EPPO: Paris, France, 2018. [Google Scholar]
- Jung, J.; (Kangwon National University, Chuncheon, Gangwon, Republic of Korea). Personal communication, 2024.
- Flower, C.E.; Knight, K.S.; Gonzalez-Meler, M.A. Using stable isotopes as a tool to investigate impacts of EAB on tree physiology and EAB spread. In Proceedings of the Emerald Ash Borer Research and Technology Development Meeting, Pittsburgh, PA, USA, 20–21 October 2009; Forest Service Health Technology Enterprise Team: Pittsburgh, PA, USA, 2010; pp. 54–55. [Google Scholar]
- Chen, S.X.; Xie, Y.Z.; Deng, G.F. Economic Insects of China Vol. 1 Coleoptera Cerambycidae; Science Press: Beijing, China, 1959. (In Chinese) [Google Scholar]
- Timms, L.L.; Smith, S.M.; De Groot, P. Patterns in the within-tree distribution of the emerald ash borer Agrilus planipennis (Fairmaire) in young, green-ash plantations of south-western Ontario, Canada. Agric. For. Entomol. 2006, 8, 313–321. [Google Scholar] [CrossRef]
- Nahrung, H.F.; Smith, T.E.; Wiegand, A.N.; Lawson, S.A.; Debuse, V.J. Host tree influences on longicorn beetle (Coleoptera: Cerambycidae) attack in subtropical Corymbia (Myrtales: Myrtaceae). Environ. Entomol. 2014, 43, 37–46. [Google Scholar] [CrossRef]
- Rinn, F. Basics of typical resistance-drilling profiles. West. Arborist 2012, 17, 30–36. [Google Scholar]
- Kang, B.; Cho, S.-J.; Son, J.; Kim, N.-C.; Kim, M.-h. The health analysis of protected tree ‘Zelkova serrata’ using an ultrasonic tomograph. J. Korean Soc. Environ. Restor. Technol. 2014, 17, 73–83. [Google Scholar] [CrossRef]
- Bodig, J. The process of NDE research for wood and wood composites. E-J. Nondestruct. Test. 2001, 6, 3. [Google Scholar]
- Deflorio, G.; Fink, S.; Schwarze, F.W. Detection of incipient decay in tree stems with sonic tomography after wounding and fungal inoculation. Wood Sci. Technol. 2008, 42, 117–132. [Google Scholar] [CrossRef]
- Brazee, N.J.; Marra, R.E.; Göcke, L.; Van Wassenaer, P. Non-destructive assessment of internal decay in three hardwood species of northeastern North America using sonic and electrical impedance tomography. Forestry 2011, 84, 33–39. [Google Scholar] [CrossRef]
- Arciniegas, A.; Prieto, F.; Brancheriau, L.; Lasaygues, P. Literature review of acoustic and ultrasonic tomography in standing trees. Trees 2014, 28, 1559–1567. [Google Scholar] [CrossRef]
- Son, J.; Lee, G.; Shin, J. Noninvasive sonic tomography for detecting internal defects in old, large oriental white oak in cultural heritage areas. Forests 2022, 13, 638. [Google Scholar] [CrossRef]
- Gapyeong Country Office. Street Trees Status. 2022. Available online: https://www.gp.go.kr/portal/index.do (accessed on 4 December 2023).
- KFS (Korea Forest Service). Street Tree Information in Chuncheon-si. 2022. Available online: https://www.forest.go.kr/kfsweb/kfs/idx/Index.do (accessed on 4 December 2023).
- Wonju Country Office. Street Trees Status. 2022. Available online: https://www.wonju.go.kr/www/index.do (accessed on 4 December 2023).
- Gilbert, E.A.; Smiley, E.T. Picus sonic tomography for the quantification of decay in white oak (Quercus alba) and hickory (Carya spp.). J. Arboric. 2004, 30, 277–281. [Google Scholar] [CrossRef]
- Gao, Y.; Cha, B.J. The non-destructive test for the vitality measurements and inside diagnosis of old Trees. Mun Wha Jae 2009, 42, 144–157. [Google Scholar]
- IML Electronic. PiCUS Sonic Tomograph: Software Manual Q74. 2017, p. 92. Available online: https://www.iml-electronic.com/wp-content/uploads/2022/09/PiCUSQ74manual.pdf (accessed on 9 July 2024).
- R: A Language and Environment for Statistical Computing. Available online: https://www.R-project.org/ (accessed on 21 November 2023).
- Lee, G.; Son, J. Reliability analysis of non-invasive sonic tomography for detection and quantification of internal defects in Prunus × Yedoensis Matsum. Available online: https://ssrn.com/abstract=4142200 (accessed on 10 December 2023).
- Krasutskii, B. Beetles (Coleoptera) associated with the polypore Daedaleopsis confragosa (Bolton: Fr.) J. Schrot (Basidiomycetes, Aphyllophorales) in forests of the urals and transurals. Entomol. Rev. 2007, 87, 512–523. [Google Scholar] [CrossRef]
- Krasutskii, B. Coleoptera associated with the tree fungus Trichaptum biforme (Fr. in Klotzsch) (Basidiomycetes, Aphyllophorales) in the forests of the Urals and the Trans-Ural area. Entomol. Rev. 2010, 90, 679–688. [Google Scholar] [CrossRef]
- Linnakoski, R.; Kasanen, R.; Lasarov, I.; Marttinen, T.; Oghenekaro, A.O.; Sun, H.; Asiegbu, F.O.; Wingfield, M.J.; Hantula, J.; Heliövaara, K. Cadophora margaritata sp. nov. and other fungi associated with the longhorn beetles Anoplophora glabripennis and Saperda carcharias in Finland. Antonie Van Leeuwenhoek 2018, 111, 2195–2211. [Google Scholar] [CrossRef] [PubMed]
- Mohammed, W.S.; Ziganshina, E.E.; Shagimardanova, E.I.; Gogoleva, N.E.; Ziganshin, A.M. Comparison of intestinal bacterial and fungal communities across various xylophagous beetle larvae (Coleoptera: Cerambycidae). Sci. Rep. 2018, 8, 10073. [Google Scholar] [CrossRef]
- Rust, S. Accuracy and reproducibility of acoustic tomography significantly increase with precision of sensor position. J. Landsc. Res. 2017, 1, 1–6. [Google Scholar] [CrossRef]
- Nakano, A.; Watanabe, T. Damage caused by the red-necked longhorn beetle, Aromia bungii in peach orchards in Tokushima Prefecture and trial control method. Plant Prot. 2017, 71, 723–728. [Google Scholar]
- Meng, P.; Hoover, K.; Keena, M. Asian longhorned beetle (Coleoptera: Cerambycidae), an introduced pest of maple and other hardwood trees in North America and Europe. J. Integr. Pest Manag. 2015, 6, 4. [Google Scholar] [CrossRef]
- Qin, R.; Qiu, Q.; Lam, J.H.; Tang, A.M.; Leung, M.W.; Lau, D. Health assessment of tree trunk by using acoustic-laser technique and sonic tomography. Wood Sci. Technol. 2018, 52, 1113–1132. [Google Scholar] [CrossRef]
- Eyre, D.; Haack, R.A. Invasive cerambycid pests and biosecurity measures. In Cerambycidae of the World; CRC Press: Boca Raton, FL, USA, 2017; pp. 577–632. [Google Scholar]
- Wu, Y.; Trepanowski, N.F.; Molongoski, J.J.; Reagel, P.F.; Lingafelter, S.W.; Nadel, H.; Myers, S.W.; Ray, A.M. Identification of wood-boring beetles (Cerambycidae and Buprestidae) intercepted in trade-associated solid wood packaging material using DNA barcoding and morphology. Sci. Rep. 2017, 7, 40316. [Google Scholar] [CrossRef] [PubMed]
- Lee, S.; Choi, J.; Jang, H.; Choi, W.; Kwon, W.; Kim, D.; Gim, J.; Park, J.; Park, S.; Kim, S. Establishment of non-native Anoplophora horsfieldii (Coleoptera: Cerambycidae) in South Korea. J. Integr. Pest Manag. 2023, 14, 9. [Google Scholar] [CrossRef]
- Zhang, Y.; Dang, Y.; Wang, X. Risk assessment of the worldwide expansion and outbreak of Massicus raddei (Blessig) (Coleoptera: Cerambycidae) based on host plant and climatic factors. Insects 2022, 13, 730. [Google Scholar] [CrossRef]


Disclaimer/Publisher’s Note: The statements, opinions and data contained in all publications are solely those of the individual author(s) and contributor(s) and not of MDPI and/or the editor(s). MDPI and/or the editor(s) disclaim responsibility for any injury to people or property resulting from any ideas, methods, instructions or products referred to in the content. |
© 2024 by the authors. Licensee MDPI, Basel, Switzerland. This article is an open access article distributed under the terms and conditions of the Creative Commons Attribution (CC BY) license (https://creativecommons.org/licenses/by/4.0/).