Article

Biomass and Carbon Stock Capacity of Robinia pseudoacacia Plantations at Different Densities on the Loess Plateau

1
School of Soil and Water Conservation, Beijing Forestry University, Beijing 100083, China
2
Jixian National Forest Ecosystem Observation and Research Station, CNERN, School of Soil and Water Conservation, Beijing Forestry University, Linfen 041000, China
3
Key Laboratory of State Forestry Administration for Soil and Water Conservation, College of Soil and Water Conservation, Beijing Forestry University, Beijing 100083, China
4
China Agricultural Museum, Beijing 100125, China
*
Authors to whom correspondence should be addressed.
Forests 2024, 15(7), 1242; https://doi.org/10.3390/f15071242
Submission received: 4 June 2024 / Revised: 10 July 2024 / Accepted: 15 July 2024 / Published: 17 July 2024
(This article belongs to the Special Issue Biomass Estimation and Carbon Stocks in Forest Ecosystems—Volume II)

Abstract

:
Forests make an important contribution to the global carbon cycle and climate regulation. Caijiachuan watershed false acacia (Robinia pseudoacacia Linn.) plantation forests have been created for 30 years, but a series of problems have arisen due to the irrationality of the density involved at that time. To precisely assess the contribution of R. pseudoacacia plantations with different densities to this cycle, we measured the diameter at breast height (DBH), tree height (H), biomass, and carbon stocks in trees, shrubs, herbs, litter, and soil across different density ranges, denoted as D1 = 900–1400, D2 = 1401–1900, D3 = 1901–2400, D4 = 2401–2900, and D5 = 2901–3400 trees ha−1. In order to achieve the purpose of accurately estimating the biomass, carbon stocks and the contribution rate of each part in different densities of R. pseudoacacia plantations were measured. The results are as follows: (1) Both DBH and H decreased with increasing density, and field surveys were much more difficult and less accurate for H than DBH. Based on the two allometric growth models, it was found that the determination coefficient of the biomass model that incorporated both H and DBH (0.90) closely resembled that of the model using only DBH (0.89), with an error margin of only 0.04%. (2) At the sample scale, stand density significantly affected R. pseudoacacia stem biomass and total biomass. At the individual plant scale, stand density significantly affected R. pseudoacacia organ biomass. Increasing stand densities promoted the accumulation of vegetation biomass within the sample plot but did not improve the growth of individual R. pseudoacacia trees. The stem biomass constituted the majority of the total R. pseudoacacia biomass (58.25%–60.62%); the total R. pseudoacacia biomass represented a significant portion of the vegetation biomass (93.02%–97.37%). (3) The total carbon stock in the sample plots tended to increase with increasing stand density, indicating a positive correlation between density and the carbon stock of the whole plantation forest ecosystem. Hence, in future R. pseudoacacia plantations, appropriate densities should be selected based on specific objectives. For wood utilization, a planting density of 900–1400 trees ha−1 should be controlled. For carbon fixation, an initial planting density of 2900–3400 trees ha−1 should be selected for R. pseudoacacia. This study provides theoretical support for local forest management and how to better sequester carbon.

1. Introduction

Since the Industrial Revolution, there has been extensive fossil fuel combustion, widespread deforestation, and rising concentrations of greenhouse gases such as carbon dioxide in the atmosphere. The increase in carbon dioxide has caused a series of ecological and environmental issues, significantly impacting sustainable human development [1]. The effective mitigation of climate warming has become a primary concern for the international community [2]. Carbon stocks are critical in the global carbon cycle and climate regulation and serve as key indicators of ecosystem functionality. Therefore, conducting an effective assessment of carbon stocks holds significance for mitigating climate warming, achieving carbon neutrality, and fostering sustainable social development [3,4].
Forests are the most dominant terrestrial ecosystem globally, serving as the largest carbon pool, with 60% of terrestrial ecosystem carbon stocks [5,6], encompassing over 90% of the global vegetation carbon pool [7]. They play an essential role in the global carbon cycle [8], contribute to the reduction of atmospheric carbon dioxide concentration, and play an important role in the mitigation of global warming [9,10]. In the past decades, China’s extensive afforestation policy has substantially increased its forested area, transforming the country into a carbon sink and making a significant contribution to global climate change mitigation efforts [11,12,13].
Accurately estimating forest ecosystem carbon stocks involves assessing forest vegetation, soil, and litter carbon stocks [14,15,16], which are crucial for regulating global climate change and the carbon cycle. Numerous studies have conducted extensive studies on forest ecosystem carbon stock estimations [17,18,19,20,21]. Forest biomass serves as a key link between atmospheric and soil carbon pools [22] and an important indicator for assessing forest vegetation carbon stocks and sequestration capacity, providing baseline values for carbon stock calculations [23]. Enhancing the accuracy of forest biomass estimations is important for quantifying terrestrial carbon stocks and reducing estimation uncertainties [24]. The assessment of forest biomass includes both the aboveground and belowground portions, but belowground biomass is small and difficult to quantify [25]. Hence, most current studies on forest biomass have focused on the aboveground portion, encompassing the cumulative biomass of all trees (leaves, branches, and stems) within a defined area [26]. Belowground biomass, as a part of forest biomass, has become a hot topic of current research due to the challenges in estimating it accurately and easily. In forest ecosystems, the relatively lower proportion of litter carbon stock compared to vegetation and soil carbon stock often leads to neglect, resulting in errors in estimating the overall carbon stock [27]. As a link between aboveground plants and soil, dead wood not only nourishes vegetation growth but also plays a vital role in water conservation [28,29]. Consequently, rapid, accurate, and comprehensive estimation of forest vegetation biomass and ecosystem carbon stocks has emerged as a key research focus.
Planted forests, which are integral to forest resources, significantly contribute to carbon sequestration, oxygen release, soil and water conservation, and economic benefits. Stand density has attracted attention as the influence factor that is easiest to regulate and is the most significant in promoting high-quality plantation forest development [30,31]. Stand density directly affects vegetation, litter, and soil layers [32]. In the vegetation layer, excessive density can intensify intra-forest competition, inhibiting tree growth, whereas insufficient density may result in suboptimal resource utilization, thus limiting land potential. Inappropriate densities can reduce understory vegetation diversity, whereas optimal densities enhance the forest microenvironment, promoting woodland vegetation growth. Stand density affects the soil structure, thereby influencing soil water retention and conservation [33]. It induces environmental changes, altering litter amounts and decomposition rates and thereby causing variations in vegetation growth and soil nutrients. Therefore, maintaining reasonable stand density is pivotal for enhancing forest quality, maximizing forest benefits, and achieving high-quality plantation forest development.
Ji County in China’s Shanxi Province has made many achievements in soil and water conservation management. Notably, within the Cai Jiachuan Watershed, where the Ji County station is situated, extensive planting of R. pseudoacacia and southern Chinese pine (Pinus tabuliformis Carrière) forests began in 1991. Presently, the watershed boasts a forest coverage rate exceeding 80%, significantly mitigating soil and water erosion while enhancing the ecological landscape. However, as forests age and due to limited silvicultural knowledge at the time, substantial areas of low-quality and low-efficiency forests have emerged. Our working hypothesis is that biomass and carbon stocks in R. pseudoacacia plantations show an increasing trend with increasing density. Therefore, this study focused on R. pseudoacacia plantation forests within the Cai Jiachuan Watershed in the Loess region of western Shanxi Province. The objectives included (1) constructing an R. pseudoacacia biomass model, (2) assessing the biomass and contribution rates of R. pseudoacacia plantation forests at various densities, and (3) quantifying carbon stocks in vegetation, soil, and litter across forests. The findings can provide a theoretical foundation for the high-quality development and sustainable function of these forests in the Loess region of western Shanxi Province.

2. Materials and Methods

2.1. Study Area

The study area was located within the Cai Jiachuan Watershed (36°14′27″ N–36°18′23″ N, 110°39′45″ E–110°47′45″ E), which served as the site for the National Forest Ecosystem Field Scientific Observatory Station in Ji County, Shanxi Province (Figure 1). Encompassing an area of 39.33 km2, with elevations ranging from 904 to 1592 m, the watershed fell within the Loess beam-shaped hilly and gully region, characterized by loess parent material and brown soil. The area corresponds to warm temperate continental climate with an average annual air temperature of 10 °C and annual mean precipitation of 575.9 mm, predominantly occurring between July and October. The average annual potential evaporation was 1729 mm. In the upper reaches of the Cai Jiachuan Watershed, the terrain features soil and rock mountains hosting natural secondary forests. In contrast, the middle and lower reaches display a loess hilly gully landscape characterized by shelterbelts resulting from artificial afforestation alongside natural secondary forests, grass vegetation, and farmland ecosystems formed within closed mountain forests. Plantations created since the 1990s are dominated by R. pseudoacacia, Chinese cypress (Platycladus orientalis (L.) Franco), and Pinus tabuliformis. Understory vegetation primarily includes Yellow bramble (Rosa xanthina Lindl.), Artemisia annua (Artemisia stechmanniana Besser), and Dipterocarpus sedge (botany) (Carex lithophila Turcz.) [34].

2.2. Selection of Experimental Sites

Between June and September 2022, a total of five density gradients were set up to study R. pseudoacacia plantation forests in Cai Jiachuan Watershed. The selected R. pseudoacacia plantation forests with different densities were 30 years old, allowing for long-term natural growth without artificial intervention post-planting, and there was no significant difference in soil parent material, slope, or orientation between the selected areas (Table 1). A total of 49 plots measuring 20 m × 20 m were established across these densities, with quadrangle spacing exceeding 100 m; the plots were positioned away from the forest edges. The diameter at breast height (DBH) and crown width were measured using a steel tape measure, and tree height (H) was determined using the fishing rod method (Figure 2) [35]. Five 5 m × 5 m shrub plots were set up at the corners and centers of each plot (Figure 3). These quadrats were employed to assess the shrub species, quantity, height, and coverage. Additionally, five 1 m × 1 m quadrats were established within each shrub quadrat, resulting in a total of twenty-five herb quadrats per plot (Figure 3). The herb species, quantity, and coverage were recorded in these quadrats. The slope and slope direction of each sample were measured using a geological compass, whereas the altitude and location were determined using a Chihiro RTK device.

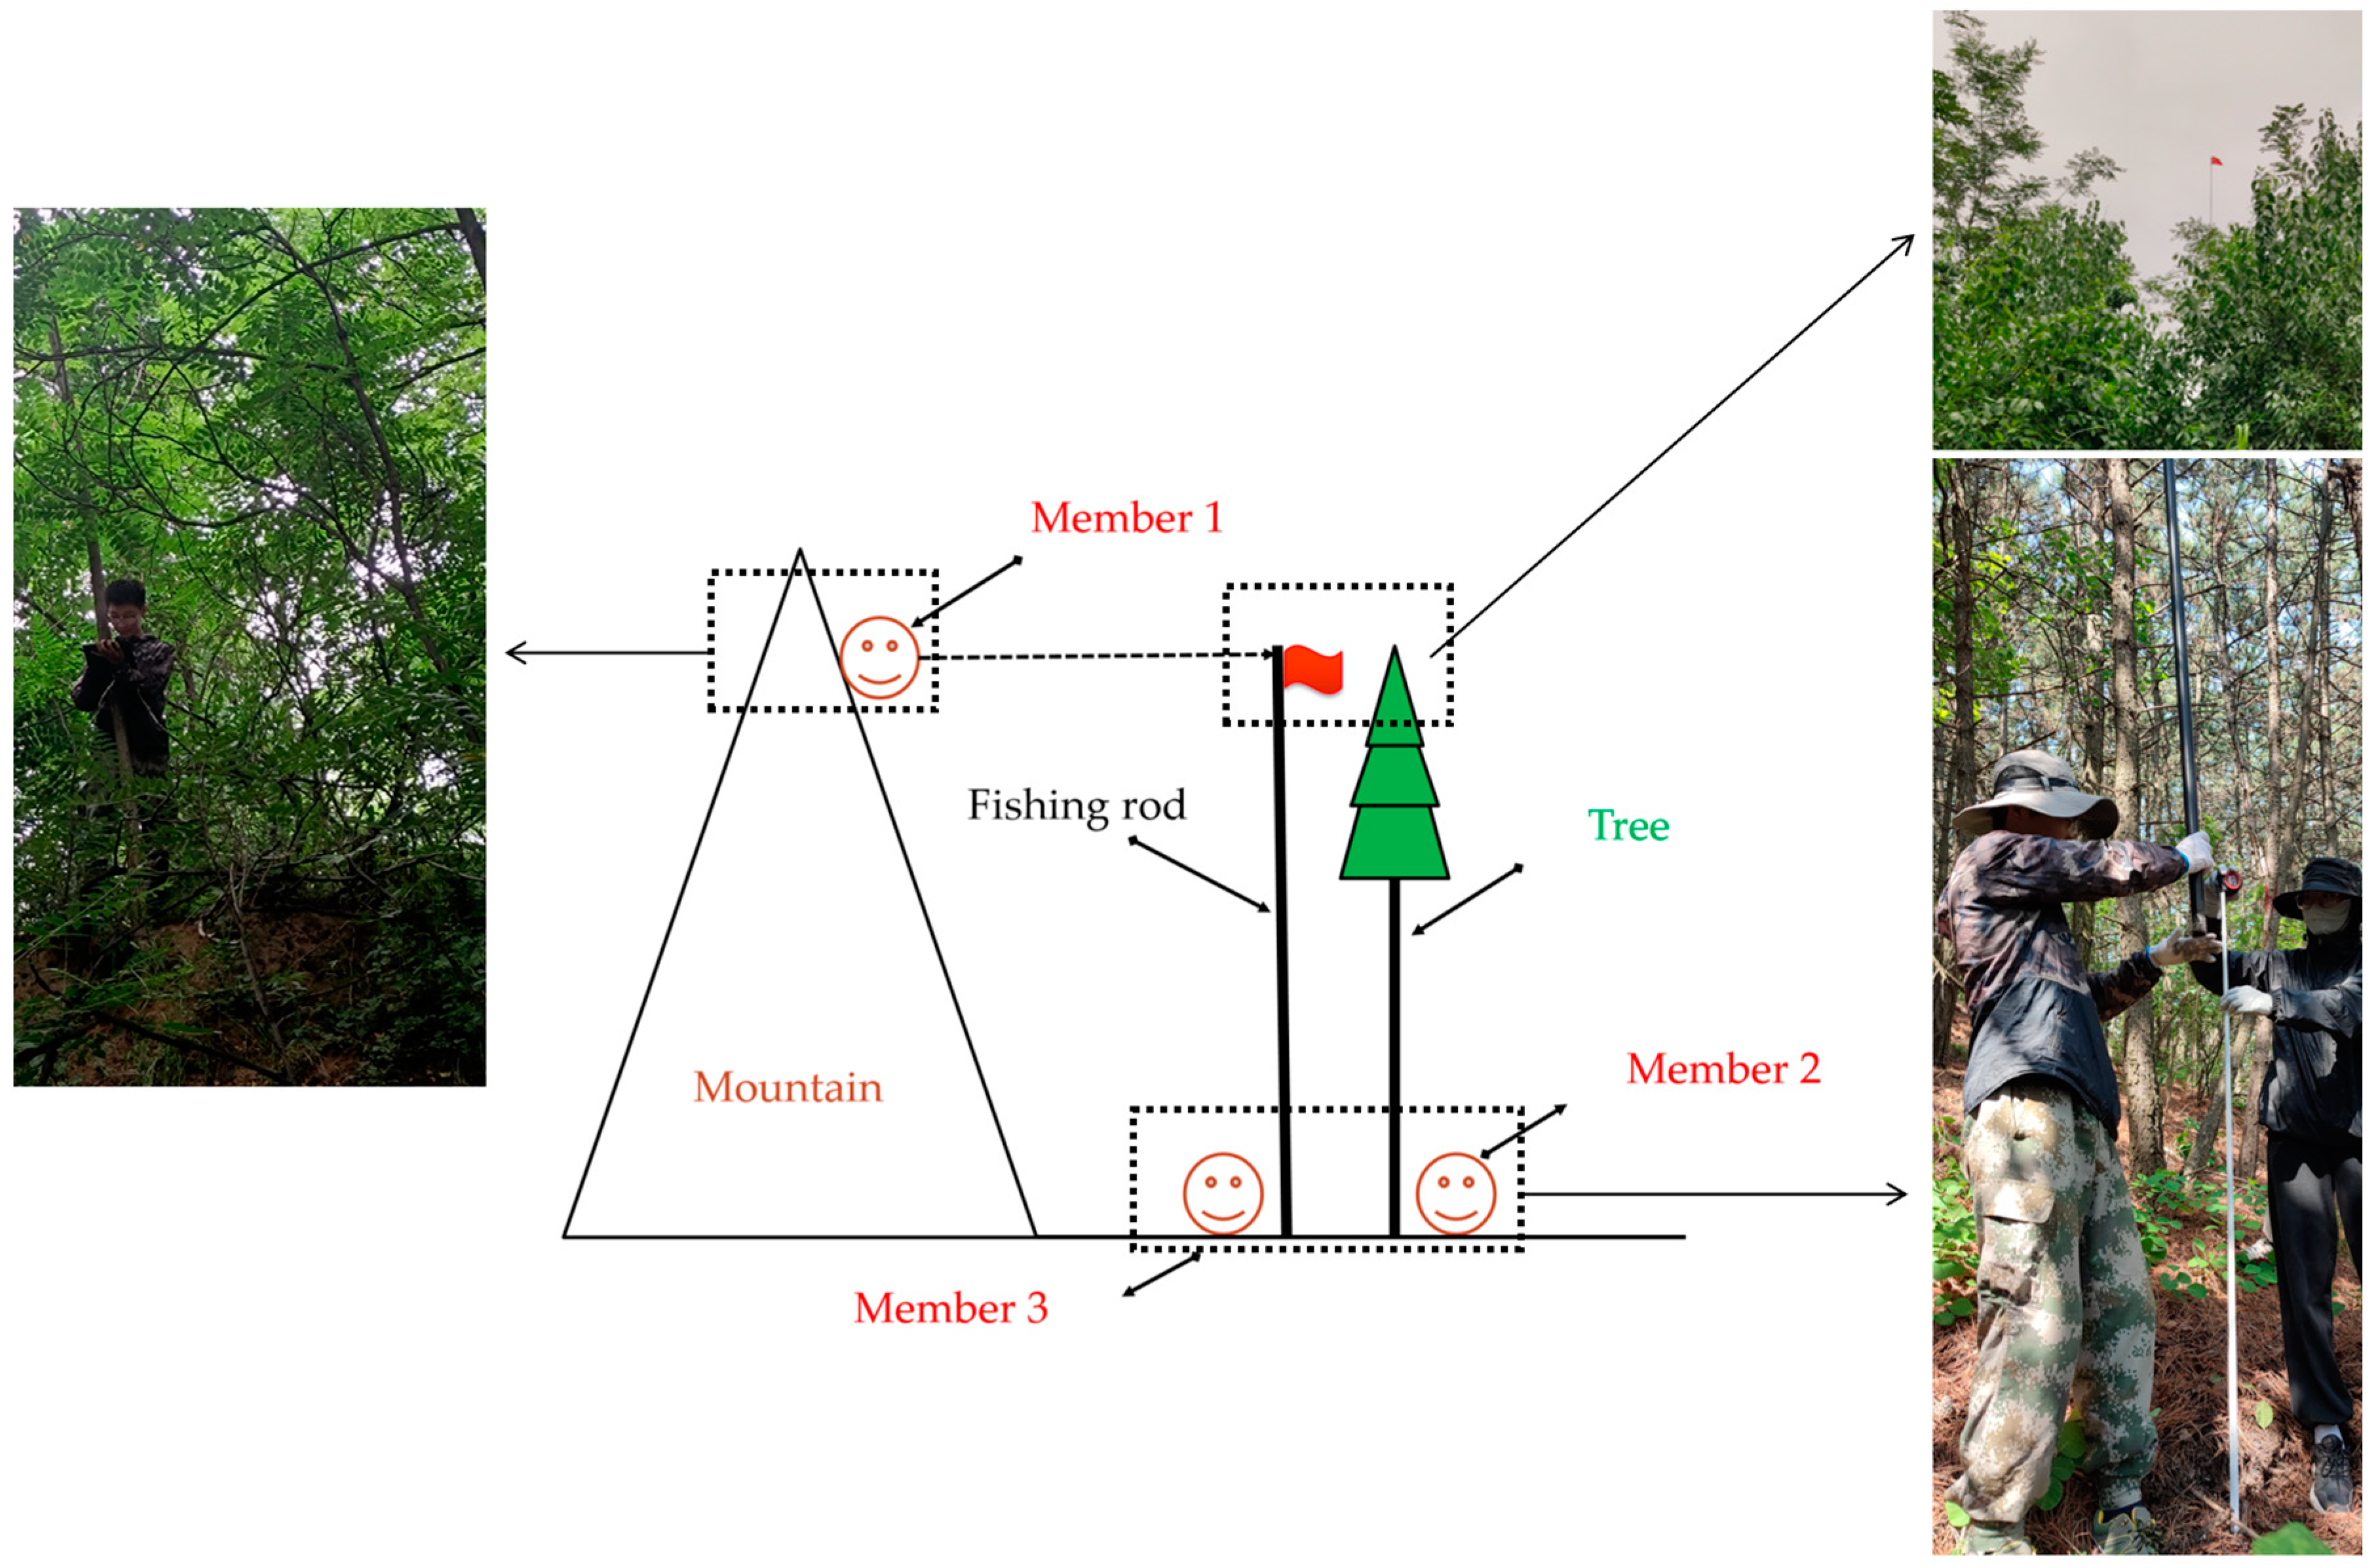
2.3. Methods for Estimating Aboveground Biomass

We conducted measurements of the DBH and H of all trees within the sampling plots. One standard tree was selected based on average H and DBH values within each sample plot, totaling 49 standard trees [36]. Subsequently, the fresh weights (W) of the leaves, branches, and stems of the standard trees were recorded individually. The samples of each organ, weighing approximately 500 g, were then placed in brown paper bags and transported to the laboratory for drying to a constant weight at 75 °C. The water content (M) of each organ was determined to calculate its biomass (B). Finally, the total aboveground biomass of R. pseudoacacia was calculated by the addition of the biomass values for each organ:
B a = W a / ( 1   +   M a )
B 1 = B l e a f + B b r a n c h + B s t e m
where B a = biomass (kg); W a = fresh weight (kg); M a = water content (kg); a = leaf, branch, stem; and B 1 = the aboveground biomass of Robinia pseudoacacia (kg).
All shrubs and herbs within the shrubs and herb samples were harvested, and their fresh weights were measured by species, with the data recorded accordingly. The samples of each plant species, weighing approximately 500 g, were collected and transported to the laboratory for drying to a constant weight at 75 °C. Subsequently, the water content of each shrub was determined to calculate the aboveground biomass of the shrub plants within the sample plot:
B b = W b / ( 1   +   M b )
B 2 = B s h r u b + B h e r b
where B b = the aboveground biomass of b (kg); W b = fresh b weight (kg); M b = b water content (kg); b = shrub, herb; B 2 = the total aboveground biomass of the sample plot (kg).
Three 0.5 m × 0.5 m square sample plots were established within each of the selected sample areas, positioned on the upper, middle, and lower slopes. The thickness of the litter was measured within these squares, and the entire litter was collected. Subsequently, the fresh weight of the litter was recorded, and it was then dried to a constant weight at 75 °C in the laboratory. This process allowed for the calculation of litter biomass within the sample plots:
B c = W c / ( 1   +   M c )
where B c = litter biomass (kg); W c = fresh litter weight (kg); and M c = litter water content (kg).

2.4. Methods for Estimating Belowground Biomass

This study employed two methods to assess root biomass within the sample plots, reflecting variations in biomass among coarse and fine roots of R. pseudoacacia, as well as belowground biomass of shrubs and herbs. The excavation method [37] was used to assess the coarse roots of R. pseudoacacia, while the root drilling method [38] was employed to evaluate the fine roots of R. pseudoacacia along with the belowground biomass of shrubs and herbs. Portions of the root system (approximately 500 g) obtained through the excavation were transported to the laboratory for analysis. These portions were subsequently dried at 75 °C until they reached a constant weight to determine the biomass of the coarse roots in R. pseudoacacia. Five random points were selected from the sample plot. Soil samples were collected at intervals of 20 cm from 0 to 100 cm depth. The soil samples were sieved and washed with running water, and all roots were carefully collected. The collected roots were categorized as fine roots of R. pseudoacacia, shrub roots, and herb roots. Each sample was dried at 75 °C until a constant weight was obtained. The number of R. pseudoacacia coarse root samples was 49, the number of R. pseudoacacia fine root samples was 245, and the number of shrub and herbs root samples was 245. The water content of each root part was calculated to estimate the fine root biomass of R. pseudoacacia, as well as the belowground biomass of shrubs and herbs:
B d = W d / ( 1   +   M d )
B 3 = B c o a r s e r o o t + B f i n e r o o t
B e = W e / ( 1   +   M e )
B 4 = B s h r u b r o o t + B h e r b r o o t
B 5 = B 3 + B 4
B 6 = B 1 + B 3
B 7 = B 2 + B 4
B 8 = B 6 + B 7
where B d = the d biomass of R. pseudoacacia (kg); W d = fresh d weight (kg); M d = d water content (kg); d = coarse root, fine root; B 3 = the belowground biomass of shrub (kg); B e = the belowground biomass of e (kg); W e = fresh e weight (kg); M e = e water content (kg); e = shrub root, herb root; B 4 = the belowground biomass of shrub and herb (kg); B 5 = the total belowground biomass of the sample plot (kg); B 6 = the total biomass of R. pseudoacacia (kg); B 7 = the biomass of shrub and herb (kg); and B 8 = the biomass of the sample plot (kg).

2.5. Fitting of Biomass Relationships

Aboveground biomass and carbon stocks of trees are closely related to H and DBH [39]. Therefore, a commonly employed biomass fitting model (Model I) was utilized, incorporating both DBH and H as parameters. Recognizing the challenges associated with measuring height and its relatively higher margin of error than DBH, an alternative biomass fitting model (Model II), relying solely on DBH as the independent variable, was proposed to discern the differences between the two approaches [40]:
W = a ( D B H ) 2 H b
W = c ( 1 + D B H ) d
where W = biomass of each component (kg); D = tree diameter at breast height (cm); H = tree height (m); and a, b, c, and d = coefficients of the function.

2.6. Soil Sample Collection and Determination

Within the selected 49 sample plots, the soil profiles were investigated at three distinct slope positions: upper, middle, and lower. Soil samples were collected from each 10 cm stratum within the 0–100 cm depth range. The samples from the same stratum were thoroughly mixed, placed in soil bags, and allowed to dry naturally. After passing through a 2 mm sieve, the mixed soil samples were used to determine the chemical properties. Additionally, the soil samples were collected using a ring knife (100 cm3) at 10 cm intervals within the middle section of each sample plot. Three samples were obtained from each layer and transported to the laboratory to assess soil physical properties. Soil bulk density was determined using the ring knife method, and the soil organic matter content was assessed through oxidative external heating with potassium dichromate [41].

2.7. Carbon Stocks Estimation

The vegetation carbon stock in the sample plot was calculated by multiplying the biomass of each layer with the respective carbon concentration. The concentration was derived from forest inventory resource data in Shanxi Province [42], specifying a carbon rate of 0.5 for each organ of R. pseudoacacia and 0.467 for shrubs and herbs. The total vegetation carbon stock was the sum of these values. The litter carbon stock was determined by multiplying litter biomass by a carbon rate of 0.467. The soil carbon stocks were calculated using Brown’s formula [43]:
C 1 = B 6 0.5
C 2 = B 7 0.467
C 3 = B c 0.467
C 4 = R S h S O C 10
C 5 = C 1 + C 2 + C 3 + C 4
where C 1 = the carbon stocks of R. pseudoacacia (kg); C 2 = the carbon stocks of shrub and herb (kg); C 3 = the carbon stocks of litter (kg); C 4 = the carbon stocks of soil (kg); R S = soil bulk density (g/cm3); h = soil depth (cm); S O C = organic carbon stocks in soils (g/kg); and C 5 = the total carbon stocks of the sample plot (kg).

2.8. Statistical Analysis

The statistical analysis was carried out using the IBM SPSS Statistics 26.0 software (IBM, Armonk, NY, USA) and MATLAB R2023b (MathWorks, Natick, MA, USA). Differences in tree and shrub biomass and carbon stocks at varying densities were analyzed using one-way ANOVA. Duncan’s multiple range test (DMRT) is used to evaluate multiple comparisons among the treatments. Origin 2023 (OriginLab, Northampton, MA, USA) facilitated the mapping tasks.

3. Results

3.1. Fitting of Biomass Relationships

By correlating the organ-specific and total biomass of R. pseudoacacia with both DBH and H, each organ and the total biomass exhibited a significant W = a(DBH2H)b relationship with DBH and H, demonstrating an R2 value exceeding 0.70 (Table 2). When fitting the biomass of each organ and the total biomass to DBH, a significant W = a(1 + DBH)b relationship with DBH was observed, yielding an R2 value exceeding 0.73 (Table 2). Comparing the two fitting methods, the error associated with the branches and roots in the second fitting relationship was smaller than that in the first fitting relationship. Conversely, the errors related to the trunk, leaves, and total biomass were even smaller in the first fitting relationship. Notably, the disparity in the total biomass between the two fitting relationships was minimal, with only a 0.04% difference.

3.2. Biomass and Contributions in R. pseudoacacia of Different Densities

The Biomass of Individual Trees of R. pseudoacacia

Significant differences (p < 0.05) were observed in the leaves, branches, stems, and total aboveground biomass of individual R. pseudoacacia plants (Table 3) across varying densities. An increasing density corresponds to a decreasing trend in the aforementioned biomass components. The highest biomass recorded for leaves, branches, stems, and total aboveground biomass per individual R. pseudoacacia was 2.97 kg tree−1, 11.32 kg tree−1, 38.66 kg tree−1, and 52.95 kg tree−1, respectively, at a density of 900−1400 trees ha−1. Conversely, the lowest recorded biomass values were 1.22 kg tree−1, 5.25 kg tree−1, 19.40 kg tree−11, and 25.86 kg tree−1 at a density of 2901−3400 trees ha−1.
Significant differences (p < 0.05) were observed in the coarse roots, fine roots, total belowground biomass, and total biomass of individual R. pseudoacacia (Table 4) across varying densities.
Significant differences (p < 0.05) were observed in the stem and total aboveground biomass of R. pseudoacacia (Figure 4A,B).
The differences in aboveground biomass between shrubs, herbs, and the combined biomass of shrubs and herbs in R. pseudoacacia woodlands across various densities (Figure 5A−C) were not statistically significant (p > 0.05), whereas the differences in total aboveground biomass within the sample plot (Figure 5D) were significant (p < 0.05).
The differences in coarse roots and total belowground biomass of R. pseudoacacia, as well as the total belowground biomass of the sample plot (Figure 6A,C,E), were statistically significant (p < 0.05). Conversely, the differences in fine root and belowground biomass of shrubs and herbs (Figure 6B,D) were not significant (p > 0.05) across varying densities of R. pseudoacacia woodland.
Within the biomass of R. pseudoacacia, stem biomass constituted the highest proportion, ranging from 58.25% to 60.62%, and this proportion gradually increased as density increased. Following stems, branches accounted for a decreasing proportion as the density increased. The coarse root biomass exhibited fluctuating changes with density. The proportion of fine root biomass initially increased and then decreased with density, representing only one-third of the coarse root biomass. Leaf biomass constituted the smallest proportion, approximately 3%−4% of the total biomass of R. pseudoacacia, and decreased with increasing density (Table 5).
The total biomass of R. pseudoacacia and sample plots at various stand densities (Figure 7A,C) exhibited significant differences (p < 0.05), while the total biomass of shrubs and herbs (Figure 7B) did not differ significantly (p > 0.05).
R. pseudoacacia was dominant in both the total aboveground biomass and total belowground biomass, as well as in the total biomass of the sample plot. Its contribution to the total aboveground biomass of the sample plot ranged from 92.26% to 98.04% across different densities, while the total biomass of shrubs and herbs contributed 1.27% to 4.84% and 0.69% to 3.44%, respectively. The total belowground biomass of R. pseudoacacia was 94.23% to 97.00% of the belowground biomass, and the belowground biomass of shrubs and herbs accounted for 3.00%–5.77%. In terms of the entire sample plot, R. pseudoacacia ranged from 93.02% to 97.37%, and the belowground biomass of the shrubs and herbs ranged from 2.63% to 6.98% of the total biomass (Table 6).

3.3. Carbon Stock in R. pseudoacacia of Different Densities

Density significantly affected (p < 0.05) both R. pseudoacacia and vegetation carbon stocks in R. pseudoacacia woodland, and it had a non-significant effect (p > 0.05) on shrub and herb carbon stocks.
The differences in litter carbon stock and soil organic carbon stock (Figure 8A,B) were not significant (p > 0.05) across the five stand densities, whereas the differences in total carbon stock (Figure 8C) within the sample plots were significant (p < 0.05).
Vegetation and soil organic carbon stocks constituted the majority of the total carbon stock within the sample plots. The proportion of vegetation carbon stock increased steadily with increasing density, contributing between 45.92% and 53.38%. Conversely, the proportion of soil organic carbon stock initially decreased and then increased, contributing between 43.69% and 51.74%. Litter carbon stock exhibited a pattern of first increasing and then decreasing, contributing between 2.34% and 2.93% (Table 7).

4. Discussion

4.1. Comparison of Biomass Models

H and DBH are fundamental parameters in forest inventories and are frequently employed for computing individual tree volume, biomass, carbon stock, and various other metrics [35]. Numerous biomass models have been developed worldwide. DBH, recognized as a common and reliable predictor, has been extensively utilized in constructing tree biomass models. Recent studies have demonstrated that integrating both DBH and H enhances the accuracy of tree biomass prediction in some case [40]. However, prevalent H measurement techniques such as the fishing rod and tree climbing methods are time-consuming and energy-intensive, and the latter method is more destructive, rendering them unsuitable for large-scale height estimation. The degree of difficulty and accuracy of H measurements vary significantly depending on the tree species. The measurement of R. pseudoacacia and other broadleaf species poses a significantly greater challenge than the measurement of pine species such as Pinus tabuliformis, resulting in a relatively low accuracy rate. DBH measurements during field surveys are straightforward and precise. This does not lead to an increased workload or errors due to variations in tree species.
In this study, accurate H, DBH, and biomass data were obtained for 49 R. pseudoacacia by felling standard wood. Biomass models were developed for R. pseudoacacia biomass and DBH, and for R. pseudoacacia biomass, DBH, and H (Table 2). By comparing the coefficient of determination and RMSE of these models, we were able to observe that their accuracies were highly similar, without significant difference, which was consistent with the findings of Kralicek et al. [44]. Therefore, in estimating R. pseudoacacia biomass in the loess area of west Jin, where this study was conducted, establishing the biomass–DBH relationship ensured accuracy while saving time and effort. However, this model may not necessarily apply to other regional species or even to other tree species within the region.

4.2. Biomass Production

Stand density, recognized as a crucial controllable factor in plantation forest management [41], profoundly influences plant photosynthesis, the production and transport of dry matter, and, ultimately, plant growth. Its impact on R. pseudoacacia biomass is twofold. First, stand density directly regulates the number of R. pseudoacacia trees, thereby affecting the total biomass within the sample plots. Second, it influences individual R. pseudoacacia biomass by shaping their growth environment and resource access, thereby altering the total biomass within sample plots [30].
Density can directly influence the DBH and H of R. pseudoacacia in the sample plot, both of which declined as R. pseudoacacia density increased. Additionally, density significantly affects the light environment within the stand [45], thereby affecting R. pseudoacacia growth. In R. pseudoacacia plantations with uniform density, each sample plot shares an identical slope, slope direction, and growth conditions, including the planting distance between neighboring monocultures, planting time, coarseness, and height. Consequently, monoculture growth differences can be minimal, facilitating balanced growth of R. pseudoacacia within the sample plot. In this study, at low densities, both the average DBH and the average H of R. pseudoacacia were greater (Table 1). The understory experiences higher light intensity, leading to a stronger photosynthetic capacity in the forest trees. R. pseudoacacia monocultures can benefit from increased space, less mutual interference, and enhanced nutrient availability in the soil, which facilitates their growth [41]. As the density increases, R. pseudoacacia DBH showed a decreasing trend (Table 1). Two main factors may contribute to the observed effects. First, increased shading among R. pseudoacacia trees impedes their photosynthetic processes, thus affecting their overall growth. Second, heightened tree density intensifies competition for nutrients, reducing the availability of nutrients for individual trees and resulting in reduced DBH. Reasonable management of stand density enhances both the light environment within the stand and the quality of the individual trees. To achieve denser and taller R. pseudoacacia timber forests, it is advisable to maintain a planting density of 900−1400 trees ha−1 [41].
In this study, the biomass of each organ of the aboveground part of R. pseudoacacia was calculated by the standard woodcutting method. This study found that the biomass of leaves, branches, stems, and total aboveground biomass of R. pseudoacacia in plantation forests of varying densities exhibited a gradual increase with higher density (Figure 4). Higher density favored greater allocation of biomass to stems, which was consistent with the findings of Xue et al. [46]. However, individual R. pseudoacacia demonstrated a gradual decrease in biomass with increasing density, suggesting that the positive impact of changes in R. pseudoacacia density on the total aboveground biomass outweighed the negative effect of constrained individual growth (Table 3). The stem predominantly accounted for carbon stocks in the tree layer owing to its significant net carbon accumulation effect, which can be crucial for R. pseudoacacia carbon stocks [47]. As a deciduous broadleaf forest species, R. pseudoacacia demonstrated a robust carbon cycling capacity in its leaves, resulting in a lower proportion of stem biomass.
Stand density influences the species composition and biomass of shrubs and herbs by regulating light penetration in the tree layer and interspecies competition [48]. In this study, accurate estimation of shrub and herb biomass was carried out by setting up shrub and herb sample plots and harvesting all the shrubs and herbs in the sample plots. This study found that the total biomass of shrubs and herbs generally increased and then decreased with increasing density (Figure 5), with excessive density resulting in reduced biomass. Higher stand densities intensify competition between R. pseudoacacia and shrubs and herbs, thereby suppressing their growth [49]. In R. pseudoacacia plantation forests with densities of 900–1400 trees ha−1, ample gaps and light availability promoted greater biomass of shrubs and grasses throughout this density range. As R. pseudoacacia density increased to 1401–1900 trees ha−1, shrub growth experienced less shade from trees than the double shading effect on herbaceous plants by trees and shrubs. This led to a continued increase in shrub biomass, and herb biomass decreased significantly. However, the total biomass of both increased. As the density rose to 1901−2400 trees ha−1, the shading effect of trees on shrubs intensified, resulting in a significant decrease in shrub biomass. Herbaceous plants experienced a notable decrease in the shrubs, with reduced direct shading. Consequently, the biomass increased, whereas the total biomass of shrubs and herbs decreased. At 2401−2900 trees ha−1, the shrub composition shifted with an increase in mesophytic shrubs, although this was accompanied by a rise, albeit smaller than the decrease in cationic herbs, in mesophytic herbs. Consequently, the herb biomass and total biomass of shrubs and herbs decreased. At a density of 2901−3400 trees ha−1, the shading effect of trees prevailed, resulting in a substantial reduction in both sun-loving and mesophytic shrubs and herbs, leaving predominantly shade-tolerant species. Consequently, the biomass of shrubs and herbs and the total biomass of shrubs and herbs exhibited a decreasing trend [49].
In this study, R. pseudoacacia coarse root biomass was measured by the excavation method, and R. pseudoacacia fine root biomass was measured by the root drilling method. This study found that the total belowground biomass of R. pseudoacacia in the sample plot exhibited an inverse relationship with the density of individual R. pseudoacacia biomass (Table 4 and Figure 6). In this study, the total belowground biomass of individual R. pseudoacacia increased with increasing DBH. Conversely, as the density increased, the DBH of individual plants decreased gradually, leading to a gradual decrease in their total belowground biomass. However, the total belowground biomass of R. pseudoacacia in the sample plot increased. This suggested that the inhibitory effect of reduced DBH on R. pseudoacacia root biomass in the sample plots was substantially smaller than the stimulatory effect of increased plant density. This led to an increasing trend in the total belowground biomass of R. pseudoacacia within the sample plot despite the reduction in the total belowground biomass of individual R. pseudoacacia. Similarly, the belowground biomass of shrubs and herbs exhibited a pattern of increase, decrease, and subsequent increase with R. pseudoacacia density (Figure 6), mirroring the trend observed in aboveground biomass, as shrubs played a more prominent role than herbs in the sample plot composition.
With increasing density, the trends in total biomass, total aboveground biomass, and total belowground biomass of both the sample plot and R. pseudoacacia followed a similar pattern (Figure 5, Figure 6 and Figure 7). This similarity arises from the dominance of R. pseudoacacia in the total biomass, total aboveground biomass, and total belowground biomass of the sample plot, with contribution rates ranging from 93.02% to 97.37%, 92.26% to 98.04%, and 94.23% to 97.00%, respectively [50].

4.3. Total Carbon Stocks

Vegetation absorbs atmospheric CO2 through photosynthesis, utilizing a portion for its own growth while transferring the rest to the soil. The carbon stock within vegetation is integral to the global carbon cycle [51]. In this study, accurate estimation of vegetation carbon stocks was carried out by accurately estimating the biomass of R. pseudoacacia woodlands of different densities in combination with different vegetation carbon content rates. This study found that the vegetation carbon stocks across the sample plots with varying densities exhibited slight variations, gradually increasing with density. Among the five densities of R. pseudoacacia plantation forests, R. pseudoacacia accounted for the majority of the carbon stock, contributing over 92%, whereas shrubs and grasses collectively contributed less than 8% (Table 4). This suggests that R. pseudoacacia in woodlands excels at capturing and converting atmospheric CO2 compared to shrubs and herbs. Furthermore, this suggests that R. pseudoacacia is more effective at capturing and converting atmospheric CO2 within woodlands compared to shrubs and grasses. Given its predominant biomass in the woodland, the trend of R. pseudoacacia carbon stock was consistent with that of the vegetation carbon stock in the sample plot. Despite their lower biomass proportion relative to R. pseudoacacia, shrubs and herbs exhibited higher chemical concentrations and biomass returns than trees, thus playing a significant role in nutrient cycling.
The litter layer serves as a crucial pathway for forest carbon to enter the soil from vegetation and plays a pivotal role in ecosystem water conservation, material cycling, and nutrient storage and balance [52]. In this study, by accurately determining the biomass of the litter layer and the carbon content rate of the litter layer, it was found that the biomass and carbon stock in the apoplastic layer increased with increasing density (Figure 8). This can be attributed to the predominance of R. pseudoacacia leaves in the litter, the biomass of which increases with density. Consequently, the amount of litter generated in the R. pseudoacacia sample plots also exhibited an upward trend with increasing density, resulting in a corresponding increase in carbon stock in the litter layer.
In this study, by analyzing the soil chemical properties, we found that the soil carbon stocks in the R. pseudoacacia plantation forests in this study (41.99 t ha−1) were notably lower than the average forest soil carbon stocks in China (106.1 t ha−1). This discrepancy can be attributed to severe soil erosion in the Loess Plateau region, resulting in a significant loss of soil organic carbon, which fell far below the average value [53]. It was found that the carbon stock of R. pseudoacacia plantation forest showed a trend of decreasing and then increasing with density (Figure 8). Soil organic carbon can primarily originate from deadfall and vegetation roots [33]. At lower densities, increased light transmission and higher temperatures in the forest can enhance microorganism activity, resulting in a higher rate of decomposition of organic material and, consequently, a higher soil carbon stock [29]. However, as density increased, forest temperature gradually decreased, inhibiting microorganism activity and reducing the decomposition of organic material, thereby leading to a decrease in the soil carbon stock. When density reached a certain threshold, heightened competition among R. pseudoacacia promoted root system development and increased root biomass. This generated a significant amount of organic carbon from the secretion of living roots and the decomposition of dead roots, thereby enriching the soil [54]. Concurrently, low forest temperatures suppressed the rate of organic carbon decomposition by soil microorganisms [55], weakened soil respiration [56], and, consequently, led to an increase in soil carbon stocks.
In this study, by comparing the carbon stocks in each layer of the R. pseudoacacia forest ecosystem, we were able to observe that the carbon stocks were highest in the vegetation layer, followed by the soil and litter layers, with the vegetation and soil layers collectively accounting for over 97% of carbon stocks (Table 5), emphasizing their significance in organic carbon storage in plantation forests [57]. As density increased, the ecosystem’s carbon stock increased with the vegetation carbon stock due to the predominant role of the vegetation layer in carbon storage. Consequently, an appropriate increase in R. pseudoacacia density positively affected the overall ecosystem carbon stocks. In this study, a planting density of 2901−3400 trees ha−1 was determined to be optimal for carbon sequestration in a 30−year old R. pseudoacacia plantations.
Forest carbon stock cannot only be determined by stand density. It also correlates closely with topography and stand age [49]. However, this study did not explore the significant impacts of topography and stand age on vegetation biomass and forest carbon stocks. Instead, it examined the role of stand density in biomass accumulation and carbon stocks. Therefore, to advance the high-quality development and sustainable functioning of R. pseudoacacia plantation forests in the Loess region of western Shanxi province, further investigation into the relative importance of stand age, stand density, and topography on ecosystem biomass and carbon stock is required. This serves as the next focal point of this research.

5. Conclusions

In the investigation of five densities of R. pseudoacacia plantation forests in the Loess region of western Shanxi province, it was found that the density of forest stands significantly influenced the DBH of R. pseudoacacia, the biomass of R. pseudoacacia stems, the total biomass of the sample plot, the total biomass of individual R. pseudoacacia, and the total carbon stock of the sample plot. The R. pseudoacacia DBH and the biomass of individual R. pseudoacacia decreased with increasing density, while the R. pseudoacacia stem biomass, total biomass of the sample plots, and total carbon stock of the sample plots increased with increasing density. This study found a positive impact on ecosystem carbon accumulation with an appropriate increase in R. pseudoacacia density. Therefore, the density of R. pseudoacacia plantation forests should be selected based on the specific objectives of the forest in question. For timber production, a planting density of 900−1400 trees ha−1 is recommended, whereas for carbon sequestration purposes, an initial planting density of 2900−3400 trees ha−1 can be the most effective.

Author Contributions

Conceptualization, Y.H.; methodology, Y.H.; software, Y.H.; validation, Y.H.; formal analysis, Y.H.; investigation, Y.H., J.Z. (Jiongchang Zhao), Y.L., P.T. and Z.Y.; resources, Y.H.; data curation, Y.H.; writing—original draft preparation, Y.H.; writing—review and editing, J.Z. (Jianjun Zhang) and R.S.; visualization, Y.H.; supervision, Y.H.; project administration, J.Z. (Jianjun Zhang); funding acquisition, J.Z. (Jianjun Zhang). All authors have read and agreed to the published version of the manuscript.

Funding

This research was funded by the National Key R&D Program of China (No. 2022YFE0104700).

Data Availability Statement

The original contributions presented in the study are included in the article, further inquiries can be directed to the corresponding author.

Acknowledgments

In addition, we thank the reviewers for their useful comments and suggestions.

Conflicts of Interest

The authors declare no conflicts of interest. The funders had no role in the design of the study; in the collection, analyses, or interpretation of data; in the writing of the manuscript; or in the decision to publish the results.

References

  1. Luintel, H.; Scheller, R.M.; Bluffstone, R.A. Assessments of Biodiversity, Carbon, and Their Relationships in Nepalese Forest Commons: Implications for Global Climate Initiatives. For. Sci. 2018, 64, 418–428. [Google Scholar] [CrossRef]
  2. IPCC. 2023: Sections. In Climate Change 2023: Synthesis Report. Contribution of Working Groups I, II and III to the Sixth Assessment Report of the Intergovernmental Panel on Climate Change; Core Writing Team, Lee, H., Romero, J., Eds.; IPCC: Geneva, Switzerland, 2023; pp. 35–115. [Google Scholar] [CrossRef]
  3. Cao, L.; Kong, F.; Xu, C. Exploring Ecosystem Carbon Storage Change and Scenario Simulation in the Qiantang River Source Region of China. Sci. Prog. 2022, 105, 003685042211131. [Google Scholar] [CrossRef]
  4. Wang, Y.; Zhang, Z.; Chen, X. Land Use Transitions and the Associated Impacts on Carbon Storage in the Poyang Lake Basin, China. Remote Sens. 2023, 15, 2703. [Google Scholar] [CrossRef]
  5. Zhou, Y.; Williams, C.A.; Hasler, N.; Gu, H.; Kennedy, R. Beyond biomass to carbon fluxes: Application and evaluation of a comprehensive forest carbon monitoring system. Environ. Res. Lett. 2021, 16, 055026. [Google Scholar] [CrossRef]
  6. Carvalhais, N.; Forkel, M.; Khomik, M. Global covariation of carbon turnover times with climate in terrestrial ecosystems. Nature 2014, 514, 213–217. [Google Scholar] [CrossRef]
  7. Kozlowski, G.; Song, Y.G. Importance, Tools, and Challenges of Protecting Trees. Sustainability 2022, 14, 13107. [Google Scholar] [CrossRef]
  8. Kuuluvainen, T.; Gauthier, S. Young and Old Forest in the Boreal: Critical Stages of Ecosystem Dynamics and Management under Global Change. For. Ecosyst. 2018, 5, 26. [Google Scholar] [CrossRef]
  9. Węgiel, A.; Polowy, K. Aboveground Carbon Content and Storage in Mature Scots Pine Stands of Different Densities. Forests 2020, 11, 240. [Google Scholar] [CrossRef]
  10. Poorter, L.; Van Der Sande, M.T.; Arets, E.J.M.M.; Ascarrunz, N.; Enquist, B.J.; Finegan, B.; Licona, J.C.; Martínez-Ramos, M.; Mazzei, L.; Meave, J.A.; et al. Biodiversity and Climate Determine the Functioning of Neotropical Forests. Glob. Ecol. Biogeogr. 2017, 26, 1423–1434. [Google Scholar] [CrossRef]
  11. Zeng, W.-S. Development of Monitoring and Assessment of Forest Biomass and Carbon Storage in China. For. Ecosyst. 2014, 1, 20. [Google Scholar] [CrossRef]
  12. Zhang, C.; Ju, W.; Chen, J.M.; Wang, X.; Yang, L.; Zheng, G. Disturbance-Induced Reduction of Biomass Carbon Sinks of China’s Forests in Recent Years. Environ. Res. Lett. 2015, 10, 114021. [Google Scholar] [CrossRef]
  13. Fang, J.; Yu, G.; Liu, L.; Hu, S.; Chapin, F.S. Climate Change, Human Impacts, and Carbon Sequestration in China. Proc. Natl. Acad. Sci. USA 2018, 115, 4015–4020. [Google Scholar] [CrossRef] [PubMed]
  14. Lee, J.; Yoon, T.K.; Han, S.; Kim, S.; Yi, M.J.; Park, G.S.; Kim, C.; Son, Y.M.; Kim, R.; Son, Y. Estimating the Carbon Dynamics of South Korean Forests from 1954 to 2012. Biogeosciences 2014, 11, 4637–4650. [Google Scholar] [CrossRef]
  15. Hérault, B.; Piponiot, C. Key Drivers of Ecosystem Recovery after Disturbance in a Neotropical Forest: Long-Term Lessons from the Paracou Experiment, French Guiana. For. Ecosyst. 2018, 5, 2. [Google Scholar] [CrossRef]
  16. Lafleur, B.; Fenton, N.J.; Simard, M.; Leduc, A.; Paré, D.; Valeria, O.; Bergeron, Y. Ecosystem Management in Paludified Boreal Forests: Enhancing Wood Production, Biodiversity, and Carbon Sequestration at the Landscape Level. For. Ecosyst. 2018, 5, 27. [Google Scholar] [CrossRef]
  17. Tian, H.; Lu, C.; Yang, J.; Banger, K.; Huntzinger, D.N.; Schwalm, C.R.; Michalak, A.M.; Cook, R.; Ciais, P.; Hayes, D.; et al. Global Patterns and Controls of Soil Organic Carbon Dynamics as Simulated by Multiple Terrestrial Biosphere Models: Current Status and Future Directions. Glob. Biogeochem. Cycles 2015, 29, 775–792. [Google Scholar] [CrossRef] [PubMed]
  18. Vanguelova, E.I.; Bonifacio, E.; De Vos, B.; Hoosbeek, M.R.; Berger, T.W.; Vesterdal, L.; Armolaitis, K.; Celi, L.; Dinca, L.; Kjønaas, O.J.; et al. Sources of Errors and Uncertainties in the Assessment of Forest Soil Carbon Stocks at Different Scales—Review and Recommendations. Environ. Monit. Assess. 2016, 188, 630. [Google Scholar] [CrossRef] [PubMed]
  19. Domke, G.M.; Perry, C.H.; Walters, B.F.; Woodall, C.W.; Russell, M.B.; Smith, J.E. Estimating Litter Carbon Stocks on Forest Land in the United States. Sci. Total Environ. 2016, 557–558, 469–478. [Google Scholar] [CrossRef]
  20. Filipchuk, A.; Moiseev, B.; Malysheva, N.; Strakhov, V. Russian Forests: A New Approach to the Assessment of Carbon Stocks and Sequestration Capacity. Environ. Dev. 2018, 26, 68–75. [Google Scholar] [CrossRef]
  21. Chen, Y.; Cao, J.; Zhou, L.; Li, F.; Fu, S. Effects of Prescribed Burning on Carbon Accumulation in Two Paired Vegetation Sites in Subtropical China. For. Ecosyst. 2019, 6, 26. [Google Scholar] [CrossRef]
  22. Wang, X.; Huang, X.; Wang, Y.; Yu, P.; Guo, J. Impacts of Site Conditions and Stand Structure on the Biomass Allocation of Single Trees in Larch Plantations of Liupan Mountains of Northwest China. Forests 2022, 13, 177. [Google Scholar] [CrossRef]
  23. Le Toan, T.; Quegan, S.; Davidson, M.W.J.; Balzter, H.; Paillou, P.; Papathanassiou, K.; Plummer, S.; Rocca, F.; Saatchi, S.; Shugart, H.; et al. The BIOMASS Mission: Mapping Global Forest Biomass to Better Understand the Terrestrial Carbon Cycle. Remote Sens. Environ. 2011, 115, 2850–2860. [Google Scholar] [CrossRef]
  24. Adhikari, D.; Singh, P.P.; Tiwary, R.; Barik, S.K. Forest carbon stock-based bioeconomy: Mixed models improve accuracy of tree biomass estimates. Biomass Bioenergy 2024, 183, 107142. [Google Scholar] [CrossRef]
  25. Disney, M.I.; Boni Vicari, M.; Burt, A.; Calders, K.; Lewis, S.L.; Raumonen, P.; Wilkes, P. Weighing Trees with Lasers: Advances, Challenges and Opportunities. Interface Focus 2018, 8, 20170048. [Google Scholar] [CrossRef] [PubMed]
  26. Xu, X.L.; Cao, M.K.; Li, K.R. Temporal-spatial dynamics of carbon storage of forest vegetation in China. Prog. Geogr. 2007, 26, 1–10. [Google Scholar]
  27. Sun, W.; Liu, X. Review on Carbon Storage Estimation of Forest Ecosystem and Applications in China. For. Ecosyst. 2020, 7, 4. [Google Scholar] [CrossRef]
  28. Pfeiffer, B.; Fender, A.-C.; Lasota, S.; Hertel, D.; Jungkunst, H.F.; Daniel, R. Leaf Litter Is the Main Driver for Changes in Bacterial Community Structures in the Rhizosphere of Ash and Beech. Appl. Soil Ecol. 2013, 72, 150–160. [Google Scholar] [CrossRef]
  29. Bravo-Oviedo, A.; Ruiz-Peinado, R.; Onrubia, R.; Del Río, M. Thinning Alters the Early-Decomposition Rate and Nutrient Immobilization-Release Pattern of Foliar Litter in Mediterranean Oak-Pine Mixed Stands. For. Ecol. Manag. 2017, 391, 309–320. [Google Scholar] [CrossRef]
  30. Pretzsch, H. Density and Growth of Forest Stands Revisited. Effect of the Temporal Scale of Observation, Site Quality, and Thinning. For. Ecol. Manag. 2020, 460, 117879. [Google Scholar] [CrossRef]
  31. Hepner, H.; Lutter, R.; Tullus, A.; Kanal, A.; Tullus, T.; Tullus, H. Effect of Early Thinning Treatments on Above-Ground Growth, Biomass Production, Leaf Area Index and Leaf Growth Efficiency in a Hybrid Aspen Coppice Stand. BioEnergy Res. 2020, 13, 197–209. [Google Scholar] [CrossRef]
  32. Zhao, M.; Sun, Y.; Liu, S.; Li, Y.; Chen, Y. Effects of Stand Density on the Structure of Soil Microbial Functional Groups in Robinia pseudoacacia Plantations in the Hilly and Gully Region of the Loess Plateau, China. Sci. Total Environ. 2024, 912, 169337. [Google Scholar] [CrossRef] [PubMed]
  33. Lei, J.; Du, H.; Duan, A.; Zhang, J. Effect of Stand Density and Soil Layer on Soil Nutrients of a 37-Year-Old Cunninghamia lanceolata Plantation in Naxi, Sichuan Province, China. Sustainability 2019, 11, 5410. [Google Scholar] [CrossRef]
  34. Zhao, J.; Zhang, J.; Hu, Y.; Li, Y.; Tang, P.; Gusarov, A.V.; Yu, Y. Effects of Land Uses and Rainfall Regimes on Surface Runoff and Sediment Yield in a Nested Watershed of the Loess Plateau, China. J. Hydrol. Reg. Stud. 2022, 44, 101277. [Google Scholar] [CrossRef]
  35. Jurjević, L.; Liang, X.; Gašparović, M.; Balenović, I. Is Field-Measured Tree Height as Reliable as Believed—Part II, A Comparison Study of Tree Height Estimates from Conventional Field Measurement and Low-Cost Close-Range Remote Sensing in a Deciduous Forest. ISPRS J. Photogramm. Remote Sens. 2020, 169, 227–241. [Google Scholar] [CrossRef]
  36. Byambadorj, S.O.; Park, B.B.; Lkhagvasuren, S.; Tsedensodnom, E.; Byambasuren, Q.; Khajid, A.; Chiatate, D.; Nyam-Osor, B. Influence of Irrigation on Biomass Partitioning in Above-and Belowground Organs of Trees Planted in Desert Sites of Mongolia. Forests 2023, 15, 46. [Google Scholar] [CrossRef]
  37. Zhang, Y.; Liu, W.; He, S. Effect of Vegetation Growth on Morphological Traits of Vegetation and Biomechanical Features of Roots. Plant Soil 2023, 494, 395–411. [Google Scholar] [CrossRef]
  38. Cabal, C.; Rodríguez-Torres, L.; Marí-Mena, N.; Más-Barreiro, A.; Vizcaíno, A.; Vierna, J.; Valladares, F.; Pacala, S.W. Comparing Two Field Protocols to Measure Individual Shrubs’ Root Density Distribution. Plant Soil 2022, 481, 691–699. [Google Scholar] [CrossRef]
  39. Li, T.; Wu, X.-C.; Wu, Y.; Li, M.-Y. Forest Carbon Density Estimation Using Tree Species Diversity and Stand Spatial Structure Indices. Forests 2023, 14, 1105. [Google Scholar] [CrossRef]
  40. Li, Y.; Li, H.; Zhang, W.; Chen, B.; Yang, L.; Li, M.; Zhu, J.; Cai, Q. The Effects of Thinning on Tree Growth and Stand Biomass in a Chronosequence of Pinus tabulaeformis Plantations in the Loess Plateau of China. Forests 2023, 14, 1620. [Google Scholar] [CrossRef]
  41. Hu, Y.W.; Shi, Z.L.; Liu, C.; Xu, Q.T.; Zhang, J.J. Effects of stand densities on understory vegetation diversity and soil physicochemical properties of Robinia pseudoacacia forest in loess region of western Shanxi Province. Chin. J. Ecol. 2023, 42, 2072–2080. [Google Scholar]
  42. Sun, L.N. Study on Spatial Pattern and Driving Factors of Forests Biomass Carbon Density in Shanxi Province, China. Ph.D. Thesis, Shanxi University, Taiyuan, China, 2020. [Google Scholar]
  43. Yadav, R.P.; Gupta, B.; Bhutia, P.L.; Bisht, J.K.; Pattanayak, A. Biomass and Carbon Budgeting of Land Use Types along Elevation Gradient in Central Himalayas. J. Clean. Prod. 2019, 211, 1284–1298. [Google Scholar] [CrossRef]
  44. Kralicek, K.; Huy, B.; Poudel, K.P.; Temesgen, H.; Salas, C. Simultaneous Estimation of Above- and Below-Ground Biomass in Tropical Forests of Viet Nam. For. Ecol. Manag. 2017, 390, 147–156. [Google Scholar] [CrossRef]
  45. Bolat, İ. The Effect of Thinning on Microbial Biomass C, N and Basal Respiration in Black Pine Forest Soils in Mudurnu, Turkey. Eur. J. For. Res. 2014, 133, 131–139. [Google Scholar] [CrossRef]
  46. Xue, L.; Pan, L.; Zhang, R.; Xu, P. Density Effects on the Growth of Self-Thinning Eucalyptus urophylla Stands. Trees 2011, 25, 1021–1031. [Google Scholar] [CrossRef]
  47. Dai, L.L.; Zhou, L.L.; Wu, L.H.; Liu, L.; Huang, Y.; Peng, T.T.; Qiu, J.; He, Z.M.; Cao, G.M. Carbon density and vertical spatial distribution characteristics of Cunninghamia lanceolata forest ecosystem with different stand density. Acta Ecol. Sin. 2022, 42, 710–719. [Google Scholar] [CrossRef]
  48. Lado-Monserrat, L.; Lidón, A.; Bautista, I. Erratum to: Litterfall, Litter Decomposition and Associated Nutrient Fluxes in Pinus halepensis: Influence of Tree Removal Intensity in a Mediterranean Forest. Eur. J. For. Res. 2016, 135, 203–214. [Google Scholar] [CrossRef]
  49. Zhao, M.; Liu, S.; Sun, Y.; Chen, Y. Does Stand Density Affect Understory Vegetation and Soil Properties of Differently Aged Robinia pseudoacacia Plantations? For. Ecol. Manag. 2023, 548, 121444. [Google Scholar] [CrossRef]
  50. Zhang, Z.Y.; Wang, Y.H.; Tian, A.; Liu, Z.B.; Guo, J.B.; Yu, P.T.; Wang, X.; Yu, Y.P. Spatiotemporal characteristics and environmental response of vegetation carbon densities of Larix principis-rupprechtii plantations in the Liupan mountains of Ningxia, China. Sci. Silv. Sin. 2023, 59, 32–45. [Google Scholar]
  51. Li, C.; Zha, T.; Liu, J.; Jia, X. Carbon and Nitrogen Distribution across a Chronosequence of Secondary Lacebark Pine in China. For. Chron. 2013, 89, 192–198. [Google Scholar] [CrossRef]
  52. Kim, C.; Jeong, J.; Cho, H.-S.; Son, Y. Carbon and Nitrogen Status of Litterfall, Litter Decomposition and Soil in Even-Aged Larch, Red Pine and Rigitaeda Pine Plantations. J. Plant Res. 2010, 123, 403–409. [Google Scholar] [CrossRef]
  53. Liu, S. Storage and Key Soil Cycling Processes of Carbon and Nitrogen among Typical Forest Ecosystems in the Subalpine Area of Western Sichuan. Ph.D. Thesis, Chinese Academy of Forestry, Beijing, China, 2019. [Google Scholar]
  54. Xu, S.; Su, F.; Sayer, E.J.; Lam, S.K.; Lu, X.; Liu, C.; Lai, D.Y.F. Fine Root Litter Quality Regulates Soil Carbon Storage Efficiency in Subtropical Forest Soils. Soil Ecol. Lett. 2023, 5, 230182. [Google Scholar] [CrossRef]
  55. Zhao, M.; Li, Y.; Wang, Y.; Sun, Y.; Chen, Y. High Stand Density Promotes Soil Organic Carbon Sequestration in Robinia pseudoacacia Plantations in the Hilly and Gully Region of the Loess Plateau in China. Agric. Ecosyst. Environ. 2023, 343, 108256. [Google Scholar] [CrossRef]
  56. Wang, H.; Liu, W.; Wang, W.; Zu, Y. Influence of Long-Term Thinning on the Biomass Carbon and Soil Respiration in a Larch (Larix gmelinii) Forest in Northeastern China. Sci. World J. 2013, 2013, 865645. [Google Scholar] [CrossRef]
  57. Noh, N.J.; Kim, C.; Bae, S.W.; Lee, W.K.; Yoon, T.K.; Muraoka, H.; Son, Y. Carbon and Nitrogen Dynamics in a Pinus densiflora Forest with Low and High Stand Densities. J. Plant Ecol. 2013, 6, 368–379. [Google Scholar] [CrossRef]
Figure 1. Distribution of sampling sites of biomass in the Cai Jiachuan Watershed, China.
Forests 15 01242 g001
Figure 2. Schematic diagram of the principle of the fishing rod method.
Forests 15 01242 g002
Figure 3. Sample plot schematic. The black border indicates tree sample plots, the red border indicates shrub sample plots, the green border indicates herb sample plots, and the corresponding color numbers indicate the size of each type of sample plot. The red pentagram indicates the location of the sample centre.
Forests 15 01242 g003
Figure 4. Aboveground biomass of R. pseudoacacia at different densities. Different letters denote significant differences (p < 0.05) among the different densities. (A) The leaf biomass of R. pseudoacacia; (B) the branch biomass of R. pseudoacacia; (C) the stem biomass of R. pseudoacacia; (D) the total aboveground biomass of R. pseudoacacia; (D1) 900–1400 trees ha−1; (D2) 1401−1900 trees ha−1; (D3) 1901−2400 trees ha−1; (D4) 2401−2900 trees ha−1; (D5) 2901−3400 trees ha−1.
Forests 15 01242 g004
Figure 5. Aboveground biomass of R. pseudoacacia sample plots with different densities. Different letters denote significant differences (p < 0.05) among the different densities. (A) The aboveground biomass of shrub; (B) the aboveground biomass of herb; (C) the aboveground biomass of shrub and herb; (D) the total aboveground biomass of the sample plot; (D1) 900–1400 trees ha−1; (D2) 1401–1900 trees ha−1; (D3) 1901–2400 trees ha−1; (D4) 2401–2900 trees ha−1; (D5) 2901–3400 trees ha−1.
Forests 15 01242 g005
Figure 6. Belowground biomass of R. pseudoacacia sample plots at different densities. Different letters denote significant differences (p < 0.05) among the different densities. (A) The coarse root biomass of R. pseudoacacia; (B) the fine root biomass of R. pseudoacacia; (C) the total belowground biomass of R. pseudoacacia; (D) the belowground biomass of shrubs and herbs; (E) the total belowground biomass of the sample plots; (D1) 900–1400 trees ha−1; (D2) 1401–1900 trees ha−1; (D3) 1901–2400 trees ha−1; (D4) 2401–2900 trees ha−1; (D5) 2901–3400 trees ha−1.
Forests 15 01242 g006
Figure 7. Total biomass of sample plots at different densities. Different letters denote significant differences (p < 0.05) among the different densities. (A) The total biomass of R. pseudoacacia; (B) the total biomass of shrubs and herbs; (C) the total biomass of the sample plots; (D1) 900–1400 trees ha−1; (D2) 1401–1900 trees ha−1; (D3) 1901–2400 trees ha−1; (D4) 2401–2900 trees ha−1; (D5) 2901–3400 trees ha−1.
Forests 15 01242 g007
Figure 8. Carbon stocks of litter, soil, and total carbon at different densities. (A) The carbon stock of litter; (B) the carbon stock of soil; (C) the total carbon stock of the sample plots; (D1) 900–1400 trees ha−1; (D2) 1401–1900 trees ha−1; (D3) 1901–2400 trees ha−1; (D4) 2401–2900 trees ha−1; (D5) 2901–3400 trees ha−1. Different letters denote significant differences (p < 0.05) among the different densities.
Forests 15 01242 g008
Table 1. The basic characteristics of sample plots.
Density Gradient
/(trees ha−1)
Current Density
/(trees ha−1)
DBH
/(cm)
H
/(m)
Slope
/(°)
Age
/(a)
Orientation
/(°)
D1 (n = 11)900−140013.22 ± 1.92 a10.30 ± 0.22 a20–3030NW-NE
D2 (n = 15)1401−190011.62 ± 1.23 ab9.75 ± 0.29 a20–3030NW-NE
D3 (n = 13)1901−240011.40 ± 1.29 ab9.12 ± 0.31 a20–3030NW-NE
D4 (n = 8)2401−290010.59 ± 0.83 ab9.01 ± 0.27 a20–3030NW-NE
D5 (n = 2)2901−34009.79 ± 0.74 b8.87 ± 0.79 a20–3030NW-NE
Note: Values after ± sign are standard deviations. Different letters denote significant differences (p < 0.05) among the different densities.
Table 2. The relationship between organs, total biomass and DBH fitting of standard wood of R. pseudoacacia.
TypeOrganFitted ModelAdjusted R2Number of Fitted SamplesNumber of Samples for VerificationError
ILeafW = 0.0011(DBH2H))1.00800.70341521.46%
BranchW = 0.01(DBH2H))0.840.72341526.15%
StemW = 0.19(DBH2H))0.690.79341511.71%
RootW = 0.03(DBH2H))0.780.81341523.50%
TotalW = 0.28(DBH2H))0.700.90341510.55%
IILeafW = 0.0014(1 + DBH)2.79570.73341521.62%
BranchW = 0.02(1 + DBH)2.350.75341524.34%
StemW = 0.25(1 + DBH)1.880.76341513.37%
RootW = 0.13(1 + DBH)1.720.84341521.65%
TotalW = 0.35(1 + DBH)1.940.89341510.59%
Table 3. Aboveground biomass of individual R. pseudoacacia at different densities.
Density
Gradient
/(trees ha−1)
Current
Density
/(trees ha−1)
Leaf
/(kg)
Branch
/(kg)
Stem
/(kg)
The Total
Aboveground
/(kg)
D1 (n = 11)900–14002.97 ± 0.37 a11.32 ± 1.08 a38.66 ± 3.30 a52.95 ± 4.53 a
D2 (n = 15)1401–19002.09 ± 0.15 ab8.68 ± 0.54 ab30.15 ± 1.57 ab40.92 ± 2.26 ab
D3 (n = 13)1901–24001.76 ± 0.16 b7.30 ± 0.47 bc26.58 ± 1.74 bc35.63 ± 2.36 bc
D4 (n = 8)2401–29001.37 ± 0.10 b5.96 ± 0.35 bc21.97 ± 1.06 bc29.29 ± 1.50 bc
D5 (n = 2)2901–34001.22 ± 0.41 b5.25 ± 1.44 c19.40 ± 4.05 c25.86 ± 5.90 c
Note: Values after ± sign are standard deviations. Different letters denote significant differences (p < 0.05) among the different densities.
Table 4. Belowground biomass of individual R. pseudoacacia at different densities.
Density
Gradient
/(trees ha−1)
Current
Density
/(trees ha−1)
Coarse
/(kg)
Fine
/(kg)
The Total
Belowground
/(kg)
The Total
/(kg)
D1 (n = 11)900–140010.25 ± 0.99 a2.65 ± 0.23 a12.89 ± 0.99 a62.68 ± 4.32 a
D2 (n = 15)1401–19007.73 ± 0.45 ab2.90 ± 0.15 a10.63 ± 0.49 ab51.55 ± 2.73 ab
D3 (n = 13)1901–24006.71 ± 0.50 b2.07 ± 0.16 ab8.78 ± 0.49 bc44.41 ± 2.83 bc
D4 (n = 8)2401–29005.43 ± 0.30 b1.72 ± 0.19 b7.16 ± 0.39 c36.46 ± 1.85 bc
D5 (n = 2)2901–34004.78 ± 1.18 b1.38 ± 0.16 b6.17 ± 1.35 c32.02 ± 7.25 c
Note: Values after ± sign are standard deviations. Different letters denote significant differences (p < 0.05) among the different densities.
Table 5. Biomass ratios of various organs in R. pseudoacacia sample plots at different densities.
Density
(trees ha−1)
Leaf
Biomass
(t ha−1)
Branch Biomass
(t ha−1)
Stem
Biomass
(t ha−1)
Coarse Root
Biomass
(t ha−1)
Fine Root
Biomass
(t ha−1)
R. pseudoacacia Biomass
(t ha−1)
900–14003.02 (4.21%)12.91 (18.00%)41.78 (58.25%)10.87 (15.16%)3.15 (4.38%)71.72
1401–19003.08 (3.98%)12.88 (16.66%)45.28 (58.58%)11.53 (14.92%)4.53 (5.86%)77.30
1901–24003.21 (3.83%)13.84 (16.51%)49.97 (59.60%)12.51 (14.92%)4.31 (5.14%)83.84
2401–29003.56 (3.79%)15.40 (16.39%)56.25 (59.87%)13.99 (14.89%)4.75 (5.06%)93.96
2901–34003.79 (3.78%)16.38 (16.34%)60.75 (60.62%)14.95 (14.92%)4.35 (4.34%)100.22
Note: Values in parentheses represent the percentage of the total in the respective row.
Table 6. Biomasss ratio of R. pseudoacacia at different densities.
Density
(trees ha−1)
Aboveground or BelowgroundShrub
(t ha−1)
Herb
(t ha−1)
R. pseudoacacia
(t ha−1)
Total
(t ha−1)
900–1400Aboveground biomass2.69 (4.30%)2.15 (3.44%)57.70 (92.26%)62.54
Belowground biomass0.54 (3.71%)14.02 (96.29%)14.56
Total biomass5.38 (6.98%)71.72 (93.02%)77.10
1401–1900Aboveground biomass3.20 (4.84%)1.60 (2.42%)61.24 (92.74%)66.04
Belowground biomass0.96 (5.64%)16.06 (94.36%)17.02
Total biomass5.76 (6.93%)77.3 (93.07%)83.06
1901–2400Aboveground biomass1.18 (1.68%)1.84 (2.63%)67.02 (95.69%)70.04
Belowground biomass1.03 (5.77%)16.83 (94.23%)17.86
Total biomass4.06 (4.62%)83.84 (95.38%)87.90
2401–2900Aboveground biomass1.23 (1.58%)1.65 (2.11%)75.21 (96.31%)78.09
Belowground biomass0.58 (3.00%)18.75 (97.00%)19.33
Total biomass3.47 (3.56%)93.95 (96.44%)97.42
2901–3400Aboveground biomass1.05 (1.27%)0.57 (0.69%)80.91 (98.04%)82.53
Belowground biomass1.09 (5.34%)19.30 (94.66%)20.39
Total biomass2.71 (2.63%)100.21 (97.37%)102.92
Note: Values in parentheses represents the total percentage in the respective rows.
Table 7. Carbon stock ratios of vegetation, soil, and litter of R. pseudoacacia forests at different densities.
Density
(trees ha−1)
Vegetation
(t ha−1)
Soil Organic Carbon
(t ha−1)
Litter
(t ha−1)
Total
(t ha−1)
900−140038.37 (45.92%)43.23 (51.74%)1.96 (2.34%)83.56
1401−190041.34 (49.60%)39.79 (47.74%)2.22 (2.66%)83.35
1901−240043.82 (51.82%)38.29 (45.28%)2.45 (2.90%)84.56
2401−290048.60 (53.38%)39.78 (43.69%)2.67 (2.93%)91.05
2901−340051.37 (49.78%)48.84 (47.34%)2.97 (2.88%)103.19
Note: Values in parentheses represent percentage of the total in the respective row.
Disclaimer/Publisher’s Note: The statements, opinions and data contained in all publications are solely those of the individual author(s) and contributor(s) and not of MDPI and/or the editor(s). MDPI and/or the editor(s) disclaim responsibility for any injury to people or property resulting from any ideas, methods, instructions or products referred to in the content.

