
Interactive Effects of Salinity and Hydrology on Radial Growth of Bald Cypress (Taxodium distichum (L.) Rich.) in Coastal Louisiana, USA

Abstract
:1. Introduction
2. Methods
2.1. Site Selection
2.2. Forest Plots
2.3. Statistical Analyses
3. Results
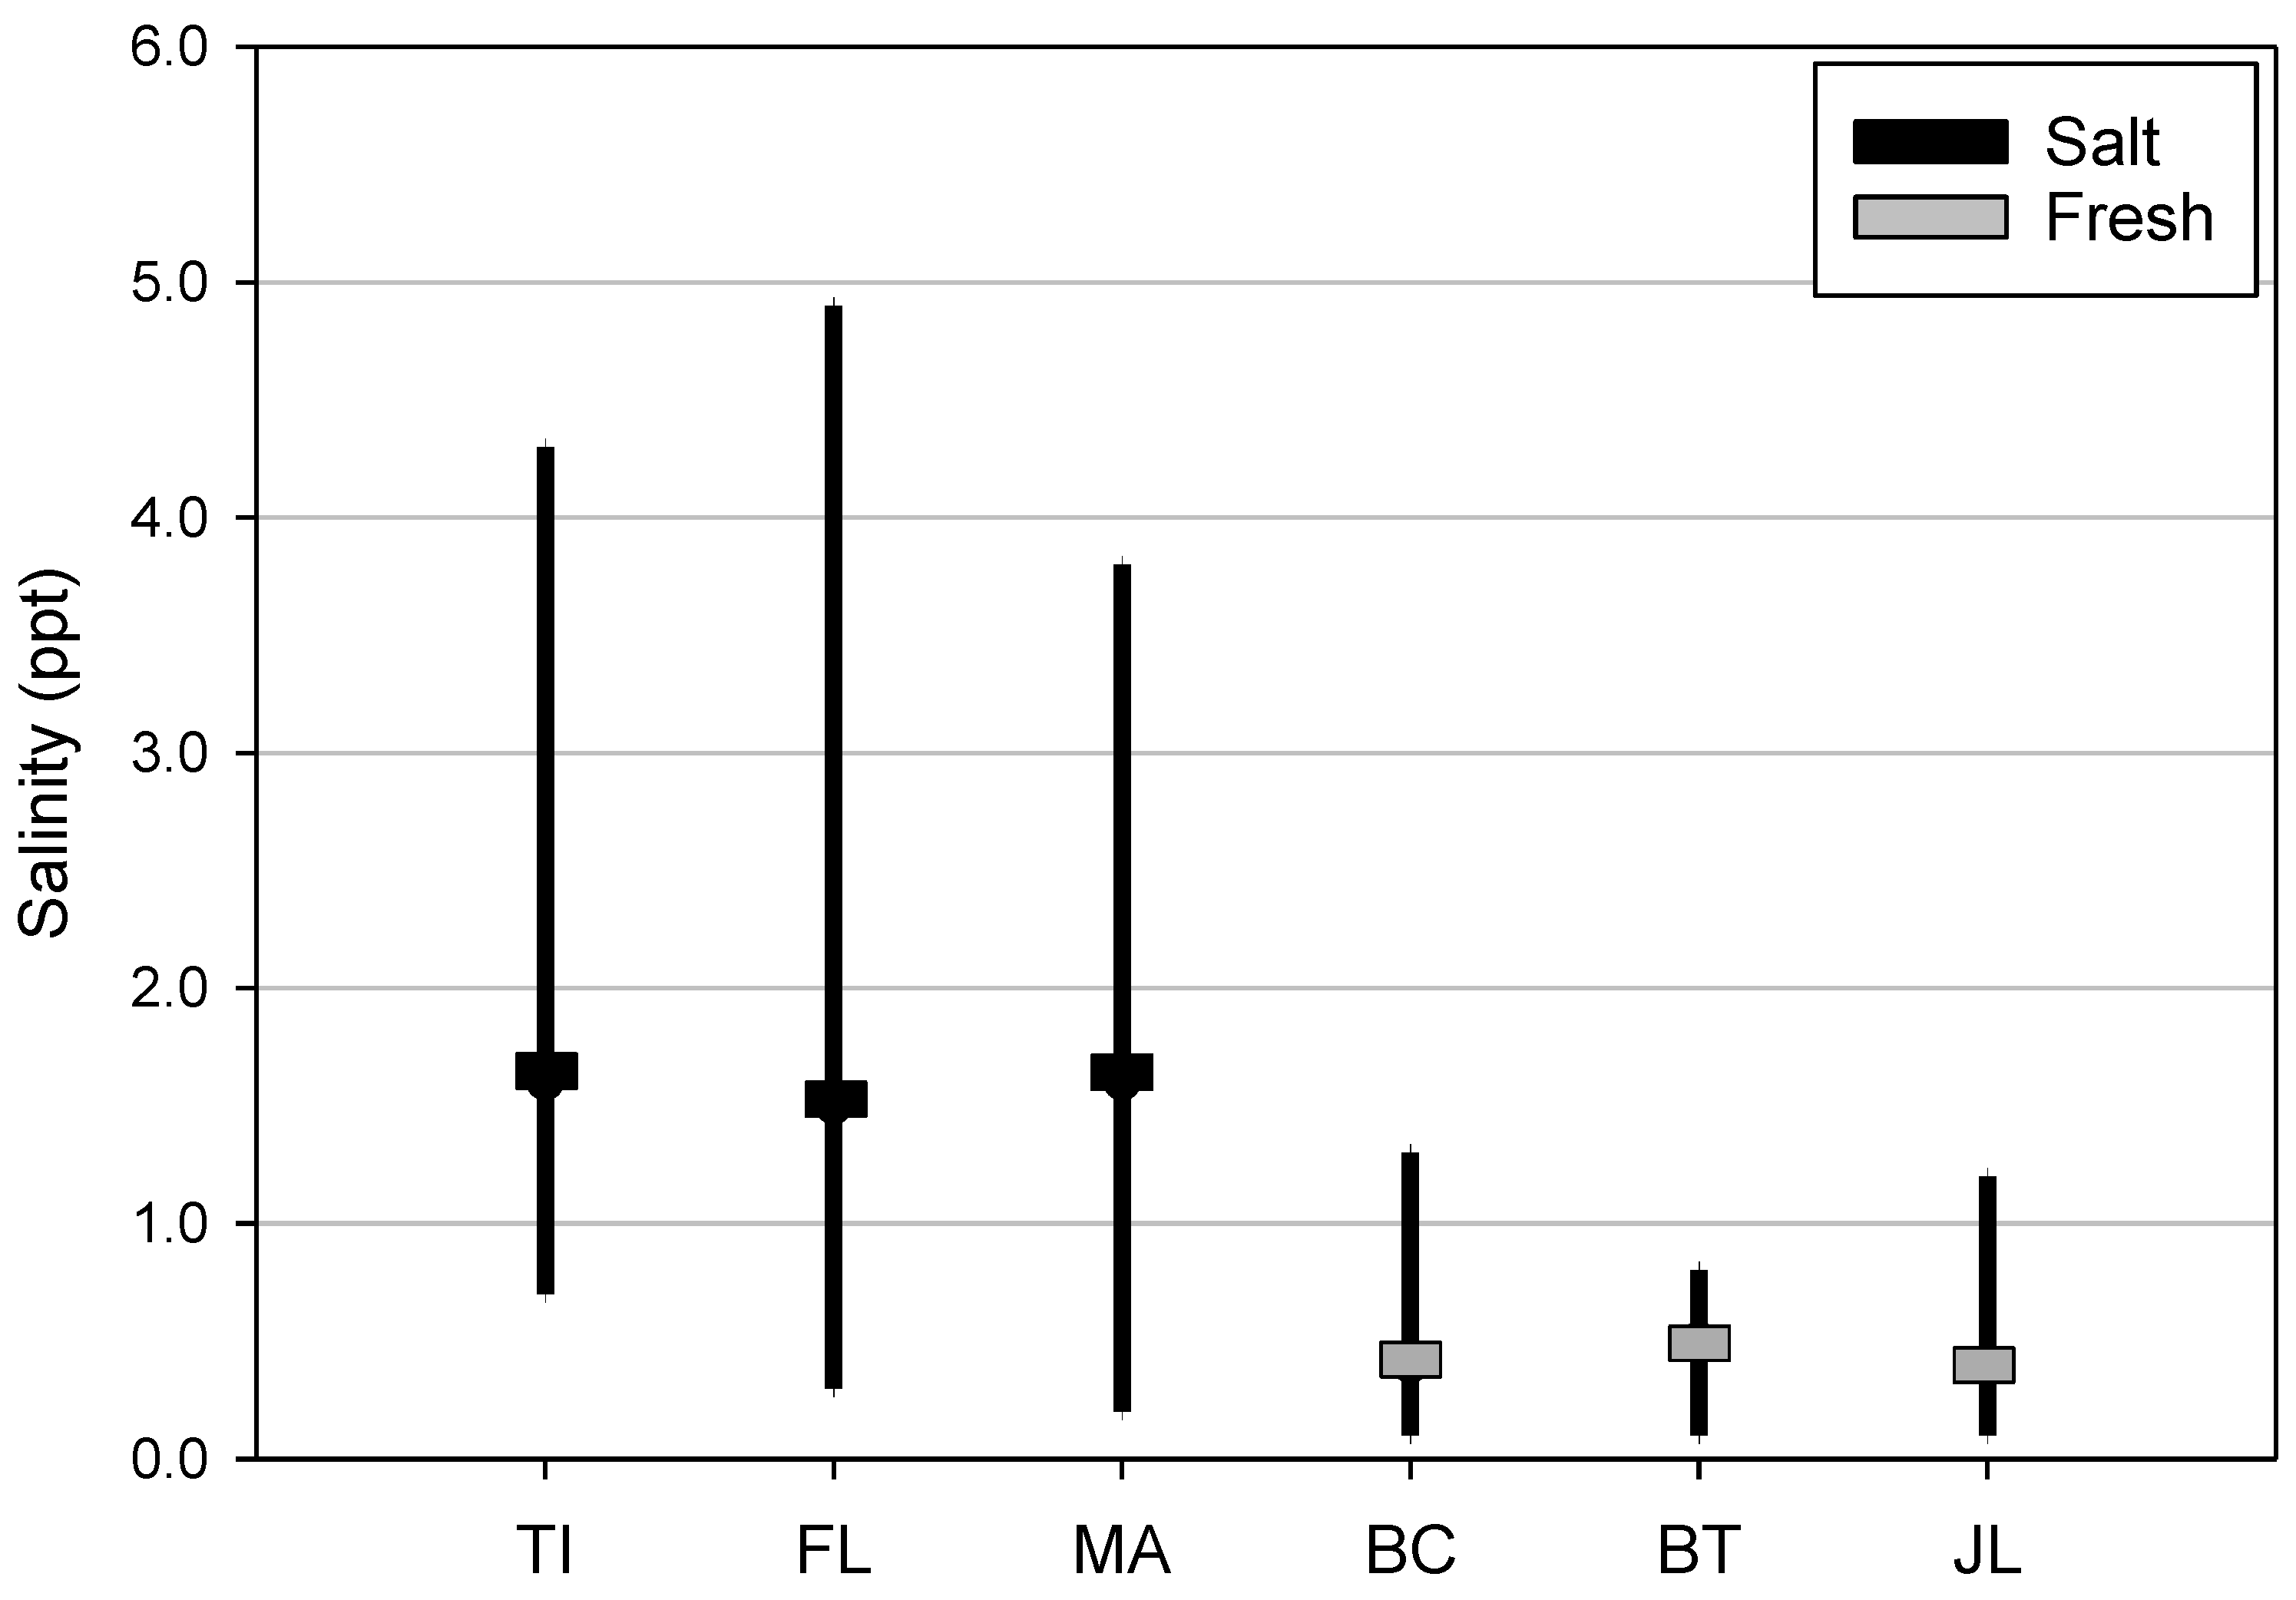
3.1. Salinity
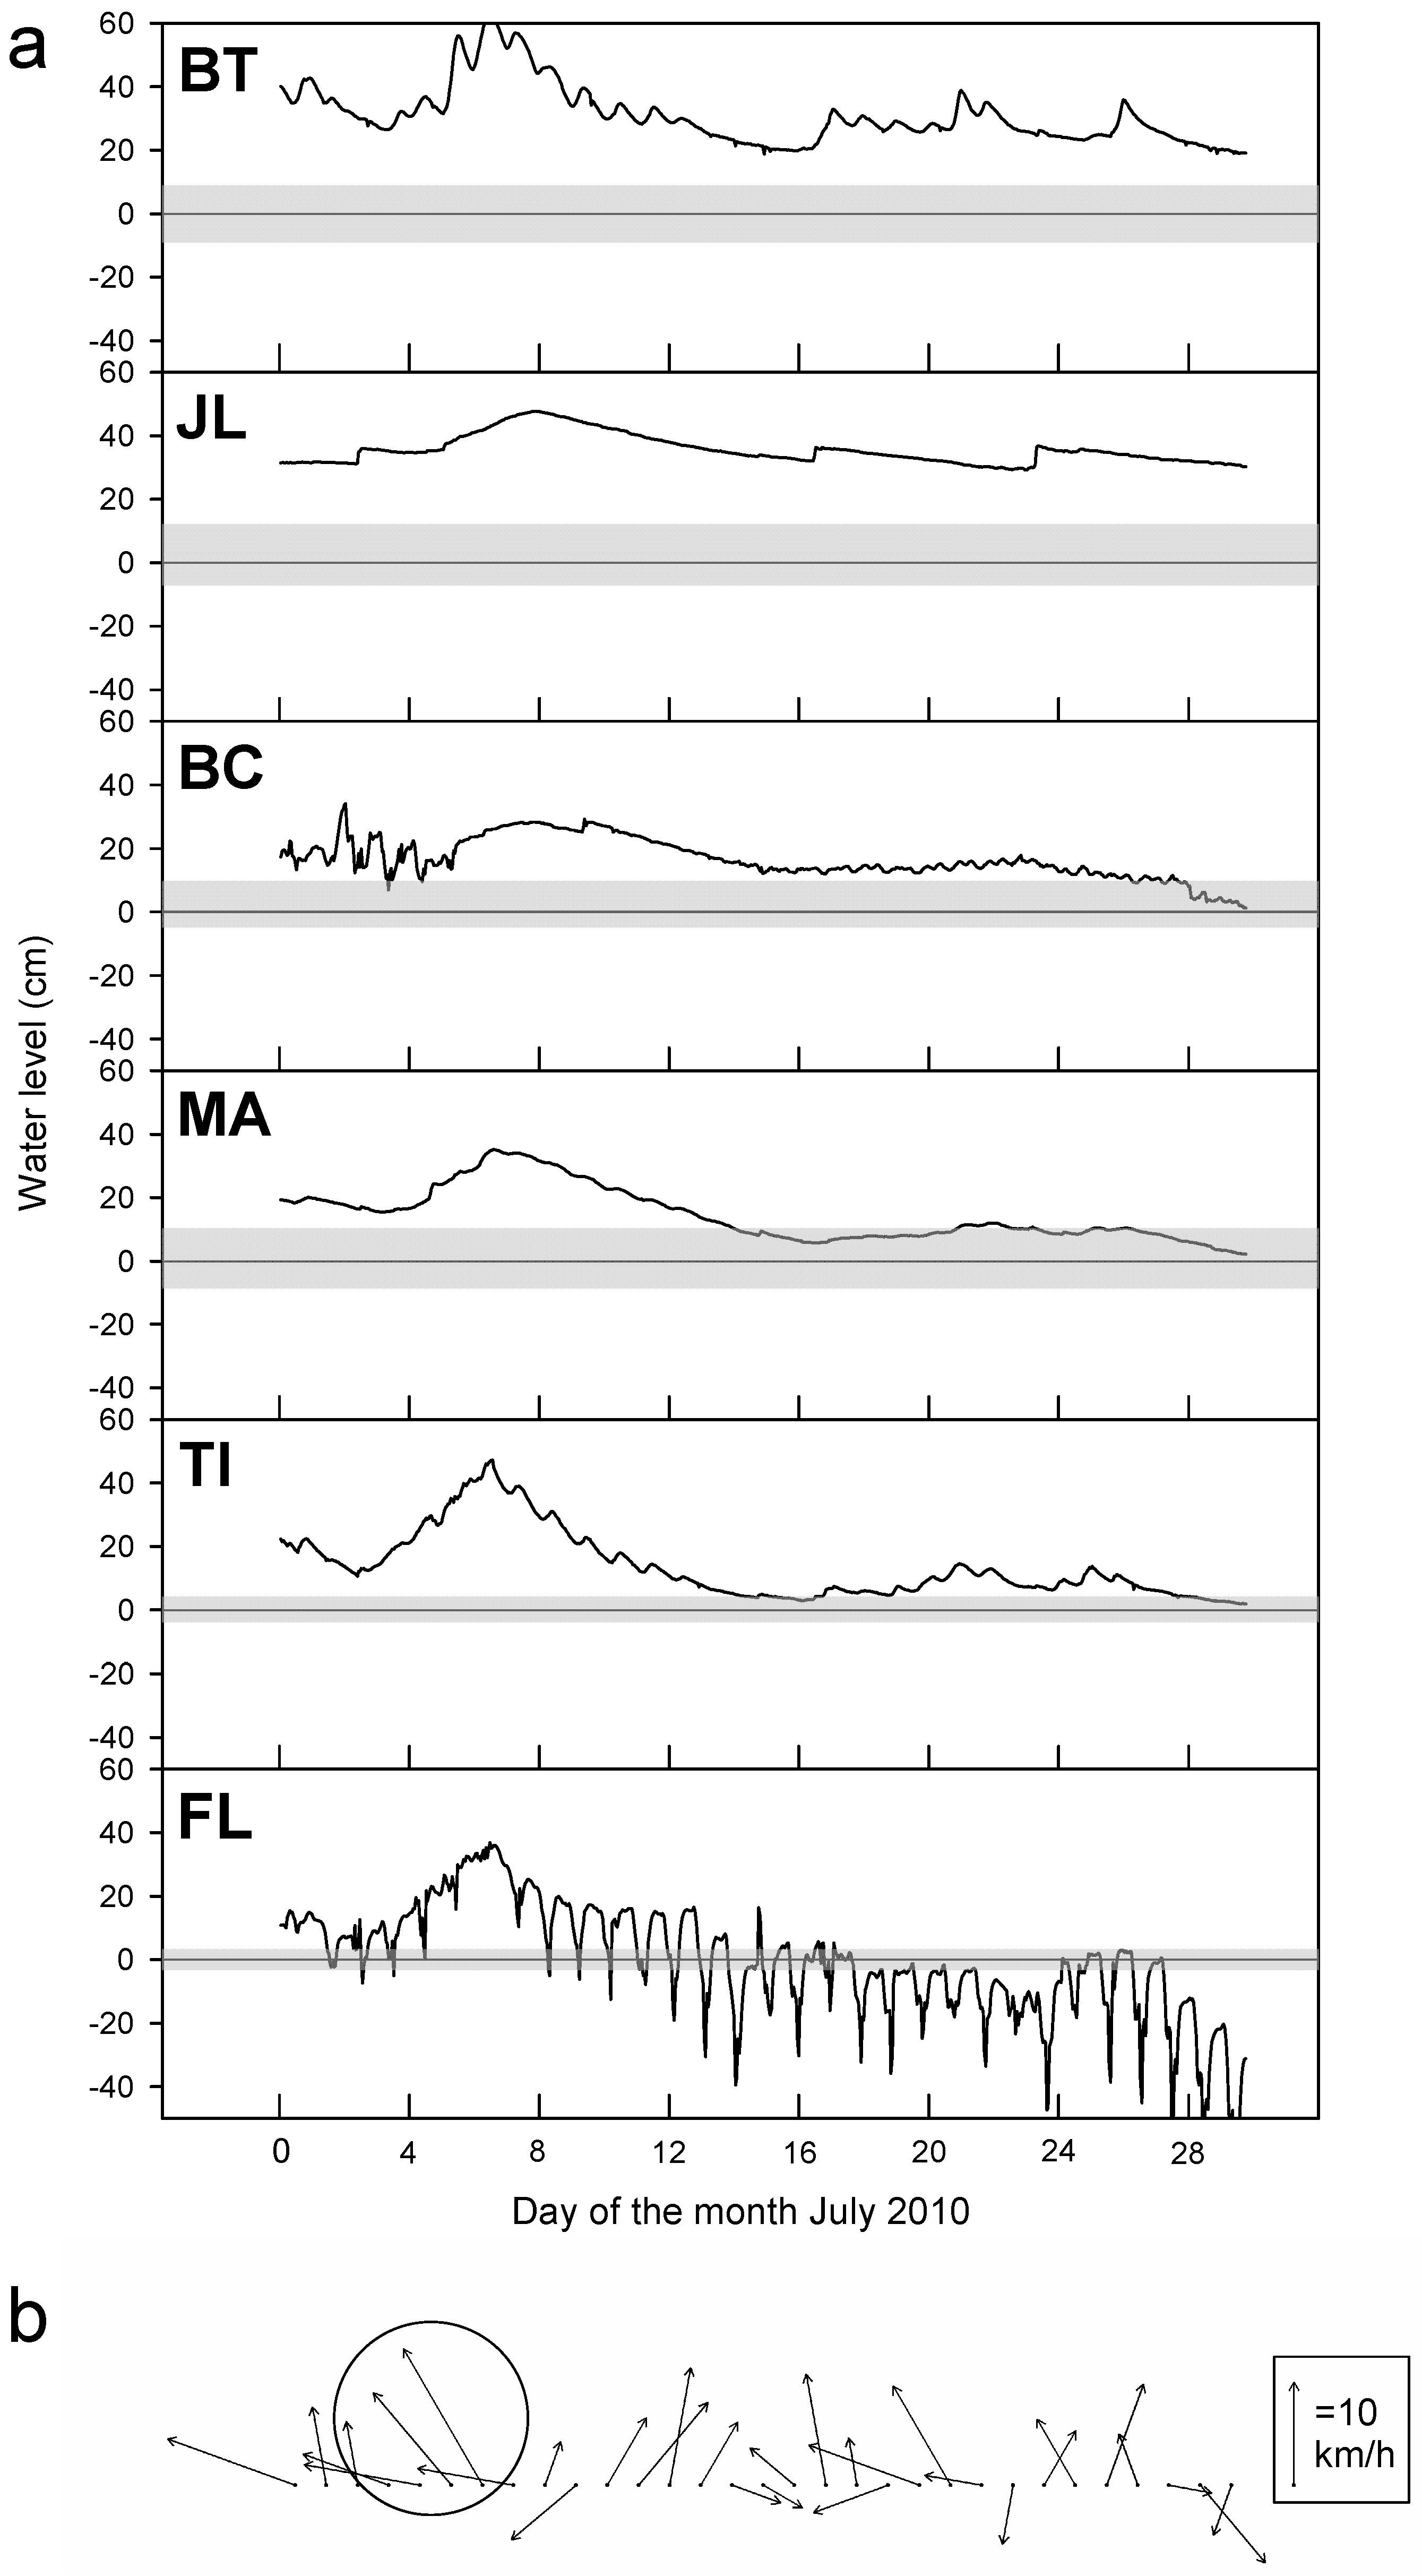
3.2. Hydrology
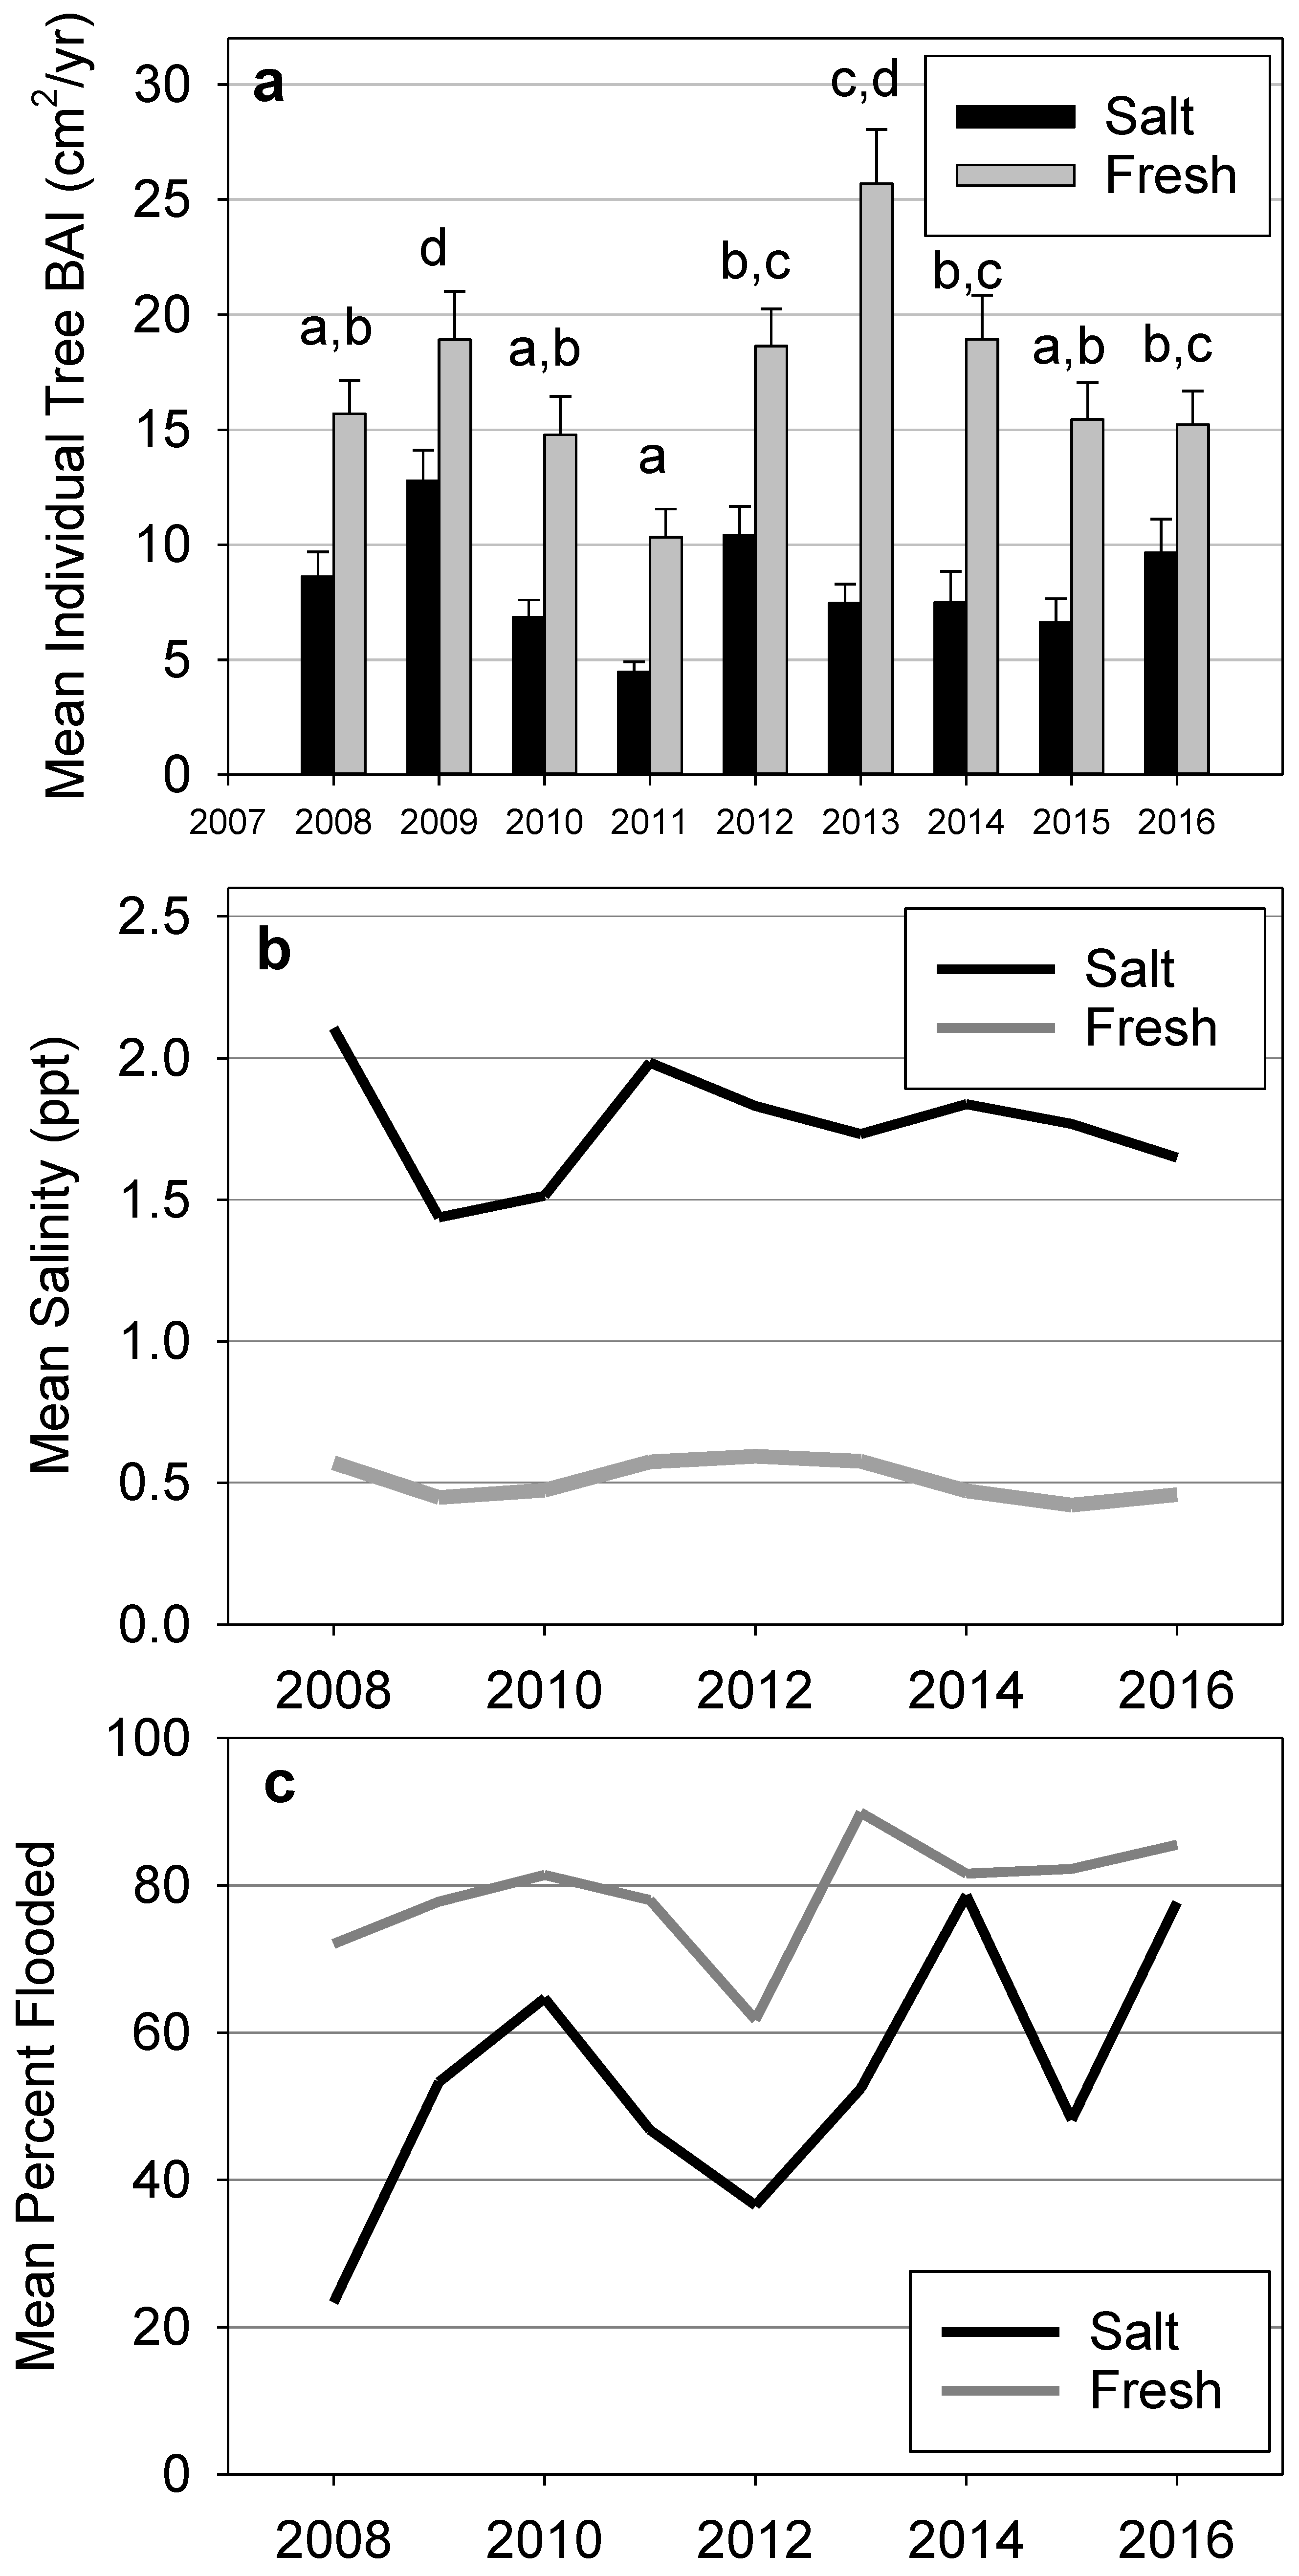
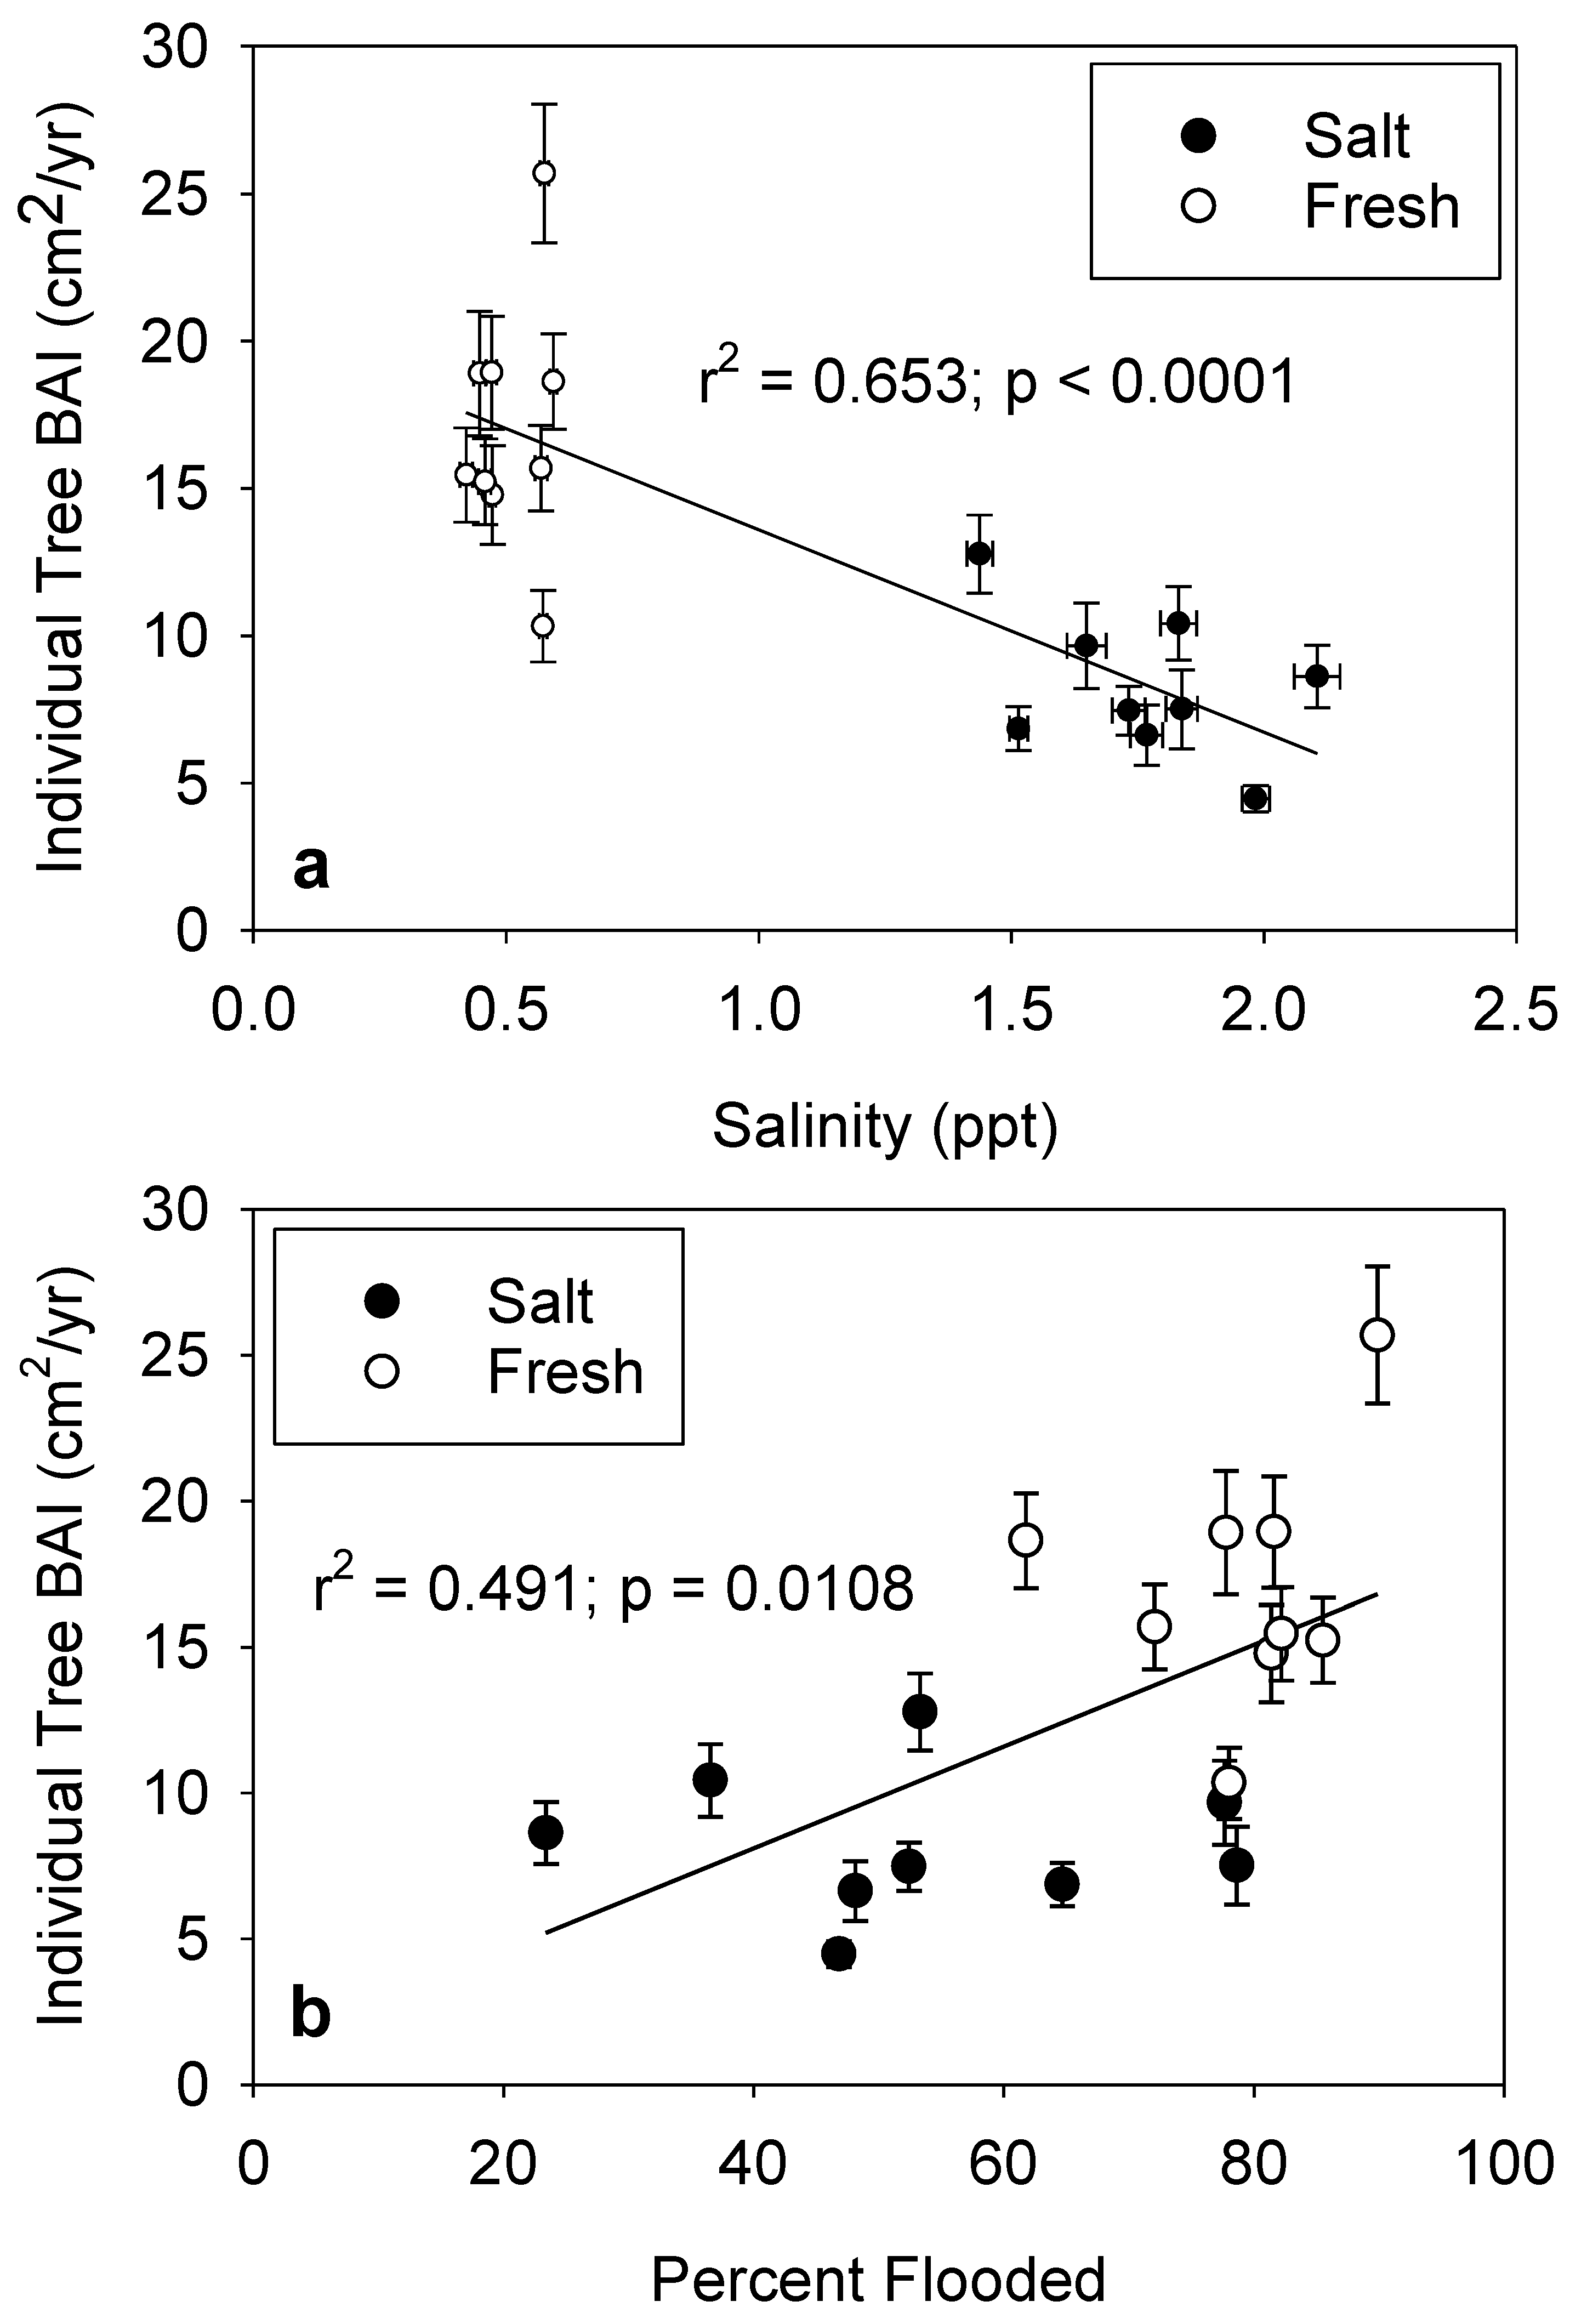
3.3. Radial Growth
4. Discussion
4.1. Salinity Effects
4.2. Flooding Effects
4.3. Radial Growth Patterns
5. Conclusions
Author Contributions
Funding
Data Availability Statement
Acknowledgments
Conflicts of Interest
References
- Doyle, T.W.; Conner, W.H.; Ratard, M.; Inabinette, L.W. Assessing the impact of tidal flooding and salinity on long-term growth of baldcypress under changing climate and riverflow. In Ecology of Tidal Freshwater Forested Wetlands of the Southeastern United States; Conner, W.H., Doyle, T.W., Krauss, K.W., Eds.; Springer: Dordrecht, The Netherlands, 2007; pp. 411–445. [Google Scholar]
- Conner, W.H.; Flynn, K. Growth and survival of baldcypress (Taxodium distichum[L.] Rich.) planted across a flooding gradient in a Louisiana bottomland forest. Wetlands 1989, 9, 207–217. [Google Scholar] [CrossRef]
- Penfound, W.T.; Hathaway, E.S. Plant communities in the marshlands of Southeastern Louisiana. Ecol. Monogr. 1938, 8, 1–56. [Google Scholar] [CrossRef]
- Conner, W.H.; McLeod, K.W.; McCarron, J.K. Flooding and salinity effects on growth and survival of four common forested wetland species. Wetl. Ecol. Man. 1997, 5, 99–109. [Google Scholar] [CrossRef]
- Krauss, K.W.; Duberstein, J.A.; Doyle, T.W.; Conner, W.H.; Day, R.H.; Inabinette, L.W.; Whitbeck, J.L. Site condition, structure, and growth of baldcypress along tidal/non-tidal salinity gradients. Wetlands 2009, 29, 505–519. [Google Scholar] [CrossRef]
- Day, R.H.; Williams, T.M.; Swarzenski, C.M. Hydrology of tidal freshwater forested wetlands of the southeastern United States. In Ecology of Tidal Freshwater Forested Wetlands of the Southeastern United States; Conner, W.H., Doyle, T.W., Krauss, K.W., Eds.; Springer: Dordrecht, The Netherlands, 2007; pp. 29–63. [Google Scholar]
- Conner, W.H.; Day, J.W., Jr. Rising water levels in coastal Louisiana: Implications for two coastal forested wetland areas in Louisiana. J. Coast. Res. 1988, 4, 589–596. Available online: http://www.jstor.org/stable/4297461 (accessed on 9 August 2022).
- Conner, W.H.; Toliver, J.R. Long-term trends in the bald-cypress (Taxodium distichum) resource in Louisiana (U.S.A.). For. Ecol. Manag. 1990, 33/34, 543–557. [Google Scholar] [CrossRef]
- Shaffer, G.P.; Wood, W.B.; Hoeppner, S.S.; Perkins, T.E.; Zoller, J.; Kandalepas, D. Degradation of baldcypress–water tupelo swamp to marsh and open water in Southeastern Louisiana, U.S.A.: An irreversible trajectory? J. Coast. Res 2009, SI54, 152–165. Available online: https://www.jstor.org/stable/25737476 (accessed on 15 June 2024). [CrossRef]
- Craig, N.J.; Turner, R.E.; Day, J.W. Land loss in coastal Louisiana (U.S.A.). Environ. Manag. 1979, 3, 133–144. [Google Scholar] [CrossRef]
- Swarzenski, C.M. The Gulf Intracoastal Waterway as a distributary of freshwater to coastal Louisiana wetlands [abs.]. In USGS Gulf Coast Science Conference and Florida Integrated Science Center Meeting: Proceedings with Abstracts, Orlando, FL, USA, 20–23 October 2008; Lavoie, D.L., Rosen, B.H., Sumner, D.M., Haag, K.H., Tihansky, A.B., Boynton, B., Koenig, R.R., Eds.; U.S. Geological Survey Open-File Report 2008-1329; USGS: Reston, VA, USA, 2008; p. 87. Available online: https://pubs.usgs.gov/of/2008/1329/ (accessed on 11 August 2022).
- Swarzenski, C.M.; Perrien, S.M. Discharge, suspended sediment, and salinity in the Gulf Intracoastal Waterway and adjacent surface waters in south-central Louisiana, 1997–2008; U.S. Geological Survey Scientific Investigations Report 2015–5132; USGS: Reston, VA, USA, 2015; 21p. [Google Scholar] [CrossRef]
- USACE. U.S. Army Corps of Engineers, New Orleans District Website. Old River Control. 2023. Available online: https://www.mvn.usace.army.mil/Missions/Recreation/Old-River-Control/ (accessed on 20 October 2023).
- Keeland, B.D.; Sharitz, R.R. Accuracy of tree growth measurements using dendrometer bands. Can. J. For. Res. 1993, 23, 2454–2457. [Google Scholar] [CrossRef]
- Allen, J.A.; Chambers, J.L.; McKinney, D. Intraspecific variation in the response of Taxodium distichum seedlings to salinity. For. Ecol. Manage. 1994, 70, 203–214. [Google Scholar] [CrossRef]
- Allen, J.A.; Chambers, J.L.; Pezeshki, S.R. Effects of salinity on baldcypress seedlings: Physiological responses and their relation to salinity tolerance. Wetlands 1997, 17, 310–320. [Google Scholar] [CrossRef]
- Allen, J.A.; Chambers, J.L.; Stine, M. Prospects for increasing the salt tolerance of forest trees: A review. Tree Physiol. 1994, 74, 843–853. [Google Scholar] [CrossRef] [PubMed]
- Pezeshki, S.R.; Delaune, R.D.; Patrick, W.H. Response of baldcypress (Taxodium distichum L. var. distichum) to increases in flooding salinity in Louisiana’s Mississippi River deltaic plain. Wetlands 1987, 7, 1–10. [Google Scholar] [CrossRef]
- Stiller, V. Soil salinity and drought alter wood density and vulnerability to xylem cavitation of baldcypress (Taxodium distichum (L.) Rich.) seedlings. Env. Exp. Bot. 2009, 67, 164–171. [Google Scholar] [CrossRef]
- Petek-Petrik, A.; Petrík, P.; Lamarque, L.J.; Cochard, H.; Burlett, R.; Delzon, S. Drought survival in conifer species is related to the time required to cross the stomatal safety margin. J. Exp. Bot. 2023, 74, 6847–6859. [Google Scholar] [CrossRef]
- Krauss, K.W.; Duberstein, J.A. Sapflow and water use of freshwater wetland trees exposed to saltwater incursion in a tidally influenced South Carolina watershed. Can. J. For. Res. 2010, 40, 525–535. [Google Scholar] [CrossRef]
- Middleton, B.A.; David, J.L. Trends in vegetation and height of the topographic surface in a tidal freshwater swamp experiencing rooting zone saltwater intrusion. Ecol. Ind. 2022, 145, 109637. [Google Scholar] [CrossRef]
- Salinas, L.M.; DeLaune, R.D.; Patrick, W.H., Jr. Changes occurring along a rapidly submerging coastal area: Louisiana, USA. J. Coast. Res. 1986, 2, 269–284. Available online: http://www.jstor.org/stable/4297190 (accessed on 9 August 2022).
- Davidson, G.R.; Laine, B.C.; Galicki, S.J.; Threlkeld, S.T. Root-zone hydrology: Why bald cypress in flooded wetlands grow more when it rains. Tree-Ring Res. 2006, 62, 3–12. [Google Scholar] [CrossRef]
- Keim, R.F.; Amos, J.B. Dendrochronological analysis of baldcypress (Taxodium distichum) responses to climate and contrasting flood regimes. Can. J. For. Res. 2012, 42, 423–436. [Google Scholar] [CrossRef]
- Stahle, D.W.; Cleaveland, M.K. Reconstruction and analysis of spring rainfall over the southeastern U.S. for the past 1000 years. Bull. Am. Met. Soc. 1992, 73, 1947–1961. [Google Scholar] [CrossRef]
- Stahle, D.W.; Cleaveland, M.K.; Hehr, J.G. A 450-year drought reconstruction for Arkansas, United States. Nature 1985, 316, 530–532. [Google Scholar] [CrossRef]
- Young, P.J.; Keeland, B.D.; Sharitz, R.R. Growth response of baldcypress [Taxodium distichum (L.) Rich.] to an altered hydrologic regime. Am. Midl. Nat. 1995, 133, 206–212. [Google Scholar] [CrossRef]
- McMahon, S.M.; Parker, G.G. A general model of intra-annual tree growth using dendrometer bands. Ecol. Evol. 2015, 5, 243–254. [Google Scholar] [CrossRef] [PubMed]
- Rathgeber, C.B.K.; Cuny, H.E.; Fonti, P. Biological basis of tree-ring formation: A crash course. Front. Plant Sci. 2016, 7, 734. [Google Scholar] [CrossRef] [PubMed]
- Zweifel, R.; Haeni, M.; Buchmann, N.; Eugster, W. Are trees able to grow in periods of stem shrinkage? New Phytol. 2016, 211, 839–849. [Google Scholar] [CrossRef] [PubMed]
- Keeland, B.D.; Sharitz, R.R. Seasonal growth patterns of Nyssa sylvatica var. biflora, Nyssa aquatica, and Taxodium distichum as affected by hydrologic regime. Can. J. For. Res. 1995, 25, 1084–1096. [Google Scholar] [CrossRef]
- Neufeld, H.S. Effects of light on growth, morphology, and photosynthesis in baldcypress (Taxodium distichum (L.) Rich.) and pondcypress (T. Ascendens Brongn.) seedlings. Bull. Torrey Bot. Club 1983, 110, 43–54. [Google Scholar] [CrossRef]
- Wei, L.; Xu, C.; Jansen, S.; Zhou, H.; Christoffersen, B.O.; Pockman, W.T.; Middleton, R.S.; Marshall, J.D.; McDowell, N.G. A heuristic classification of woody plants based on contrasting shade and drought strategies. Tree Phys. 2019, 39, 767–781. [Google Scholar] [CrossRef]
- Keim, R.F.; Dean, T.J.; Chambers, J.L.; Conner, W.H. Stand density relationships in baldcypress. For. Sci. 2010, 56, 336–343. [Google Scholar] [CrossRef]
- From, A.S.; Day, R.H.; Krauss, K.W. Treeband measurements of Taxodium Distichum in Coastal Louisiana, USA from August 2004 through April 2016. U.S. Geological Survey Data rRelease. 2024. Available online: https://cmerwebmap.cr.usgs.gov/catalog/item/66609a0cd34e16b8573d1430 (accessed on 28 May 2024).


| Banded | |||||
|---|---|---|---|---|---|
| Forest Plot Structure | Bald cypress | ||||
| Mean Forest Height | Mean dbh * | Mean Basal Area | Total Tree Density | Mean dbh * | |
| (m) | (cm) | (m2/ha) | (ind/ha) | (cm) | |
| Fresh | |||||
| Jean Lafitte (JL) | 24.9 ± 0.6 | 29.9 ± 1.3 | 70.61 | 860 | 37.7 ± 2.1 |
| Bayou Teche (BT) | 17.0 ± 1.3 | 30.9 ± 2.5 | 53.35 | 600 | 38.1 ± 3.8 |
| Bayou Chevreuil (BC) | 23.5 ± 0.3 | 26.3 ± 1.1 | 56.19 | 890 | 36.2 ± 1.4 |
| Salt | |||||
| Mandalay (MA) | 19.1 ± 0.8 | 34.5 ± 4.2 | 26.85 | 220 | 44.1 ± 3.7 |
| Fleming (FL) | 18.9 ± 0.6 | 27.9 ± 1.4 | 36.06 | 520 | 33.5 ± 1.9 |
| Treasure Island (TI) | 16.9 ± 0.6 | 23.3 ± 1.1 | 36.89 | 750 | 29.3 ± 1.2 |
| Log (BAI + 1) | |||
|---|---|---|---|
| Source of Variation | d.f. | F-Value | Pr > F |
| Model | 80, 874 | 8.93 | <0.0001 |
| Year | 8, 874 | 6.73 | <0.0001 |
| Site | 5, 874 | 81.45 | <0.0001 |
| Site × Year | 40, 874 | 3.16 | <0.0001 |
| Season | 3, 874 | 15.52 | <0.0001 |
| Season × Year | 24, 874 | 1.03 | 0.4246 |
| Log (BAI + 1) | |||
|---|---|---|---|
| Source of Variation | d.f. | F-Value | Pr > F |
| Model | 3, 41 | 10.50 | <0.0001 |
| Salinity | 1, 41 | 10.38 | 0.0025 |
| Percent Flooded | 1, 41 | 0.43 | 0.5163 |
| Salinity × Percent Flooded | 1, 41 | 4.55 | 0.0389 |
| Mean Salinity | |||
|---|---|---|---|
| Source of Variation | d.f. | F-Value | Pr > F |
| Model | 2, 15 | 188.56 | <0.0001 |
| Type (Salt, Fresh) | 1, 15 | 149.69 | <0.0001 |
| Percent Flooded | 1, 15 | 5.72 | 0.0304 |
Disclaimer/Publisher’s Note: The statements, opinions and data contained in all publications are solely those of the individual author(s) and contributor(s) and not of MDPI and/or the editor(s). MDPI and/or the editor(s) disclaim responsibility for any injury to people or property resulting from any ideas, methods, instructions or products referred to in the content. |
© 2024 by the authors. Licensee MDPI, Basel, Switzerland. This article is an open access article distributed under the terms and conditions of the Creative Commons Attribution (CC BY) license (https://creativecommons.org/licenses/by/4.0/).
Share and Cite
Day, R.H.; From, A.S.; Johnson, D.J.; Krauss, K.W. Interactive Effects of Salinity and Hydrology on Radial Growth of Bald Cypress (Taxodium distichum (L.) Rich.) in Coastal Louisiana, USA. Forests 2024, 15, 1258. https://doi.org/10.3390/f15071258
Day RH, From AS, Johnson DJ, Krauss KW. Interactive Effects of Salinity and Hydrology on Radial Growth of Bald Cypress (Taxodium distichum (L.) Rich.) in Coastal Louisiana, USA. Forests. 2024; 15(7):1258. https://doi.org/10.3390/f15071258
Chicago/Turabian StyleDay, Richard H., Andrew S. From, Darren J. Johnson, and Ken W. Krauss. 2024. "Interactive Effects of Salinity and Hydrology on Radial Growth of Bald Cypress (Taxodium distichum (L.) Rich.) in Coastal Louisiana, USA" Forests 15, no. 7: 1258. https://doi.org/10.3390/f15071258