Article

Spatial Distribution Patterns of the Key Afforestation Species Cupressus funebris: Insights from an Ensemble Model under Climate Change Scenarios

1
Ecological Security and Protection Key Laboratory of Sichuan Province, Mianyang Normal University, Mianyang 621000, China
2
China College of Science, Tibet University, Lhasa 850012, China
3
Tibet Autonomous Region Institute of Science and Technology Information, Lhasa 850012, China
4
College of Life Science & Biotechnology, Mianyang Normal University, Mianyang 621000, China
*
Author to whom correspondence should be addressed.
These authors contributed equally to this work.
Forests 2024, 15(8), 1280; https://doi.org/10.3390/f15081280
Submission received: 8 June 2024 / Revised: 15 July 2024 / Accepted: 20 July 2024 / Published: 23 July 2024
(This article belongs to the Special Issue Forest Management: Planning, Decision Making and Implementation)

Abstract

:
Cupressus funebris Endl. (C. funebris) is an evergreen tree endemic to China that is classified as a national second-class endangered plant. This species plays critical roles in soil and humidity conservation, climate regulation, and ecological restoration. It is also important in silvicultural production, which is crucial for maintaining the stability of the ecosystem in Southwest China. In this study, an integrated modeling approach was used to integrate 10 species distribution models to simulate the potential distribution of C. funebris and predict the impact of future climate change on its distribution and ecological niche. Field surveys were conducted to compare the forest stands of C. funebris under different habitat suitability levels. The results showed that the most suitable areas for C. funebris were mainly located in Sichuan, Chongqing, and Guizhou, covering an area of approximately 15.651 × 10⁴ km2. The productivity of the C. funebris forest stands in these highly suitable areas and was significantly higher than that in low and moderately suitable areas, although understory plant diversity did not show a competitive advantage. Under future climate scenarios, the potential distribution of C. funebris in China will expand and the geographical range of the niche will shift to higher latitudes in northern China as temperatures increase. The extent of this change in the niche’s geographical range intensified as warming increased. Specifically, under the 2090s-SSP585 climate scenario, the highly suitable area for C. funebris is projected to double, suggesting a significant expansion of the geographical range of the niche under this climate model, with more than half of the niche experiencing separation. In summary, the potential distribution of C. funebris may continue to expand and shift to higher latitudes in the context of global warming and its ecological niche’s geographical range will be adjusted accordingly. These findings provide a theoretical basis and practical guidance for in situ conservation, ex situ conservation, and rational utilization of C. funebris genetic resources by conducting niche modeling and climate suitability assessments.

1. Introduction

Human activities have significantly increased greenhouse gas emissions, resulting in a notable rise in Earth’s average temperature [1]. As industrialization progresses, global warming is anticipated to persist. By the late 21st century, global average annual temperatures are projected to be 1.5–4.0 °C higher than pre-industrial levels. Mainland China is likely to experience a greater temperature increase than the global average [2,3]. As greenhouse gas concentrations continue to rise and global warming advances, the habitats, livelihoods, and geographic ranges of all species are expected to be affected. It is estimated that in the event of a global temperature rise of 4 °C, more than one-third (35%) of the world’s land surface could change biomes [4,5,6]. Empirical evidence has indicated that global climate change influences the survival, reproduction, and ecological habits of plants, resulting in shifts in the geographical distribution of tree species. These changes may significantly impact future productivity and the overall health of ecosystems [3]. Recently, analyzing the effects of climate change on species distribution has emerged as a prominent ecological research focus [7]. Therefore, forecasting the dynamic changes in the distribution range of forest tree species under current and future climate scenarios is becoming a vital tool for forest tree breeding management, which is crucial for developing strategies to address future climate change and for choosing species introduction and cultivation plans.
Species distribution models (SDMs) are essential tools for predicting species distributions under climate change conditions, and are crucial for studying ecological evolution and conservation planning [3,8,9]. SDMs simulate species distributions and ecological requirements based on known distribution data and relevant environmental parameters [10]. Currently, there are more than ten popular SDMs, including the random forest (RF), generalized linear model (GLM), generalized additive model (GAM), and maximum entropy model (MAXent). These models have been widely applied in various fields such as biological invasions, conservation of endangered plants and animals, biological distribution during paleoclimatic periods, and dynamic changes in species distribution under climate change [11,12,13]. Ecological niche models also have uncertainties in their predictions, as they depend on the actual location of species distribution, environmental variables, and algorithms [5,14]. Different models for the same species can produce different prediction results because each has its own strengths and weaknesses. The use of a single model can lead to significant uncertainties [15].
Ensemble forecasting, which integrates multiple models, is considered an effective approach for improving the reliability of species distribution predictions [16,17]. Biomod2 is a multi-model integration platform based on the R language, which can run ten different models simultaneously, including GLM, GAM, and classification tree analysis (CTA). Through multiple repetitions, models with strong predictive power were selected in a study and weighted to obtain the final ensemble prediction [18]. Compared with single models, ensemble models combine the advantages of different models and enhance the robustness and transferability of predictions [19,20]. Therefore, Biomod2 has been widely used for invasive species risk assessment [21], climate suitability analysis for endangered species [14], and conservation gap identification [22]. Although the model cannot avoid the inherent defects of various models, assigning weights to each model in the ensemble based on the true skill statistic (TSS) or receiver operating characteristic (ROC) can yield the best simulation results [5].
Cupressus funebris Endl. (C. funebris), a primary coniferous tree native to China, is classified as a national second-class endangered protected plant (Figure 1). It is mainly distributed in central and southern China and northern Vietnam [23]. C. funebris has important medicinal value as it is the main source of cedarwood oil which possesses anti-inflammatory, free radical scavenging, and antioxidant properties [24]. C. funebris is a valuable timber tree species, which has the status of a scarce national strategic resource like oil. It is also suitable for timber forests and ecological landscape construction, and occupies an important position in afforestation production [25,26]. In recent years, it has been widely promoted and planted in southern China, providing great opportunities for the selection and breeding of fast-growing, high-quality, high-carbon sequestration varieties [27]. In addition, C. funebris is involved in soil and humidity conservation, climate regulation, and ecological restoration, which are crucial for maintaining ecosystem stability in southwestern China [28]. In summary, C. funebris has a highly comprehensive utilization value. Given its significant economic, medicinal, and ecological value, it is essential to conduct ecological niche modeling and climate suitability assessments for C. funebris.
In this study, China’s heterogeneous geographical and climatic environments were used as the natural testing grounds. The first attempt to combine the biomod2 ensemble model with the field survey data from the team simulated the potential geographic distribution of C. funebris under modern climate conditions and predicted its distribution under future climate change scenarios. This study also explored the changes in the geographical range of the niche of C. funebris under future climate change scenarios and the stand characteristics of C. funebris at different habitat suitability levels. This study aimed to (1) predict suitable habitats for C. funebris under different climate scenarios, (2) analyze the key environmental factors influencing its distribution, (3) analyze shifts in the ecological niche of C. funebris under future climate conditions, and (4) analyze the impact of habitat suitability on the productivity and understory biodiversity of C. funebris stands. This study will provide theoretical references for the development, utilization, and scientific management of C. funebris, and it holds significant practical implications for achieving “Ecological China” and “Green China”.

2. Materials and Methods

2.1. Study Area

The study’s regional coverage includes all of China, which is situated on the western edge of the Pacific Ocean in East Asia, and boasts a vast area spanning multiple latitudes with significant variations in distance from the sea. Diverse topography, including varying elevations and mountain orientations, results in a wide array of climate types and complex temperature and precipitation patterns. In terms of climate, eastern China experiences monsoon climates, which include subtropical, temperate, and tropical monsoon climates. Northwestern China has a temperate continental climate, whereas the Qinghai–Tibet Plateau has a high-altitude climate. The temperature zones range from tropical and subtropical to warm temperate, temperate, cold temperate, and the unique Qinghai–Tibet Plateau zone. China also boasts of a rich diversity of soil types, making its soil resources suitable for various agricultural, forestry, and pastoral activities. Particularly in mountainous areas, abundant soil resources are conducive to the growth of economically important trees and wood [29].

2.2. Collection of Sample and Species Distribution Records

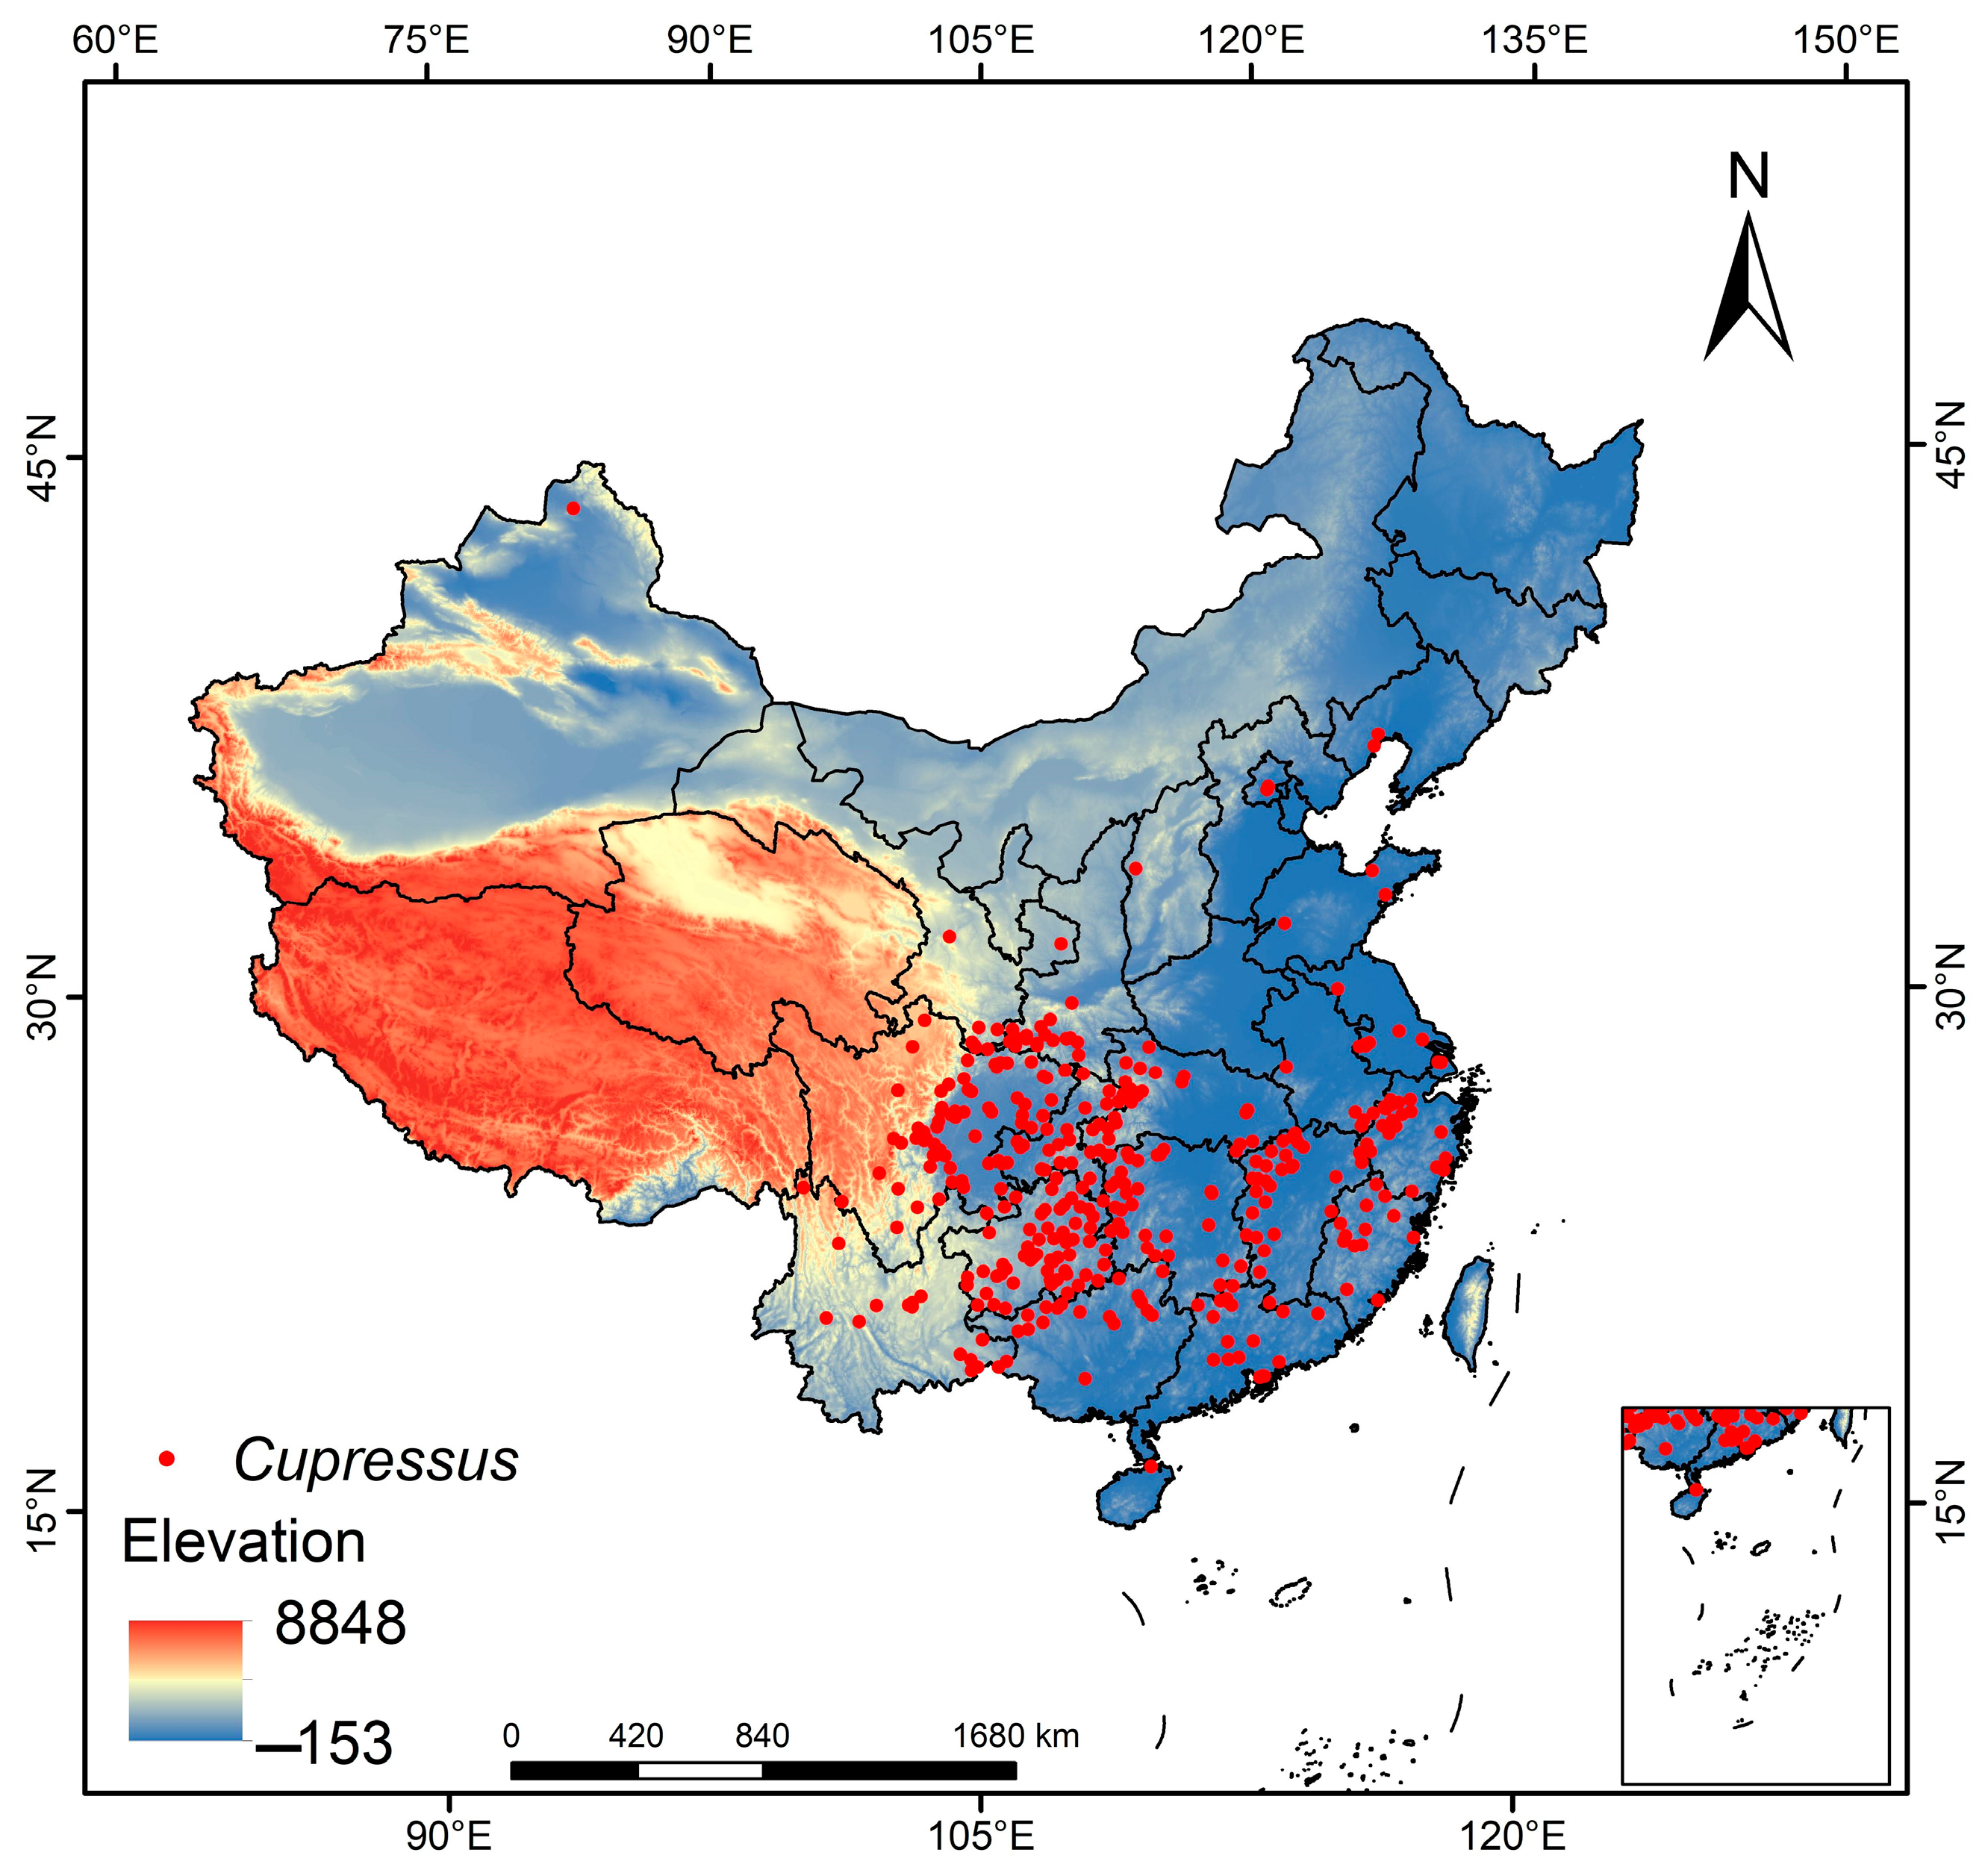
From 2019 to 2024, the Innovation Team for Precision Improvement of C. funebris Plantation Quality at Mianyang Normal University conducted extensive field surveys and consulted resources such as the China Virtual Herbarium (http://www.cvh.ac.cn/, accessed on 16 December 2023), the National Specimen Information Infrastructure of China (http://www.nsii.org.cn/, accessed on 20 December 2023), and relevant research literature on C. funebris. This study verified and removed any incorrectly identified specimen points to ensure the accuracy of the data. To prevent model overfitting due to excessive clustering of distribution points, only one distribution point was selected from each of the 123 grids with a size of 5 km × 5 km. Ultimately, 368 valid occurrence records were obtained (Figure 2).

2.3. Selection and Processing of Environmental Variables for Modeling

There were 34 environmental variables included in this study, including 19 climatic variables, 14 soil variables, and one topographic variable. The current climate data used in the study were obtained from the WorldClim database [30]. Future climate projections were obtained using the Beijing Climate Center Climate System Model (BCC-CSM2-MR) and considered three shared socioeconomic pathway (SSP) scenarios: SSP126, SSP245, and SSP585, representing low-, medium-, and high-greenhouse gas emission scenarios, respectively [31]. Soil and topographic data were obtained from the Harmonized World Soil Database (HWSD, version 1.21) provided by the International Institute for Applied Systems Analysis [32]. The variables in the dataset possessed a spatial resolution of 2.5 arc-minutes, corresponding to a geographic coverage of approximately 25 km.
To mitigate the effects of multicollinearity on the accuracy of predictions, we used the R software (version 4.1.3) to perform Spearman correlation analysis and Variance Inflation Factor (VIF) evaluations on all examined environmental variables. This study chose those environmental variables that exhibited a Spearman correlation coefficient below 0.7 and a VIF lower than 5 [5,33]. Finally, the ensemble model allowed for six climatic factors (mean diurnal range, max temperature of warmest month, min temperature of coldest month, mean temperature of wettest quarter, precipitation of driest month, and precipitation seasonality), along with three soil factors (topsoil sodicity; topsoil organic carbon; topsoil base saturation) and one topographic factor (elevation).

2.4. Construction of the Ensemble Model and Evaluation

The model allows for the construction of integrated models using species distribution and pseudo-distribution data. This tool provides multiple strategies for generating non-presence points (pseudo-presence points) from environmental background data. For example, using the ‘random’ command, it is possible to generate 1200 random pseudo-presence points for simulation analysis. Additionally, the ‘bio mod-tuning’ command helps users optimize model parameters by selecting 75% of the data as the training set, and the remaining 25% is used to verify model accuracy [5]. In biomod2, there are 11 different algorithms, including artificial neural network (ANN), CTA, flexible discriminant analysis (FDA), GAM, gradient boosting machine (GBM), generalized linear model (GLM), multivariate adaptive regression spline (MARS), MAXent, maximum picking neural net (MAXnet), RF, and species range expansion (SRE). The distribution and pseudo-distribution data were assigned equal weight. To avoid biased results, this study repeated the process 21 times, generating a total of 231 model simulations. Prediction accuracy was assessed using AUC and TSS metrics, and only models with a TSS score greater than or equal to 0.7 were retained. These models were combined using the weighted averaging method [5,34]. In the model output, a 0/1 decision threshold was set to identify areas with lower suitability, whereas areas exceeding the threshold were divided into three levels: low, medium, and high suitability. Finally, ArcGIS v10.4.1 software was used to provide a detailed visualization of these areas.

2.5. The Change in the Geographical Range of the Niche

Under current climate conditions, the distribution points of C. funebris and a 1-degree buffer zone around them were selected as the background point selection area. Under the predicted future climate conditions, the background points for C. funebris were determined based on suitable areas predicted by the ensemble model. By combining the distribution points with various climate data, the R package “ecospat” was used to analyze and calculate the degree of overlap between the ecological niches of C. funebris under current and future climate conditions. Additionally, the software can visualize changes in the ecological niche and calculate the ecological niche overlap parameter D (observed value), which ranges from 0 to 1, representing the overlap of the ecological niche from none to complete. This allowed for the analysis and assessment of the potential impact of climate change on the ecological niche of C. funebris [5,35].

2.6. Analysis of Stand Characteristics

In 2023, this study established 15 sample plots (20 × 20 m) of C. funebris in the Zitong forest area of Mianyang City, Sichuan Province, with five plots each in high-, medium-, and low-suitability areas. The diameter at breast height (DBH) threshold for trees in the plots was 5 cm. DBH, tree height, and number of trees were surveyed. The volume per unit area was calculated using a binary volume table, and tree biomass was estimated using the relative growth method. The formula [5,36,37] is as follows:
Y = a(D2H)b
where Y represents tree biomass, D represents DBH, H represents tree height, and a and b are constants obtained from regression.
Three 5 m × 5 m shrub quadrats were set up at the diagonals of each plot, and one 1 m × 1 m quadrat was established in the upper-right corner of each of the three shrub quadrats. The species and quantity of the shrubs and herbs were surveyed and recorded. The ‘spaa’ package in R software was used to calculate the Shannon–Wiener, Pielou, Simpson, and Margalef indices of shrub and herb species biodiversity.
This study utilized the ‘two-way ANOVA’ function in IBM SPSS Statistics 20 to evaluate variations in C. funebris stand productivity and understory plant diversity across various suitability areas, and to examine the potential influence of environmental suitability on both stand productivity and understory plant diversity.

3. Results and Analysis

3.1. Model Accuracy Evaluation

Through simulations, all models were run successfully, producing 231 (3 × 7 × 11) results. In this study, the ‘biomod_tuning’ function was used to tune the model parameters and optimize the models using ROC, kappa, or TSS) metrics. By comparing the evaluated accuracies of the models (ANN, CTA, FDA, GAM, GBM, GLM, MARS, MAXent, MAXnet, RF, and SRE), it was concluded that the best predictor of the distribution of C. funebris was the RF model (average kappa: 0.98, average TSS: 0.99, and average ROC: 1.00) (Figures S1 and S2), followed by MAXent, GBM, GAM, and MAXnet. Among them, the SRE did not pass the model accuracy test. Based on the evaluation results, an ensemble model consisting of the 35 best models (kappa coefficient 0.99, TSS 0.99, ROC, 1.00) was built. In summary, the ensemble model could effectively predict the potential geographic distribution of C. funebris.

3.2. Current Potential Geographical Distributions of C. funebris

Based on data from the Flora of China (iPlant, https://www.iplant.cn, accessed on 2 July 2024) and the Chinese Virtual Herbarium (CVH, https://www.cvh.ac.cn, accessed on 16 December 2023), C. funebris thrives in warm, humid climates with annual temperatures of 10–20 °C and rainfall of 800–1600 mm, mainly distributed in Sichuan, Chongqing, and Guizhou provinces in China. It grows at elevations of 500–2000 m and adapts to various soil types. It is known for its rapid growth and resistance to drought, cold, and pollution; it is commonly used in protective forestations, promotes local biodiversity, and has significant economic value.
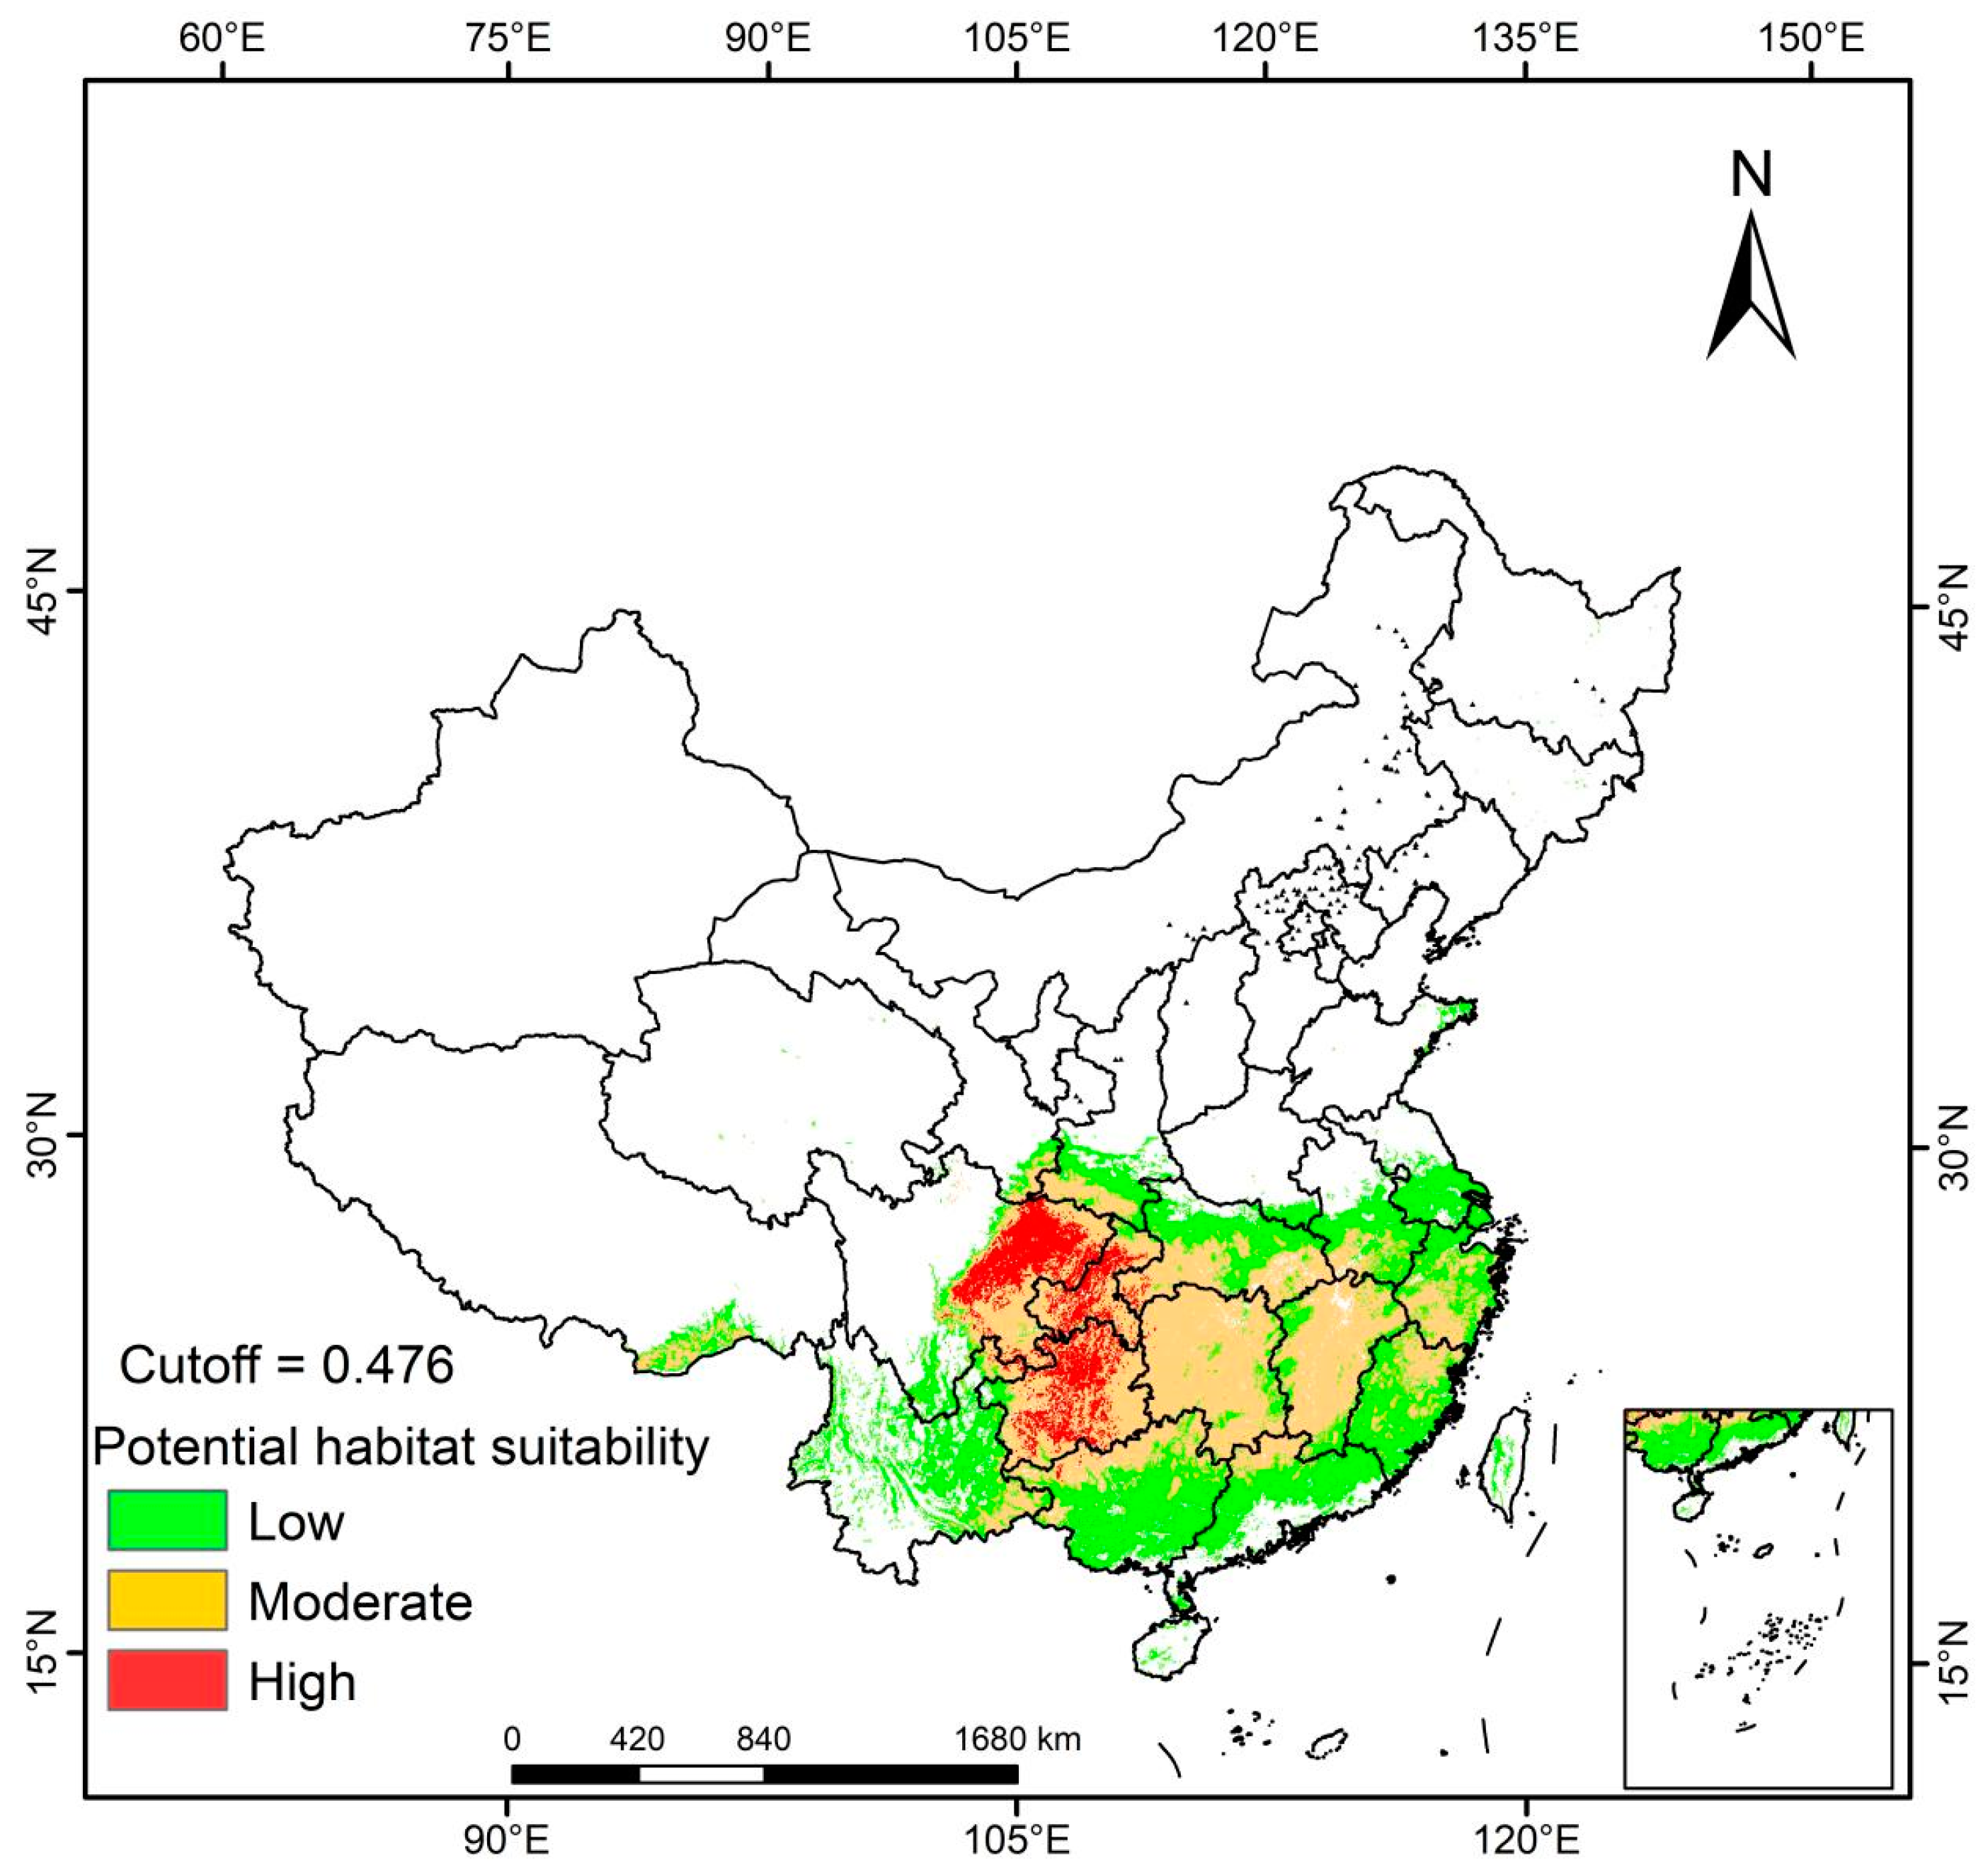
The potential geographic distribution of C. funebris under modern climatic conditions was simulated using the biomod2 ensemble model (Figure 3). C. funebris has a total area of 180.76 km2, of which 15.651 km2 is highly suitable, accounting for 8.66% of the total area. Part of the area is located in eastern Sichuan, and the rest is densely distributed in Chongqing and Guizhou provinces. The medium suitability area covers 86.601 × 10⁴ km2, accounting for 47.91% of the total suitable area. Most of this region is located in the Hunan, Jiangxi, and Guizhou provinces around the high-suitability area. The low-suitability provinces include Guangxi, Fujian, Guangdong, and Yunnan provinces, representing 43.65% of the total suitable area.
In summary, the predicted geographic range of C. funebris based on the biomod2 ensemble model closely aligns with its observed distribution under current climate conditions, suggesting a high level of accuracy in the simulation outcomes.

3.3. Future Potential Geographical Distributions of C. funebris

The potential future distribution areas of C. funebris are shown in Figure 4 and Table 1. Figure 4 and Table 1 depict the forecasted distribution areas for C. funebris under future SSP.
For the SSP126 pathway, the total suitable area is expected to increase by 11.32% in the 2050s and 20.08% by the 2090s. Highly suitable zones could increase significantly by 122.39% in the 2050s and 104.72% in the 2090s. Moderate suitability areas may see a modest growth of 4.64% in the 2050s and 14.61% in the 2090s. Areas of low suitability are projected to decrease slightly by 3.45% in the 2050s, followed by an increase of 9.25% in the 2090s.
According to the SSP245 scenario, there is a notable increase in the total suitable area by 31.90% in the 2050s and 39.37% in the 2090s. Additionally, the highly suitable area saw an increase of 88.58% in the 2050s and 48.66% in the 2090s, whereas the moderately suitable area experienced a growth of 27.65% in the 2050s and 33.43% in the 2090s. The low-suitability area also saw an increase of 25.29% in the 2050s and 44.07% in the 2090s.
Under the SSP585 scenario, there was a notable increase in the total suitable area by 30.15% in the 2050s and by 42.06% in the 2090s. Additionally, the highly suitable area saw a significant increase of 123.12% in the 2050s and 85.20% in the 2090s, whereas the moderately suitable area experienced an increase of 20.95% in the 2050s and 27.80% in the 2090s. The low-suitability area also saw an increase of 21.76% in the 2050s and 49.19% in the 2090s.
In conclusion, the potential distribution of C. funebris was significantly affected by climate change. Under various emission concentration scenarios projected for the future, specifically in the 2050s and the 2090s, the potential distribution areas exhibited an expansion trend, except for a 3.45% decrease in the low-suitability area under the 2050s-SSP126 scenario. In the other climate scenarios, the distribution areas increased to different extents. This expansion was primarily observed in the mid-to-high-latitude provinces, including Henan, Shandong, and Hebei. The most significant increase in highly suitable areas was noted under the 2050s-SSP585 scenario, which saw an increase of 123.12%, covering an area of approximately 19.27 × 10⁴ km2.

3.4. Future Ecological Change in the Geographical Range of the Niche Analysis

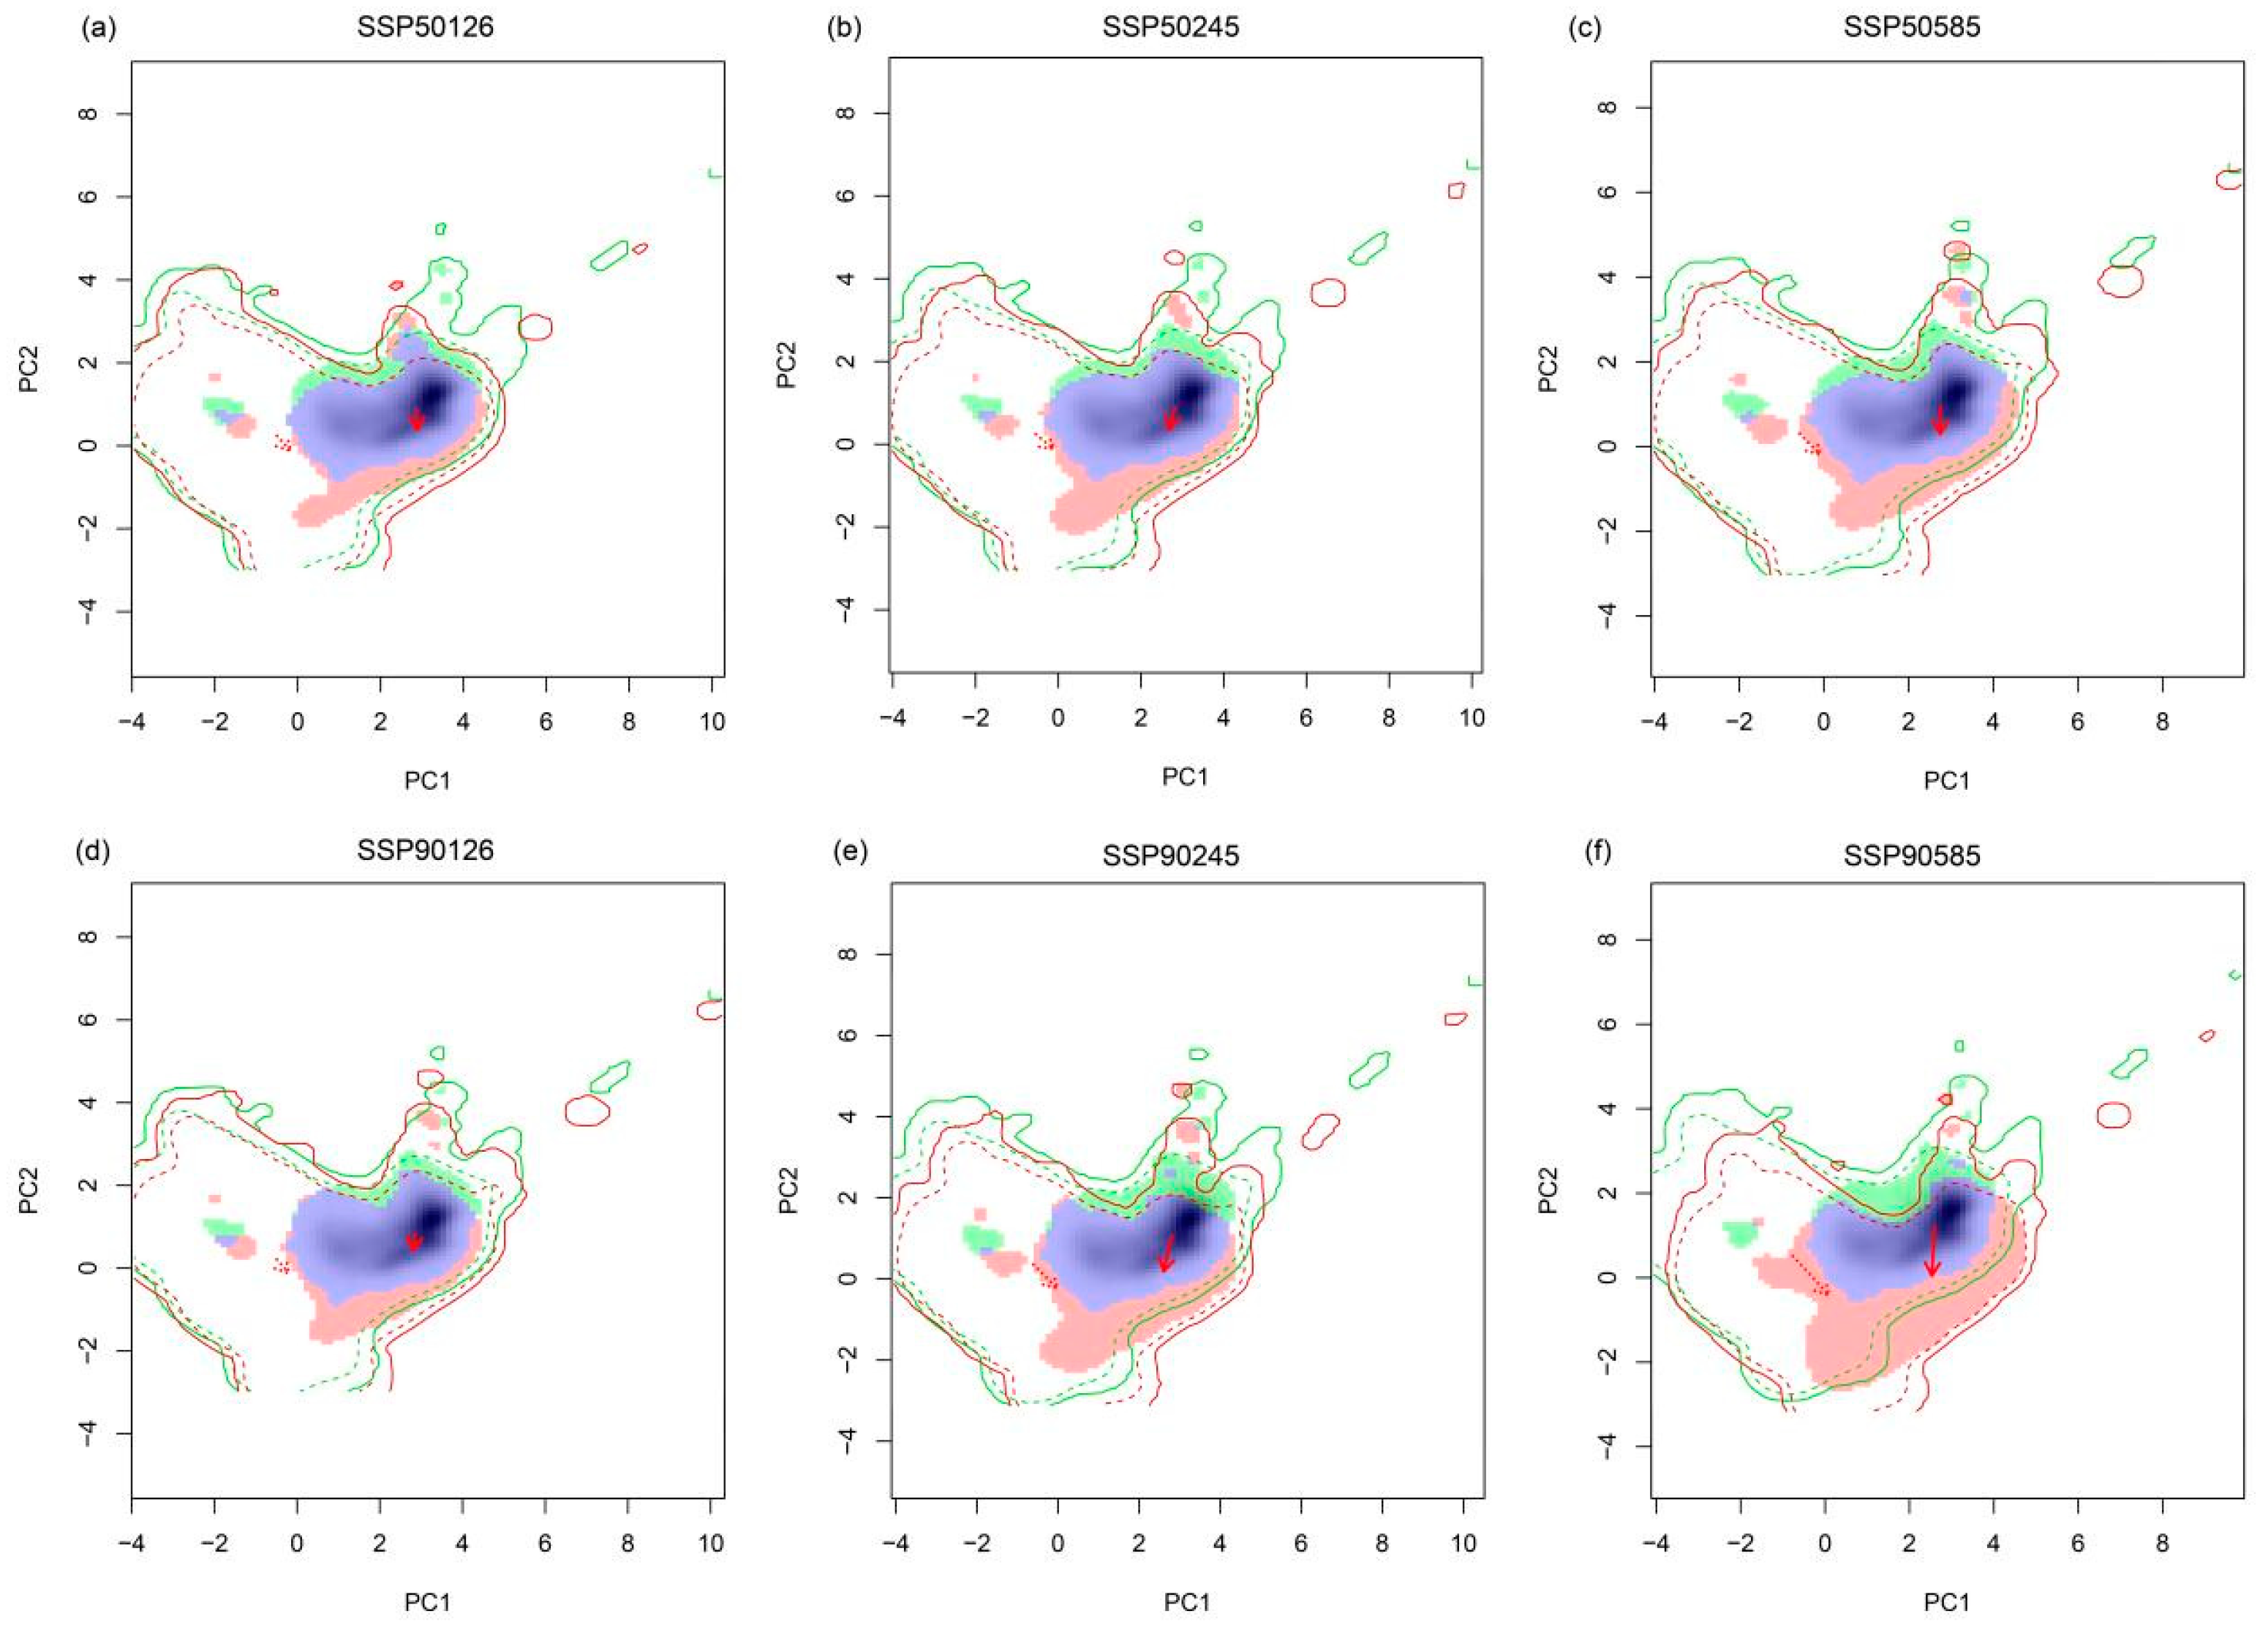
The spatial range of C. funebris is partially determined by its essential niche, which includes a variety of environmental conditions that allow the survival of the species. By assessing niche spaces in the present and projected future climates, the niche overlap of C. funebris was examined. Figure 5 shows the results of this analysis. The dynamics of the ecological niche revealed that Schoener’s D metrics for the climate scenarios SSP50126, SSP50245, SSP50585, SSP90126, SSP90245, and SSP90585 were 0.67, 0.64, 0.58, 0.68, 0.52, and 0.42, respectively. Shifting climatic niches under current and future climatic conditions correspond to general trends in climate evolution. In comparison to SSP126 and SSP245, the SSP585 scenario predicted a broader shift in the climate niche and reduced niche similarity. In the scenario SSP90585, the C. funebris niche demonstrated a divergence of greater than 50% from its former state. The magnitude of the impending climate change will significantly influence the niche dynamics of C. funebris, with a steady decrease in niche overlap, indicating that the species is likely to experience substantial changes in the geographical range of the niche as climate change progresses.
The analysis conducted through principal component analysis (PCA) revealed that a substantial portion of the variance within environmental factors, amounting to 79.45%–84.77%, is accounted for by the initial two principal components within the study locale (with PC1 contributing 58.12%–61.59% and PC2 contributing 21.33%–23.18%). It has been determined that the pivotal elements dictating the change in the ecological niche of C. funebris include the minimum temperature of the coldest month, average diurnal temperature range (calculated as the monthly difference between maximum and minimum temperatures), and precipitation of the driest month. In the future, predictions of the climatic niche of C. funebris indicate a shift towards regions with lower minimum temperatures in the coldest month and a wider range of daytime temperatures, conditions that favor the reproduction of the species.

3.5. Forest Stand Characteristics Analysis under Different Habitat Suitability Scenarios

Significant variations were observed in both the productivity attributes of the stands and the diversity of understory vegetation across sample plots situated in areas of high, moderate, and low suitability (Figure 6). In terms of stand productivity traits, such as forest stock volume, biomass, and density, C. funebris exhibited a gradient variation across areas of differing suitability, following the sequence: highly suitable area > moderately suitable area > low suitable area. The area with the highest suitability had superior forest stock volume, biomass, and stand density, suggesting that it offers optimal conditions for C. funebris growth, markedly surpassing the moderately and lowly suitable areas for productivity traits. Regarding understory plant diversity, despite variations in the indices for the shrub layer, significant differences were only observed in the species richness index (Margalef index) (p < 0.05). In the context of the herbaceous layer, while the diversity indices displayed fluctuations, significant disparities were observed solely in the species richness and Pielou indices (p < 0.05). Specifically, the species richness index for understory shrubs in the less suitable region was notably higher than that in the moderately and highly suitable regions, whereas the species richness index for understory herbs in the less suitable region exceeded that in the highly suitable region. Thus, the diversity of shrub and herbaceous species in response to habitat suitability changes for C. funebris showed different patterns, with the highly suitable area exhibiting lower diversity in both shrub and herbaceous species.

4. Discussion

Climate change has the potential to hasten species extinction, diminish species diversity, and increase the vulnerability of regional ecosystems. Nevertheless, certain species may exhibit adaptations in their physiological characteristics in response to climate change [38,39,40]. In recent years, there has been growing acknowledgment within the scientific community regarding the significance of research on global climate and environmental change [41,42]. This study identified and managed sensitive species in areas where climate change is likely to affect ecosystems, utilizing scientific methods to mitigate the effects of climate change on ecosystems [43,44].
This study used the biomod2 ensemble model to investigate the potential distribution of C. funebris in China in the context of climate change. The predictive findings indicate that the total suitable habitat for C. funebris spans 180.76 × 10⁴ km2 and is primarily concentrated in Sichuan, Chongqing, Hunan, Jiangxi, and Guizhou. Notably, the highly suitable area covered 15.651 × 10⁴ km2, representing 8.66% of the total suitable habitat, and was predominantly located in eastern Sichuan, Chongqing, and Guizhou. According to the findings of field surveys, literature sources [45], and data obtained from the Chinese Virtual Herbarium (CVH, https://www.cvh.ac.cn, accessed on 16 December 2023), it can be confirmed that C. funebris is present in the provinces and municipalities of Sichuan, Chongqing, Hunan, Jiangxi, and Guizhou. These regions fall within the anticipated suitable habitats, as identified in this study, suggesting the validity of predictive outcomes for C. funebris.
The distribution of plants has been affected by climate change for a long time. Nowadays, as planets experience heightened temperatures and increasingly severe erratic climatic incidents due to global warming, ecosystems are undergoing rapid transformation. This situation presents a dire predicament for a diverse array of life forms on Earth [46]. The extinction risk of biota in sampled areas covering 20% of the Earth’s surface was estimated at 15%–37% under the medium emissions scenario by Thomas et al. However, not all species are equally vulnerable; some are less susceptible to extinction, whereas others may even thrive in warmer climates. This highlights the duality of global temperature increases in species’ potential habitat ranges, asserting that the consequences of such climatic shifts are not universally detrimental or advantageous [47]. According to the analysis of environmental factors and three emission scenarios for the years 2050 and 2090, in conjunction with contemporary climatic conditions, the potential geographic distribution of C. funebris is projected to exhibit an overall upward trend compared to its potential distribution under current climatic conditions. It is evident that C. funebris experiences favorable growth and distribution under climate warming, making it a beneficiary of climate change. The shared socioeconomic pathways (SSP) scenarios outlined in the Sixth Assessment Report (AR6) of the Intergovernmental Panel on Climate Change (IPCC) suggest that climate warming and temperature rise will be more substantial. Given the significant impact of temperature on the growth of C. funebris, the projected temperature increase resulting from heightened emission concentrations in the 2050s-SSP585 emission scenario may result in a more pronounced shift in suitable habitats for C. funebris. This could explain the notable expansion of highly suitable areas for C. funebris in this particular scenario. This might also explain the slight decrease in the low-suitability area for C. funebris under the 2050s-SSP126 scenario. The expected changes in the distribution and location of C. funebris are likely to have profound multifaceted effects. These changes can affect species survival and reproduction, disrupt ecological interactions, and alter ecosystem function. It is essential to closely monitor these shifts and develop strategies to mitigate the potential negative effects on both species and ecosystems.
In terms of distribution changes, the potential distribution area of C. funebris shows an expansion trend, mainly extending to mid-to-high-latitude regions, such as Henan, Shandong, and Hebei provinces. The highly suitable areas showed the most significant increase, suggesting that C. funebris benefits from climate change, likely due to its strong adaptability [48]. Concurrently, as greenhouse gas emissions increase, changes in suitable areas for C. funebris become more pronounced, highlighting the significant impact of climate change on this species. The predicted advantages of C. funebris under climate change and the migration trends of potentially suitable areas are consistent with conclusions from relevant studies. For instance, Liu employed bioclimatic, topographic, and soil variables to model the potential distribution of suitable habitats for Acer truncatum under projected future climatic conditions, revealing a decrease in suitability at lower latitudes and an increase in suitability at higher latitudes. The expansion of suitable habitats outweighed the loss [49]. Similarly, Flower et al. examined the potential shifts in the geographical distribution of three spruce and one fir species in Canada under three IPCC AR4 emission scenarios, demonstrating a notable migration of these species towards higher latitudes [50]. Leng et al. employed the random forest model to assess the effects of climate change on the potential spatial distribution of three larch species (Larix spp.) in Northeast China. Their findings suggest that, in projected future climate change scenarios, the potential distribution of these larch species is likely to shift significantly towards higher latitudes. Additionally, Bellard et al. conducted simulations to predict the potential distribution of 100 of the most invasive non-native species globally, revealing a consistent pattern of northward expansion of these species [51]. Thuiller discovered that, in the context of climate warming, the majority of species are expected to migrate northward, except for those already inhabiting northern regions. The projected changes in suitable habitats for C. funebris in future periods aligned with this pattern. The effects of climate warming on the potential geographic distribution of species primarily involve a shift towards higher latitudes or altitudes, as well as expansions and contractions of distribution areas [52]. The findings of this study indicate that the potential suitable habitat for C. funebris is projected to shift towards higher latitudes and northwest regions in response to future climate change scenarios, consistent with this observed trend.
Climate warming and changes in precipitation patterns due to rising carbon dioxide levels are anticipated to persist throughout this century [53]. The warming climate and changing precipitation patterns caused by rising carbon dioxide concentrations are expected to continue through the end of this century. Generally, the extent of species range adjustment is greater in regions that experience more intense warming [54,55]. Besides temperature, precipitation is also a crucial driving factor for shifts in species distribution [56]. The dynamic ecological change in the geographical range of the niche of C. funebris reveals that niche overlap between current and future scenarios decreases as the severity of climate change increases. This study identified the minimum temperature of the coldest month, the mean diurnal range (average monthly maximum temp-min temperature), and the precipitation of the driest month as the primary factors influencing C. funebris niche differentiation (Table S1). These findings align with the observation that both temperature and rainfall affect C. funebris growth, although temperature has a more pronounced effect [25]. Compared with the SSP126 and SSP245 scenarios, the climatic niche migration distance of C. funebris was more significant under the SSP585 scenario. In the 2090s-SSP585 scenario, the C. funebris niche was more than half separated from the current period. The magnitude of future climate change affects the niche migration of C. funebris, explaining why its potential distribution area is the largest under the 2090s-SSP585 model and why its potential distribution will continue to shift to mid-to-high latitudes in the future.
The productivity traits of C. funebris in areas with high suitability were notably superior to those in moderately and poorly suitable areas. Regions highly suitable for C. funebris had more abundant humidity resources and higher temperatures than moderately and lowly suitable areas. Humidity is a critical climatic factor influencing the growth and biomass accumulation of C. funebris forests. C. funebris thrives and matures rapidly under humid conditions [57,58]. The growth characteristics of C. funebris from different suitability areas generally corresponded to this observation. This study divided the understory plant diversity of C. funebris into shrub and herbaceous species diversity for separate analyses. The results indicated that the reactions of shrub species diversity and herbaceous species diversity to habitat suitability changes in C. funebris were somewhat different. In highly suitable areas, both herbaceous species and shrub diversity were lower than those in the other two suitable areas, which might be because C. funebris in highly suitable areas grew robustly and absorbed more nutrients, consumed more light, and intercepted more precipitation. Various environmental factors influence changes in species diversity. Species diversity commonly decreases with increasing latitude [59]. However, specific studies have shown that species diversity may increase with latitude under favorable microclimatic conditions [60]. Altitude strongly impacts species diversity, usually leading to a decline in diversity with increasing altitude [61]. Nevertheless, some studies have found that diversity peaks might occur at mid-altitudes [62], perhaps because of the overlap of different climatic areas. These complex patterns of latitude and altitude influence species diversity and reflect the multifaceted impact of environmental factors on ecosystems. Further detailed exploration of the mechanisms underlying these patterns will enhance the understanding and prediction of biodiversity distribution patterns. The analysis in this study of the understory species diversity of C. funebris differs to some degree from the conclusions of previous studies. The reason for this difference might be variations in the microclimate within C. funebris forests of different habitat suitability, which affect understory plant species diversity. However, the mechanism by which the varying stand structures of C. funebris influence understory plant species diversity requires further study. These findings align with the existing literature, indicating that species diversity typically decreases with increasing latitude and altitude but may peak at mid-latitudes or mid-altitudes due to overlapping climatic zones in these regions [63].
This study aimed to forecast the potential geographic distribution of C. funebris in China. The findings of this research serve as an initial phase in macro-level strategizing and are essential for scientific oversight and facilitation of appropriate habitats for species sustenance and propagation. Alterations in the scope of the study area could potentially modify the array of environmental variables that constrain growth. Furthermore, additional environmental factors, such as vegetation cover, exert a discernible influence on the potential geographic distribution of plants [64]. Owing to the inherent uncertainty in accurately forecasting future vegetation cover in China, it was omitted from the geographic distribution prediction. Consequently, certain regions within the projected geographic distribution outlined in this study might not be conducive to species survival. The analysis was limited to 37 environmental factor variables for the years 2050 and 2090. Hence, for future studies investigating the impact of climate change on the potential geographic distributions of species, multiple temporal intervals should be considered, including a broader range of environmental variables, and delineate study areas based on practical considerations. This approach will facilitate a comprehensive analysis of evolving trends in the potential geographic distribution of the species under investigation.
Distribution records of C. funebris were collected from both artificial and natural habitats in this study. The inclusion of distribution records from artificial habitats may potentially influence the predictive outcomes of the niche model. Consequently, it is recommended that future research take into account the implications of incorporating artificial habitat distribution records on predictive results.

5. Conclusions

This study utilized the varied geographic and climatic conditions in China as a natural experimental environment. The biomod2 ensemble model was employed to simulate the potential geographic range of the important afforestation tree species, C. funebris, under current climatic conditions and to predict its distribution under future climate change scenarios. This study examined potential shifts in the ecological niche and stand attributes of C. funebris in response to varying habitat suitability levels in future climates. The findings indicate that under current conditions, the most conducive regions for C. funebris growth are Sichuan, Chongqing, and Guizhou. In anticipated future climate projections, with the exception of a modest reduction of 3.45% in less favorable habitats under the 2050 SSP126 scenario, there is an overall expansion of potential distribution areas that shift towards the northeast, particularly concentrated in mid–high latitude provinces such as Henan, Shandong, and Hebei, indicating a gradual migration of climatic niches. This study explored the fluctuations and biodiversity of C. funebris throughout different regions of China, indicating its robust ability to acclimate to climate changes. This study also offers a theoretical framework and technological assistance for the preservation, reforestation, and economic advancement of this species. Subsequent studies should prioritize the identification of appropriate locations according to practical production requirements, increase the frequency of research intervals, and consider a wider array of environmental variables to thoroughly assess the potential geographic distribution of the species.

Supplementary Materials

The following supporting information can be downloaded at: https://www.mdpi.com/article/10.3390/f15081280/s1, Figure S1: Evaluation scores of the individual models used in the ensemble modeling; Figure S2: Evaluation indices of individual predictive models; Table S1: Environmental variables and their contributions and suitable value ranges.

Author Contributions

Conceptualization, Q.W.; Methodology, M.L.; Software, Y.H.; Formal analysis, Y.H.; Investigation, M.S. and J.Y. (Jingxuan Yang); Data curation, Y.H.; Writing—original draft, J.Y. (Jingtian Yang); Writing—review & editing, J.Y. (Jingtian Yang) and Y.H.; Supervision, Q.W.; Project administration, M.L. and Q.W.; Funding acquisition, Q.W. All authors have read and agreed to the published version of the manuscript.

Funding

This study was funded by the National Natural Science Foundation of China (32071747), the National Natural Science Foundation of Sichuan Province (2024NSFSC1189, 2023NSFSC0750, 2023NSFSC1194, 2021YFN0113), the Sichuan Science and Technology Program (2023ZYD0102), the Innovation Team Project of Mianyang Normal University (CXTD2023LX01), and from the Scientific research initiation project of Mianyang Normal University (QD2021A37, QD2023A01).

Data Availability Statement

The data were downloaded and are freely available from the World Climate Database and the Harmonized World Soil Database.

Conflicts of Interest

The authors declare no conflicts of interest.

Glossary

ANNArtificial neural network
AR6Sixth assessment report
CTAClassification tree analysis
FDAFlexible discriminant analysis
GAMGeneralized additive models
GBMGradient boosting model
GLMGeneralized linear model
IPCCIntergovernmental panel on climate change
MARSMultivariate adaptive regression spline
MAXentMaximum entropy model
MAXnetmaximum picking neural net
PCAPrincipal component analysis
RFRandom forest
ROCReceiver operating characteristic
SDMsSpecies distribution models
SRESpecies range expansion
SSPShared socioeconomic pathways
TSSTrue skill statistic

References

  1. Helbling, M.; Meierrieks, D. Global warming and urbanization. J. Popul. Econ. 2023, 36, 1187–1223. [Google Scholar] [CrossRef]
  2. Zheng, X.; Zhang, D.; Su, J.; Chen, H. Prediction of Carbon Emission Based on Energy Consumption Structure by Statistical Forecasting. In Proceedings of the International Conference on Statistics, Applied Mathematics, and Computing Science (CSAMCS 2021), Nanjing, China, 26–28 November 2021; SPIE: Bellingham, WA, USA, 2022; Volume 12163, pp. 298–304. [Google Scholar]
  3. Jin, S.; Chi, Y.; Li, X.; Shu, P.; Zhu, M.; Yuan, Z.; Liu, Y.; Chen, W.; Han, Y. Predicting the Response of Three Common Subtropical Tree Species in China to Climate Change. Front. For. Glob. Chang. 2023, 6, 1299120. [Google Scholar] [CrossRef]
  4. Carrell, J.D.; Phinney, A.I.; Mueller, K.; Bean, B. Multiscale Ecological Niche Modeling Exhibits Varying Climate Change Impacts on Habitat Suitability of Madrean Pine-Oak Trees. Front. Ecol. Evol. 2023, 11, 1086062. [Google Scholar] [CrossRef]
  5. Gao, M.; Zhao, G.; Zhang, S.; Wang, Z.; Wen, X.; Liu, L.; Zhang, C.; Tie, N.; Sa, R. Priority Conservation Area of Larix gmelinii under Climate Change: Application of an Ensemble Modeling. Front. Plant Sci. 2023, 14, 1177307. [Google Scholar] [CrossRef]
  6. Miao, G.; Zhao, Y.; Wang, Y.; Yu, C.; Xiong, F.; Sun, Y.; Cao, Y. Suitable Habitat Prediction and Analysis of Dendrolimus houi and Its Host Cupressus funebris in the Chinese Region. Forests 2024, 15, 162. [Google Scholar] [CrossRef]
  7. Gao, M.; Tie, N.; Zhang, C.; Li, F.; Wu, Y.; Luo, Q.; Wang, Z.; Liu, L.; Sa, R. Modeling the Potential Distribution Area of Populus davidiana in China Based on the Biomod2. J. Nanjing For. Univ. 2024, 48, 247. [Google Scholar]
  8. Patasaraiya, M.K.; Devi, R.M.; Sinha, B.; Bisaria, J. Predicting Impacts of Climate Change on Teak and Sal Forests in Central India Using Maximum Entropy Modeling: An Approach for Future Conservation and Silvicultural Strategies. For. Sci. 2023, 69, 463–472. [Google Scholar] [CrossRef]
  9. Yang, J.; Jiang, X.; Ma, Y.; Liu, M.; Shama, Z.; Li, J.; Huang, Y. Potential Global Distribution of Setaria italica, an Important Species for Dryland Agriculture in the Context of Climate Change. PLoS ONE 2024, 19, e0301751. [Google Scholar] [CrossRef]
  10. Yang, J.; Huang, Y.; Jiang, X.; Chen, H.; Liu, M.; Wang, R. Potential Geographical Distribution of the Edangred Plant Isoetes under Human Activities Using MaxEnt and GARP. Glob. Ecol. Conserv. 2022, 38, e02186. [Google Scholar] [CrossRef]
  11. Wang, T.; Zhang, T.; An, W.; Wang, Z.; Li, C. Predicting the Potential Geographic Distribution of Invasive Freshwater Apple Snail Pomacea canaliculate (Lamarck, 1819) under Climate Change Based on Biomod2. Agronomy 2024, 14, 650. [Google Scholar] [CrossRef]
  12. Wang, H.; Zhi, F.; Zhang, G. Predicting Impacts of Climate Change on Suitable Distribution of Critically Endangered Tree Species Yulania zenii in China. Forests 2024, 15, 883. [Google Scholar] [CrossRef]
  13. Gao, C.; Guo, S.; Ma, C.; Yang, J.; Kang, X.; Li, R. Impact of Climate Change on the Potential Geographical Distribution Patterns of Luculia pinceana Hook. f. since the Last Glacial Maximum. Forests 2024, 15, 253. [Google Scholar] [CrossRef]
  14. Zhang, H.T.; Wang, W.T. Prediction of the Potential Distribution of the Endangered Species Meconopsis punicea Maxim under Future Climate Change Based on Four Species Distribution Models. Plants 2023, 12, 1376. [Google Scholar] [CrossRef]
  15. Qiao, H.; Feng, X.; Escobar, L.E.; Peterson, A.T.; Soberón, J.; Zhu, G.; Papeş, M. An Evaluation of Transferability of Ecological Niche Models. Ecography 2019, 42, 521–534. [Google Scholar] [CrossRef]
  16. Araujo, M.; New, M. Ensemble forecasting of species distributions. Trends Ecol. Evol. 2007, 22, 42–47. [Google Scholar] [CrossRef]
  17. Chen, Y.; Jiang, Z.; Fan, P.; Ericson, P.G.P.; Song, G.; Luo, X.; Lei, F.; Qu, Y. The Combination of Genomic Offset and Niche Modeling Provides Insights into Climate Change-Driven Vulnerability. Nat. Commun. 2022, 13, 4821. [Google Scholar] [CrossRef]
  18. Thuiller, W.; Lafourcade, B.; Engler, R.; Araújo, M.B. BIOMOD—A Platform for Ensemble Forecasting of Species Distributions. Ecography 2009, 32, 369–373. [Google Scholar] [CrossRef]
  19. Hao, T.; Elith, J.; Lahoz-Monfort, J.J.; Guillera-Arroita, G. Testing Whether Ensemble Modeling Is Advantageous for Maximising Predictive Performance of Species Distribution Models. Ecography 2020, 43, 549–558. [Google Scholar] [CrossRef]
  20. Shabani, F. Assessing Accuracy Methods of Species Distribution Models: AUC, Specificity, Sensitivity and the True Skill Statistic. Glob. J. Hum.-Soc. Sci. 2018, 18, 7–18. [Google Scholar]
  21. Ángel-Vallejo, M.C.; Aguirre-Acosta, N.; Rodríguez-Rey, G.T.; García-Marín, E.J.; Álvarez-Mejía, L.M.; Feuillet-Hurtado, C. Distribution Models in Invasive Plants with Climatic Niche Expansion: A Case Study of Ulex europaeus L. in Colombian Andes. Biol. Invasions 2024, 26, 1919–1930. [Google Scholar] [CrossRef]
  22. Ruizhi, L.I.; Xijun, H.U.; Qizhen, L.I.; Luyun, L.I.U.; Yuanrong, H.E.; Cunyou, C. Gap Analysis of Firmiana danxiaensis, a Rare Tree Species Endemic to Southern China. Ecol. Indic. 2024, 158, 111606. [Google Scholar]
  23. Yang, J.; Wu, Q.; Dakhil, M.A.; Halmy, M.W.A.; Bedair, H.; Fouad, M.S. Towards Forest Conservation Planning: How Temperature Fluctuations Determine the Potential Distribution and Extinction Risk of Cupressus funebris Conifer Trees in China. Forests 2023, 14, 2234. [Google Scholar] [CrossRef]
  24. Farasat, N.; Zangeneh, M.; Salimi-Sabour, E.; Eidizade, A.; Golmohammadi, R. Antibacterial Activities and Chemical Composition of Essential Oils of Cupressus sempervirence L. and C. funebris Endl. in Khuzestan, Iran. Microbiol. Metab. Biotechnol. 2023, 6, 19–26. [Google Scholar]
  25. Wang, R.; Guo, Y.; Lin, H.; Liu, Z.; Zhang, R.; Zhou, Z. Research Progress and Prospect of Cupressus funebris. Hubei For. Sci. Technol. 2021, 50, 60–63. [Google Scholar]
  26. Yan, M. Cypress Cultivation Techniques and Applications. Mod. Agric. Sci. Technol. 2013, 18, 54. [Google Scholar]
  27. Yang, T.; Qiu, Y.; Shen, H.; Zheng, C.; Zhang, Z.; Wang, W.W.; Jin, G.; Zhou, Z. Early Evaluation of Carbon Content of Cypress Clones and Families and Selection of Superior Strains. Sci. Silvae Sin. 2023, 59, 85–94. [Google Scholar]
  28. Chen, B.; Wu, Y.; Zhong, X.; Xu, Y.; Chen, H.; Tang, L.; Bai, Y.; Hao, J. Effects of Stand Density on Understory Plant Diversity and Biomass in a Cupressus funebris Plantation in Yunding Mountain. J. Sichuan Agric. Univ. 2023, 41, 665–672. [Google Scholar] [CrossRef]
  29. Zhao, H. Response of Potential Geographic Distribution of Eight Critically Endangered Plant Species in China to Climate Change and Their Gap Analysis. Master’s Thesis, Northwest Normal University, Lanzhou, China, 2021. Available online: https://cdmd.cnki.com.cn/Article/CDMD-10736-1021661814.htm (accessed on 28 June 2024).
  30. Fick, S.E.; Hijmans, R.J. WorldClim 2: New 1-km Spatial Resolution Climate Surfaces for Global Land Areas. Int. J. Climatol. 2017, 37, 4302–4315. [Google Scholar] [CrossRef]
  31. Sun, C.; Zuo, J.; Shi, X.; Liu, X.; Liu, H. Diverse Inter-Annual Variations of Winter Siberian High and Link with Eurasian Snow in Observation and BCC-CSM2-MR Coupled Model Simulation. Front. Earth Sci. 2021, 9, 761311. [Google Scholar] [CrossRef]
  32. Milovac, J.; Ingwersen, J.; Warrach-Sagi, K. Global Top Soil Texture Data Compatible with the WRF Model Based on the Harmonized World Soil Database (HWSD) at 30 Arc-Second Horizontal Resolution Version 1.21; World Data Center for Climate (WDCC) at DKRZ: Hamburg, Germany, 2018. [Google Scholar]
  33. Elith, J.H.; Graham, C.P.H.; Anderson, R.P.; Dudík, M.; Ferrier, S.; Guisan, A.; Hijmans, R.J.; Huettmann, F.; Leathwick, J.R.; Lehmann, A.; et al. Novel Methods Improve Prediction of Species’ Distributions from Occurrence Data. Ecography 2006, 29, 129–151. [Google Scholar] [CrossRef]
  34. Allouche, O.; Tsoar, A.; Kadmon, R. Assessing the Accuracy of Species Distribution Models: Prevalence, Kappa and the True Skill Statistic (TSS). J. Appl. Ecol. 2006, 43, 1223–1232. [Google Scholar] [CrossRef]
  35. Di Cola, V.; Broennimann, O.; Petitpierre, B.; Breiner, F.T.; D’Amen, M.; Randin, C.; Engler, R.; Pottier, J.; Pio, D.; Dubuis, A.; et al. Ecospat: An R Package to Support Spatial Analyses and Modeling of Species Niches and Distributions. Ecography 2017, 40, 774–787. [Google Scholar] [CrossRef]
  36. Ali, H.; Mohammadi, J.; Shataee Jouibary, S. Allometric Models and Biomass Conversion and Expansion Factors to Predict Total Tree-Level Aboveground Biomass for Three Conifers Species in Iran. For. Sci. 2023, 69, 355–370. [Google Scholar] [CrossRef]
  37. Shingleton, A.W.; Frankino, W.A. The (Ongoing) Problem of Relative Growth. Curr. Opin. Insect Sci. 2018, 25, 9–19. [Google Scholar] [CrossRef] [PubMed]
  38. Bellard, C.; Bertelsmeier, C.; Leadley, P.; Thuiller, W.; Courchamp, F. Impacts of Climate Change on the Future of Biodiversity. Ecol. Lett. 2012, 15, 365–377. [Google Scholar] [CrossRef] [PubMed]
  39. Rushing, C.S.; Rubenstein, M.; Lyons, J.E.; Runge, M.C. Using Value of Information to Prioritize Research Needs for Migratory Bird Management under Climate Change: A Case Study Using Federal Land Acquisition in the United States. Biol. Rev. 2020, 95, 1109–1130. [Google Scholar] [CrossRef]
  40. Garcia, K.; Lasco, R.; Ines, A.; Lyon, B.; Pulhin, F. Predicting Geographic Distribution and Habitat Suitability Due to Climate Change of Selected Threatened Forest Tree Species in the Philippines. Appl. Geogr. 2013, 44, 12–22. [Google Scholar] [CrossRef]
  41. Karypidou, M.C.; Almpanidou, V.; Tompkins, A.M.; Mazaris, A.D.; Gewehr, S.; Mourelatos, S.; Katragkou, E. Projected Shifts in the Distribution of Malaria Vectors Due to Climate Change. Clim. Change 2020, 163, 2117–2133. [Google Scholar] [CrossRef]
  42. Carosi, A.; Ghetti, L.; Padula, R.; Lorenzoni, M. Population Status and Ecology of the Salmo trutta Complex in an Italian River Basin under Multiple Anthropogenic Pressures. Ecol. Evol. 2020, 10, 7320–7333. [Google Scholar] [CrossRef] [PubMed]
  43. Gerber, L.R.; Hyrenbach, K.D.; Zacharias, M.A. Do the Largest Protected Areas Conserve Whales or Whalers? Science 2005, 307, 525–526. [Google Scholar] [CrossRef]
  44. Avasthi, A. California Tries to Connect Its Scattered Marine Reserves. Science 2005, 308, 487–488. [Google Scholar] [CrossRef]
  45. Zhang, P.; Liang, Y.; Liu, B.; Ma, T.; Wu, M. Remote sensing estimation of forest aboveground biomass in Tibetan Plateau based on random forest model. Chin. J. Ecol. 2023, 42, 415–424. [Google Scholar] [CrossRef]
  46. Chen, Q. Characteristics of Wetland Plant Community and Its Relationship with Environmental Factors in Nianchu River Basin. Master’s Thesis, Tibet University, Lhasa, China, 2022. [Google Scholar]
  47. Thomas, C.D.; Cameron, A.; Green, R.E.; Bakkenes, M.; Beaumont, L.J.; Collingham, Y.C.; Erasmus, B.F.; De Siqueira, M.F.; Grainger, A.; Hannah, L. Extinction Risk from Climate Change. Nature 2004, 427, 145–148. [Google Scholar] [CrossRef] [PubMed]
  48. Zhang, Z. Initial Effects of Two Tending Measures on Carbon Storage and Soil Active Organic Carbon Pool of Cypress Plantation. Master’s Thesis, Sichuan Agricultural University, Chengdu, China, 2023. [Google Scholar]
  49. Liu, Y.; Wang, Y.; Guo, H.; Wu, D.; Wu, S.; Xin, X.; Pei, S. Changes in Potentially Suitable Areas for Fruit Utilization of Acer truncatum in China under Climate Change. Forests 2024, 15, 713. [Google Scholar] [CrossRef]
  50. Flower, A.; Murdock, T.Q.; Taylor, S.W.; Zwiers, F.W. Using an Ensemble of Downscaled Climate Model Projections to Assess Impacts of Climate Change on the Potential Distribution of Spruce and Douglas-Fir Forests in British Columbia. Environ. Sci. Policy 2013, 26, 63–74. [Google Scholar] [CrossRef]
  51. Leng, W.; He, H.S.; Bu, R.; Dai, L.; Hu, Y.; Wang, X. Predicting the Distributions of Suitable Habitat for Three Larch Species under Climate Warming in Northeastern China. For. Ecol. Manag. 2008, 254, 420–428. [Google Scholar] [CrossRef]
  52. Thuiller, W.; Lavorel, S.; Araújo, M.B.; Sykes, M.T.; Prentice, I.C. Climate Change Threats to Plant Diversity in Europe. Proc. Natl. Acad. Sci. USA 2005, 102, 8245–8250. [Google Scholar] [CrossRef]
  53. Masson-Delmotte, V.; Zhai, P.; Pirani, S.; Connors, C.; Péan, S.; Berger, N.; Caud, Y.; Chen, L.; Goldfarb, M.; Scheel Monteiro, P.M. Summary for Policymakers. In Climate Change 2021—The Physical Science Basis: Working Group I Contribution to the Sixth Assessment Report of the Intergovernmental Panel on Climate Change; Intergovernmental Panel on Climate Change (IPCC), Ed.; Cambridge University Press: Cambridge, UK, 2023; pp. 3–32. ISBN 978-1-00-915788-9. [Google Scholar]
  54. Chen, I.C.; Hill, J.K.; Ohlemüller, R.; Roy, D.B.; Thomas, C.D. Rapid Range Shifts of Species Associated with High Levels of Climate Warming. Science 2011, 333, 1024–1026. [Google Scholar] [CrossRef]
  55. Harsch, M.A.; Hulme, P.E.; McGlone, M.S.; Duncan, R.P. Are Treelines Advancing? A Global Meta-analysis of Treeline Response to Climate Warming. Ecol. Lett. 2009, 12, 1040–1049. [Google Scholar] [CrossRef]
  56. Sala, O.E.; Maestre, F.T. Grass–Woodland Transitions: Determinants and Consequences for Ecosystem Functioning and Provisioning of Services. J. Ecol. 2014, 102, 1357–1362. [Google Scholar] [CrossRef]
  57. Cheng, R.; Xiao, W.; Li, J. Research on Cypress Forests in the Three Gorges Reservoir Area. In Proceedings of the 11th Symposium of the 2004 China Association for Science and Technology Annual Conference, Qionghai, China, 20–23 November 2004; The China Technical Association of Paper Industry: Beijing, China, 2004; p. 3. [Google Scholar]
  58. Zhang, R.; Li, S.; Ma, G.; Su, J. Driving Factors for the Biomass of Individual Cupressus funebris in Southwest China. J. Northwest For. Univ. 2021, 36, 175–181. [Google Scholar] [CrossRef]
  59. Måsviken, J.; Dalerum, F.; Cousins, S.A.O. Contrasting Altitudinal Variation of Alpine Plant Communities along the Swedish Mountains. Ecol. Evol. 2020, 10, 4838–4853. [Google Scholar] [CrossRef] [PubMed]
  60. Stomp, M.; Huisman, J.; Mittelbach, G.G.; Litchman, E.; Klausmeier, C.A. Large-Scale Biodiversity Patterns in Freshwater Phytoplankton. Ecology 2011, 92, 2096–2107. [Google Scholar] [CrossRef] [PubMed]
  61. Xu, M.; Ma, L.; Jia, Y.; Liu, M. Integrating the Effects of Latitude and Altitude on the Spatial Differentiation of Plant Community Diversity in a Mountainous Ecosystem in China. PLoS ONE 2017, 12, e0174231. [Google Scholar] [CrossRef] [PubMed]
  62. Scheffers, B.R.; Phillips, B.L.; Laurance, W.F.; Sodhi, N.S.; Diesmos, A.; Williams, S.E. Increasing Arboreality with Altitude: A Novel Biogeographic Dimension. Proc. R. Soc. B Biol. Sci. 2013, 280, 20131581. [Google Scholar] [CrossRef] [PubMed]
  63. Jackson, J.; Pimsler, M.L.; Oyen, K.; Koch-Uhuad, J.B.; Herndon, J.D.; Strange, J.; Dillon, M.; Lozier, J.D. Distance, Elevation and Environment as Drivers of Diversity and Divergence in Bumble Bees across Latitude and Altitude. Mol. Ecol. 2018, 27, 2926–2942. [Google Scholar] [CrossRef] [PubMed]
  64. Huang, Y.; Zeng, Y.; Jiang, P.; Chen, H.; Yang, J. Prediction of Potential Geographic Distribution of Endangered Relict Tree Species Dipteronia sinensis in China Based on MaxEnt and GIS. Pol. J. Environ. Stud. 2022, 31, 3597–3609. [Google Scholar] [CrossRef]
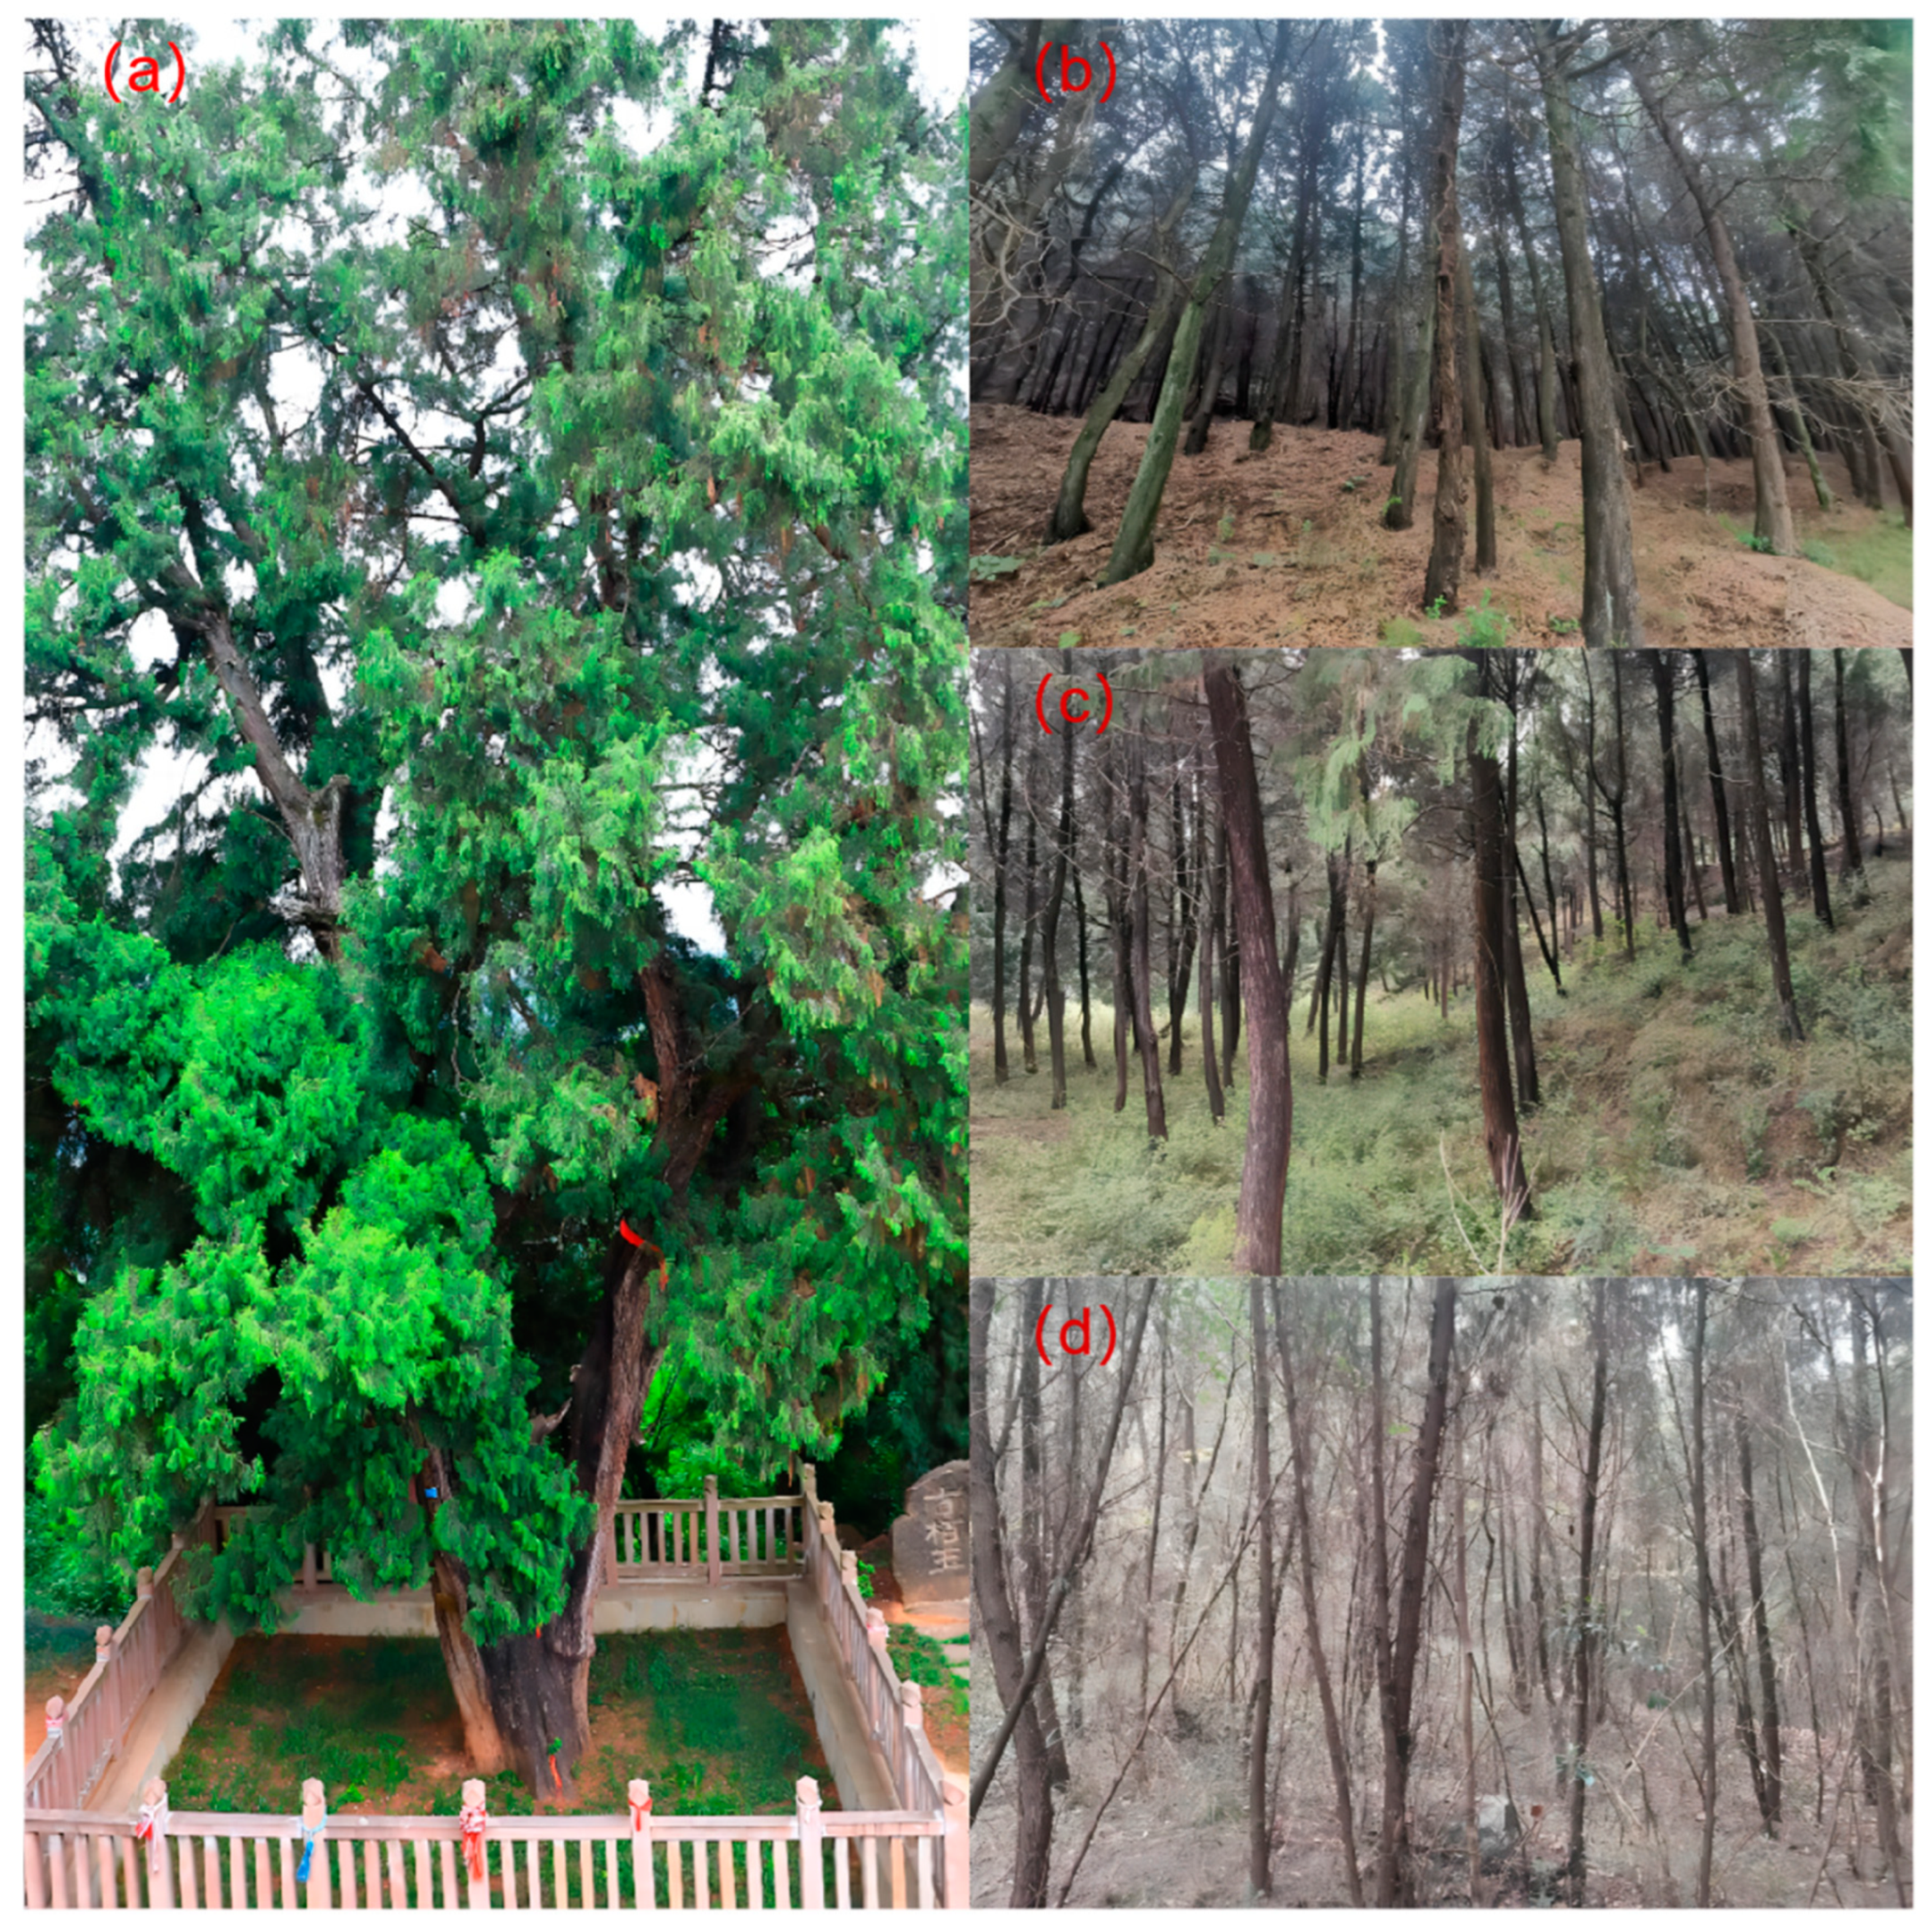
Figure 1. C. funebris photographed from a wild habitat in China. (a) Protected ancient C. funebris-king tree; (b) highly suitable habitat; (c) moderately suitable habitat; (d) marginally suitable habitat).
Forests 15 01280 g001
Figure 2. Occurrence records of C. funebris in China.
Forests 15 01280 g002
Figure 3. Current suitable distribution range for C. funebris in China.
Forests 15 01280 g003
Figure 4. Potential distributions of C. funebris in different future periods. (a) 2050s, SSP126; (b) 2090s, SSP126; (c) 2050s, SSP245; (d) 2090s, SSP245; (e) 2050s, SSP585; (f) 2090s, SSP585.
Forests 15 01280 g004
Figure 5. Ecological changes in C. funebris under different future climate scenarios. (a), (b), (c), (d), (e) and (f) respectively represent the future climate scenarios SSP50126, SSP50245, SSP50585, SSP90126, SSP90245, and SSP90585. The first two axes of the PCA are represented by PC1 and PC2. The density of species occurrence under current and future scenarios is indicated by green and red shading, respectively, while blue shading denotes overlapping areas. The solid contours encompass 100% of the available environmental space, whereas the dashed contours represent 50% of the space. The movement of the climatic ecological niche of C. funebris (solid line) and its background range center (dashed line) between the two extents are illustrated by red arrows.
Forests 15 01280 g005
Figure 6. Stand characteristics: (a) stand productivity and (b) species diversity of shrubs; (c) species diversity of herbs for C. funebris in different habitats. Note: different letters indicate significant differences (p < 0.05) between different stand densities.
Forests 15 01280 g006
Table 1. Dynamic changes in areas of C. funebris in various suitable areas under different climate scenarios.
Climate
Scenarios
Highly Suitable AreaModerately Suitable AreaLowly Suitable AreaTotal Suitable Area
Area
(104 km2)
Increase
Rate (%)
Area
(104 km2)
Increase
Rate (%)
Area
(104 km2)
Increase
Rate (%)
Area
(104 km2)
Increase
Rate (%)
Current15.651-86.601-78.509-180.760-
2050s-SSP12634.807122.39%90.6164.64%75.797−3.45%201.22011.32%
2050s-SSP24529.51488.58%110.54227.65%98.36125.29%238.41731.90%
2050s-SSP58534.920123.12%104.74020.95%95.59521.76%235.25530.15%
2090s-SSP12632.040104.72%99.25014.61%85.7719.25%217.06120.08%
2090s-SSP24523.26748.66%115.55633.43%113.10644.07%251.92939.37%
2090s-SSP58528.98685.20%110.67927.80%117.13049.19%256.79542.06%
Disclaimer/Publisher’s Note: The statements, opinions and data contained in all publications are solely those of the individual author(s) and contributor(s) and not of MDPI and/or the editor(s). MDPI and/or the editor(s) disclaim responsibility for any injury to people or property resulting from any ideas, methods, instructions or products referred to in the content.