Article

Leaf Trait Variations and Ecological Adaptation Mechanisms of Populus euphratica at Different Developmental Stages and Canopy Heights

1
Xinjiang Production & Construction Corps Key Laboratory of Protection and Utilization of Biological Resources in Tarim Basin, Alar 843300, China
2
College of Life Science and Technology, Tarim University and Research Center of Populus Euphratica, Alar 843300, China
3
Xinjiang Uygur Autonomous Region Forestry Planning Institute, Urumqi 830046, China
4
Northwest Institute of Eco-Environment and Resources, Lanzhou 730000, China
5
School of Ecology Nature Conservation, Beijing Forestry University, Beijing 100083, China
*
Author to whom correspondence should be addressed.
Forests 2024, 15(8), 1283; https://doi.org/10.3390/f15081283
Submission received: 22 June 2024 / Revised: 12 July 2024 / Accepted: 18 July 2024 / Published: 23 July 2024
(This article belongs to the Special Issue Abiotic Stress in Tree Species)

Abstract

:
The ability of plants to alter specific combinations of leaf traits during development and in response to abiotic stress is crucial for their success and survival. While there are numerous studies on the variation of leaf traits within the canopies of Populus species, the application of network analysis to understand the variation and combinations of these traits across different growth stages is rare. The leaves of Populus euphratica, a dominant species in arid regions, exhibit notable morphological variations at different developmental stages and canopy heights in response to water scarcity and climate change. In this study, 34 leaf traits (morphological, chemical, photosynthetic, and hydraulic) and their roles in drought adaptation were investigated in 60 Populus euphratica plants at five developmental stages and five canopy heights using leaf trait network (LTN) analysis. The aim was to analyze adaptive strategies to arid environments at different developmental stages and canopy heights through the interdependence of leaf traits. The results showed that the internal coordination capacity of leaf trait networks decreased and then increased with each developmental stage, while the functional modules of leaf trait networks were loosely connected and aggregated with the increase in tree diameter at breast height. With increasing canopy height, the coordination linkage’s ability between leaf traits showed an increasing then decreasing trend, and the traits of the leaves in the canopy at 6 m were more closely connected, less modular, and simpler in topology compared with those in the other layers. Leaves form functional modules by coordinating specific traits that promote growth and resist drought. Leaf photosynthesis, water transport, and nutrient traits were central to different developmental stages, whereas leaf morphology, nutrient metabolism, and drought-resistance-related traits were central to the canopy height. Leaf morphology and osmoregulatory traits play key roles in leaf trait network regulation, including leaf length and width, leaf shape index, soluble sugars, and soluble proteins, which are important “intermediary traits” in the Populus euphratica leaf network. Further analysis revealed that structural traits were important at different developmental stages and canopy heights. When resources are limited, the leaf preferentially maintains a stable connection between structural traits to enhance photosynthesis, and these traits and their combinations might confer drought resistance. During the rapid development stage, the connection between chemical traits becomes important, and the leaf grows by rapidly accumulating nutrients. In summary, this study provides new perspectives and insights into the drought adaptation strategies of P. euphratica at different developmental stages and canopy heights by analyzing leaf trait networks.

1. Introduction

As trees age or progress through their developmental stages, several physiological and morphological changes are triggered. These growth patterns and crown architecture differ significantly between different size classes. These changes include crown development, leaf restructuring, hormone level changes, nutrient partitioning reorganization, and nutrient uptake capacity optimization [1]. These changes enable plants to adapt to environmental changes; thus, the developmental stage is a key factor influencing variations in plant traits [2]. During the growth cycle, different strategies are used for energy resource allocation as the plant grows and reproduces, adapts to environmental stresses, and develops morphologically. As the canopy develops, a natural light gradient forms from top to bottom, causing changes in temperature, humidity, and wind velocity [3,4]. These changes, along with longer water paths for evaporation and increased gravitational potential, heighten drought stress on the outer leaves. This can alter the leaf morphology (limited expansion, smaller area, and thicker leaves), physiological traits (reduced photosynthesis, lower chlorophyll content, and stabilized carbon isotope composition), and anatomical traits (smaller, denser stomata, and well-developed veins) [5]. The leaf is an important plant organ that responds to environmental changes, converts energy for primary producers in the ecosystem, and determines plant productivity [6]. The energy expenditure required for leaf morphology construction is related to resource allocation, and leaf growth and development directly affect basic structural and functional changes in plants, reflecting their life adaptive strategies [7]. The response of leaf traits to heterogeneous microenvironments varies by habitat type, growth stage, and canopy position, enabling survival and access to resources [8], directly or indirectly affecting plant suitability [9]. Studies on the functional traits of plants typically focus on a fixed developmental stage of a species [10], or seedlings compared with mature plants [11]. Accordingly, the spatial variation in developmental stages and canopy height across a continuum of all individuals has not been well studied. Trait variation may differ across individual developmental stages and canopy heights and elucidating these will provide insights into the causes of developmentally driven intraspecific variations.
Attention has increasingly focused not only on individual or group plant functional traits but also on the interrelationships and trade-offs among these traits. Wright et al. [12] described the concept of the leaf economics spectrum, which describes coordinated changes in blade structural, functional, and physiological traits in response to a resource gradient. This concept also assumes a trade-off between the structural cost of leaves and time required to recover resources through leaf economic traits. This suggests that, as plants age, they tend to shift from “faster” to “slower” growth and nutrient utilization strategies. LES studies are based on multivariate analyses of data from different species and ignore the relationship between individual developmental variations in intra- and interspecific traits [13]. In addition, the application of the leaf economics spectrum (LES) has mainly focused on the adaptation of leaf traits to abiotic factors; for example, Liu et al. explored the variation in LES between different ecosystems, temperature zones, vegetation types, and functional groups [14]. Although some studies have shown that changes in the developmental stage of individual plants are important in influencing the LES [15], understanding the linkages between functional traits at various developmental stages is crucial to enhancing the predictive power of the LES.
Populus euphratica, a deciduous tree, serves as a pioneering species for windbreaks and sand fixation in the arid and extremely arid regions of Northwest China. Unlike Fremont cottonwood (Populus fremontii), which relies on shallow groundwater in similarly arid areas of the United States [16], P. euphratica utilizes deep groundwater. Its leaf heteromorphism is a distinctive adaptation to drought conditions. This unique trait, combined with its ability to stabilize soils and prevent desertification, underscores the critical role of P. euphratica in maintaining ecological balance and biodiversity in harsh desert environments [17]. This characteristic is related to the developmental stages, manifesting as strip-shaped leaves on young trees. As the tree matures, lanceolate, ovate, and broad ovate leaves gradually appear in the canopy [18]. The theoretical framework of leaf morphology’s dynamic changes across the developmental stages provides the background for this study. Zhai et al. demonstrated, through correlation, regression, and principal component analyses, that P. euphratica leaves exhibit more pronounced xerophytic structures and higher photosynthetic capacity as the developmental stages progress and the canopy height increases [19]. However, these analytical methods have limitations in assessing the relationships among multiple plant traits, failing to fully capture the nonlinear relationships and complex interactions between variables. Network analysis, an effective method for quantifying complex relationships among multiple traits, can be used to visually represent interdependencies, providing a comprehensive understanding of plant adaptation strategies. Li et al. identified the interrelationships between plant traits under different environmental conditions and different life stages using network analysis [20]. To elucidate the relationships and functional change characteristics among traits during plant growth and development, this study uses network analysis to examine the leaf traits of P. euphratica. The main objectives are to (1) investigate leaf trait networks and adaptive characteristics at different developmental stages and canopy levels; (2) identify key traits and their functional transformations within the leaf trait network; and (3) explore the connectivity among structural, chemical, and anatomical traits across different developmental stages and canopy heights. Analyzing the evolutionary trends of leaf functional traits in P. euphratica will help to reveal resource utilization patterns and functional trade-offs at different stages of the plant life cycle.

2. Materials and Methods

2.1. Study Area, Sampling, and Measurements

The study area encompassed 180.6 hectares of natural P. euphratica mixed forest on the northwestern edge of the Tarim Basin in Xinjiang (81°17′56.52″ E, 40°32′36.90″ N, elevation 980 m). This region has a temperate desert climate, with an average annual rainfall of 50 mm, potential evapotranspiration of 1900 mm, an average temperature of 10.8 °C, and 2900 h of sunshine annually. Understory species include tamarisk, reed, and black-fruited wolfberry. Surveys and sampling were conducted during the 2019 growing season (July to August).
We employed a widely random distribution sampling method, referencing the sampling method described in the paper by Sun [21]. During sampling, we ensured a 30 m interval between trees to avoid the genetic variability caused by clonal reproduction. Sixty trees in total were studied with 12 trees within each diameter class (i.e., 4, 8, 12, 16, and 20 cm DBH). We selected these diameter classes because we observed that reproductive structures appeared on Populus euphratica individuals with diameters greater than 4 cm, and the number of flower buds increased with increasing diameter class [22]. The trees were chosen from open areas to ensure they received ample sunlight and were not affected by shading. The distance from the base of the canopy to the top was two-thirds of the sampling point. Crown height was selected from mature P. euphratica wood with a diameter in the range of 18–20 cm, evenly divided into five crowns (samples were taken from the canopies at 2, 4, 6, 8, and 10 m). For trees in different developmental stages, leaf samples were collected from the penultimate node on the annual branches at the two-thirds height of the crown from the four cardinal directions (east, south, west, and north). For each tree, a total of 100 g of leaves was collected. For mature Populus euphratica trees in the 20-diameter class, we sampled 100 g of leaves from five different crown layers in the four cardinal directions. The experimental design is demonstrated in Figure 1.

2.2. Measurement and Data Collection

2.2.1. Structural Traits in Leaf Anatomy and Morphology

The plant samples consisted of 100 g of leaves previously collected from each tree divided into three sections, with 20 leaves randomly selected from each section. In addition, for trees of 20 diameters, 20 leaves were selected from different canopy layers. (1) Part I. Leaves were collected, and the main veins and leaf margins were retained for cutting. The material was fixed in a formalin–acetic-acid–ethanol (FAA) solution. Anatomical mounts were obtained via paraffin sectioning. Fenestrated tissue, spongy tissue, upper epidermal cell, and lower epidermal cell thicknesses were observed and measured using a Leica microscope (Leica DM4 B, Wetzlar, Germany). Palisade to spongy ratio (PS) = fenestrated tissue/spongy tissue, leaf compactness density (LCD) = (fenestrated tissue/blade thickness) × 100%, and leaf looseness density (LLD) = (spongy tissue thickness/blade thickness) × 100%. (2) Part II. Leaves were collected to determine leaf morphology, and leaf thickness and petiole length were measured using Vernier calipers, whereas leaf length (LL), leaf width (LW), leaf area (LA), and leaf perimeter were measured using SCANNER (MRS-9600TFU2, Shanghai, China) and LA-S plant image analysis software (LEAFSHAPES 2.0). The leaf index was calculated using the leaf length/leaf width ratio.

2.2.2. Leaf Nutrients, Carbon Isotopes, and Chemical Traits of Endogenous Hormones

The leaves remaining after leaf morphology treatment were placed in a preheated oven. The oven temperature was raised to 105 °C for 30 min. The oven temperature was then lowered to 80 °C and dried for 48 h to obtain a constant weight. The dried samples were pulverized, passed through 90-mesh and 60-mesh sieves, and the carbon isotope composition of the purified gases was analyzed using a stable gas isotope mass spectrometer (Thermo Fisher Scientific, Inc., Waltham, MA, USA). The leaf nitrogen, phosphorus, potassium, and organic carbon were analyzed using elemental analyzers. (3) Part III. Leaves were placed in liquid nitrogen and stored at −80 °C for physiological hormone indices analysis, and an enzyme immunoassay was used to determine abscisic acid (ABA), gibberellin (GA3), indole acetic acid (IAA), and zeatin riboside (ZR). Leaf soluble proteins (LSPs) were determined by the Cauloblue method, and leaf soluble sugar (SSC) and leaf starch (LS) were determined by the anthrone colorimetric method [23].

2.2.3. Leaf Photosynthetic Indices and Physiological Traits of Proline and Malondialdehyde Concentrations

Four additional branches were collected from each tree, and sample leaves from the penultimate node position on the annual branches were used to analyze photosynthetic parameters. The photosynthetic gas exchange characteristics of each fully expanded leaf were measured using a portable photosynthesis system LI-COR 6400XT (LI-COR, Lincoln, NE, USA). The light-saturated net photosynthesis rate (Pn), stomatal conductance (Gs), intercellular CO2 concentration (Ci), transpiration rate (Tr), and instantaneous water-use efficiency (WUEi) of the leaves were calculated as follows: WUEi = Pn/Tr. The leaf proline (Pro) content (μg/g) was determined by the acidic ninhydrin method [24], and the malondialdehyde (MDA) content (μmol/g) was measured by the thiobarbituric acid colorimetric method [25].
In this study, 34 different types of leaf traits were measured and functionally categorized into three types: structural, chemical, and physiological traits, as shown in Supplementary Table S1.

2.3. LTN Establishment

LTNs of P. euphratica leaves at different developmental stages and in different canopies were obtained to reveal differences in trait associations from juvenile to adult tree developmental stages and spatial differences in leaf canopies of whole trees. In LTNs, plant traits are nodes, and trait–trait connections are edges [20]. First, a matrix of trait–trait coefficients was calculated using the Pearson correlation coefficient and absolute values.
(|r|) was used to calculate the strength of the relationships between traits. To avoid spurious relationships between traits, the trait–trait coefficients were set to 1 at the p < 0.05 level and 0 when insignificant. Next, the adjacency matrix A = [ai,j] and ai,j ∈ [0, 1] was obtained. Thus, LTN only indicated the presence or absence of correlations between traits. The absolute magnitude of the correlation coefficient was used to weigh the edges between pairs of leaf traits [26]. The final LTN visualization was performed using the ggplot2 package in the R language.
Five overall network parameters and two node parameters were selected to describe the traits within the LTN. The diameter indicates the longest shortest path between any two connected nodes, the average path length represents the mean shortest path between all node traits, and the edge density is the ratio of actual edges to the maximum possible edges [27]. Modularity measures how separate subnetworks (or modules) are, with the traits of similar functions being interrelated and grouped into a module [28]. The mean clustering coefficient is the average of all traits’ clustering coefficients in the leaf trait network, with higher values indicating that only some traits have synergies with specific traits [29]. The degree is calculated as the sum of all neighboring edges of the focal trait in the network. Plant traits with high values are considered “central traits”. The median of the focal trait is determined by the number of shortest paths between the pairs of traits that include the focal trait [30].

2.4. Statistical Analysis

LTNs were constructed and network parameters were calculated using the R package “igraph”. To obtain the uncertainty range of the network parameters, 75% of the plant traits were randomly selected, i.e., the actual number of sampled traits was 25 ≤ n ≤ 34, and 999 random replications were performed. Alternative sampling methods were used to determine 100 LTNs for each combination and their level parameters were calculated. The “mean” and “standard error” of these parameters were calculated and visualized using “ggplot2”.
Duncan’s multiple range test compared the mean values of network parameters among plant traits. One-way ANOVA assessed the relative importance of the plant trait networks at the different developmental stages and canopy layers among the three structural traits. Absolute importance was calculated as the average degree of each trait, while relative importance was the absolute importance divided by the sum of all trait degrees. Trait data were log-transformed before analysis. All statistical analyses and visualizations were performed using Origin (2021) and R software (version 4.3.2, 2023), with a significance level of p < 0.05.

3. Results

3.1. Developmental Stage P. euphratica LTN Characteristics

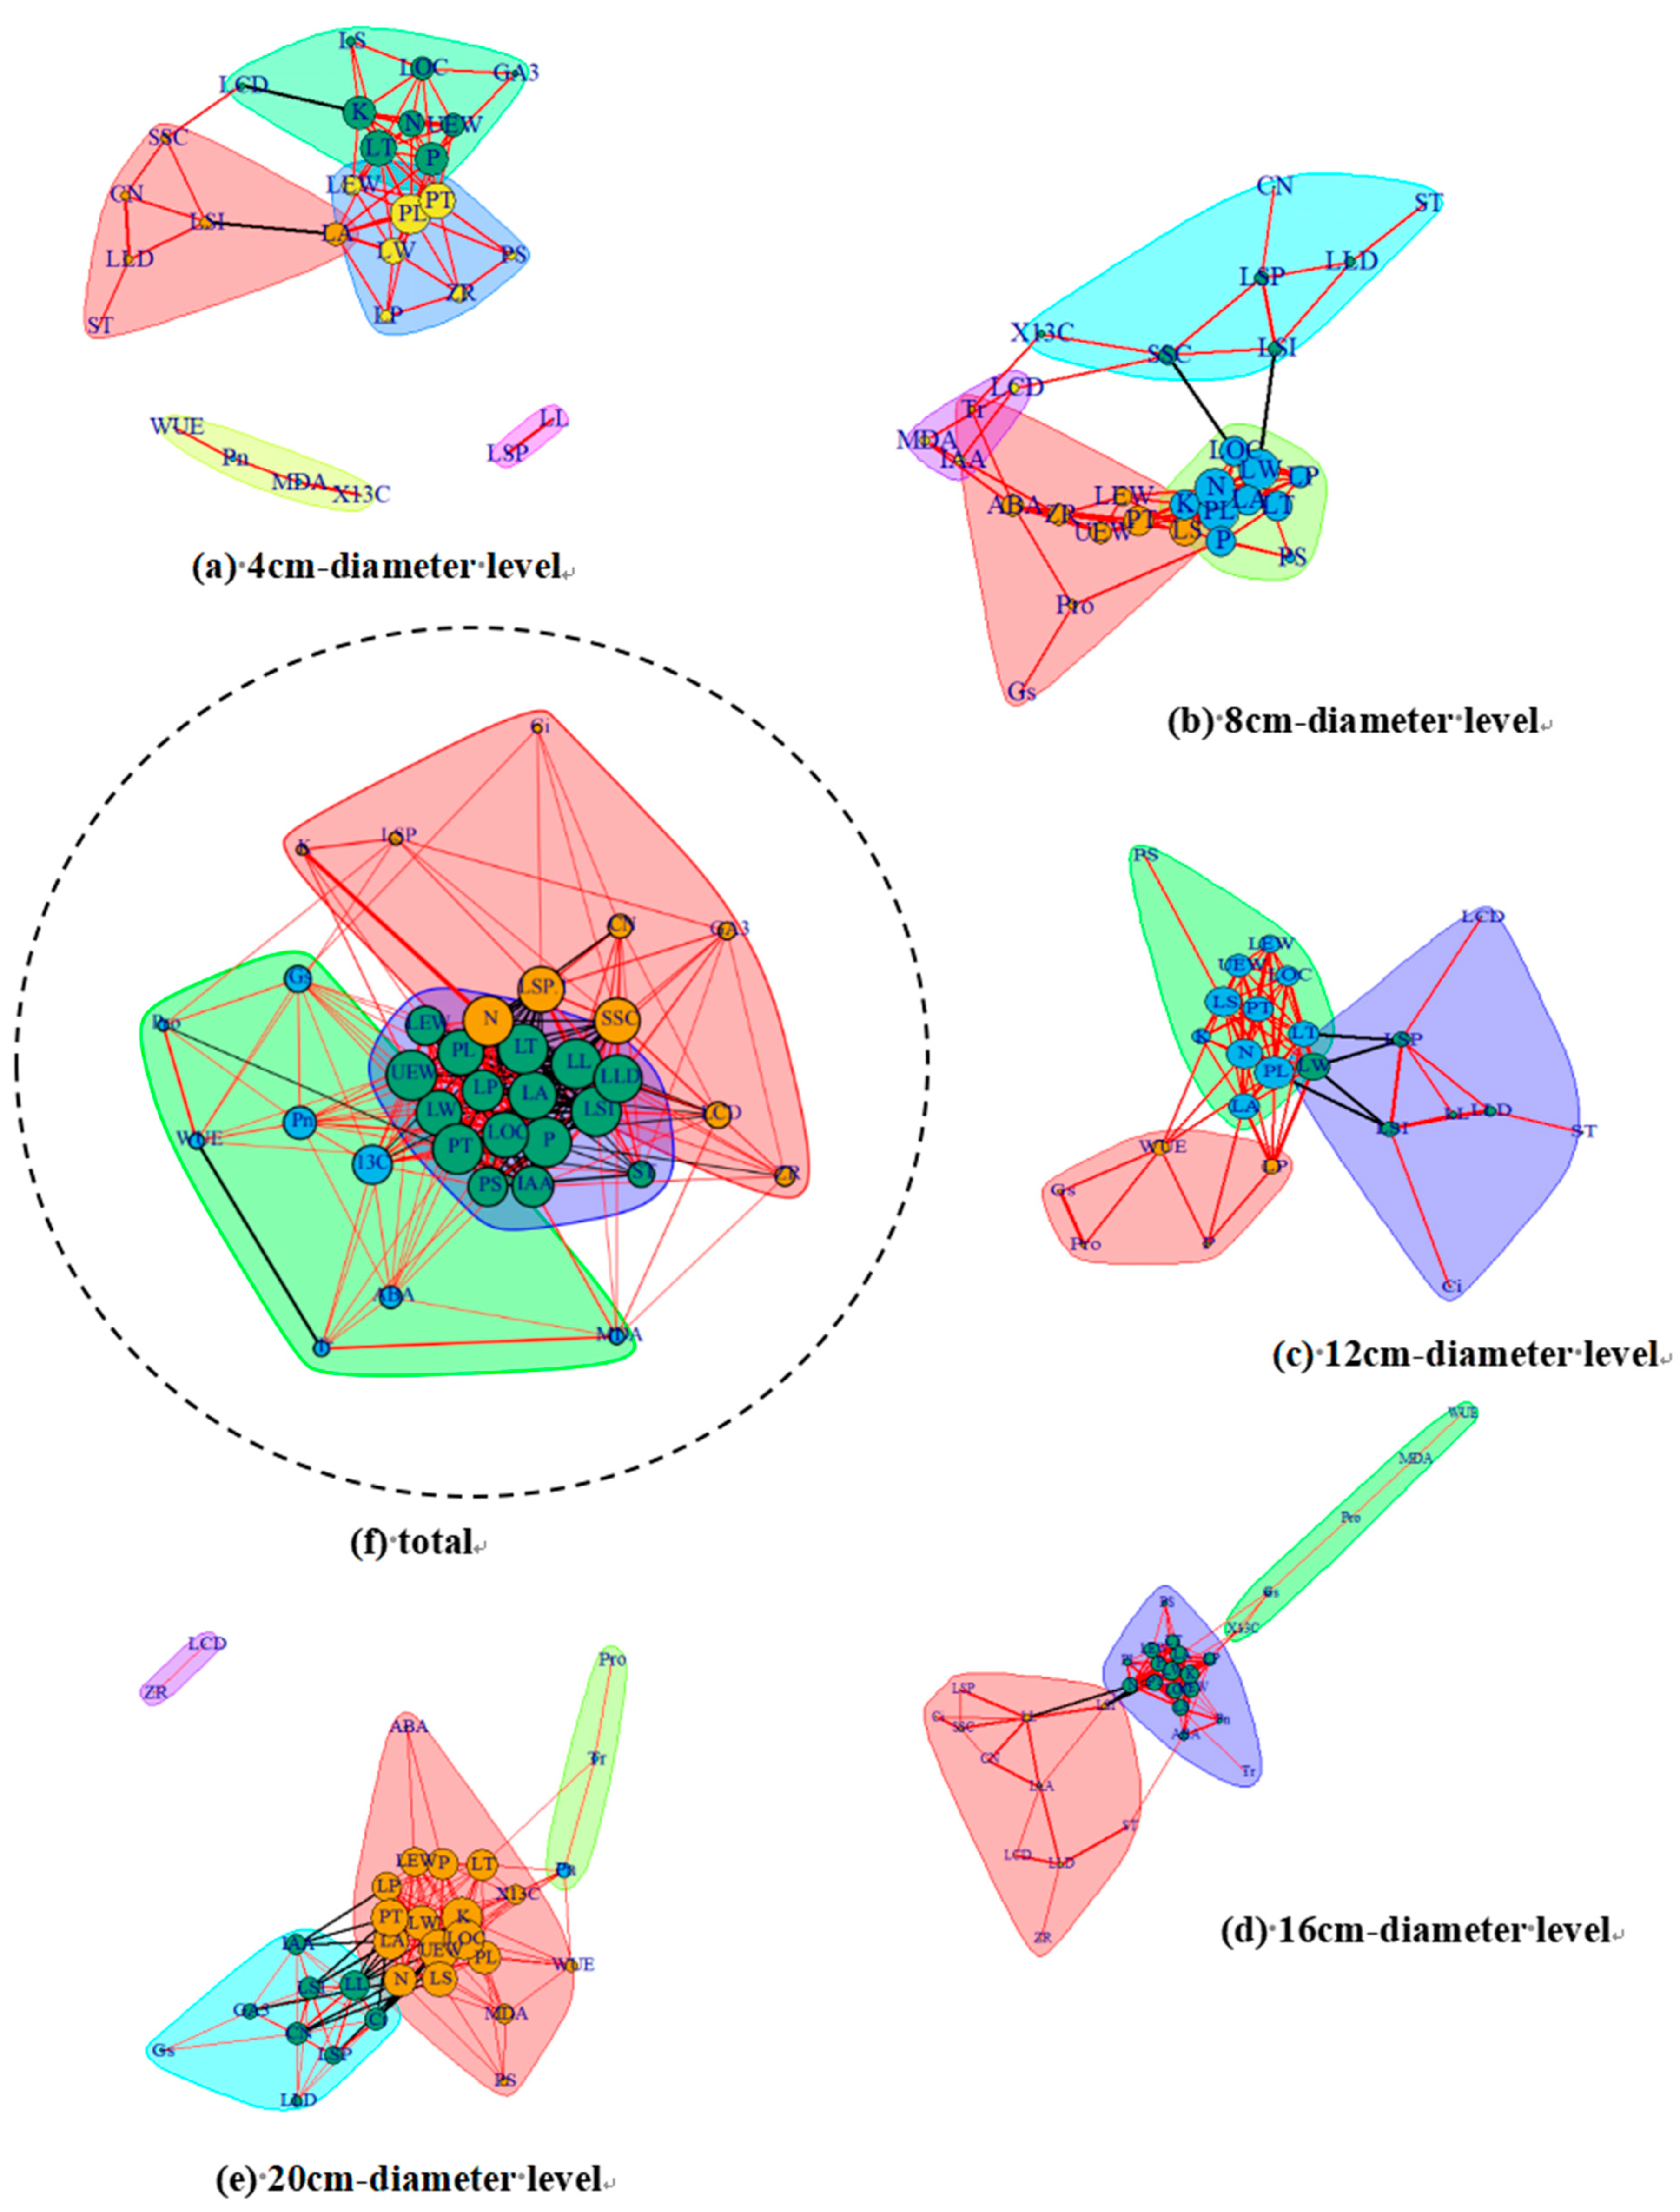
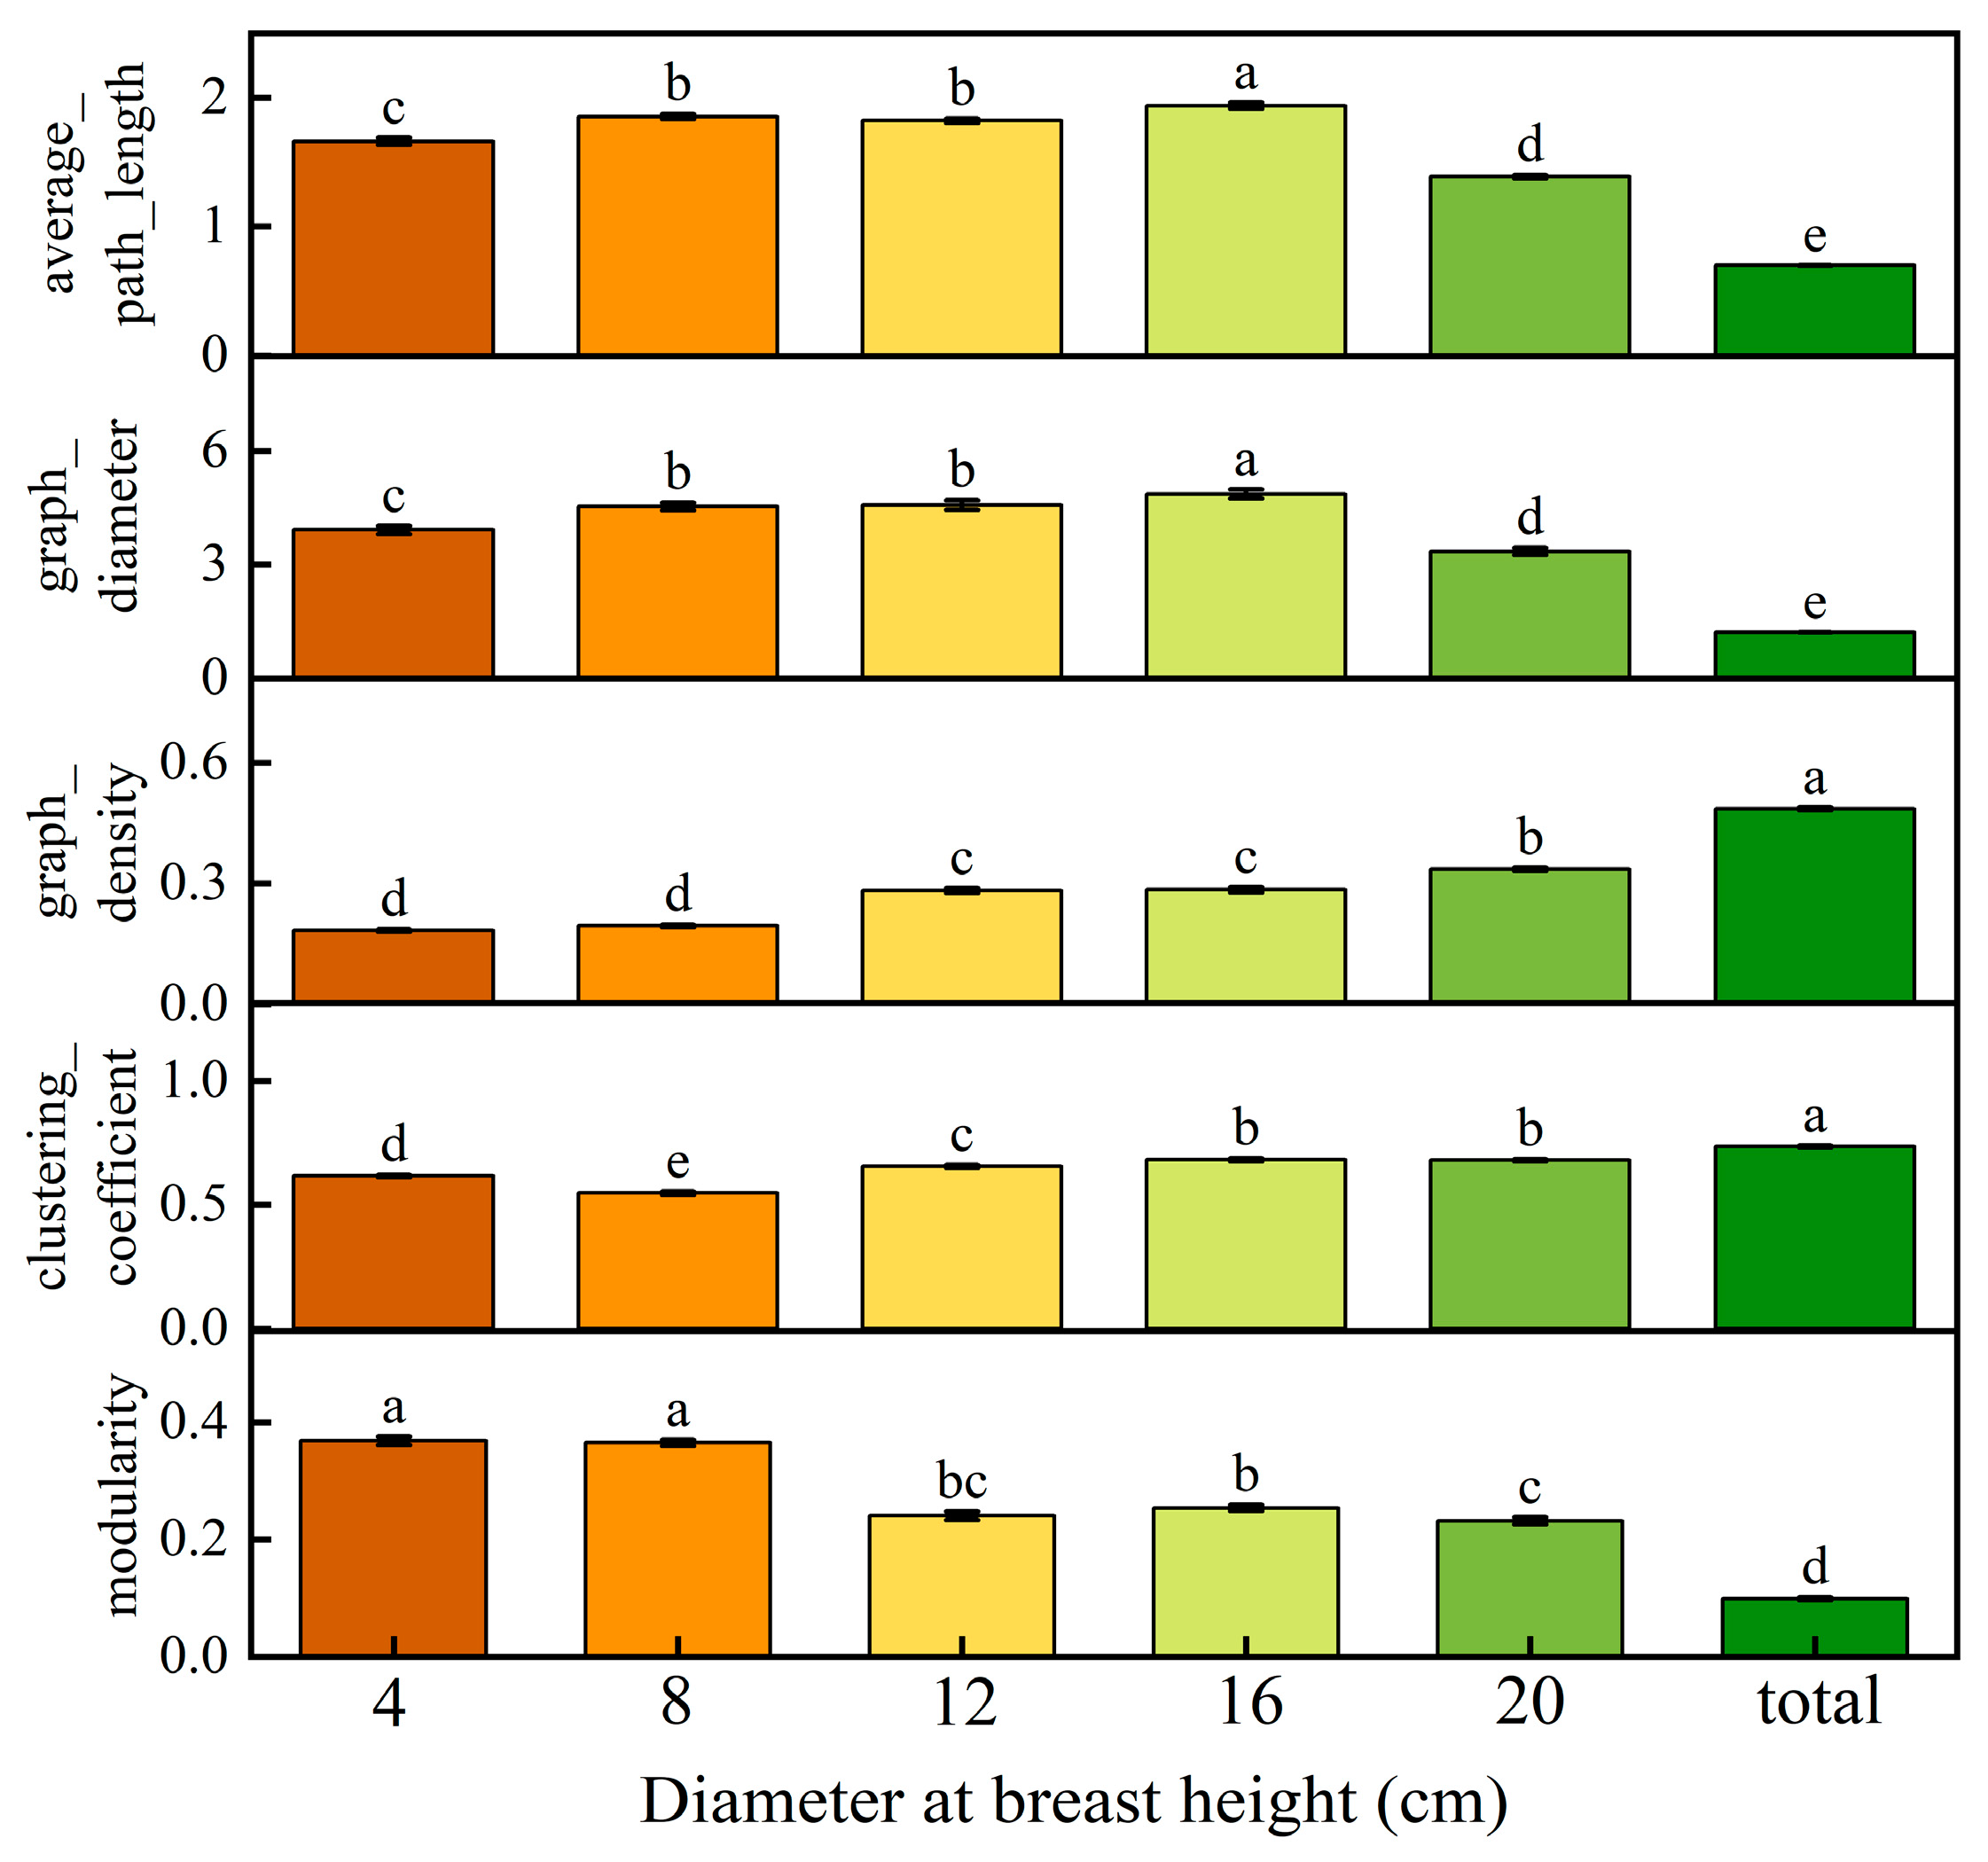
A correlation analysis of P. euphratica leaf traits across five developmental stages was conducted, and heteromorphic leaf trait networks were constructed for each stage and the overall developmental process (Figure 2). A positive correlation between most traits at all developmental stages is depicted. Additionally, their network parameters were calculated, and there were significant differences in the overall parameters of the leaf trait networks of different orders in terms of mean path length, edge density, diameter, clustering coefficient, and degree of modularity, and most of the traits were positively correlated (Figure 3). As the diameter class increased, the average path length and diameter of the leaf trait network of P. euphratica increased, and then decreased, and were the largest at the 16 cm diameter level (1.94; 4.86). The average clustering coefficient was opposite to it and was the smallest at the 8 cm diameter level (0.55); the degree of modularity of the network showed a tendency of decreasing, and the edge density showed a tendency of increasing. However, in the overall leaf trait network, the average path length, diameter, and modularity were noticeably lower than in each developmental stage, while the edge density and clustering coefficient were higher.

3.2. Central and Linkage Traits in Developmental Stage of P. euphratica (LTN)

The comparison of the nodal parameters of the LTN at different developmental stages and during the overall development of P. euphratica revealed (Figure 4) that the trait with the highest network structure neutrality at the 4 cm diameter level was petiole length, and the leaf area had a high median; at the 8 cm diameter level, the traits with the highest neutrality were petiole length, leaf width, and leaf total nitrogen, and the trait with the high median was leaf soluble sugar; at the 12 cm diameter level, the trait with the highest neutrality was petiole length, and the trait with the highest median was leaf soluble proteins; the traits with the highest median in the 16 cm diameter class were leaf width and leaf total potassium content, and the trait with the highest median value was leaf length; the traits with the highest median values in the 20 cm diameter class were the leaf total potassium content, leaf organic carbon content, and thickness of the upper epidermal cells of the leaf, and the trait with the highest median value was the leaf total potassium content. These results indicate that the leaf trait networks of P. euphratica at the five different developmental stages exhibited different functions.
Comparing the nodal parameters of the overall trait network of P. euphratica leaves during development, some leaf traits (P, N, UEW, PT, LT, LSI, and LL) were increased, and stomatal conductance (Gs) exhibited the highest mesostasis.

3.3. LTN Characterization in Different Mature P. euphratica Canopies

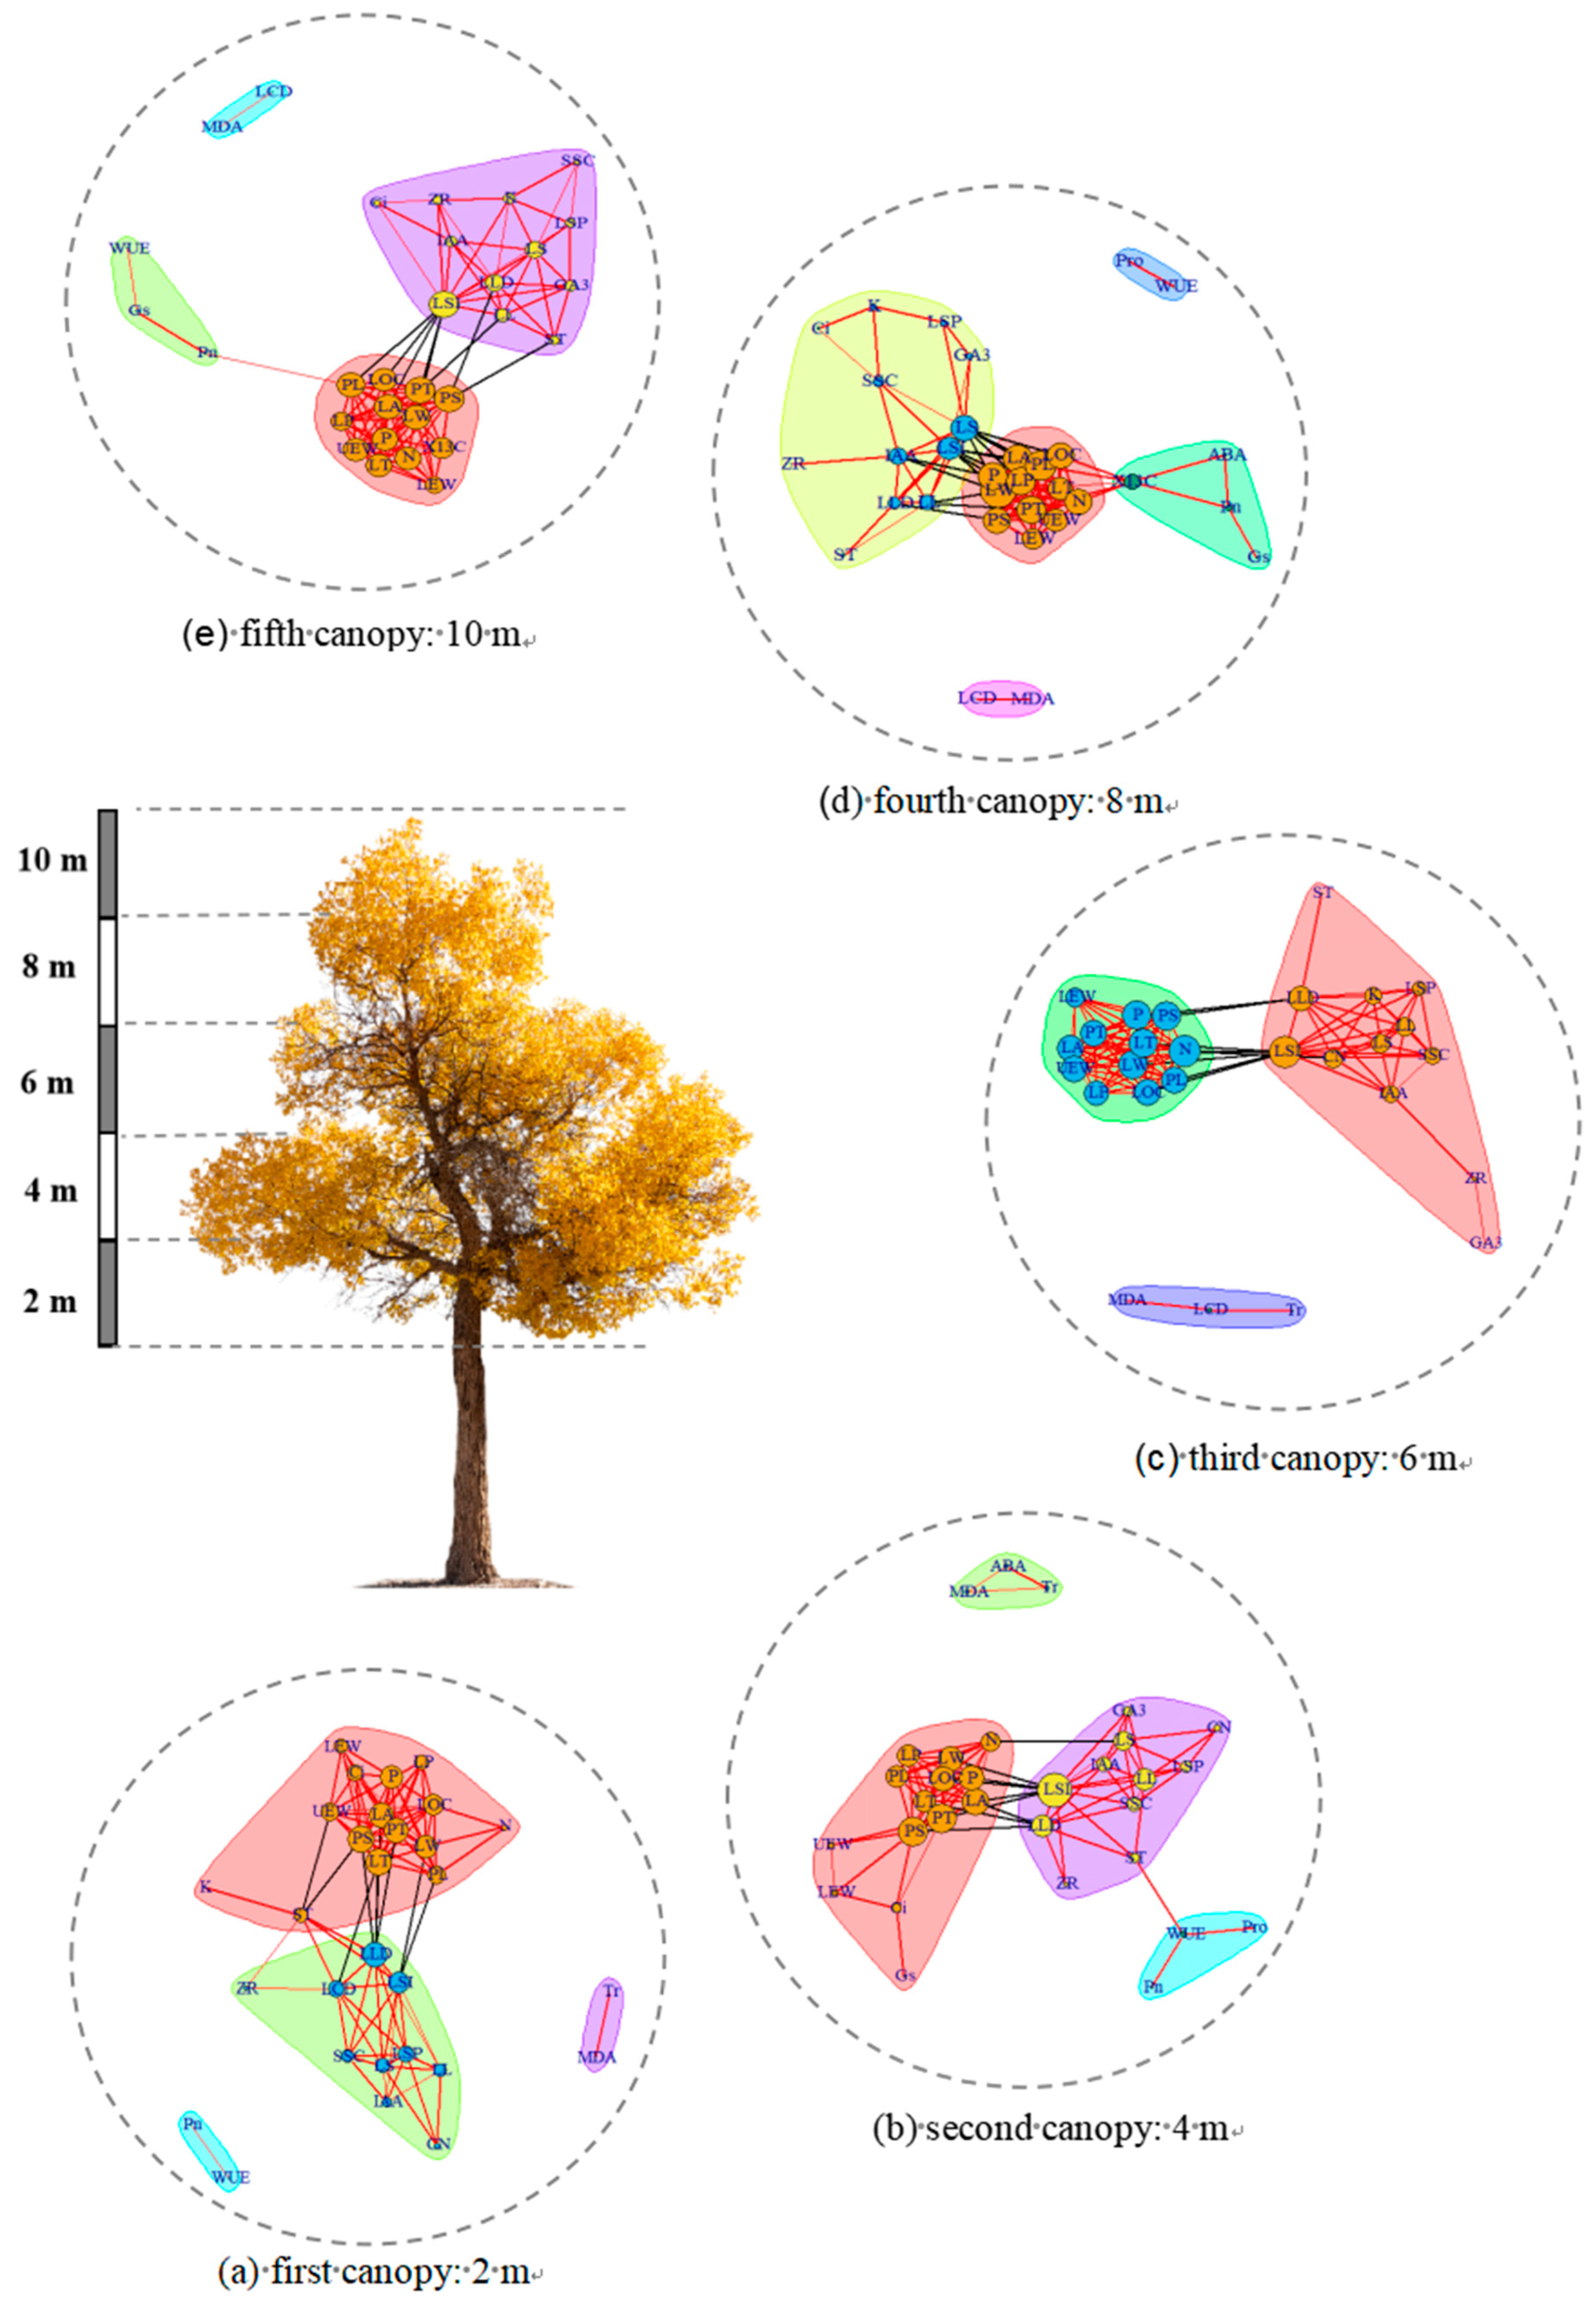
Correlation analysis of the leaf traits of P. euphratica in five different crowns was performed, and the heteromorphic leaf trait networks of P. euphratica individuals and overall developmental stages in five crowns high were constructed (Figure 5).
The overall parameters of leaf trait networks varied significantly among different canopy layers in terms of average path length, edge density, diameter, clustering coefficient, and modularity. Most traits showed positive correlations. As the height of the tree canopy increased, the average path length and diameter of the P. euphratica leaf trait network exhibited a trend of first decreasing and then increasing. Notably, these values reached their lowest at the 6 m canopy height. This pattern suggests that the leaf trait network becomes more efficient and compact up to a certain height, after which it begins to expand again (1.60; 3.65). The clustering coefficient and edge density were opposite to each other and were the largest in the 6 m canopy (0.31; 0.80). The degree of the modularity of the network was the highest in the 4 m canopy (0.42), which was significantly higher than that in the 2 m, 8 m, and 10 m canopies (Figure 6).

3.4. Identification of Central and Linkage Traits in Different P. euphratica Canopies

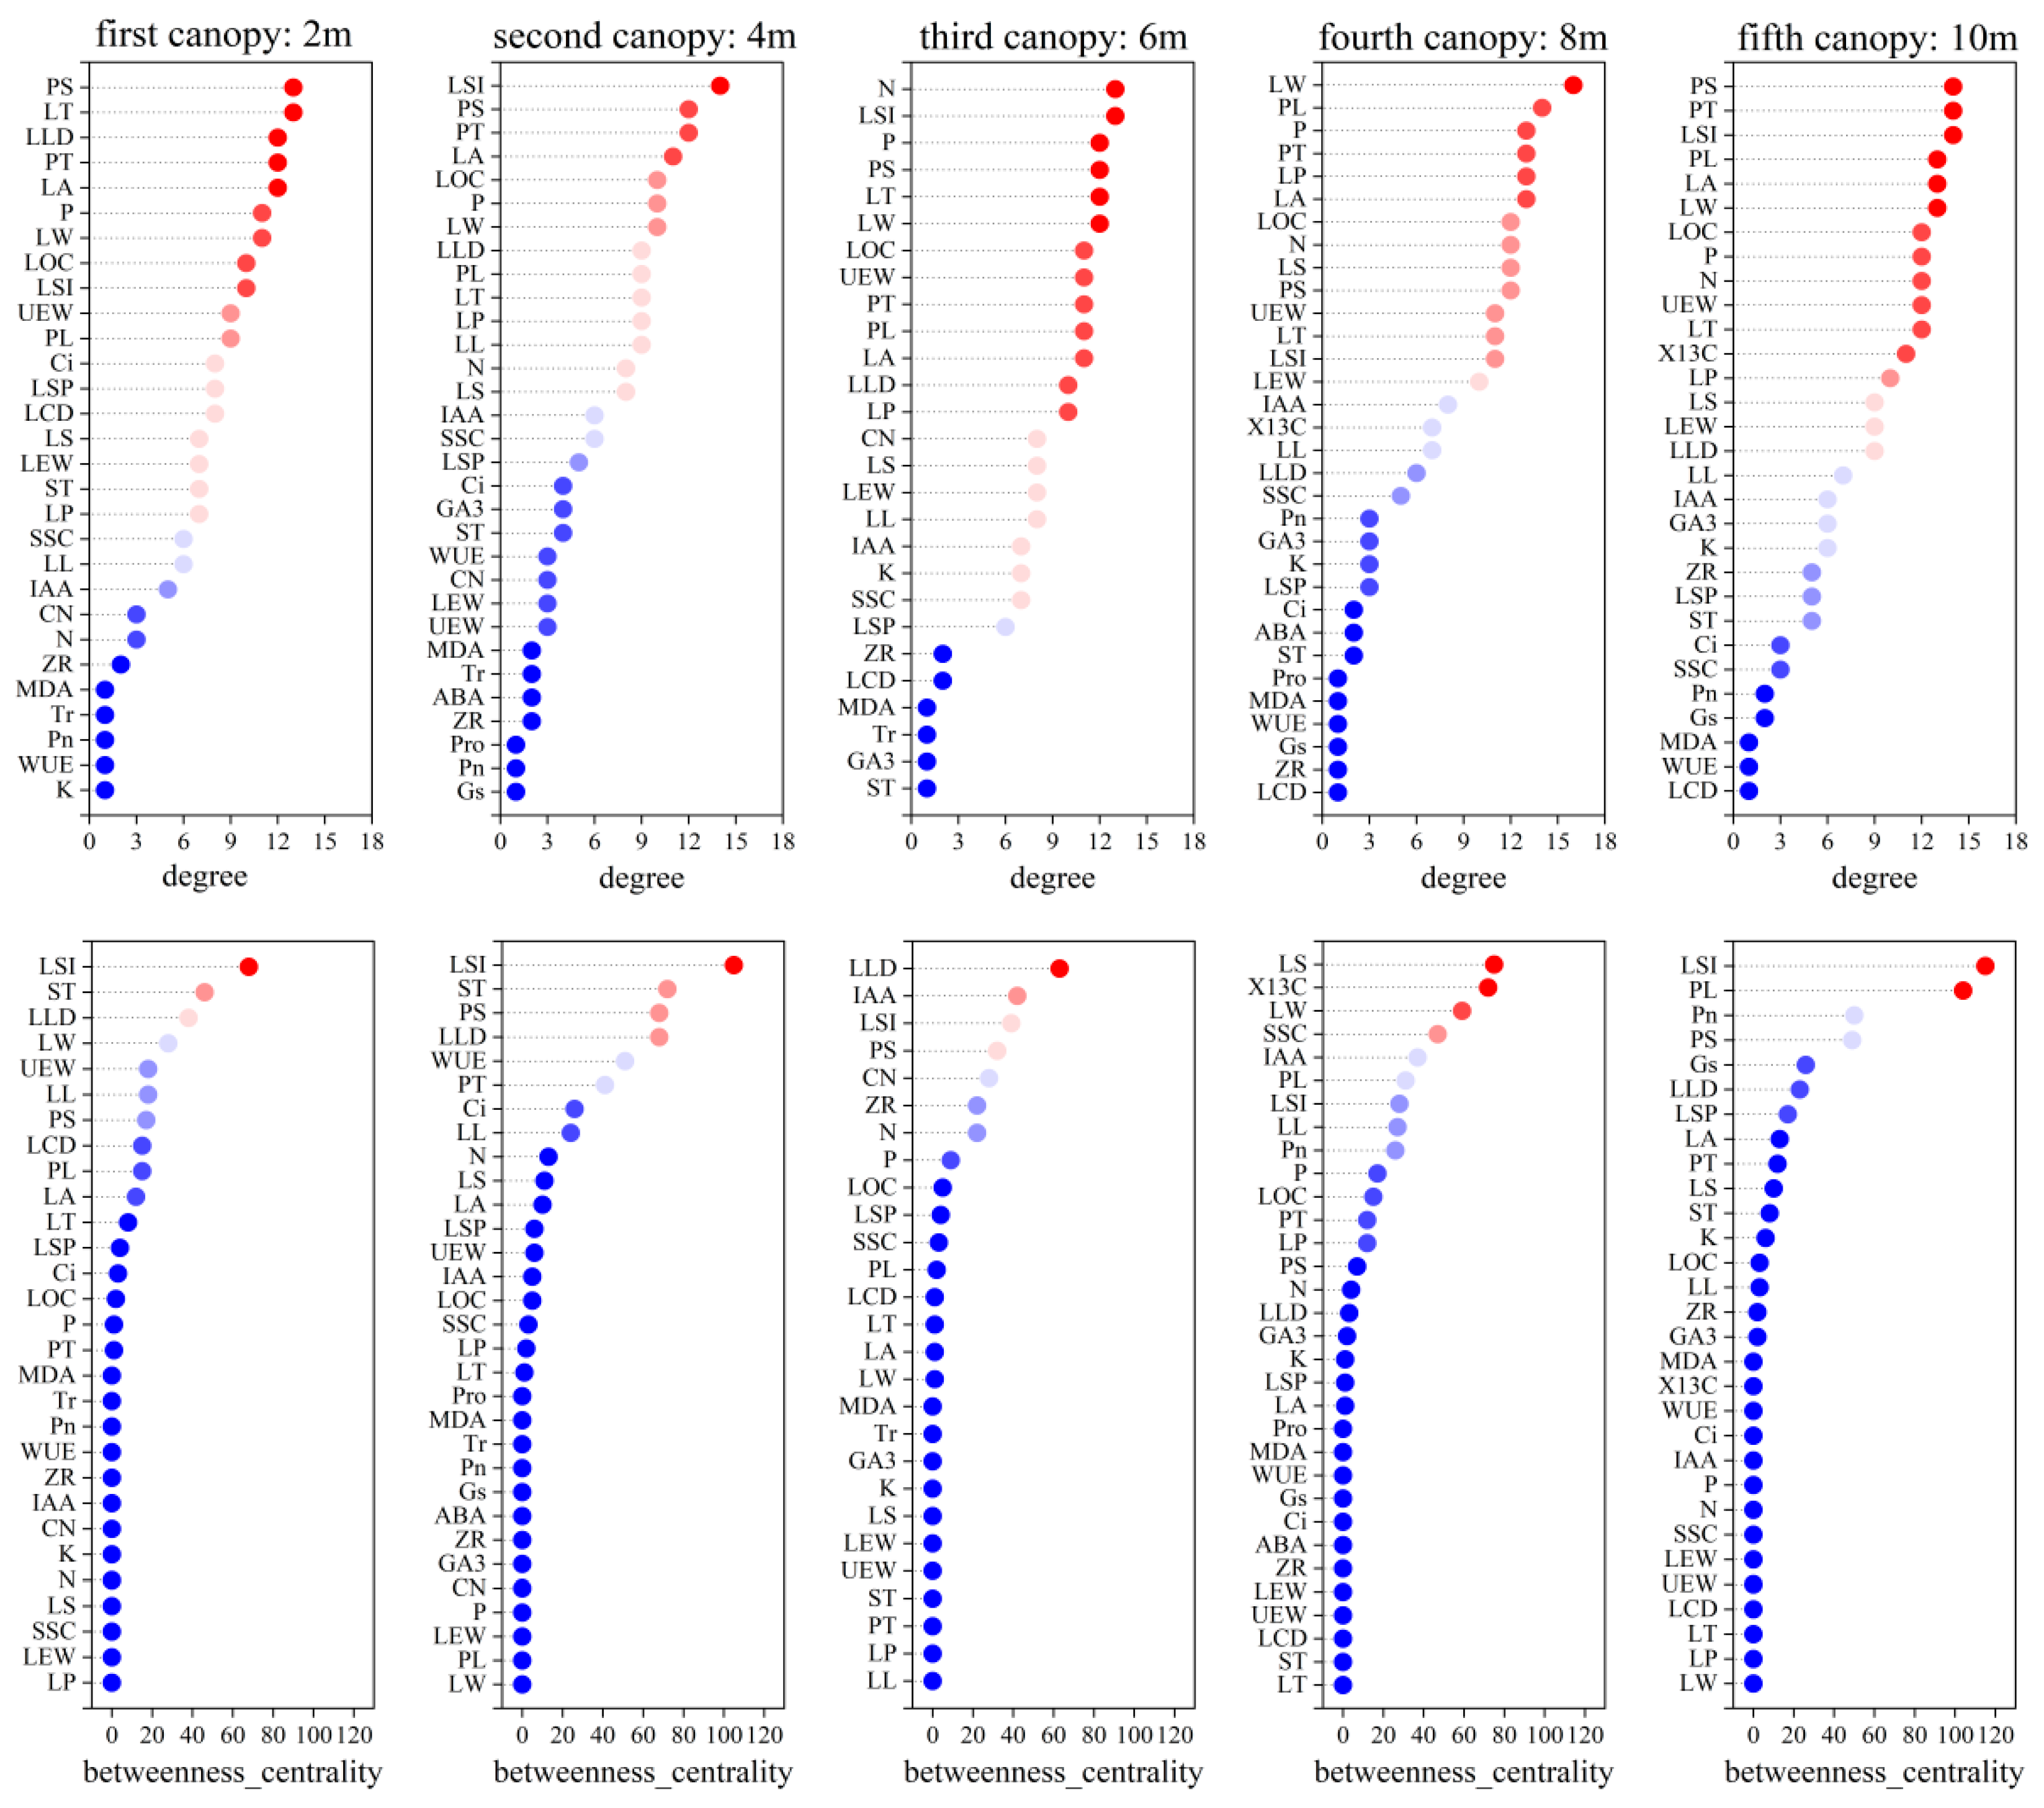
A comparison of the nodal parameters of the leaf trait network in different canopy layers of P. euphratica revealed that the highest degree of network structure in the 2 m canopy layer was the fenestrated tissue ratio, and the leaf shape index had the highest median value; in the 4 m canopy layer, the leaf shape index had the highest degree and median value; in the 6 m canopy layer, the traits with the highest degrees were nitrogen content and leaf shape index, and the highest median trait was leaf laxity; in the 8 m canopy layer, the trait with the highest degree was leaf width, and that with the highest median valley was leaf starch content; finally, in the 10 m canopy layer, the traits with the highest degree were the leaf shape index, fence ratio, and tissue thickness, and that with the highest median value was leaf shape index. The highest moderate trait in the fourth canopy was leaf width, and that with the highest median value was leaf starch content. The highest moderate traits in the fifth canopy were the leaf shape index, fenestrated tissue ratio, and fenestration tissue thickness, and the trait with the highest median value was leaf shape index. These results suggest that the network of foliar traits in the five different canopy layers of P. euphratica exhibited different highly adaptive strategies (Figure 7).

3.5. Connectivity between Structural, Chemical, and Physiological Traits in Developmental Stage P. euphratica Leaves

A comparison of the relative importance of structural, chemical, and physiological traits in P. euphratica leaves at different developmental stages revealed that (Figure 8) physiological traits were the least important at all developmental stages, with significant differences in importance from structural and chemical traits. Structural traits were significantly more important than either chemical or physiological traits in 4 cm diameter, 16 cm diameter and 20 cm diameter trees, and chemical traits were significantly more important than structural and physiological traits in 12 cm diameter trees (Figure 6). Overall, the relative importance of leaf structural traits was significantly higher than that of the chemical and physiological traits. When comparing the relative importance of structural, chemical, and physiological traits among P. euphratica leaves in different canopy layers, the following order was evident in all high-canopy networks (Figure 8): structural traits > chemical traits > physiological traits.

4. Discussion

4.1. Developmental Stage Poplar Leaf Trait Network Differences and Linkages

The patterns of the covariation and magnitude of variation among leaf traits may change as a result of plant ontogeny, such as reduced leaf integration in seedling plants and increased interconnectedness in reproductive-stage plants [31]. Variations in LTN parameters demonstrated the interdependence between multiple traits, with LTNs with higher diameters and average path lengths showing higher overall independence and weaker synergies between traits. Increased modularity suggests clearer boundaries between functional modules [25]: strong internal connections and weak external connections between modules. The traits of each module were interrelated and performed specific functions [15], while being relatively independent of the traits of other modules. Decreases in the edge density and average clustering coefficient indicate weakened synergism between traits, meaning reduced resource utilization efficiency and leaf productivity [32]. The decrease in the average clustering coefficient suggests that traits were more inclined to function independently, rather than by composing functional modules to fulfill specific functions.
With increasing P. euphratica breast diameter, LTNs presented a complex topology; they were tight and complex in the developmental and mature stages, while some modules were loosely assembled in the juvenile period. The average path length and diameter first increased and then decreased, the edge density and average clustering coefficient increased, and the modularity decreased. These network parameters indicate that the interdependence of traits in P. euphratica leaves at lower and higher diameter stages was greater than at other developmental stages. Higher trait interdependence may facilitate efficient resource access and mobilization [33]. The differences in developmental stage networks were likely due to the limitation of resource availability during different developmental periods. Plants with low resource availability may experience stronger selection, resulting in tighter trait correlations and trade-offs [34]; for example, leaf economic traits are closely related to extreme drought in arid regions [35]. In this study, 4 cm diameter P. euphratica with a low height and small crown size had mostly striped leaves, which were less available for light resources than unstriped leaves, and 20 cm diameter P. euphratica was affected by arid climate and temperature, with mostly broad ovate leaves, high transpiration rate, and low water availability. Therefore, small- and large-diameter P. euphratica have developed cost-effective strategies to make leaf traits closely related to each other in order to promote growth, development, and flexibility. This increased adaptability allows them to better respond to and thrive in changing environmental conditions, ensuring their survival and growth despite variations in their surroundings

4.2. Highly Correlated Traits in Developmental-Stage Poplar Leaf Trait Network

In this study, we quantified the importance of traits within the LTN (i.e., their connectivity and centrality) using node parameters. A highly connected trait (i.e., a hub trait) meant that the trait was highly correlated with other traits in the network, suggesting that it may regulate key functions that affect the entire phenotype [36]. Focal trait mediators (B) were identified as mediators and bridges connecting different trait modules and played a crucial role in optimizing multiple functional coupling relationships in plants.
In the 4, 8, and 12 cm diameter P. euphratica, the petiole length was the leaf trait most closely linked to the other traits. There is a tendency for the stem mass fraction to increase as plants grow, which is usually due to the fact that larger plants need to invest proportionately in the organs that support their leaves in a position where they are exposed to sunlight [37]. Petiole length is critical for the spatial distribution of leaves, prevention of self-shading, leaf nutrient and water transport capacity, and especially for the ability of leaves to capture light resources, which play an important role in the functional trade-off between photosynthetic efficiency and support costs [38]. The central traits of P. euphratica at the 8 cm diameter were nitrogen content and leaf width, which were closely related to trophic development and morphological changes. K is a central trait common to P. euphratica leaves at the 16 cm and 20 cm diameter stages, and K content is an important trait affecting leaf growth, photosynthesis, and water potential responses, which are involved in plant metabolism, growth regulation and development, enzyme activation, and protein synthesis [2]. During these two stages, P. euphratica ensures photosynthetic efficiency by regulating its leaf potassium content while enhancing the drought tolerance of the leaves. Additionally, the leaf organic carbon content and upper epidermal cell thickness are central traits of P. euphratica leaves at the 20 cm diameter stage. A high leaf-organic-carbon content also leads to higher leaf construction costs, increased leaf longevity, and enhanced overall plant photosynthesis. The thickness of the leaf upper epidermal cells is increased to prevent water loss from the leaf at high temperatures in order to adapt to extreme drought conditions. Consistent with Barton and Koricheva [39], plants tend to invest in constitutive defenses later in life, which could explain the shift toward tissues with conserved traits.
Throughout the stages of P. euphratica leaf development, traits related to growth and development (such as P, N, LSI, and LL) and water retention functional traits (such as upper epidermal cell thickness (PT), fenestrated tissue thickness (LT), and upper epidermal cell thickness (UEW)) form the core of the trait network. P and N are key elements affecting photosynthesis and growth, and increases in their contents strengthen the structural characteristics of the leaves, indicating their dominant role in regulating the growth of P. euphratica leaves. Changes in the leaf shape index and length signify adaptive changes in morphology and structure, whereas the features of water-retaining tissues, such as thick upper epidermal cells and leaf thickness, are critical for resisting high temperatures, reflecting the structural basis of the adaptation of P. euphratica to environmental changes.
As the developmental stage changed, the traits with high mediator numbers in the network shifted sequentially from leaf area, soluble sugar, soluble protein, leaf length, and K. Such traits can bridge and mediate the network by linking traits from different modules and play important roles in coupling different functional modules, which are all closely linked to leaf shape changes, growth hormones, and drought-related traits in other functional modules and might play roles in growth and stress tolerance. In particular, stomatal conductance played a bridging and mediating role in regulating water use and adaptation to drought conditions throughout the developmental stages, reflecting its centrality in the network by linking different traits and enhancing the synergistic effects of the physiological and structural traits.

4.3. Highly Correlated Traits in Developmental-Stage Poplar Leaf Trait Network

In this study, the average path length and diameter decreased and then increased with increasing canopy height, whereas the trends in edge density, average clustering coefficient, and modularity were the opposite. The topology of the 6 m canopy LTNs was simpler and had a looser network with fewer modules than the other canopy LTNs. This indicates that there was coordination among leaf traits in the 6 m canopy, whereas leaf trait networks at the other canopy heights were less synergistic, externally loose, and had better synergy among specific traits in specific functional modules. Plants under extreme environmental threats to growth reduce variations in specific traits, which results in disjointed traits, rendering the entire network less connected [15]. Leaves in the low (2 m)- and high (12 m)-canopy layers of trees can experience different stressors. Low-canopy foliage is stressed by dynamic fluctuations in light availability, multiple environmental stressors, and limited foliage adaptive capacity, which may limit its adjustment to light availability [40]. The high canopy of trees in arid zones is severely affected by environmental stresses, and leaves are subjected to water stress under extreme heat and drought conditions with long heating times and high transpiration rates [2]. Leaves will adjust to trait changes, such as stomatal conductance and leaf thickness, to adapt to high-pressure environments. Functional modules with a high degree of modularity for multiple traits in low- and high-canopy leaves can provide flexibility for the drought tolerance and growth of P. euphratica leaves.

4.4. Highly Correlated Traits in a Network of Poplar Leaf Traits at Different Canopy Heights

Central traits showed minor variations across leaf trait networks in different canopy layers. In the 2 m canopy mesocosm, traits related to drought tolerance and water retention, such as leaf thickness, were more prominent. P. euphratica increased water loss from vascular bundles to the outer epidermis while regulating leaf thickness to enhance water storage and transport efficiency [41,42]. The 4 m and 6 m canopy traits were related to changes in leaf shape (leaf shape index) and a high degree of leaf shape change occurred by adjusting the leaf aspect ratio to alter leaf morphology, dry matter content, nitrogen content, and chlorophyll levels to enhance photosynthetic efficiency and carbon gain [43]. A high centrality of N was also evident in the third canopy, and leaves play a key role in promoting plant growth by adjusting nitrogen content and optimizing nutrient-use rates [44]. Intraleaf nitrogen partitioning is critical for maximizing photosynthetic efficiency and biomass production [45]. The 8 m canopy also had a higher degree of traits related to leaf shape variation (leaf width), which was altered by regulating leaf width; wider leaves have a higher chlorophyll content, photosynthetic efficiency, and energy distribution between photosystems, ultimately improving the light-use efficiency (Wang and Chen, 2013). In addition, wider leaves are associated with reduced transpiration rates without affecting biomass accumulation, suggesting the potential for increased plant transpiration efficiency [46]. The 10 m canopy possessed a high degree of traits related to drought tolerance and leaf shape change (fenestration-to-tissue ratio, fenestrated tissue thickness, and leaf shape index), suggesting that large leaf areas at the top of the growing range enhance drought tolerance by regulating fenestration-to-tissue ratios and their thicknesses to counteract excessive water transpiration due to high temperatures and achieve maximum photosynthetic efficiency. The leaf shape index exhibited high median values in the 2 m, 4 m, and 10 m canopies, playing an intermediary and bridging role, connecting growth and development-related functional traits with drought tolerance-related functional traits. Leaf laxity exhibited a high median value in the 6 m canopy, and changes in leaf laxity can regulate stomatal opening and closing to influence plant gas exchange and maintain water within the leaf [47]. The leaf starch content in the 8 m canopy had a high mesocosmic number, and LS played a role as a bridge in growth and development, energy exchange, and material storage, coupled with various traits in different functional modules. Leaf starch content was also crucial in the leaf network traits at the 8 m canopy, which resulted in the highest mesocosmic number.
Through the “transfer strategy” of synergistic changes in traits among different canopy layers, P. euphratica exhibited continuous optimization of the leaf area of heteromorphic leaves, and nutrient utilization, and enhanced photosynthesis and drought tolerance from the base to the top of the canopy, forming a unique growth and stress-resistant adaptation strategy in the vertical space of P. euphratica’s canopy.

4.5. Effects of Different Developmental Stages and Canopy Heights on the Composition of Trait Relationships

Among the different developmental stages and the overall plant trait network of P. euphratica, the structural traits of the 4, 16, and 20 cm diameter stages and the overall developmental network were important, and the importance of structural traits highlights their critical role in the plant’s adaptation to extreme environmental conditions, enabling it to sustain its life activities in an environment with limited water resources [36]. These structural adjustments can significantly increase the photosynthetic efficiency and drought tolerance of plants, thereby improving their survival. At the juvenile stage, P. euphratica may be focused on maximizing light capture through adjustments to its structural traits. At the adult stage, P. euphratica may be more focused on the efficient use and conservation of water, as it builds up a large biomass during this period, and the water required to maintain this biomass is more critical under drought conditions. Therefore, the plants prioritize strengthening the linkages between leaf morphological and structural traits, enhancing leaf structure robustness, and reducing physical damage from droughts, thus adapting to drought stress and enhancing drought resistance.
The chemical traits were more important than the structural and physiological traits at the developmental stages of 8 and 12 cm diameter trees. This suggests that the chemical traits play a key role in supporting leaf growth and increasing the efficiency of carbon assimilation during the rapid developmental stages of plant growth. This may be because, at this stage, plants are actively expanding their leaf area to capture more photosynthetically active radiation and require large amounts of nutrients to support such growth. Similarly, at the 8 and 12 cm diameter developmental stages, P. euphratica still faces challenges, such as drought. Strategies to optimize leaf construction costs and carbon assimilation by adjusting the chemical traits in drought environments reflect not only the direct response of plants to current environmental conditions but also adaptive strategies in anticipation of future resource shortages. These prospective adaptive mechanisms may be critical for long-term plant survival and reproduction in changing environments.
The degree of leaf anatomical structure and morphological characteristics was significantly higher than that of chemical traits in the network of P. euphratica leaf traits in different canopy layers, and chemical traits were less important compared to leaf structural and morphological traits. P. euphratica forests in the Tarim River Desert are situated in an arid zone with a hot climate and limited water supply. [38]. Therefore, to adapt to drought stress and maintain normal survival and growth, the plants prioritize enhancing the connections between leaf morphological and structural traits, improving leaf structure robustness, and reducing physical damage from drought.
Although P. euphratica was analyzed in detail in this study, the limitations of its geographic range may limit the generalizability of the results. In addition, this study did not consider the effects of seasonal and annual climatic variability; a longitudinal study across seasons and years would be more comprehensive. This study focused primarily on drought stress and did not address factors such as soil composition, nutrient availability, and biological interactions that may significantly affect leaf traits. Finally, focusing on the poplar, a drought-adapted species, the results may not be applicable to other species with different ecological adaptations. Comparing studies of multiple species will help to generalize the findings.

5. Conclusions

In summary, we examined the variations in the traits and LTNs of P. euphratica across different developmental stages. We found that internal coordination within the LTN first decreased and then increased with tree diameter. As the internal connections among the leaf trait modules weakened, the external connections became stronger, indicating a pattern of localized looseness and overall cohesion. Trees with larger diameters exhibited fewer modules and a simpler network topology but tighter internal connections. Therefore, trees in advanced developmental stages depend on strong trait synergies to optimize their adaptations to arid environments. Meanwhile, for canopy height, coordination in LTNs first increased and then decreased with canopy height. Owing to environmental factors, such as light, temperature, and water, the leaf networks in the apex and lower canopy were tightly linked internally but loosely connected externally, suggesting that environmental stress prompts leaves to coordinate specific traits to form functional modules.
The petiole length and growth-related indicators were central to the developmental stage networks of P. euphratica; the phosphorus and potassium content and leaf thickness are also key components. As the canopy height increased, the leaf structure prioritized transpiration reduction while improving water retention and photosynthetic capacity. The leaf shape index acted as a bridge, coupled with the structural, growth, water retention, and drought resistance functions. Thus, structural traits were crucial across all stages and canopy layers, while chemical traits were prioritized during the rapid growth stages to sustain leaf development. This study provides valuable insights into how P. euphratica adapts to growth, drought resistance, and environmental stress through its leaf trait networks.
Future studies should be extended to different geographical regions and other drought-adapted plant species to verify the generalizability and applicability of the results of this work. They should also incorporate other abiotic stressors (e.g., temperature extremes and salinity) and biotic interactions (e.g., pests, diseases, and symbiotic relationships) to comprehensively analyze the effects of these factors on leaf trait networks. In addition, conducting longitudinal studies across seasons and years will help to provide insights into the dynamics of leaf traits and their networks in the context of seasonal changes and annual climate variability. In-depth studies in these directions will allow for a more comprehensive understanding of plant adaptive strategies in response to changing environmental conditions and promote the fields of ecology and plant physiology.

Supplementary Materials

The following supporting information can be downloaded at: https://www.mdpi.com/article/10.3390/f15081283/s1, Table S1: The full name, short name and unit of leaf traits of 34 different functional types.

Author Contributions

Conceptualization, J.W. and Z.L.; methodology, J.W.; software, J.W. and J.Z. (Jinlong Zhang); validation, J.W., J.Z. (Juntuan Zhai) and X.H.; formal analysis, J.W.; investigation, J.W.; resources, X.G.; data curation, J.Z. (Juntuan Zhai); writing—original draft preparation, J.W.; writing—review and editing, J.W.; visualization, J.W.; supervision, J.S. and J.L.; project administration, Z.L.; funding acquisition, Z.L. All authors have read and agreed to the published version of the manuscript.

Funding

This research was funded by Xinjiang Uygur Autonomous Region “Tianshan Talents” support program—Science and technology innovation team, grant number 2023TSYCTD0019, and the President’s Fund Key Cultivation Plan of Tarim University, grant number TDZKZD202301. The APC was funded by the President’s Fund Key Cultivation Plan of Tarim University.

Data Availability Statement

The datasets generated for this study are available on request to the corresponding author.

Acknowledgments

The authors are grateful to Tarim University for providing a technical service and support in the research area; to the Key Laboratory of Protection and Utilization of Biological Resources in Tarim Basin of Xinjiang Production and Construction Corps for providing equipment.

Conflicts of Interest

The authors declare that they have no known competing financial interests or personal relationships that could have appeared to influence the work reported in this paper.

References

  1. Bryant, K.; Fredericksen, B.; Hudiburg, T.; Rosenthal, D. Physiological Strategies for Handling Summer Water Stress Differ among Co-Existing Species and between Juvenile and Mature Trees. Front. For. Glob. Chang. 2023, 5, 1018789. [Google Scholar] [CrossRef]
  2. Kumar, D.; Scheiter, S.; Langan, L.; Koirala, S.; Pfeiffer, M.; Martens, C.; Weber, U.; Carvalhais, N. Investigating the Spatial and Temporal Variation of Plants Traits across Flux Sites Using a Trait-Based Dynamic Vegetation Model. In EGU General Assembly Conference Abstracts; EGU-6385; Astrophysics Data: Washington, DC, USA, 2023. [Google Scholar]
  3. Legner, N.; Fleck, S.; Leuschner, C. Within-Canopy Variation in Photosynthetic Capacity, SLA and Foliar N in Temperate Broad-Leaved Trees with Contrasting Shade Tolerance. Trees 2013, 28, 263–280. [Google Scholar] [CrossRef]
  4. Shen, T.; Corlett, R.T.; Collart, F.; Kasprzyk, T.; Guo, X.; Patiño, J.; Su, Y.; Hardy, O.J.; Ma, W.; Wang, J.; et al. Microclimatic Variation in Tropical Canopies: A Glimpse into the Processes of Community Assembly in Epiphytic Bryophyte Communities. J. Ecol. 2022, 110, 3023–3038. [Google Scholar] [CrossRef]
  5. Ryan, M.G.; Phillips, N.; Bond, B.J. The Hydraulic Limitation Hypothesis Revisited. Plant Cell Environ. 2006, 29, 367–381. [Google Scholar] [CrossRef]
  6. Dong, N.; Prentice, I.C.; Wright, I.J.; Evans, B.J.; Togashi, H.F.; Caddy-Retalic, S.; McInerney, F.A.; Sparrow, B.; Leitch, E.; Lowe, A.J. Components of Leaf-Trait Variation along Environmental Gradients. New Phytol. 2020, 228, 82–94. [Google Scholar] [CrossRef]
  7. Adler, P.B.; Salguero-Gomez, R.; Compagnoni, A.; Hsu, J.S.; Ray-Mukherjee, J.; Mbeau-Ache, C.; Franco, M. Functional Traits Explain Variation in Plant Life History Strategies. Proc. Natl. Acad. Sci. USA 2013, 111, 740–745. [Google Scholar] [CrossRef]
  8. Jones, T.A.; Thomas, S.C. Leaf-Level Acclimation to Gap Creation in Mature Acer Saccharum Trees. Tree Physiol. 2007, 27, 281–290. [Google Scholar] [CrossRef]
  9. Violle, C.; Enquist, B.J.; McGill, B.J.; Jiang, L.; Albert, C.H.; Hulshof, C.; Jung, V.; Messier, J. The Return of the Variance: Intraspecific Variability in Community Ecology. Trends Ecol. Evol. 2012, 27, 244–252. [Google Scholar] [CrossRef]
  10. Xu, R.; Cheng, S.; Zhou, J.; Tigabu, M.; Ma, X.; Li, M. Intraspecific Variations in Leaf Functional Traits of Cunninghamia lanceolata Provenances. BMC Plant Biol. 2023, 23, 92. [Google Scholar] [CrossRef]
  11. Ritter, L.J.; Medina, M.; Goya, J.F.; Campanello, P.I.; Pinazo, M.A.; Arturi, M.F. Functional Traits and Growth Rate Response to Stand Variables: Differences between Saplings and Seedlings of Native Trees Established in Loblolly Pine Plantations in the Atlantic Forest. New For. 2022, 54, 311–324. [Google Scholar] [CrossRef]
  12. Wright, I.J.; Reich, P.B.; Westoby, M.; Ackerly, D.D.; Baruch, Z.; Bongers, F.; Cavender-Bares, J.; Chapin, T.; Cornelissen, J.H.C.; Diemer, M.; et al. The Worldwide Leaf Economics Spectrum. Nature 2004, 428, 821–827. [Google Scholar] [CrossRef]
  13. Cao, J.; Chen, J.; Yang, Q.; Xiong, Y.; Ren, W.; Kong, D. Leaf Hydraulics Coordinated with Leaf Economics and Leaf Size in Mangrove Species along a Salinity Gradient. Plant Divers. 2023, 45, 309–314. [Google Scholar] [CrossRef]
  14. Liu, Z.; Zhao, M.; Zhang, H.; Ren, T.; Liu, C.; He, N. Divergent Response and Adaptation of Specific Leaf Area to Environmental Change at Different Spatio-Temporal Scales Jointly Improve Plant Survival. Glob. Chang. Biol. 2022, 29, 1144–1159. [Google Scholar] [CrossRef]
  15. Krieg, C.P.; Seeger, K.; Campany, C.; Watkins, J.E.; Mcclearn, D.; Mcculloh, K.A.; Sessa, E.B. Functional Traits and Trait Coordination Change over the Life of a Leaf in a Tropical Fern Species. Am. J. Bot. 2023, 110, e16151. [Google Scholar] [CrossRef]
  16. Moran, M.E.; Aparecido, L.M.T.; Koepke, D.F.; Cooper, H.F.; Doughty, C.E.; Gehring, C.A.; Throop, H.L.; Whitham, T.G.; Allan, G.J.; Hultine, K.R. Limits of Thermal and Hydrological Tolerance in a Foundation Tree Species (Populus fremontii) in the Desert Southwestern United States. New Phytol. 2023, 240, 2298–2311. [Google Scholar] [CrossRef]
  17. Cao, D.; Li, J.; Huang, Z.; Baskin, C.C.; Baskin, J.M.; Hao, P.; Zhou, W.; Li, J. Reproductive Characteristics of a Populus euphratica Population and Prospects for Its Restoration in China. PLoS ONE 2012, 7, e39121. [Google Scholar] [CrossRef]
  18. Huang, W.J.; Li, Z.J.; Yang, Z.P.; Bai, G.Z. The structural traits of Populus euphratica heteromorphic leaves and their correlations. Acta Ecol. Sin. 2010, 30, 4636–4642. [Google Scholar]
  19. Zhai, J.; Zhang, X.; Li, Z.; Han, X.; Zhang, S. Differences in the Functional Traits of Populus Pruinosa Leaves in Different Developmental Stages. Plants 2023, 12, 2262. [Google Scholar] [CrossRef]
  20. Li, Y.; Liu, C.; Xu, L.; Li, M.; Zhang, J.; He, N. Leaf Trait Networks Based on Global Data: Representing Variation and Adaptation in Plants. Front. Plant Sci. 2021, 12, 710530. [Google Scholar] [CrossRef]
  21. Sun, J.; Xu, J.; Qiu, C.; Zhai, J.; Zhang, S.; Zhang, X.; Wu, Z.; Li, Z. The Chromosome-Scale Genome and Population Genomics Reveal the Adaptative Evolution of Populus pruinosa to Desertification Environment. Hortic. Res. 2024, 11, uhae034. [Google Scholar] [CrossRef]
  22. Zheng, Y.; Fei, M.; Li, Z. Investigation of Bud Burst, Shoot Growth and Leaf Expansion in Populus euphraticaof Different Ages. Shengtai Xuebao 2015, 35, 1198–1207. [Google Scholar] [CrossRef]
  23. Chou, Q.; Cao, T.; Ni, L.; Xie, P.; Jeppesen, E. Leaf Soluble Carbohydrates, Free Amino Acids, Starch, Total Phenolics, Carbon and Nitrogen Stoichiometry of 24 Aquatic Macrophyte Species along Climate Gradients in China. Front. Plant Sci. 2019, 10, 442. [Google Scholar] [CrossRef] [PubMed]
  24. Rehman, A.U.; Bashir, F.; Ayaydin, F.; Kóta, Z.; Páli, T.; Vass, I. Proline Is a Quencher of Singlet Oxygen and Superoxide Both in In Vitro Systems and Isolated Thylakoids. Physiol. Plant. 2020, 172, 7–18. [Google Scholar] [CrossRef]
  25. Ghosh, U.K.; Islam, M.N.; Siddiqui, M.N.; Cao, X.; Khan, M.A.R. Proline, a Multifaceted Signalling Molecule in Plant Responses to Abiotic Stress: Understanding the Physiological Mechanisms. Plant Biol. 2022, 24, 227–239. [Google Scholar] [CrossRef]
  26. Kleyer, M.; Trinogga, J.; Cebrián-Piqueras, M.A.; Trenkamp, A.; Fløjgaard, C.; Ejrnaes, R.; Bouma, T.J.; Minden, V.; Maier, M.; Mantilla-Contreras, J.; et al. Trait Correlation Network Analysis Identifies Biomass Allocation Traits and Stem Specific Length as Hub Traits in Herbaceous Perennial Plants. J. Ecol. 2018, 107, 829–842. [Google Scholar] [CrossRef]
  27. Armbruster, W.S.; Pélabon, C.; Bolstad, G.H.; Hansen, T.F. Integrated Phenotypes: Understanding Trait Covariation in Plants and Animals. Philos. Trans. R. Soc. B Biol. Sci. 2014, 369, 20130245. [Google Scholar] [CrossRef] [PubMed]
  28. Medeiros, C.D.; Scoffoni, C.; John, G.P.; Bartlett, M.K.; Inman-Narahari, F.; Ostertag, R.; Cordell, S.; Giardina, C.; Sack, L. An Extensive Suite of Functional Traits Distinguishes Hawaiian Wet and Dry Forests and Enables Prediction of Species Vital Rates. Funct. Ecol. 2018, 33, 712–734. [Google Scholar] [CrossRef]
  29. Yang, Y.; Wang, H.; Harrison, S.P.; Prentice, I.C.; Wright, I.J.; Peng, C.; Lin, G. Quantifying Leaf-Trait Covariation and Its Controls across Climates and Biomes. New Phytol. 2018, 221, 155–168. [Google Scholar] [CrossRef]
  30. Deng, Y.; Jiang, Y.-H.; Yang, Y.; He, Z.; Luo, F.; Zhou, J. Molecular Ecological Network Analyses. BMC Bioinform. 2012, 13, 113. [Google Scholar] [CrossRef]
  31. Kurokawa, H.; Oguro, M.; Takayanagi, S.; Aiba, M.; Shibata, R.; Mimura, M.; Yoshimaru, H.; Nakashizuka, T. Plant Characteristics Drive Ontogenetic Changes in Herbivory Damage in a Temperate Forest. J. Ecol. 2022, 110, 2772–2784. [Google Scholar] [CrossRef]
  32. Rao, Q.; Chen, J.; Chou, Q.; Ren, W.; Cao, T.; Zhang, M.; Xiao, H.; Liu, Z.; Chen, J.; Su, H.; et al. Linking Trait Network Parameters with Plant Growth across Light Gradients and Seasons. Funct. Ecol. 2023, 37, 1732–1746. [Google Scholar] [CrossRef]
  33. Flores-Moreno, H.; Fazayeli, F.; Banerjee, A.; Datta, A.; Kattge, J.; Butler, E.E.; Atkin, O.K.; Wythers, K.; Chen, M.; Anand, M.; et al. Robustness of Trait Connections across Environmental Gradients and Growth Forms. Glob. Ecol. Biogeogr. 2019, 28, 1806–1826. [Google Scholar] [CrossRef]
  34. Liu, C.; Li, Y.; Yan, P.; He, N. How to Improve the Predictions of Plant Functional Traits on Ecosystem Functioning? Front. Plant Sci. 2021, 12, 622260. [Google Scholar] [CrossRef]
  35. Wang, X.; Ji, M.; Zhang, Y.; Zhang, L.; Akram, M.A.; Dong, L.; Hu, W.; Xiong, J.; Sun, Y.; Li, H.; et al. Plant Trait Networks Reveal Adaptation Strategies in the Drylands of China. BMC Plant Biol. 2023, 23, 266. [Google Scholar] [CrossRef]
  36. Koschützki, D.; Schreiber, F. Centrality Analysis Methods for Biological Networks and Their Application to Gene Regulatory Networks. Gene Regul. Syst. Biol. 2008, 2, 193–201. [Google Scholar] [CrossRef]
  37. Poorter, H.; Niklas, K.J.; Reich, P.B.; Oleksyn, J.; Poot, P.; Mommer, L. Biomass Allocation to Leaves, Stems and Roots: Meta-Analyses of Interspecific Variation and Environmental Control. New Phytol. 2011, 193, 30–50. [Google Scholar] [CrossRef] [PubMed]
  38. Medina-Vega, J.A.; Bongers, F.; Poorter, L.; Schnitzer, S.A.; Sterck, F.J. Lianas Have More Acquisitive Traits than Trees in a Dry but Not in a Wet Forest. J. Ecol. 2021, 109, 2367–2384. [Google Scholar] [CrossRef]
  39. Barton, K.E.; Koricheva, J. The Ontogeny of Plant Defense and Herbivory: Characterizing General Patterns Using Meta-Analysis. Am. Nat. 2010, 175, 481–493. [Google Scholar] [CrossRef]
  40. Meiforth, J.J.; Buddenbaum, H.; Hill, J.; Shepherd, J. Monitoring of Canopy Stress Symptoms in New Zealand Kauri Trees Analysed with AISA Hyperspectral Data. Remote Sens. 2020, 12, 926. [Google Scholar] [CrossRef]
  41. Bramesh Reddy, B.R.; Kiran, B.O.; Patil, S.B.; Ash Vathama, V.H. Canopy Temperature in Sorghum under Drought Stress: Influence of Gas-Exchange Parameters. J. Cereal Res. 2022, 14, 2582–2675. [Google Scholar]
  42. Dong, X.; Zhang, X. Some Observations of the Adaptations of Sandy Shrubs to the Arid Environment in the Mu Us Sandland: Leaf Water Relations and Anatomic Features. J. Arid. Environ. 2001, 48, 41–48. [Google Scholar]
  43. Shi, P.; Yu, K.; Niinemets, Ü.; Gielis, J. Can Leaf Shape Be Represented by the Ratio of Leaf Width to Length? Evidence from Nine Species of Magnolia and Michelia (Magnoliaceae). Forests 2020, 12, 41. [Google Scholar] [CrossRef]
  44. Wei, X.; Yang, Y.; Yao, J.; Han, J.; Yan, M.; Zhang, J.; Shi, Y.; Wang, J.; Mu, C. Improved Utilization of Nitrate Nitrogen through Within-Leaf Nitrogen Allocation Trade-Offs in Leymus chinensis. Front. Plant Sci. 2022, 13, 870681. [Google Scholar] [CrossRef]
  45. Arora, R.L.; Tripathi, S.; Singh, R. Effect of Nitrogen on Leaf Mineral Nutrient Status, Growth and Fruiting in Peach. Indian J. Hortic. 1999, 56, 286–294. [Google Scholar]
  46. Zhi, X.; Hammer, G.; Borrell, A.; Tao, Y.; Wu, A.; Hunt, C.; van Oosterom, E.; Massey-Reed, S.R.; Cruickshank, A.; Potgieter, A.B.; et al. Genetic Basis of Sorghum Leaf Width and Its Potential as a Surrogate for Transpiration Efficiency. Theor. Appl. Genet. 2022, 135, 3057–3071. [Google Scholar] [CrossRef] [PubMed]
  47. Lambers, H.; Oliveira, R.S. Plant Physiological Ecology; Springer International Publishing: Cham, Switzerland, 2019; ISBN 9783030296384. [Google Scholar]
Figure 1. Experimental design. DBH, diameter at breast height. Note: Tree diameter at breast height (DBH) is the diameter of the trunk at breast height of the main trunk above the ground surface.
Forests 15 01283 g001
Figure 2. Network of leaf traits overall and at different developmental stages. Note: Traits sharing the same background color are part of the same module. Positive correlations are shown by red edges, while negative correlations are shown by black edges. Line widths indicate the strength between traits, and node sizes correspond to their degrees.
Forests 15 01283 g002
Figure 3. Changes in overall parameters of P. euphratica leaf network at different and total developmental stages. Note: Different letters indicate significant differences (p < 0.05) and the error line indicates the standard error. The total developmental stage is meant to be a sample of 60 trees at all developmental stages.
Forests 15 01283 g003
Figure 4. Comparison of node parameters of leaf trait network in P. euphratica at different developmental stages and overall stage. Note: LL: leaf length, LW: leaf width, LA: leaf area, LSI: leaf shape index, LP: leaf perimeter, LT: leaf thickness, PL: petiole length, PT: palisade tissue thickness, ST: spongy tissue thickness, LCD: leaf compactness density, LLD: leaf looseness density, PS: palisade to spongy ratio, UEW: upper epidermis width, LEW: lower epidermis width, SSC: leaf soluble sugar, LS: leaf starch, LSP: leaf soluble protein, N: leaf nitrogen, P: leaf phosphorus, K: leaf potassium, LOC: leaf organic carbon, CN: carbon-to-nitrogen ratio, GA3: gibberellic acid 3, IAA: indole, ZR: zeatin riboside, ABA: abscisic acid, Ci: intercellular CO2 concentration, Gs: stomatal conductance, WUE: water-use efficiency, Pn: net photosynthesis rate, Tr: transpiration rate, δ13C: carbon isotope discrimination, MDA: malondialdehyde, Pro: proline, the same as below. The total developmental stage is meant to be a sample of 60 trees at all developmental stages.
Forests 15 01283 g004
Figure 5. Network of leaf traits overall and at different canopy height levels. Note: Traits sharing the same background color are part of the same module. Positive correlations are shown by red edges, while negative correlations are shown by black edges. Line widths indicate the strength between traits, and node sizes correspond to their degrees.
Forests 15 01283 g005
Figure 6. Variation in overall parameters of P. euphratica leaf networks in different canopies. Note: Different letters indicate significant differences (p < 0.05), and the error line indicates the standard error.
Forests 15 01283 g006
Figure 7. Comparison of node parameters of leaf trait network in P. euphratica with different canopy heights. Node: LL: leaf length, LW: leaf width, LA: leaf area, LSI: leaf shape index, LP: leaf perimeter, LT: leaf thickness, PL: petiole length, PT: palisade tissue thickness, ST: spongy tissue thickness, LCD: leaf compactness density, LLD: leaf looseness density, PS: palisade to spongy ratio, UEW: upper epidermis width, LEW: lower epidermis width, SSC: leaf soluble sugar, LS: leaf starch, LSP: leaf soluble protein, N: leaf nitrogen, P: leaf phosphorus, K: leaf potassium, LOC: leaf organic carbon, CN: carbon to nitrogen ratio, GA3: gibberellic acid 3, IAA: indole, ZR: zeatin riboside, ABA: abscisic acid, Ci: intercellular CO2 concentration, Gs: stomatal conductance, WUE: water use efficiency, Pn: net photosynthesis rate, Tr: transpiration rate, δ13C: carbon isotope discrimination, MDA: malondialdehyde, Pro: proline, the same as below.
Forests 15 01283 g007
Figure 8. Comparison of the relative importance of structural, chemical, and physiological traits in P. euphratica leaves at different developmental stages and canopy heights. Note: Different letters indicate significant differences (p < 0.05), and the error line indicates the standard error. The total developmental stage is meant to be a sample of 60 trees at all developmental stages.
Forests 15 01283 g008
Disclaimer/Publisher’s Note: The statements, opinions and data contained in all publications are solely those of the individual author(s) and contributor(s) and not of MDPI and/or the editor(s). MDPI and/or the editor(s) disclaim responsibility for any injury to people or property resulting from any ideas, methods, instructions or products referred to in the content.