Article

Dry Deposition in Urban Green Spaces: Insights from Beijing and Shanghai

1
State Key Lab of Subtropical Silviculture, Zhejiang A&F University, Hangzhou 311300, China
2
Engineering Experimental Training Center, Zhejiang University of Water Resources and Electric Power, Hangzhou 310018, China
3
College of Landscape Architecture, Zhejiang A&F University, Hangzhou 311300, China
4
Zhejiang Forest Resources Monitoring Center, Hangzhou 310020, China
*
Authors to whom correspondence should be addressed.
These authors contributed equally to this work.
Forests 2024, 15(8), 1286; https://doi.org/10.3390/f15081286
Submission received: 25 June 2024 / Revised: 12 July 2024 / Accepted: 20 July 2024 / Published: 23 July 2024
(This article belongs to the Section Urban Forestry)

Abstract

:
Urbanization and industrialization have escalated air pollution into a critical global issue, particularly in urban areas. Urban green infrastructures (GIs), such as parks and street trees, play a vital role in mitigating air pollution through dry deposition, the process by which air pollutants are removed by deposition onto plant surfaces or through plant uptake. However, existing studies on the dry-deposition capacity of urban green spaces are limited in their ability to reflect variations at the tree-species level, hindering comprehensive evaluations and effective management strategies. This study aims to quantitatively assess the dry-deposition capacity of the urban green spaces of Beijing and Shanghai for six major air pollutants in using an improved dry-deposition model and tree-species-specific data. Results showed that Shanghai’s urban green spaces had a monthly average dry-deposition rate of 5.5 × 10⁻⁶ s m−1, slightly higher than Beijing’s rate of 5.3 × 10⁻⁶ s m−1. Significant seasonal variations were observed, with summer showing the highest deposition rates due to favorable meteorological conditions. Broad-leaved species such as Zelkova serrata in Beijing and Photinia serratifolia in Shanghai exhibited superior dry-deposition capacities compared to coniferous species. Temperature significantly influenced dry-deposition rates for gaseous pollutants, while particulate-matter deposition was primarily affected by pollutant concentrations. This study provides critical insights into the air = purification functions of urban green spaces and underscores the importance of species selection and strategic green-space planning in urban air-quality management, informing the development of optimized urban-greening strategies for improved air quality and public health.

1. Introduction

The rapid advancement of urbanization and industrialization has escalated air pollution into a critical global issue. As a primary source of environmental degradation, air pollutants not only degrade the ambient atmosphere but also significantly contribute to the global disease burden. With over half the world’s population residing in cities [1], urban centers have become the epicenters of air pollution and associated health risks [2]. Outdoor air pollution annually accounts for millions of premature deaths, particularly in urban settings where over two thirds of such deaths occur [3]. Addressing air pollution is imperative for the sustainable evolution of urban landscapes and for safeguarding human health. Notoriously, criteria pollutants including PM2.5, PM10, O3, SO2, NOX, and CO are omnipresent and pose substantial threats to public health and environmental integrity [4].
Air pollutants can be effectively mitigated through integrated pollution-removal technologies or, more naturally and sustainably, through vegetation-based solutions [5,6]. Urban green infrastructures (GIs), such as parks and street trees, function as vital barriers against pollution, mitigating the impact of traffic emissions and other sources on adjacent areas [7]. These GIs are ecosystems that interact closely with urban residents, providing a plethora of ecosystem services such as carbon capture, microclimate regulation, and notably, the removal of airborne and waterborne pollutants [8]. Among these services, the dry deposition of air pollutants onto urban green spaces stands out as a critical mechanism for air-quality enhancement [9,10].
Existing monitoring and modeling studies often fail to reflect the variations in the dry-deposition capacity of green spaces and lack refinement at the tree-species level, hindering comprehensive evaluations and the formulation of effective management strategies. Therefore, this study aims to quantitatively assess the dry-deposition capacity of six major air pollutants (O3, CO, NO2, SO2, PM2.5, PM10) in the urban green spaces of Beijing and Shanghai, utilizing an improved dry-deposition model and tree-species-specific data. Our findings provide valuable insights into the factors influencing deposition rates and the effectiveness of different tree species, offering theoretical support for the fine management of urban green spaces and scientific strategies for air-pollution prevention and control. This research is crucial for promoting sustainable urban development.
Dry deposition is the second-most-significant natural process for removing pollutants from the troposphere, a process pivotal for local air quality and health [11,12]. In urban green spaces, dry deposition entails the removal of particulates via surfaces and the absorption of gaseous pollutants through plant stomata, sometimes leading to their incorporation into organic compounds that support plant growth [13,14]. The factors influencing dry deposition are complex, encompassing pollutant concentrations, atmospheric physicochemical conditions, meteorological factors, and traits specific to different plant species, intertwining physical, chemical, and biological processes. Consequently, measuring dry-deposition values directly is challenging, often necessitating indirect calculations via model simulations [15,16].
To date, the vegetation’s capability to scavenge air pollutants has garnered extensive research interest, yet studies have predominantly focused on natural, homogeneous vegetation fields, often overlooking the heterogeneity inherent in urban green spaces [17]. This gap hinders our quantitative understanding of dry deposition in urban ecosystems and the formulation of species-specific management and regulatory practices. Despite a 20.77-fold increase in green spaces within Chinese urban areas from 1981 to 2019, air pollution persists, exacerbated by swift urban and industrial expansion. The role of urban green spaces in dry deposition, a significant pollution-abatement pathway, remains underexplored in China, where variations in population density, geography, climate, hydrology, vegetation, industry, and economic development greatly influence deposition characteristics.
Our study bridges this knowledge gap by examining Beijing and Shanghai, two megacities emblematic of the diverse climatic zones and hydrothermal contrasts within China. These cities also reflect differences in urban management and vegetation profiles. Through vegetation surveys and the integration of dry-deposition models with sensitivity analysis, we identify the key drivers of urban dry deposition, laying a scientific groundwork for enhanced green-space management and air-pollution-mitigation strategies in these metropolises, with implications extending throughout China’s urban landscapes.

2. Methodology

2.1. Study Area

This study focuses on two prominent megacities in China: Beijing and Shanghai. These cities not only exhibit high levels of economic development and urbanization but also possess distinct characteristics and climatic conditions representative of different regions of China (Figure 1).
Beijing, the capital city, experiences a temperate continental climate with four distinct seasons. Precipitation in Beijing is concentrated and intense, influenced by warm and humid marine air masses, particularly during the summer months of July and August. In recent years, Beijing has witnessed a steady increase in its annual greening rate, with the current greening-coverage rate in urban areas reaching 43.5%. With a population of approximately 21.84 million people, Beijing recorded a gross domestic product (GDP) of approximately 5694.39 billion USD in 2021, with an actual growth rate of 8.5%. The city also has a high level of motor-vehicle ownership, at 6.384 million vehicles.
Shanghai, located in the southeast region of China, is an international center of innovation in economics, trade, and technology. The city enjoys a mild and humid climate, with more than 60% of the annual rainfall concentrated in the flood season from May to September. Shanghai boasts a greening rate of over 40%. With a population of around 24.76 million, Shanghai recorded a GDP of approximately 6110.87 billion USD in 2021, with an actual growth rate of 8.1%. The city has significant motor-vehicle ownership, with 5.273 million vehicles.

2.2. Data Collection

In this study, hourly meteorological-monitoring data including air temperature, humidity, solar radiation (total radiation, net radiation, albedo), rainfall, wind speed, atmospheric pressure, and cloudiness in Beijing and Shanghai from 2017 were collected from the European Centre for Medium-Range Weather Forecasting (ECMWF). Hourly concentrations of PM2.5, PM10, O3, CO, SO2, and NO2 near the ground in each of these cities in 2017 were obtained from the Ministry of Ecology and Environment of the People’s Republic of China. Additionally, field research conducted in 2017 provided data on diameter at breast height (cm), crown width (m), tree height (m), leaf area, and dry biomass for all trees >2.5 cm dbh in Beijing and Shanghai.

2.3. Experimental Verification of the Dry-Dposition Model (Concentration Gradient Method)

To verify the accuracy of the dry-deposition model used in this study, an improved micrometeorological gradient method was employed to experimentally determine the dry deposition of ozone [18]. This method estimates the dry-deposition flux of O3 above the canopy by measuring the concentration gradient between two levels above and below the canopy top. The relatively large gradients between these levels are significant due to the notable pollutant absorption at the top of the canopy.
In this study, a UV photometric O3 analyzer (49i-D1NAA) was used to measure O3 concentrations at different heights. The UV photometric O3 analyzer was calibrated before use, and measurements were taken over a 24-h period to ensure representative samples were obtained. The specific calculation method is as follows:
Based on the flux gradient theory applied within the canopy, a height-dependent flux (F(z)) can be calculated as follows:
F z = K c ( z ) d C d z
where zh and Kc(z) represents the vertical eddy diffusion coefficient. Based on this equation, the O3 flux at the top of the canopy (F(h)) is calculated as follows:
F ( h ) = C h C 3 R a ( h : z 3 )
Using the aerodynamic gradient method, the O3 flux above the canopy can be calculated from the concentration gradient between the reference height z1 and the top of the canopy h (z1 > h) as follows:
F = C 1 C h R a ( z 1 : h )
Based on the assumption of a constant flux layer above the canopy, the O3 flux above the canopy calculated using this method should be equal to the O3 flux at the top of the canopy derived from the previous equation. Therefore, it can be derived that
F = C 1 C 3 R a ( z 1 : h ) + R a ( h : z 3 )
Assuming the concentration at the absorption surface is zero, the dry deposition velocity (Vd) of O3 can be determined as follows:
V d = F / C ( z 1 )
where C(z1) is the measured O3 concentration at the reference height z1. For this study, z1 = 29 m, z2 = 24.1 m, h = 23 m, and z3 = 18.3 m.

2.4. Species-Analysis Method

To analyze the species-specific dry-deposition capacities, we utilized the field-survey data collected in 2017, as mentioned in Section 2.2. This data includes diameter at breast height (DBH), crown width, tree height, leaf area, and dry biomass for all trees >2.5 cm dbh in Beijing and Shanghai. The dry-deposition rates for each species were calculated using the improved dry-deposition model. We then identified the top-performing species based on their deposition rates for different pollutants. This analysis allowed us to determine which species were most effective in pollutant removal, thereby providing insights for urban green-space planning and management.

2.5. Estimation of Air-Pollutant Removal by Trees

Dry deposition is the mechanism by which urban vegetation removes pollutants from the atmosphere. The dry deposition flux F is calculated as follows [19]:
F = C × V d
where C is the pollutant concentration (μg m−3) and Vd is the dry deposition velocity (m s−1). During periods of precipitation, the dry deposition velocity is set to zero.

2.5.1. Dry Deposition of Gas Pollutants (O3, CO, NO2 and SO2)

The velocity of dry deposition of gas pollutants (Vdg) is estimated using a conventional three-layer resistance scheme [19], as follows:
V d g = R a + R b + R c 1
where Ra is the aerodynamic drag (s m−1) and Rb and Rc are the sheet-flow-layer resistance (s m−1) and surface resistance (s m−1), respectively. Under atmospheric-stability conditions (L > 0), Ra is calculated as follows:
R a = 1 k u ln ln z r z 0 + 5 z r L
Under atmospheric-instability conditions (L < 0), Ra is calculated as follows:
R a = 1 k u ln 1 16 z r L 1 1 16 z 0 L 1 1 16 z r L + 1 1 16 z 0 L + 1
In these equations, k is the von Karman constant (0.4); u* is the surface friction velocity (m s−1); z0 is the surface roughness length (m); L is the Monin-Obukhov length (m); the reference height zr(m) is set to 2/3 of the average height of the existing vegetation; and the seasonal value of z0 is chosen according to the type of land use.
The sheet-flow-layer resistance Rb is calculated as follows:
R b = 2.2 υ D a 2 / 3 k u 1
where υ is the kinematic viscosity of air (1.505 × 10⁻⁵ m2 s−1); Da is the diffusion coefficient of gaseous pollutants (O3, CO, NO2 and SO2) in air, calculated using air temperature, atmospheric pressure, and the molecular weight of each air pollutant.
The surface resistance Rc is calculated as follows:
1 R c = 1 R s + R m + W c R c u t w + 1 W c R c u t d
where Wc is the proportion of canopy wetness, and Rs, Rm, Rcutw and Rcutd represent canopy stomatal, leaf-pulp, wet-cuticle, and dry-cuticle resistance (s m−1), respectively. Under rain and dew conditions, the values of Wc were 0.9 and 0.7, respectively.
The equation for stomatal resistance Rs is as follows:
R s = R i L A I m a x L A I D v D a 1 f 1 f 2 f 3 f 4
where Ri is the minimum stomatal resistance (s m−1) for each gaseous pollutant and Dv is the diffusivity of water vapor in air (2.19 × 10⁻⁵ m2 s−1). The terms f1, f2, f3, and f4 are multiplicative scale factors considering the effects of solar irradiance, soil moisture, humidity, and temperature, respectively, on stomatal resistance.

2.5.2. Dry Deposition of Particles (PM2.5 and PM10)

The dry settling rate of the particles (Vdp) can be expressed as [19]:
V d p = R a + R p + R a R p V g 1 + V g
where Ra denotes the aerodynamic drag (s m−1), Rp denotes the quasi-laminar sublayer drag (s m−1), and Vg denotes the gravitational settling velocity (m s−1). Ra is calculated according to Equations (3) and (4). Only two size classes of particles are usually considered: fine mode (PM2.5), for particles smaller than about 2.5 μm in diameter, and coarse mode (PM10), for larger particles up to 10 μm in diameter.
For fine mode, Rp was calculated using the method of Wesely et al. [19]:
For L > 0,
R p = 500 / u
For L < 0,
R p = 500 u 1 300 / L
where u* is the friction velocity and L is the Monin-Obukhov length. For fine mode Vg is set to zero, while for coarse mode, Vg is set to 0.02 m s−1.

2.5.3. Calculation of Percent Air-Quality Improvement

The percentage improvement in air quality is calculated as follows:
% Δ = Δ P t / Δ P t + P a = b ± b 2 4 a c 2 a
There, ΔPt = change in pollutant mass (μg) due to the net effect of removal (flux). ΔPa is pollutant mass in the atmosphere (μg), which equals measured concentration (μg/m3) × BL × CA. BL = boundary-layer height (m), and CA = study area (m2).
The height (m) of the planetary boundary layer is estimated from hourly surface meteorological observations and is calculated as follows.
H = 121 6 6 P a s T a T d + 0.169 P a s u z + 0.257 24 Ω sin φ ln z / z 0
where Pas is the Pasquill atmospheric-stability level, determined according to solar radiation calculated by solar altitude, cloud cover, and wind speed with value variation from 1 to 6 [20]. Ta and Td are the surface air temperature and dew-point temperature, uz is the wind speed (m/s) at height of z = 10 m, z0 is the surface roughness length (m), Ω is the angular velocity of the earth rotation (7.29 × 10⁵ rad/s), and φ is the latitude. Minimum boundary-layer heights of 250 m during the day and 150 m during the night are set based on a previous estimation for urban areas [21].

2.6. Monetary Value of Air-Pollutant Removal

The monetary values of air-pollutant removal were calculated based on the median monetized dollar per ton externality values used in energy-decision-making from various studies [21,22]. These values, expressed in dollars per metric ton (t), are as follows: NO2 = $6752 t−1, PM10 = $4508 t−1, SO2 = $1653 t−1, CO = $959 t−1, and PM2.5 = $682,000 t−1. The externality value for O3 was set to equal the value for NO2.

2.7. Sensitivity Analysis

To perform a sensitivity analysis of the dry-deposition model, the input parameters were identified by reviewing the model equations and determining which variables had the greatest impact on the model output. The input parameters selected for sensitivity analysis included leaf area index (LAI), stomatal conductance (u*), and atmospheric concentration of pollutants. These input factors were modulated by ±20% and ±50%, and the net impact on simulated annual average dry-deposition velocities and dry-deposition flux of each pollutant in each city was analyzed. The model outputs for different sets of input parameters were compared to identify which input parameters had the greatest impact on the model output.

2.8. Model Validation

To validate the accuracy of the dry-deposition model used in this study, atmospheric gradiometry was employed to measure the dry-deposition velocities of O3. Firstly, two sampling points were set up at different heights above the surface. The lower sampling point was located at a height of 2 m above the ground, and the higher sampling point was located at a height of 17 m above the ground. The concentration of O3 at the two sampling points was measured using a UV photometric monitor. The UV photometric monitor was calibrated before use, and measurements were taken over a period of 24 h to ensure that the sample was representative.
The concentration gradient of O3 was calculated by subtracting the concentration measured at the higher sampling point from the concentration measured at the lower sampling point and dividing by the distance between the two sampling points. A diffusion equation was then used to estimate the deposition velocity of O3. Finally, the relationship between the dry-deposition flux of O3 and the atmospheric concentration gradient was analyzed using correlation analysis.

3. Results and Discussion

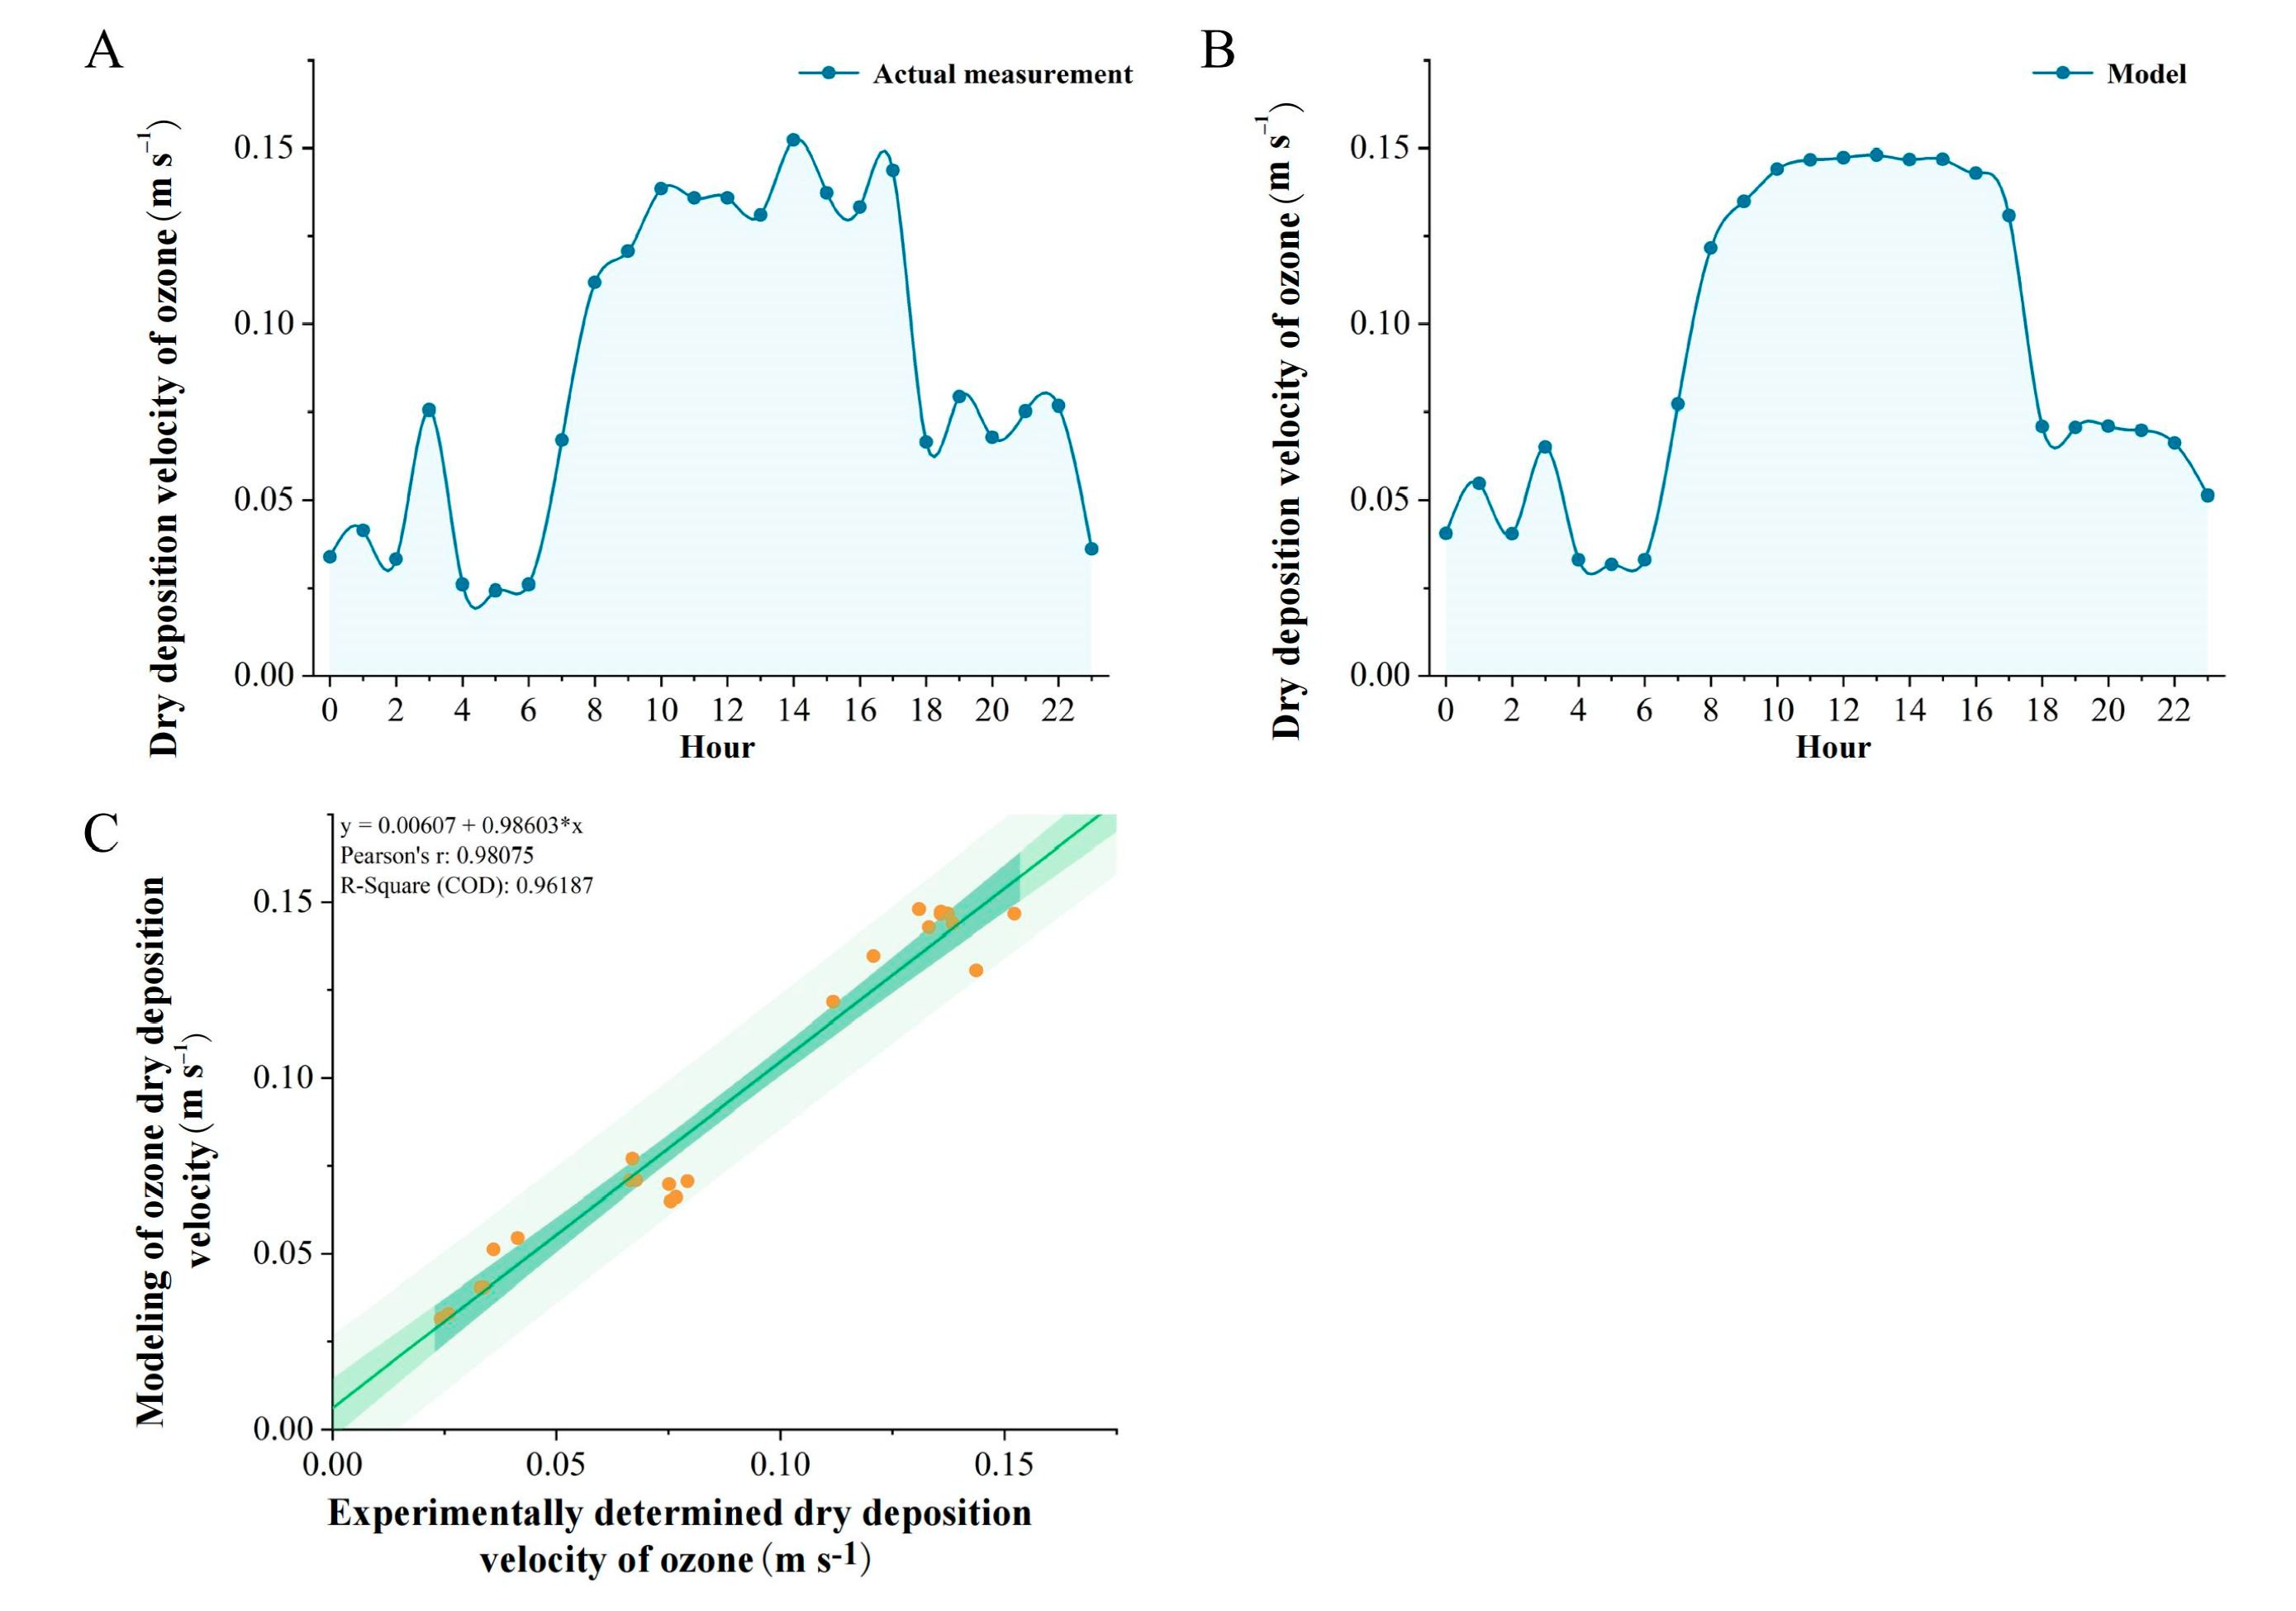
3.1. Model Validation

To verify the accuracy of the dry-deposition model adopted in this study, we first measured the ozone dry-deposition rates in small plots around the Xixi Wetland in Hangzhou using the gradient method. Subsequently, we used the same model to conduct simulations of ozone dry deposition in the same plot during the same time period. The ozone dry-deposition rates around the Xixi Wetland in Hangzhou were lower in the early morning and evening and higher during the day from 8 a.m. to 5 p.m.
We then used Pearson correlation analysis to analyze the correlation between the measured values and the simulated values. As shown in Figure 2, the simulated dry-deposition rates were in good agreement with the measured dry-deposition rates, indicating that the modified ISC3 model adopted in this study is suitable for modeling the dry deposition of air pollutants.

3.2. Seasonal Variations of the Simulated Dry-Deposition Velocities (Vd)

Figure 3 illustrates the seasonal variations of dry-deposition velocities (Vdg) for various pollutants in Beijing and Shanghai. The Vdg trends for gaseous pollutants (O3, CO, NO2, and SO2) are similar in both cities, but specific values and fluctuations differ.
In Beijing, the Vdg of gaseous pollutants decreases in spring, peaks in summer, decreases in autumn, and rises again in winter. In Shanghai, Vdg decreases from April to July, increases in autumn until October, and then decreases in winter. For O3 in Beijing, the annual average Vdg is 2.5 × 10⁻⁶ s m−1, peaking at 3.6 × 10⁻⁶ s m−1 in August and reaching a low of 1.6 × 10⁻⁶ s m−1 in December. In Shanghai, the annual average Vdg is 2.5 × 10⁻⁶ s m−1, with minor variations. CO in Beijing has an annual average Vdg of 2.7 × 10⁻⁶ s m−1, peaking at 4 × 10⁻⁶ s m−1 in August and dropping to 1.7 × 10⁻⁶ s m−1 in December. In Shanghai, the annual average Vdg is 2.7 × 10⁻⁶ s m−1, with the highest value in October (3.3 × 10⁻⁶ s m−1) and the lowest value in December (2.1 × 10⁻⁶ s m−1). For NO2 in Beijing, the annual average Vdg is 2.7 × 10⁻⁶ s m−1, peaking at 4 × 10⁻⁶ s m−1 in August and falling to 1.7 × 10⁻⁶ s m−1 in December. In Shanghai, the annual average Vdg is 2.7 × 10⁻⁶ s m−1, with minor variations. SO2 in Beijing has an annual average Vdg of 2.3 × 10⁻⁶ s m−1, peaking at 3.2 × 10⁻⁶ s m−1 in August and dropping to 1.7 × 10⁻⁶ s m−1 in December. In Shanghai, the annual average Vdg is 2.3 × 10⁻⁶ s m−1, with minor variations and a low value of 1.9 × 10⁻⁶ s m−1 in winter.
Dry deposition of gaseous pollutants primarily occurs during the daytime since plant stomata close at night, reducing its efficiency. In contrast, particulate matter (PM2.5 and PM10) is removed through vegetation interception day and night throughout the year. Shanghai has the highest Vdg for PM2.5 (1.6 × 10⁻⁶ s m−1), followed by Beijing. Shanghai’s PM2.5 Vdg is relatively high in late winter, spring, and autumn and lower in summer. In Beijing, PM2.5 Vdg is higher in winter and spring and lower in summer and autumn. The Vdg trends for PM10 and PM2.5 are similar, with PM10 generally having a higher Vdg value by approximately 0.02 m s−1. This is due to the Vg value being set to 0 for PM2.5 and 0.02 for PM10 in the simulation calculations. Shanghai has the highest annual average Vdg for PM10 (2.15 × 10⁻⁵ s m−1), followed by Beijing (2.09 × 10⁻⁵ s m−1). Shanghai’s PM10 Vdg is relatively high in late winter, spring, and autumn and lower in summer. In Beijing, PM10 Vdg is higher in winter and spring and lower in summer and autumn.
The dry-deposition velocity (Vdg) of gaseous pollutants is influenced by aerodynamic resistances (Ra, Rb, and Rc). Ra and Rb are influenced by turbulent activities, and stable atmospheric conditions weaken the turbulent mechanical exchange near the surface. Rc is related to vegetation conditions, and higher solar-radiation intensity facilitates the uptake of gaseous pollutants. In Beijing, Ra shows significant variations throughout the year, generally increasing and then decreasing. Rb (O3) shows a relatively steady change, while Rb (CO) peaks in August, and Rb (NO2) and Rb (SO2) reach their highest values in July. Rc (O3), Rc (CO), Rc (NO2), and Rc (SO2) are highest in winter and lowest in summer. Ra and Rb in Beijing are higher in summer and lower in winter, while Rc for all pollutants is lowest in July or August and highest in December. In Shanghai, Ra fluctuates greatly across different months, with higher values in summer. Rb for all pollutants is highest in summer and gradually decreases in autumn and winter. Rc for all pollutants is higher in summer and autumn and lower in winter.

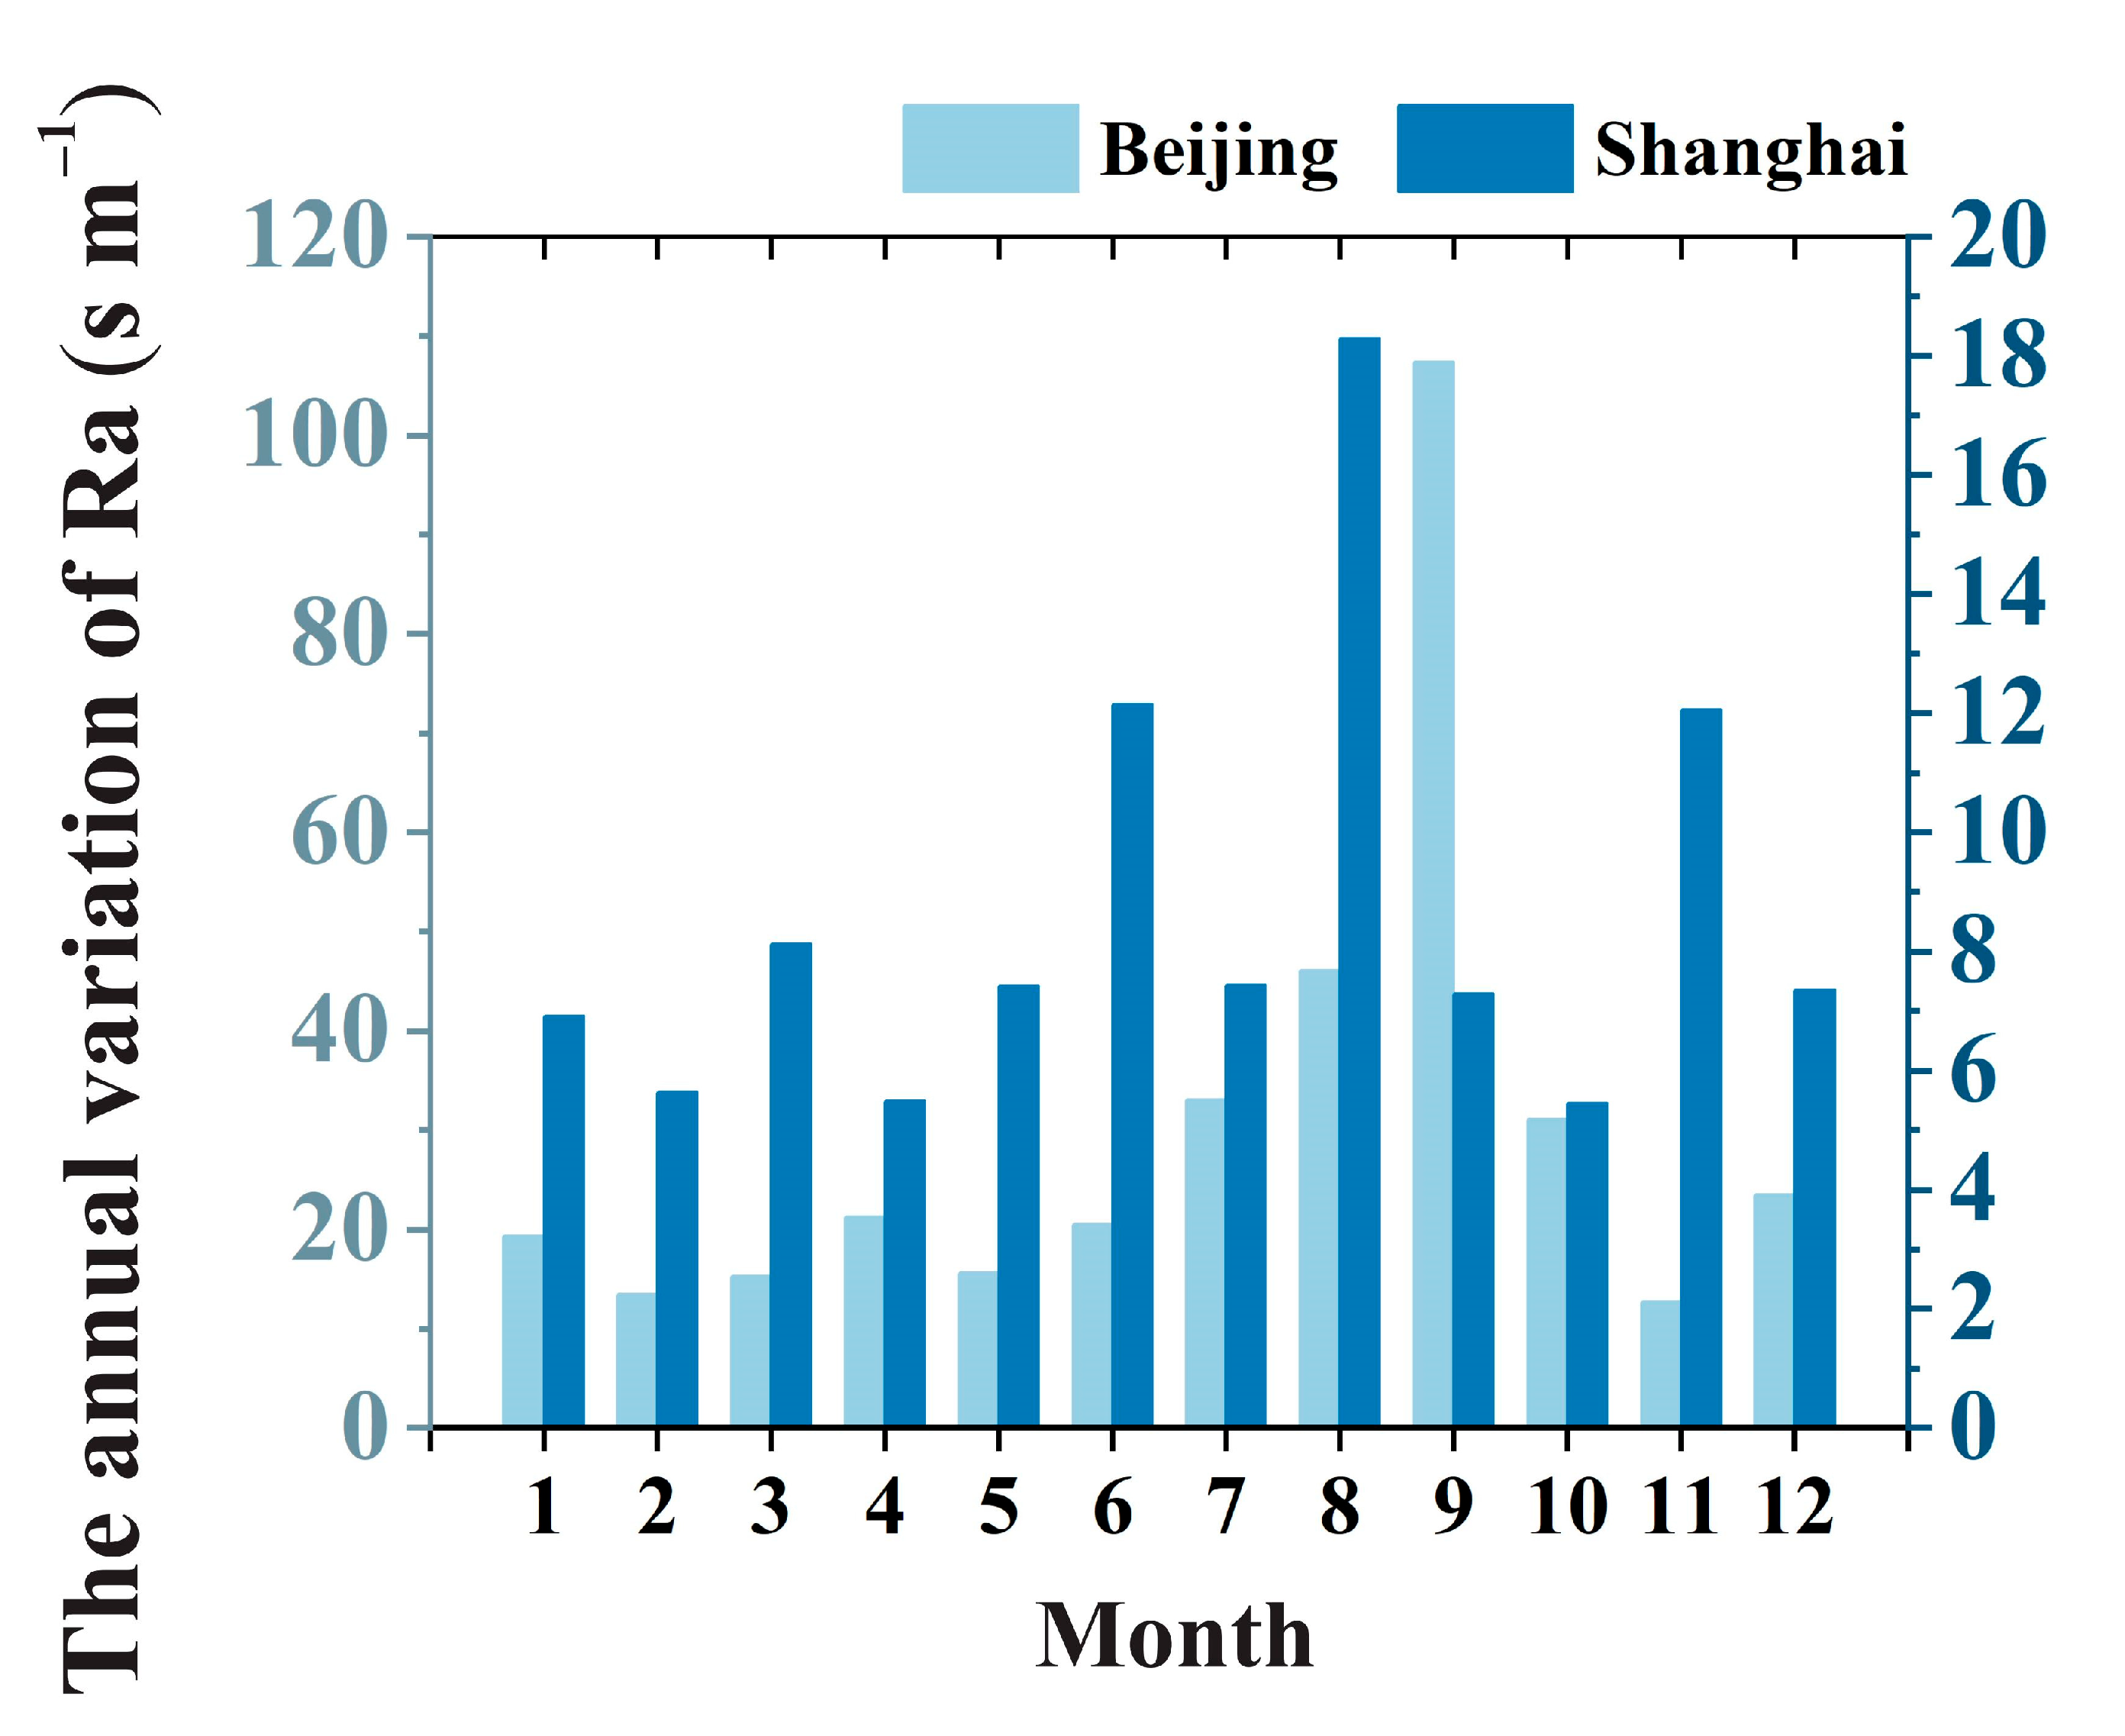
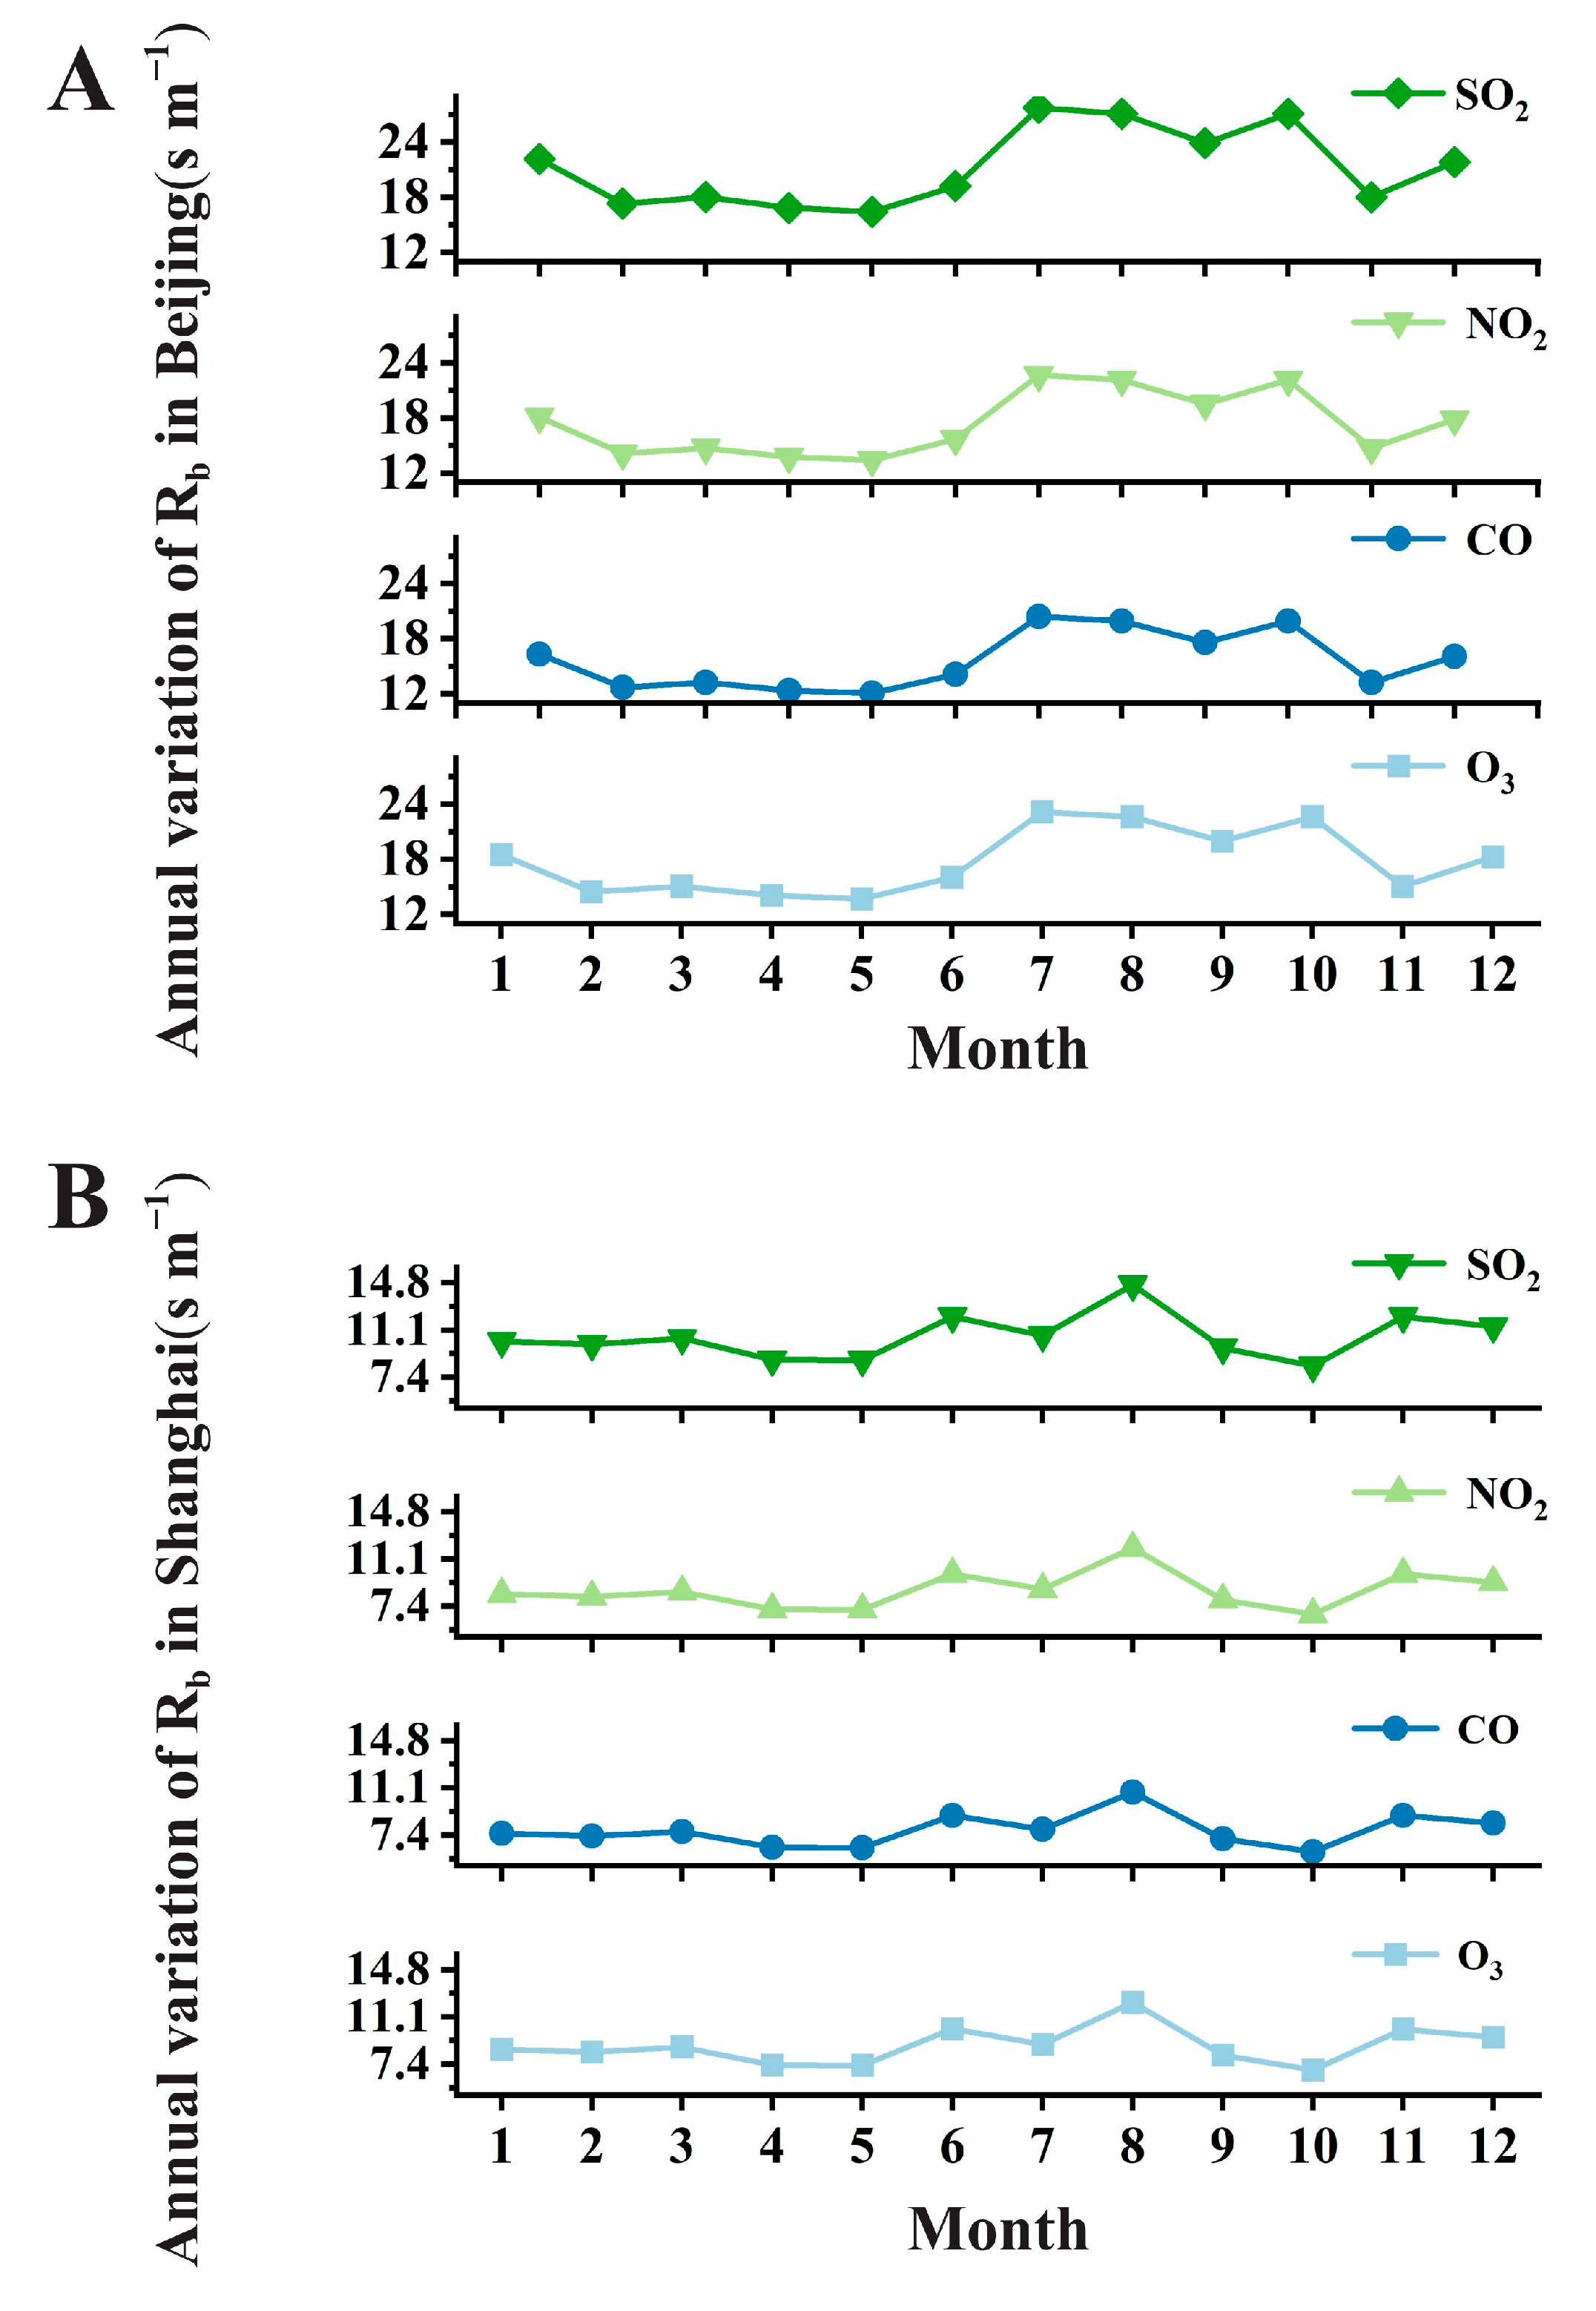
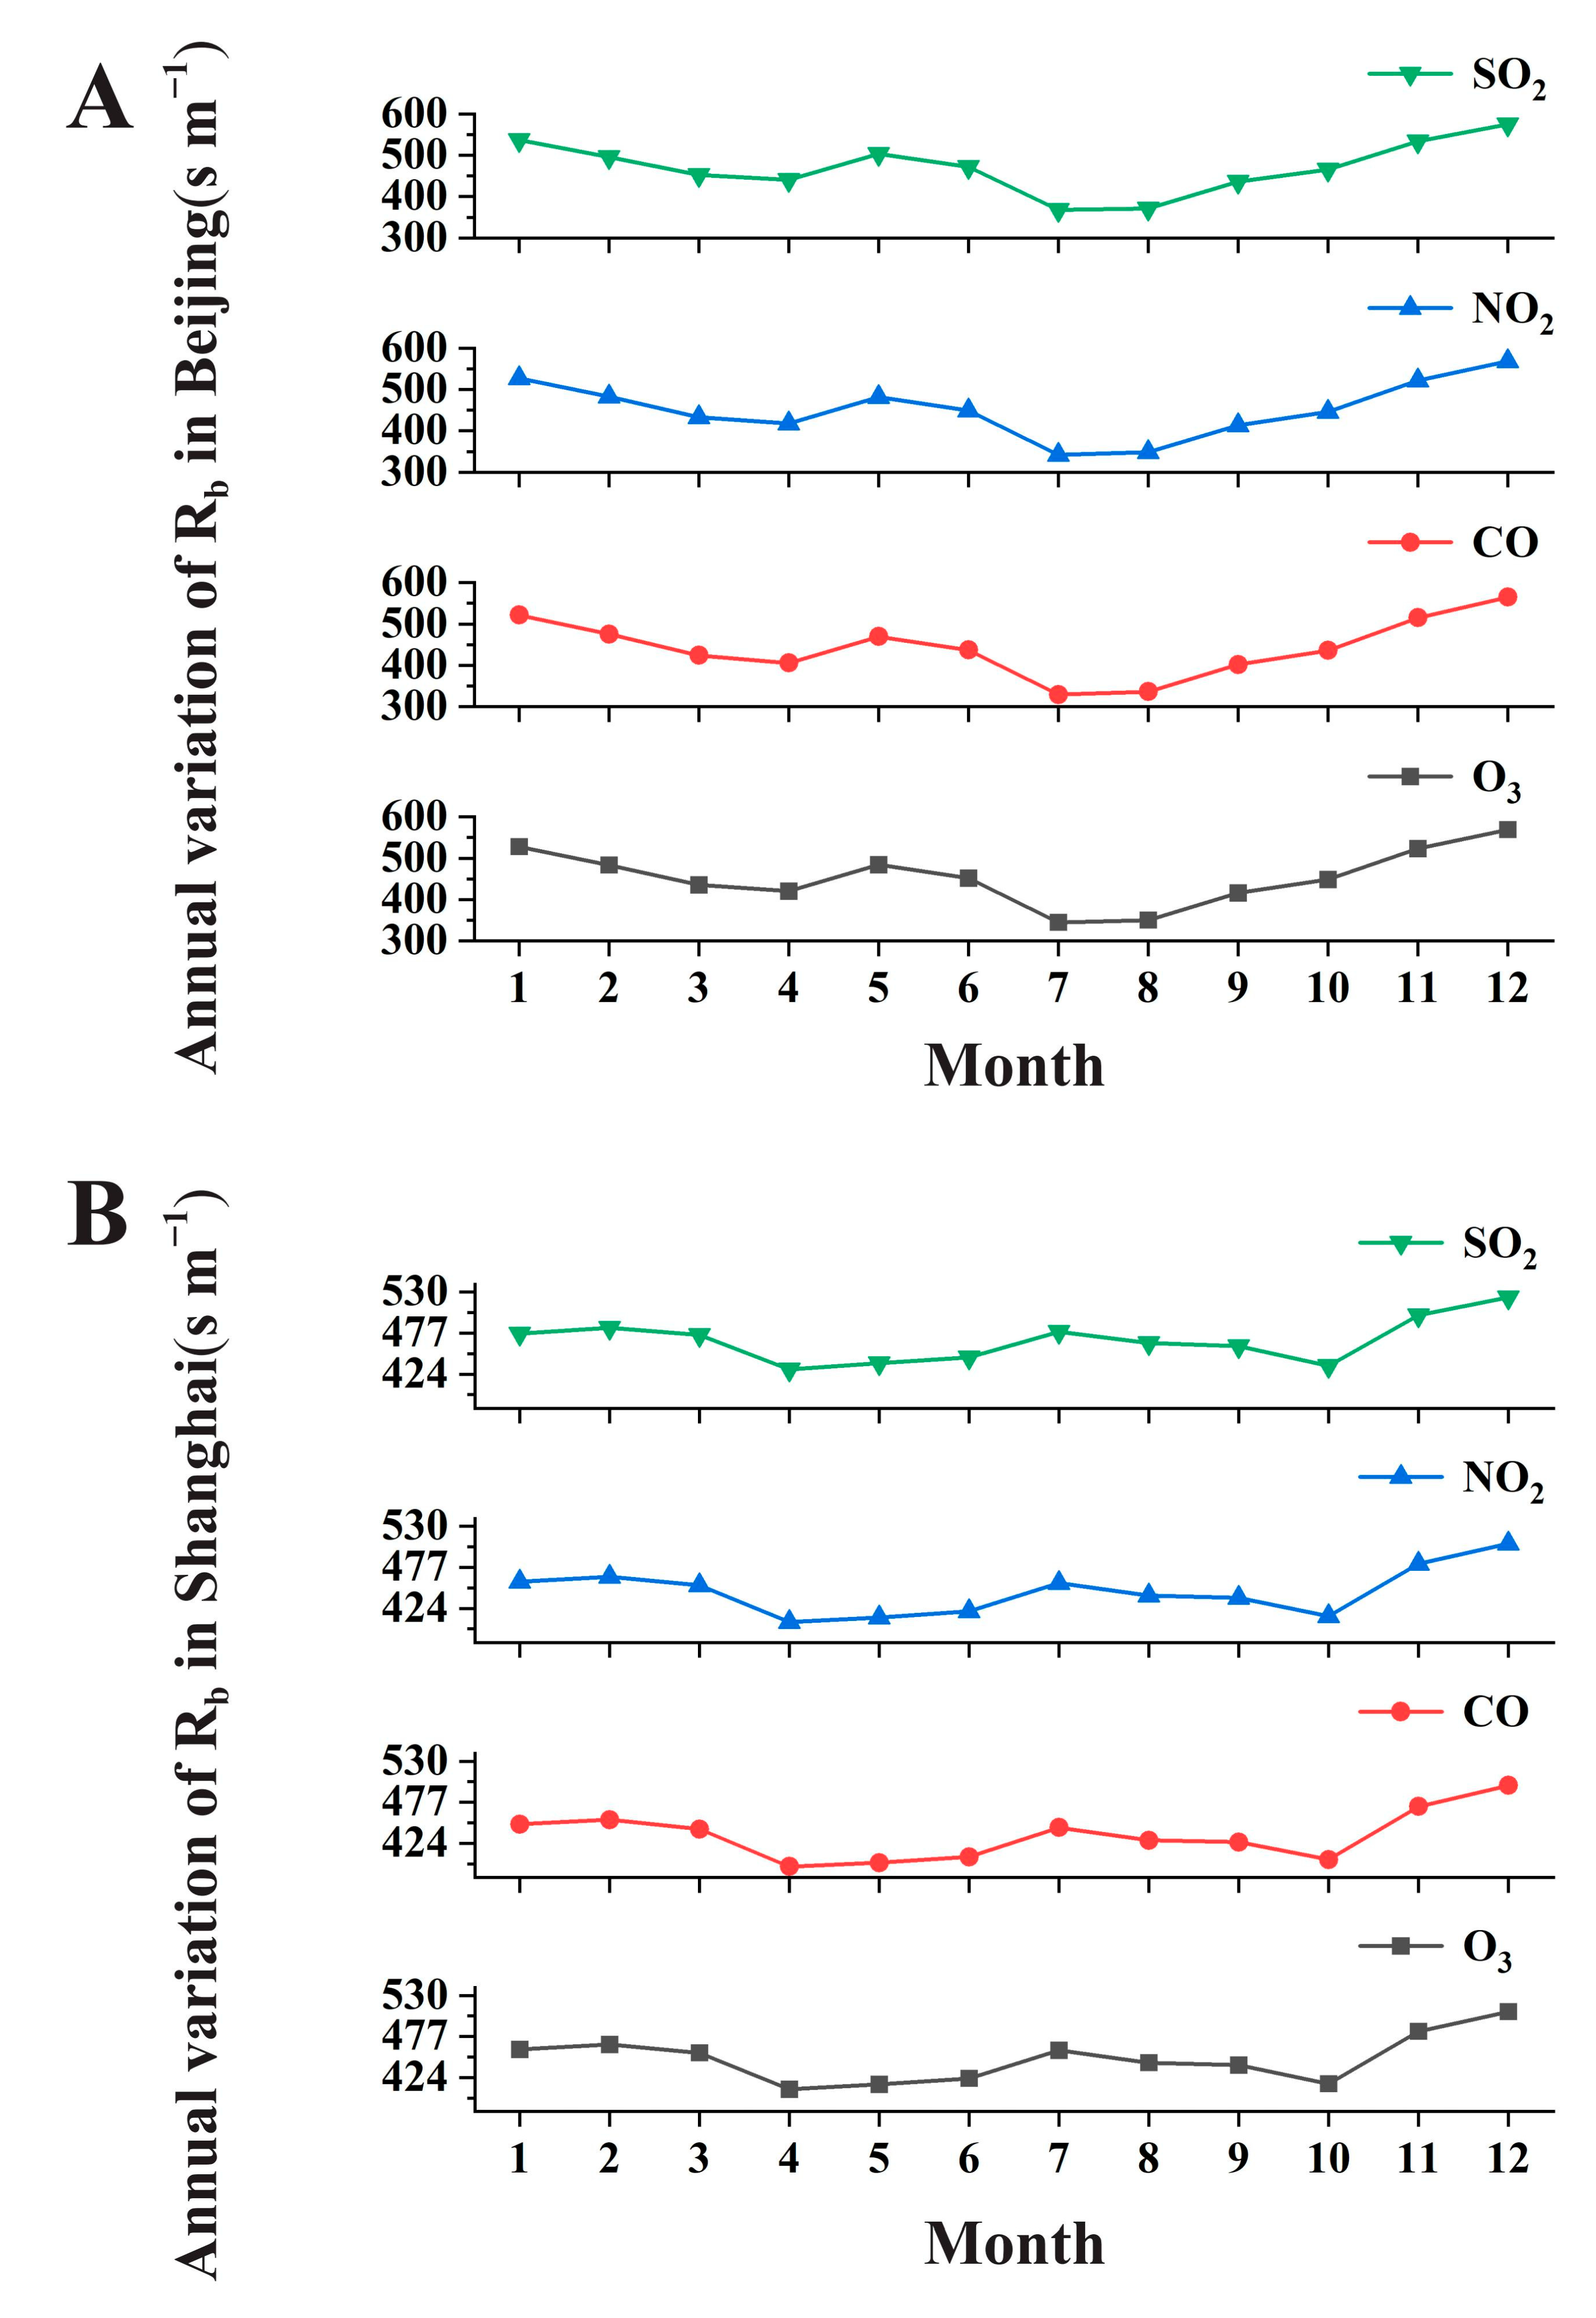
3.3. The Annual Variation in the Related Impedance to the Dry Deposition of Air Pollutants

The dry-deposition velocity (Vdg) of gas pollutants is determined by three important factors: aerodynamic resistance (Ra, s m−1), boundary-layer-transport resistance (Rb, s m−1), and canopy resistance (Rc, s m−1). Among them, Ra and Rb are primarily affected by turbulent atmospheric activities. When the atmosphere is more stable, the friction velocity (u*) decreases and the Richardson number (Ri) increases, such that near-surface turbulent mechanical exchange gradually weakens. This change shifts the meteorological field from a dynamically and thermally promoted state to a dynamically and thermally suppressed state.
Canopy resistance (Rc) is closely related to the physiological and ecological conditions of vegetation. Higher intensity of solar short-wave radiation enhances photosynthetic efficiency and stomatal conductance in plants, reducing stomatal impedance. This reduction in stomatal impedance facilitates the uptake of gas pollutants through the stomata. Figure 4 shows that the annual variation in Ra in Beijing is relatively large, exhibiting an overall trend of first increasing and then decreasing. It increases from 19.39 s m−1 in January to 107.34 s m−1 in September, then decreases to reach the lowest point of 12.68 s m−1 in November, which is followed by a slow increase to 23.49 s m−1 in December. Figure 5 indicates that the trend in the variation of Rb (O3) in Beijing is relatively flat, with the maximum value appearing in January, at 18.51 s m−1, and the minimum value appearing in November, at 15.03 s m−1. The maximum value of Rb (CO) occurs in August, at 19.91 s m−1, and the minimum value occurs in February, at 12.71 s m−1. Rb (NO2) fluctuates significantly within a year, with the maximum value in July, at 22.65 s m−1, and the minimum value in November, at 14.70 s m−1. Rb (SO2) also has significant fluctuations within a year, with the maximum value in July, at 27.72 s m−1, and the minimum value in June, at 19.20 s m−1.
Figure 6 shows that the pattern of seasonal variation Rc for different gas pollutants in Beijing includes low values in winter and high values in summer, which is consistent with the general seasonal growth pattern of plants. The maximum value of Rc (O3) appears in December, at 568.27 s m−1, and the minimum value appears in July, at 342.22 s m−1. The maximum value of Rc (CO) is in December, at 564.58 s m−1, and the minimum value is in July, at 329.44 s m−1. The maximum value of Rc (NO2) occurs in December, at 574.59 s m−1, and the minimum value in July, at 367.65 s m−1. The same applies to Rc (SO2), with the maximum value in December, at 574.59 s m−1, and the minimum value in July, at 367.65 s m−1.
Overall, the seasonal variations in Ra, Rb, and Rc in Beijing are very significant. Among them, Ra and Rb are higher in summer and lower in winter, while the Rc of all pollutants reaches its lowest point in July or August and its highest point in December. Rc is inversely proportional to leaf area index (LAI) and stomatal conductance. The long photoperiod in summer in Beijing increases LAI, photosynthetic efficiency, and stomatal conductance, enhancing the uptake of gas pollutants by stomata. However, in winter, when leaves wither and fall, LAI and stomatal conductance decrease, leading to an increase in Rc and a decrease in Vdg.
The annual variation in Ra in Shanghai fluctuates greatly among different months, with relatively high values in summer. The monthly average Ra value varies between 5 s m−1 and 18 s m−1. The highest Ra value in summer is 18.29 s m−1, which occurs in August, while the lowest value is 5.46 s m−1, which occurs in October. According to Figure 4, Figure 5 and Figure 6, the Rb values of various gas pollutants in Shanghai reach their highest values in summer and gradually decrease to their lowest values in autumn and winter. The highest Rb values in August for each pollutant are Rb (SO2), at 14.63 s m−1, Rb (CO), at 12.22 s m−1, Rb (NO2), at 11.95 s m−1, and Rb (O3), at 10.76 s m−1. Similarly, the pattern of seasonal variation inin Rc for various gas pollutants in Shanghai also shows relatively high values in summer and autumn (June to September) and relatively low values in winter (December to February).
Figure 7 indicates that the dry-deposition velocity (Vdp) of particulate matter is determined by Ra, the quasi-laminar sublayer resistance (Rp, s m−1), and is corrected based on the monthly leaf area index (LAI). It is also influenced by the gravitational acceleration rate (Vg), where Ra and Rp are inversely proportional to Vdp. The values of Rp in Beijing fluctuate significantly within a year, but the overall trend is not obvious. The maximum value appears in July, at 2943.87 s m−1, and the minimum value appears in April, at 1482.73 s m−1. The monthly average Rp values in Shanghai range from 676 s m−1 to 1479 s m−1, with the highest Rp value in June, at 1156.57 s m−1 and the lowest Rp value in October, at 676.76 s m−1.

3.4. Species Analysis Results

The species-specific analysis revealed that certain species, such as Zelkova serrata (Thunb.) Makino in Beijing and Photinia serratifolia (Desf.) Kalkman in Shanghai, exhibited higher dry-deposition rates due to their large leaf areas and high stomatal conductance. Detailed methodology for this analysis is provided in Section 2.4.

3.5. The Annual Variation in the Related Impedance to the Dry Deposition of Air Pollutants

Figure 8 illustrates that the dry-deposition flux of pollutants is influenced by both pollutant concentration and dry-deposition velocity. This study examined pollutant concentrations in Beijing and Shanghai; these concentrations influence the dry-deposition flux of pollutants. Both cities display similar annual variations in O3 concentrations, with higher levels in summer and lower levels in winter. However, Beijing has significantly higher O3 concentrations than Shanghai. In Beijing, the average summer O3 concentration is approximately 200 μg/m3, while the winter average is around 95 μg/m3. In Shanghai, the average summer O3 concentration is around 215 μg/m3, and the winter average is about 98 μg/m3.
Unlike O3 concentrations, CO concentrations in both cities exhibit a seasonal pattern, with higher levels in winter and lower levels in summer. Beijing’s CO concentration gradually decreases from January to April, ranging from 6.4 mg/m3 to 1.1 mg/m3, and fluctuates between 1.1 and 2.2 mg/m3 thereafter. Shanghai’s CO concentration remains relatively low, with small fluctuations, mostly ranging from 0.8 to 1.4 mg/m3, and is higher in winter than in summer. NO2 concentrations in both cities follow a seasonal pattern of higher levels in winter and spring and lower levels in summer. In Beijing, there is noticeable seasonal variation, with values peaking in late winter/early spring at approximately 50 μg/m3 and reaching a trough of around 35 μg/m3 in summer. NO2 concentrations in spring and autumn are intermediate between winter and summer, remaining relatively stable. In Shanghai, NO2 concentration is higher in late winter/early spring (around 51 μg/m3) and lower in summer (around 32 μg/m3), with relatively stable concentrations in spring and autumn.
SO2 concentrations in both cities exhibit a seasonal pattern of lower levels in summer and higher levels in winter. Beijing generally has low SO2 concentrations, averaging around 5 μg/m3 in summer and 6.5 μg/m3 in winter. Shanghai’s SO2 concentration remains relatively stable, averaging around 11 μg/m3 in summer and around 13 mg m−3 in winter. PM2.5 and PM10 concentrations also follow a seasonal pattern, with higher levels in winter and lower levels in spring and summer. In Beijing, the average PM2.5 concentration is around 52 μg/m3 in winter and around 48 μg/m3 in summer. In Shanghai, the average PM2.5 concentration is around 43 μg/m3 in winter and around 34 μg/m3 in summer. Both cities show higher PM10 concentrations in winter. The average PM10 concentration in Beijing is around 94 μg/m3 in winter and around 73 μg/m3 in summer, while in Shanghai, it is around 66 μg/m3 in winter and around 52 μg/m3 in summer.

3.6. Annual Variations in the Simulated Dry-Deposition Flux of Air Pollutants in Two Cities

Comparing the dry-deposition velocity and flux across different cities reveals distinct annual trends. Figure 9 illustrates that ozone dry-deposition flux follows seasonal variations in concentration and velocity, with both cities exhibiting higher flux in summer and lower flux in winter. In Beijing, the flux gradually increases from January (0.14 μg m−2 s−1) to May (0.52 μg m−2 s−1), reaching a peak in July (0.87 μg m−2 s−1), then stabilizes, with a slight decrease seen as December approaches (0.11 μg m−2 s−1). Shanghai’s highest flux occurs in July, while the lowest values are observed in January and December.
The dry-deposition flux of CO displays different patterns between the cities, with Beijing having higher flux in winter and summer, and Shanghai experiencing higher flux in spring and autumn. Beijing shows a stable trend, ranging from 0.0037 mg m−2 s−1 in October to 0.0134 mg m−2 s−1 in January. Shanghai, on the other hand, exhibits an overall decreasing trend, with values ranging from 0.0025 mg m−2 s−1 to 0.0033 mg m−2 s−1, peaking in August and reaching the lowest point in February. The dry-deposition flux of NO2 in Beijing is higher in summer and lower in winter, whereas Shanghai demonstrates lower flux in summer and higher flux in spring and autumn. Beijing maintains a stable trend, ranging from 0.08 μg m−2 s−1 in December to 0.134 μg m−2 s−1 in March. Shanghai’s highest flux occurs in April, while the lowest flux is observed in July.
Both cities exhibit a seasonal pattern in SO2 flux, with low flux in summer and high flux in winter, aligning with concentration trends. Beijing experiences its maximum flux in January (0.03 μg m−2 s−1) and minimum flux in June (0.013 μg m−2 s−1), while Shanghai’s highest flux occurs in April and its lowest flux occurs in August. Regarding PM2.5, both cities demonstrate higher flux and concentrations in winter and lower values in summer. In Beijing, the highest PM2.5 flux is observed in January (0.11 μg m−2 s−1), while the lowest is observed in August (0.028 μg m−2 s−1). Shanghai’s peak occurs in December, with the lowest value in June.
For PM10, Beijing exhibits higher flux in winter and lower flux in summer, while Shanghai’s variation is relatively small. The maximum annual PM10 flux in Beijing is observed in May (2.76 μg m−2 s−1), with a relatively high flux in January (2.732 μg m−2 s−1) and the minimum flux in August (1.156 μg m−2 s−1). In Shanghai, the highest flux occurs in December, while the lowest flux is observed in June.

3.7. Contribution of Urban Green Spaces to Air-Quality Improvement

Urban vegetation significantly contributes to improving urban air quality through the process of dry deposition, which involves the removal of air pollutants. Figure 10 depicts the seasonal variation in the percentage of ozone removal through dry deposition in Beijing and Shanghai. Both cities exhibit higher removal rates in summer and lower rates in winter. In Beijing, the maximum removal rate occurs in July and August, reaching approximately 0.1%, while the lowest rate is observed in winter, at around 0.03%. Similarly, Shanghai shows a seasonal pattern with the highest removal rate of 0.15% in August and the lowest rate of 0.11% in January. The annual rate of CO removal remains relatively stable in both cities, with Beijing averaging a removal rate of 0.94% and Shanghai fluctuating between 0.88% and 0.94%. The highest rate of improvement in CO levels is observed in August, while the lowest rate occurs in January. The rates of NO2 removal in both cities follow a seasonal trend, with higher rates in summer and lower rates in winter. Beijing reaches its maximum removal rate of 0.11% in July and a minimum rate of 0.03% in December. Similarly, Shanghai exhibits clear seasonal variations, with the highest rate of 0.05% in August and the lowest rate of 0.011% in January. Rates of SO2 removal also display a seasonal pattern in Beijing and Shanghai, with higher rates in summer and lower rates in winter. Beijing records its maximum removal rate of 0.10% in July, while the minimum rate of 0.01% occurs in December. In Shanghai, the peak rate of SO2 removal is observed in August, and the lowest rate is found in January.
Improvement percentages of PM2.5 and PM10 in Beijing and Shanghai show relatively smaller ranges of variation compared to other pollutants. However, they still exhibit a seasonal pattern, with higher improvement percentages during the summer months. In Beijing, the maximum improvement percentage of PM2.5 is observed in July, at 0.015%, while the minimum occurs in December, at 0.009%. For PM10, the highest improvement percentage is recorded in July, at 0.379%, and the lowest value is observed in December, at 0.222%. In Shanghai, the improvement percentages of PM2.5 and PM10 fluctuate significantly throughout the year without a clear pattern, with annual averages of 0.007% and 0.12%, respectively.

3.8. Analysis of the Ability of Urban Green Space to Remove Air Pollutants Through Dry Deposition

Figure 11 illustrates that annual trends in the removal of O3, CO, and NO2 show higher values in summer and lower values in winter, while the SO2, PM2.5, and PM10 are removed at higher rates in winter and spring. In Beijing, the highest degree of ozone removal occurs in July (6.09 t), while the lowest is in December (0.59 t). Shanghai records the highest ozone removal in August (2.04 t) and the lowest in December (0.36 t).
CO removal in Beijing is higher in winter and lower in spring, with a peak in January (67.93 t) and a minimum in May (16.4 t). Shanghai shows smaller fluctuations, with the highest removal in August (11.5 t) and the lowest in March (3.78 t). The range of NO2 removal in Beijing is relatively small, with a maximum in September (0.96 t) and a minimum in December (0.04 t). Shanghai’s NO2 removal ranges from 0.17 to 0.30 t, with the highest in August and the lowest in February. SO2 removal in Beijing is higher in winter and lower in summer, with a peak in February (0.19 t) and a minimum in July (0.064 t). Shanghai shows stable removal throughout the year (0.042 to 0.074 t).
PM2.5 removal in Beijing is slightly higher in winter, with the highest value in January (0.57 t) and the lowest in August (0.20 t). Shanghai’s PM2.5 and PM10 removal values remain stable, averaging 0.13 t and 2.65 t, respectively.

3.9. Monetary Value of Air-Pollutant Removal

Figure 12 illustrates that the value of air-pollutant removal is directly proportional to the removal amount. The economic value of removing different pollutants varies, with PM10 having a higher value and SO2 a relatively lower value.
In Beijing, the value of ozone removal is higher in summer, reaching a maximum in July ($41,119.94) and a minimum in December ($3976.56). Similarly, Shanghai shows higher ozone-removal values in summer, with a peak in August ($13,787.06) and a minimum in December ($2412.41). CO removal in Beijing is higher in winter, particularly in January and February, with a maximum value in January ($65,148.06) and a minimum in December ($19,366.41). Shanghai’s CO removal remains stable throughout the year, with a slightly higher value in August ($11,021.65). The range of the value of NO2 removal in Beijing is relatively small, with a maximum in September ($6538.04) and a minimum in December ($3003.95). The value of NO2 removal in Shanghai shows no significant variation, averaging $1628.44. The value of SO2 removal in Beijing fluctuates significantly, with a maximum in January ($288.89) and a minimum in October ($133.08). The value of SO2 removal in Shanghai remains relatively stable, with an annual average of $95.59.
The value of PM2.5 removal in Beijing varies greatly, with a maximum in January ($390,807.53) and a minimum in December ($170,923.42). PM10 removal value in Beijing fluctuates without a clear pattern, with an annual average of $49,261.58. In Shanghai, the values of PM2.5 and PM10 removal remain stable throughout the year, averaging $90,120.59 and $11,990.36, respectively.

3.10. Model Sensitivity Analysis

In the simulation of dry deposition, the sensitivity of the model to parameters and input variations was analyzed (Table A1). The study examined the response of dry-deposition flux of air pollutants in Beijing and Shanghai to factors such as temperature, humidity, pollutant concentration, and stomatal conductance.
Temperature was found to be the most significant factor influencing the dry-deposition flux of gaseous pollutants, especially in Shanghai. Higher temperatures were positively correlated with increased dry-deposition rates of CO and SO2, indicating enhanced absorption capacity at higher temperatures. Humidity had a relatively small impact, generally showing negative correlations due to increased wet deposition.
The effects of pollutant concentration and stomatal conductance were more complex, with limited impact on dry-deposition rates. The effects of stomatal conductance varied depending on the pollutant, reflecting the complex interaction between stomatal activity and environmental conditions. Leaf area index (LAI) showed varying effects on dry-deposition flux depending on the pollutant and city. The response to temperature in Beijing was mild compared to Shanghai, potentially due to gradual temperature changes throughout the year. Shanghai, being close to the East China Sea, exhibited more significant temperature dependencies and humidity restrictions on dry-deposition rates.
The study also analyzed the effects of input parameters on the dry-deposition flux of PM2.5 and PM10. Temperature had weak fluctuations on PM2.5, while its effect on PM10 was negligible. Humidity, stomatal conductance, and leaf area index had no significant effects on particulate matter deposition. Pollutant concentration had a significant impact on the dry-deposition flux of PM2.5 and PM10, with consistent positive and negative responses in both cities. Higher pollutant concentrations promoted particle aggregation and deposition.

3.11. The Impact of Urban-Greening Tree Species on the rRate of Dry Deposition of Gaseous Pollutants

The characteristics of tree species are closely related to their capacity for dry deposition of gaseous pollutants. This study further analyzed the dry-deposition capacity of major urban-greening tree species (85 species in Beijing and 87 species in Shanghai) for four gaseous pollutants. The top ten species were identified based on their dry-deposition rates. The detailed methodology for this analysis is provided in Section 2.4.
Table A2 shows the ranking of the dry-deposition rates of O3 for urban greening tree species in Beijing and Shanghai. In Beijing, Zelkova serrata (Thunb.) Makino had the highest dry-deposition rate of O3, reaching 0.00395 m s−1, followed by Populus tomentosa and Prunus triloba. In Shanghai, Photinia serratifolia (Desf.) Kalkman ranked first, with a dry-deposition rate of 0.00401 m s−1, followed by Zelkova serrata (Thunb.) Makino and Melia azedarach. Table A3 lists the top ten trees with the highest CO dry-deposition rates in Beijing and Shanghai. In Beijing, Zelkova serrata (Thunb.) Makino exhibited the highest dry-deposition rate, reaching 0.00437 m s−1, followed by Populus tomentosa Carr. and Prunus triloba Lindl.. In Shanghai, Photinia serratifolia (Desf.) Kalkman took the lead, with a rate of 0.00450 m s−1, followed by Zelkova serrata (Thunb.) Makino and Melia azedarach L. Table A4 showcases the top ten trees with the highest NO2 dry-deposition rates in the two cities. In Beijing, Zelkova serrata (Thunb.) Makino had the highest NO2 dry-deposition rate, at 0.00402 m s−1, followed by Populus tomentosa Carr. and Prunus triloba Lindl. Photinia serratifolia (Desf.) Kalkman again demonstrated its superior dry-deposition capacity in Shanghai with the highest NO2 dry-deposition rate, 0.00409 m s−1. Table A5 provides information on the top ten trees with the highest SO2 dry-deposition rates in the two cities. In Beijing, Zelkova serrata (Thunb.) Makino continued to rank first because its capacity for efficient dry deposition, with a dry-deposition rate of 0.00345 m s−1, followed by Populus tomentosa Carr. and Prunus triloba Lindl. In Shanghai, Photinia serratifolia (Desf.) Kalkman once again took the lead, with a rate of 0.00346 m s−1, followed by Zelkova serrata (Thunb.) Makino and Melia azedarach L.
These data suggest that Zelkova serrata (Thunb.) Makino performs exceptionally well in removing all four gaseous pollutants in Beijing. In Shanghai, Photinia serratifolia (Desf.) Kalkman demonstrates significant advantages in the dry deposition of multiple gaseous pollutants. Additionally, broad-leaved tree species generally perform better than coniferous tree species in the dry deposition of gaseous pollutants in both cities. These findings provide important references for the selection of urban-greening tree species, which can help optimize the configuration of urban green spaces and improve urban air quality.

4. Discussion

4.1. The Characteristics of Dry Deposition of Air Pollutants in Green Spaces of Different Cities

Based on the dry-deposition model used in this study, Ra, Rb, and Rc are three crucial factors determining the vertical deposition flux of gas pollutants (Vdg), corresponding to three steps of pollutant deposition to the ground surface: Ra controls the transport of pollutants from the atmosphere to the viscous sublayer close to the ground; Rb governs the delivery of pollutants from the viscous sublayer to the ground; and Rc regulates the capture of pollutants by the vegetation canopy. Among them, Ra and Rb are closely related to meteorological conditions such as air temperature, friction wind speed, and relative humidity. As air temperature rises and friction wind speed increases, Ra and Rb decrease, leading to an increase in the pollutant-deposition rate [23,24,25].
Both cities have a subtropical monsoon climate, and the atmospheric conditions in summer are highly unstable due to monsoon effects. Therefore, Ra and Rb for four types of gas pollutants in Beijing and Shanghai are generally higher in summer or in late spring and early autumn. Due to the low winter temperature and relatively calm airflow, Ra and Rb generally decrease in both cities, thus slowing down the deposition rate of gas pollutants to a certain extent.
Rc is closely related to the physiological and ecological conditions of vegetation. The higher the intensity of solar shortwave radiation, the higher the photosynthesis efficiency and stomatal conductance of plants and the lower the stomatal resistance, facilitating the absorption of gaseous pollutants through stomata [26,27]. This explains why Rc for various gas pollutants in both cities is generally lower in late spring and summer, while in winter, when plant activities slow down or plants are dormant, Rc increases, thus reducing the dry-deposition rate of gas pollutants.
The annual dry-deposition rate of gas pollutants in Beijing peaks in summer and reaches its lowest value in winter, which is related to the higher summer temperature and resultant higher vegetation activity in this city. Although Shanghai also shows seasonal changes, the magnitude is relatively small due to differences in climatic conditions and vegetation cover. Rc is closely related to the characteristics of tree species, and there are significant differences in geographical climate between different cities, resulting in different dominant species for dry deposition. In this study, broad-leaved tree species performed better than coniferous tree species in terms of dry deposition of gas pollutants in both cities, a difference related to the relatively higher stomatal conductance of broad-leaved tree species.
Ra and Rp (quasi-stream layer resistance) are two important factors that determine the Vdp (vertical deposition velocity) of particulate matter. Rp represents the resistance encountered by particulate matter when in contact with the ground surface, which is related to the characteristics of the ground surface, such as surface roughness and vegetation coverage [28,29]. When the value of Rp is large, it indicates that the particulate matter encounters greater resistance when it is in contact with the ground surface, resulting in a slower dry-deposition rate [30,31].
In the two cities studied, there is a trend of higher Rp values in summer and lower values in winter, and this trend is related to the different vegetation types in each city. In Beijing and Shanghai, the Rp value of particulate matter is smaller in summer due to the high vegetation coverage and increased surface roughness, resulting in a relatively high Vdp. In winter, the decrease in surface coverage leads to an increase in Rp value and the Vdp slows down. Between the two cities, Shanghai has the higher rate of dry deposition of particulate matter throughout the year, which is related to the city’s larger surface roughness and higher vegetation coverage. Urban green spaces exhibit significant differences in the characteristics of dry deposition of atmospheric particulate matter among different cities.
The dry-deposition rate and concentration determine the dry-deposition flux of urban air pollutants. In the two cities studied, the intra-annual trends in O3 concentration both show seasonal variations: their values are high in summer and low in winter, while the values of CO, NO2, SO2, PM2.5, and PM10 all exhibit seasonal variations, being low in summer and high in winter. The variation in ozone concentration is mainly influenced by temperature changes, as high temperatures in summer favor ozone formation, resulting in higher ozone concentrations in summer [32].
Compared to O3, CO, NO2, and SO2 have higher reaction temperatures and are all produced in industrial activities, so they are less affected by natural factors and are mainly influenced by human activities and industrial production patterns. Particulate matter is also primarily produced in industrial and human activities. Due to increased electricity demand, boiler heating, and population activities during the Chinese New Year, emissions and concentrations of CO, NO2, SO2, and particulate matter increase significantly in winter compared to summer [33,34,35].
The dry-deposition flux of carbon monoxide (CO) in Beijing is higher in winter and summer, while in Shanghai, it is higher in spring and autumn. The dry-deposition flux of nitrogen dioxide (NO2) in Beijing shows a pattern of being higher in summer than in winter, while in Shanghai, it is the opposite. The dry-deposition flux of sulfur dioxide (SO2) in Beijing is higher in winter and lower in summer. The dry-deposition fluxes of PM2.5 and PM10 in all cities showed a pattern of being higher in winter than in summer. Yuan Yue observed the dry-deposition flux of ozone over bare soil and also found results similar to those found in this study, that is, the limitation on ozone dry-deposition flux in summer is higher than in other seasons [36].

4.2. The Main Factors Influencing the Dry Deposition of Air Pollutants in Urban Green Spaces

By comparing the climate and geographical characteristics of two cities, it can be seen that climatic conditions and stomatal conductance of vegetation have significant regulating effects on the dry-deposition flux of gas pollutants. The significant influences of temperature and stomatal conductance on the dry-deposition flux of gas pollutants in Shanghai emphasizes the important role of subtropical climate and vegetation types in the process of pollutant treatment. In contrast, the impact of the temperate climate characteristics in Beijing on the dry-deposition flux of gas pollutants is relatively gentle, but seasonal changes may lead to periodic fluctuations in the dry-deposition flux. Huang Jiqing conducted a study on the dry deposition of ozone in winter wheat and found that dry deposition is jointly influenced by factors such as atmospheric relative humidity, canopy humidity, temperature, and solar radiation [37].
Unlike gas pollutants, pollutant concentration is the main environmental factor affecting the dry-deposition flux of particulate matter in the two cities studied, while the impacts of temperature, humidity, stomatal conductance, and leaf area index are not significant. Studies have pointed out that the process of dry deposition of atmospheric particulates is comprehensively influenced by factors such as plant types, plant configuration, particulate concentration, and meteorological conditions. Notably, changes in land use and land cover, such as urban expansion and industrialization, can alter surface characteristics, further affecting the rate of dry-deposition of particulate matter. The increase in construction land reduces vegetation cover and decreases the natural deposition capacity of atmospheric particles. Conversely, increasing green spaces through urban planning, such as city parks and street trees, can improve the dry-deposition rate, thus reducing air pollution [38].
However, some studies have also found that the structure of urban forests is a key factor affecting the dry deposition of particulate matter. Leaf characteristics, crown density, and the composition of understory vegetation of different tree species can all affect the deposition efficiency of particulate matter. The height and canopy structure of trees can influence wind speed and particulate diffusion, while tree species and leaf roughness directly affect the capture capacity of particulate matter [39,40,41]. Additionally, wind speed, temperature, humidity, and precipitation are critical meteorological driving factors for dry-deposition rates. Increased wind speed typically raises the diffusion rate of particles, while higher temperature and humidity favor the migration of particles to the vegetation surface. Rainfall can not only remove atmospheric particulates through wet deposition but also influence the re-suspension of particulates on vegetation surfaces [42].
Other studies have found that meteorological factors are important factors affecting the residence time of particulate matter and that different plant configurations affect the dry deposition process by regulating the temperature and relative humidity within the ecosystem [43,44,45].

4.3. The Improvement of Air Quality by Dry Deposition in Urban Green Spaces

Dry deposition is a crucial measure in air-pollution control, exhibiting distinct seasonal patterns in the removal of pollutants in different cities [46,47]. It plays a positive role in improving air quality. Beijing, one of the cities with more severe pollution in China, achieves substantial pollutant removal through dry deposition. The removal of pollutants in Beijing primarily focuses on particulate matter, which correlates closely with the city’s air-pollution situation. The removal of pollutants is also seasonally influenced, with higher particulate-matter concentrations in winter and spring leading to relatively large removal quantities.
In Shanghai, significant removal through dry deposition occurs for particulate matter and NO2, with higher removal quantities in winter and spring. This pattern is related to seasonal atmospheric stability and pollutant emissions. Analyzing the quantities of PM2.5 and PM10 removed by vegetation in the Beijing−Tianjin−Hebei region from 2015 to 2018, Zhai Haoran found that the removal quantity of particulate matter is proportional to its concentration, with over 80% of the reduction occurring between May and September, a pattern attributed to the larger leaf area in summer [48].
Removal value is a critical indicator for assessing the effectiveness of dry deposition; it is proportional to the removal quantity and influenced by the external cost per ton of pollutants [46]. Between the two cities, Beijing has the larger removal value attributable to dry deposition, particularly for PM2.5 and PM10, reaching up to 400,000 to 500,000 US dollars per month. This indicates that significant economic and environmental benefits can be achieved by removing these particulate matters through dry deposition.
Additionally, the value of O3, CO, and NO2 removal in the two cities is mainly concentrated in summer, while the value of SO2 and particulate-matter removal is higher in winter and spring. This pattern reflects the seasonal variation and sources of pollutants, as well as the varying degrees of impact different pollutants have on human health and the environment.
Liu Li conducted an assessment of the ecological benefits of urban green spaces in Zhengzhou and found that tree density and species richness are proportional to the efficiency rate of benefits generated. Park green spaces, with the most diverse tree species, provide the highest overall ecological-service function and removal value, while plaza green spaces, having the fewest trees, result in the lowest annual ecological benefits [49].

5. Conclusions

In urban green spaces, the process of dry deposition of pollutants plays a crucial role in improving air quality. Existing monitoring methods and models have some limitations in terms of sustainability and refinement at the species level. Using optimized dry-deposition methods and integrating field plant information, this study conducted an in-depth analysis of the dry-deposition capacity of green spaces in Beijing and Shanghai, China, and further explored the important factors affecting dry-deposition rates. The main research findings are as follows:
(1).
Seasonal fluctuations in deposition rates: The ecological environment and climatic conditions vary with the seasons, leading to seasonal fluctuations in the deposition of pollutants in the air. In summer, the deposition rates of gaseous pollutants in both regions are higher, while they gradually decrease in spring and winter, showing significant seasonal changes. In contrast, the deposition rates of particulate matter in the air remain relatively stable. In hot summers, the values of Ra and Rb tend to increase, while in cold winters, they decrease accordingly. The Rc indicator is higher in winter and lower in summer, fluctuating with the seasons. The Rp value is higher in summer in Beijing and Shanghai. Broadleaf species outperform coniferous species in the removal of gaseous pollutants, with Zelkova serrata (Thunb.) Makino in Beijing and Photinia serratifolia (Desf.) Kalkman in Shanghai being the dominant species for the dry deposition of gaseous pollutants in the two cities.
(2).
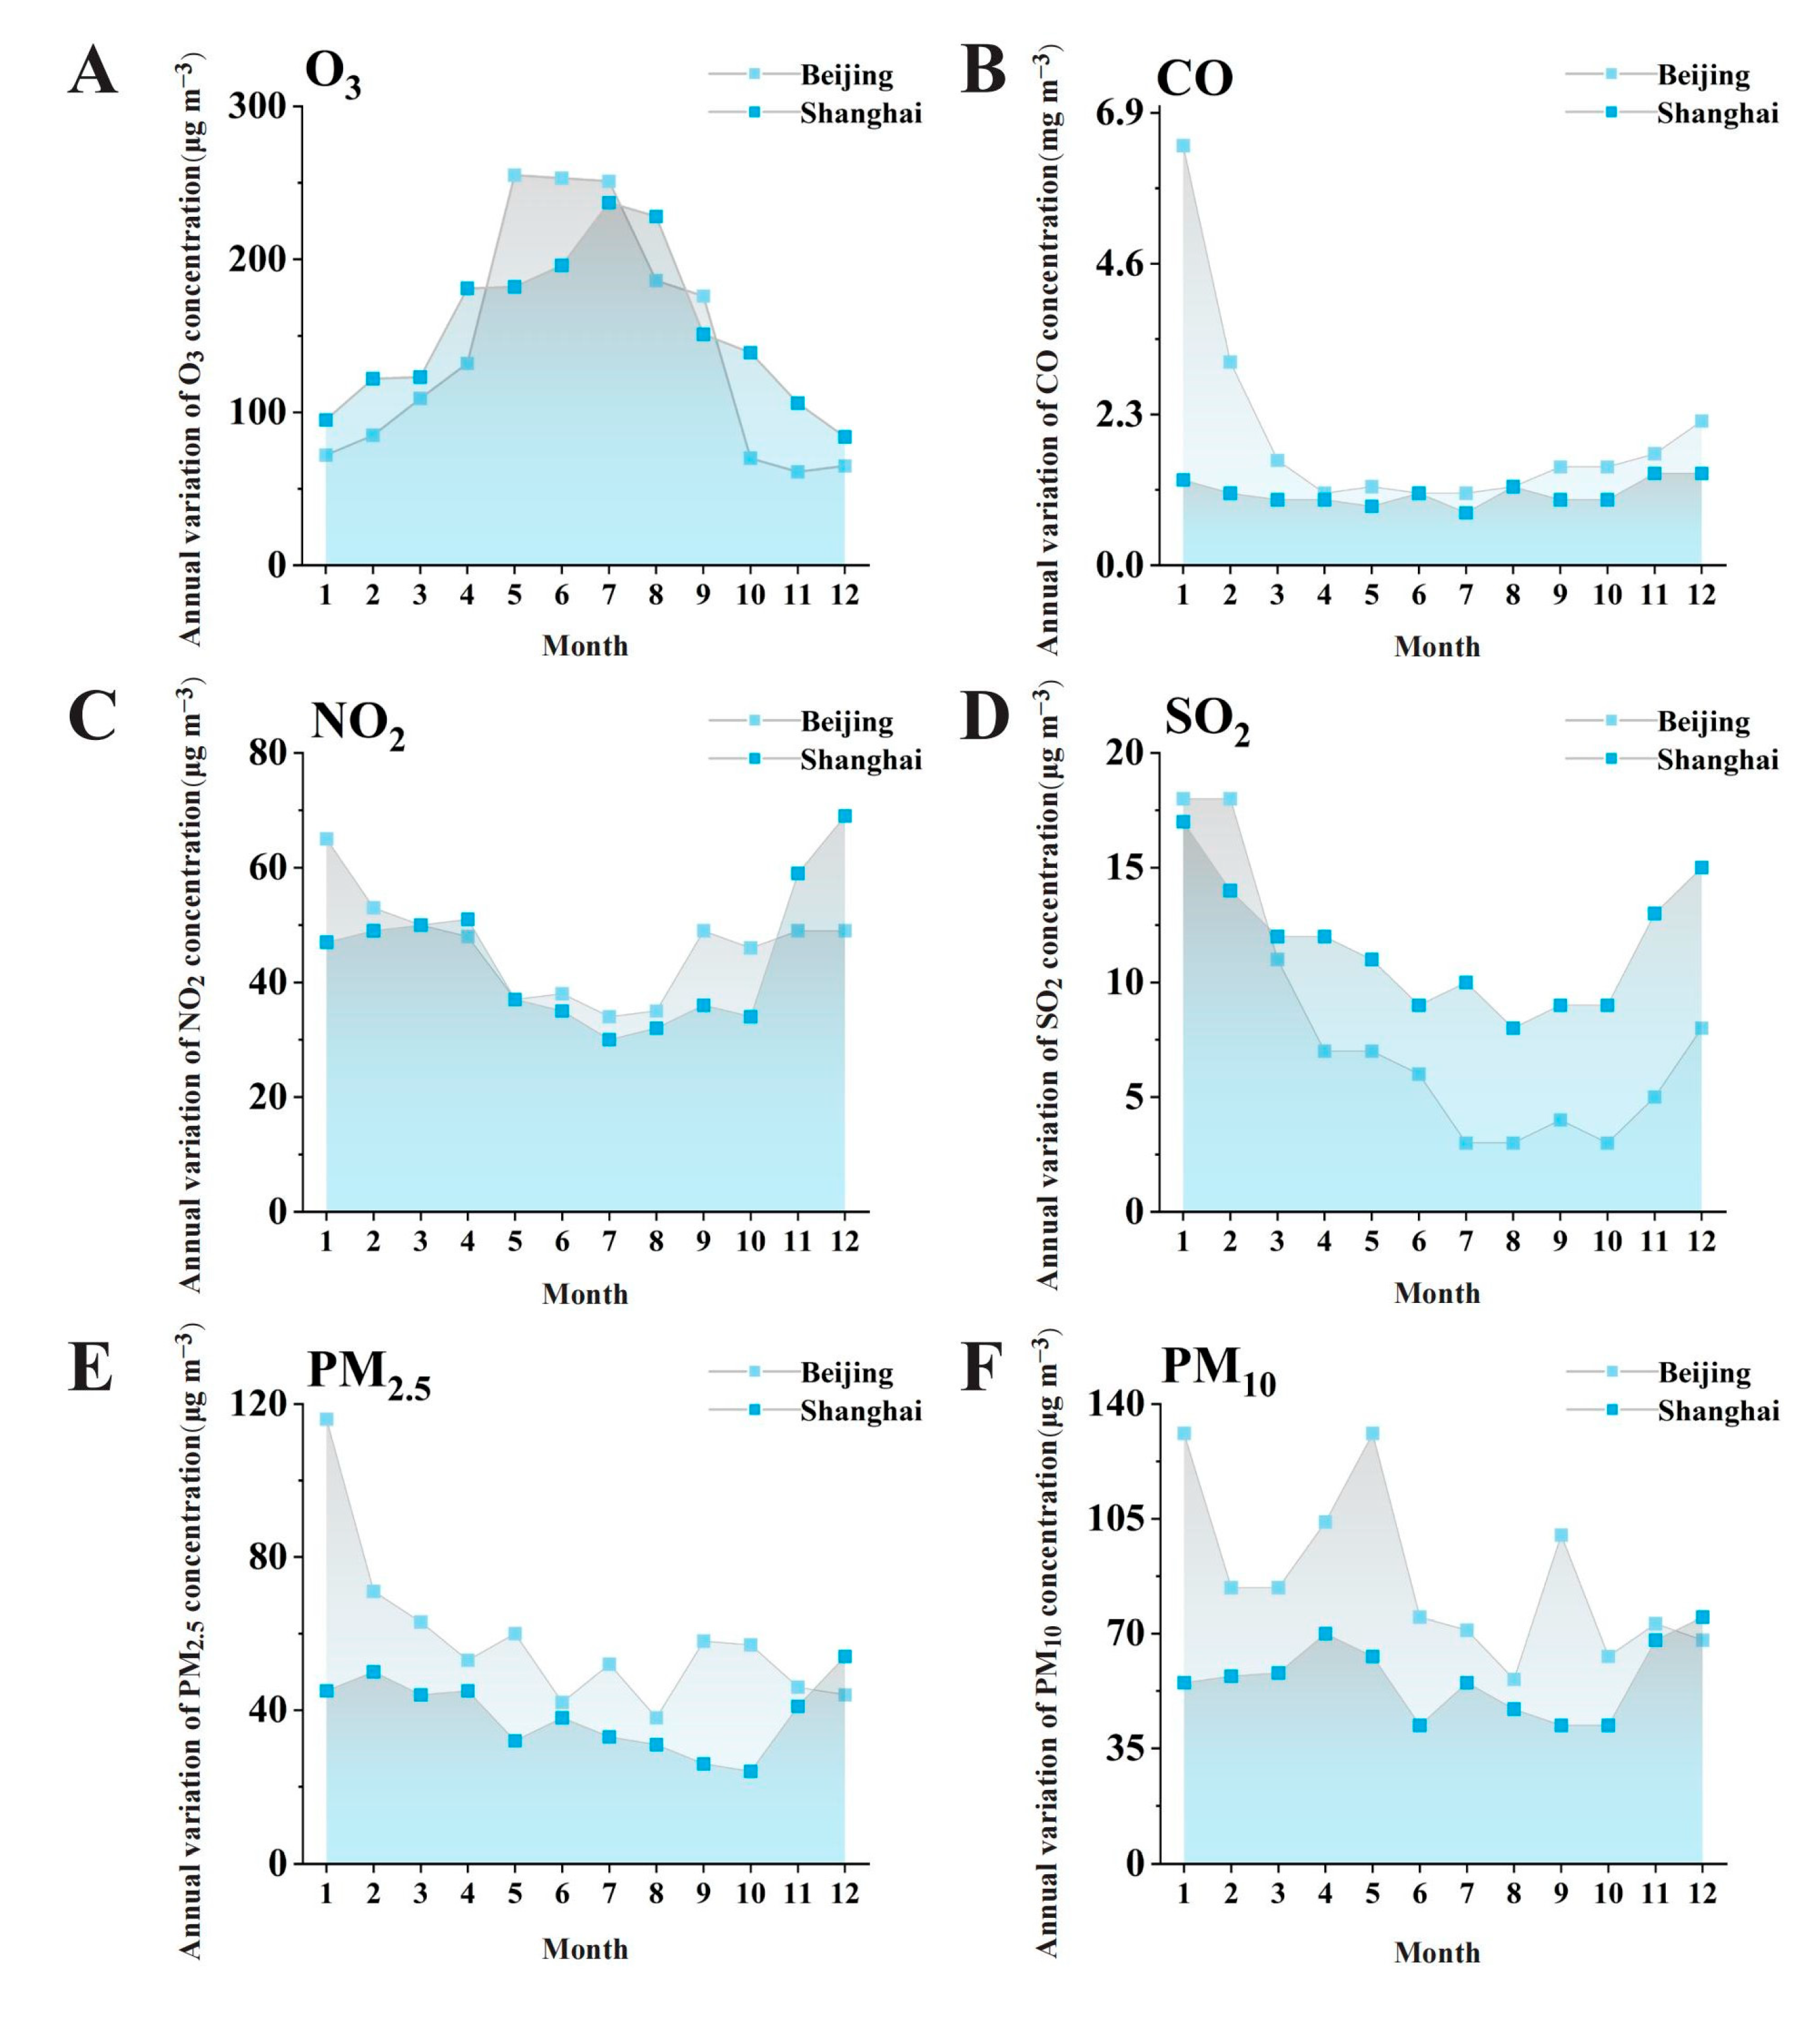
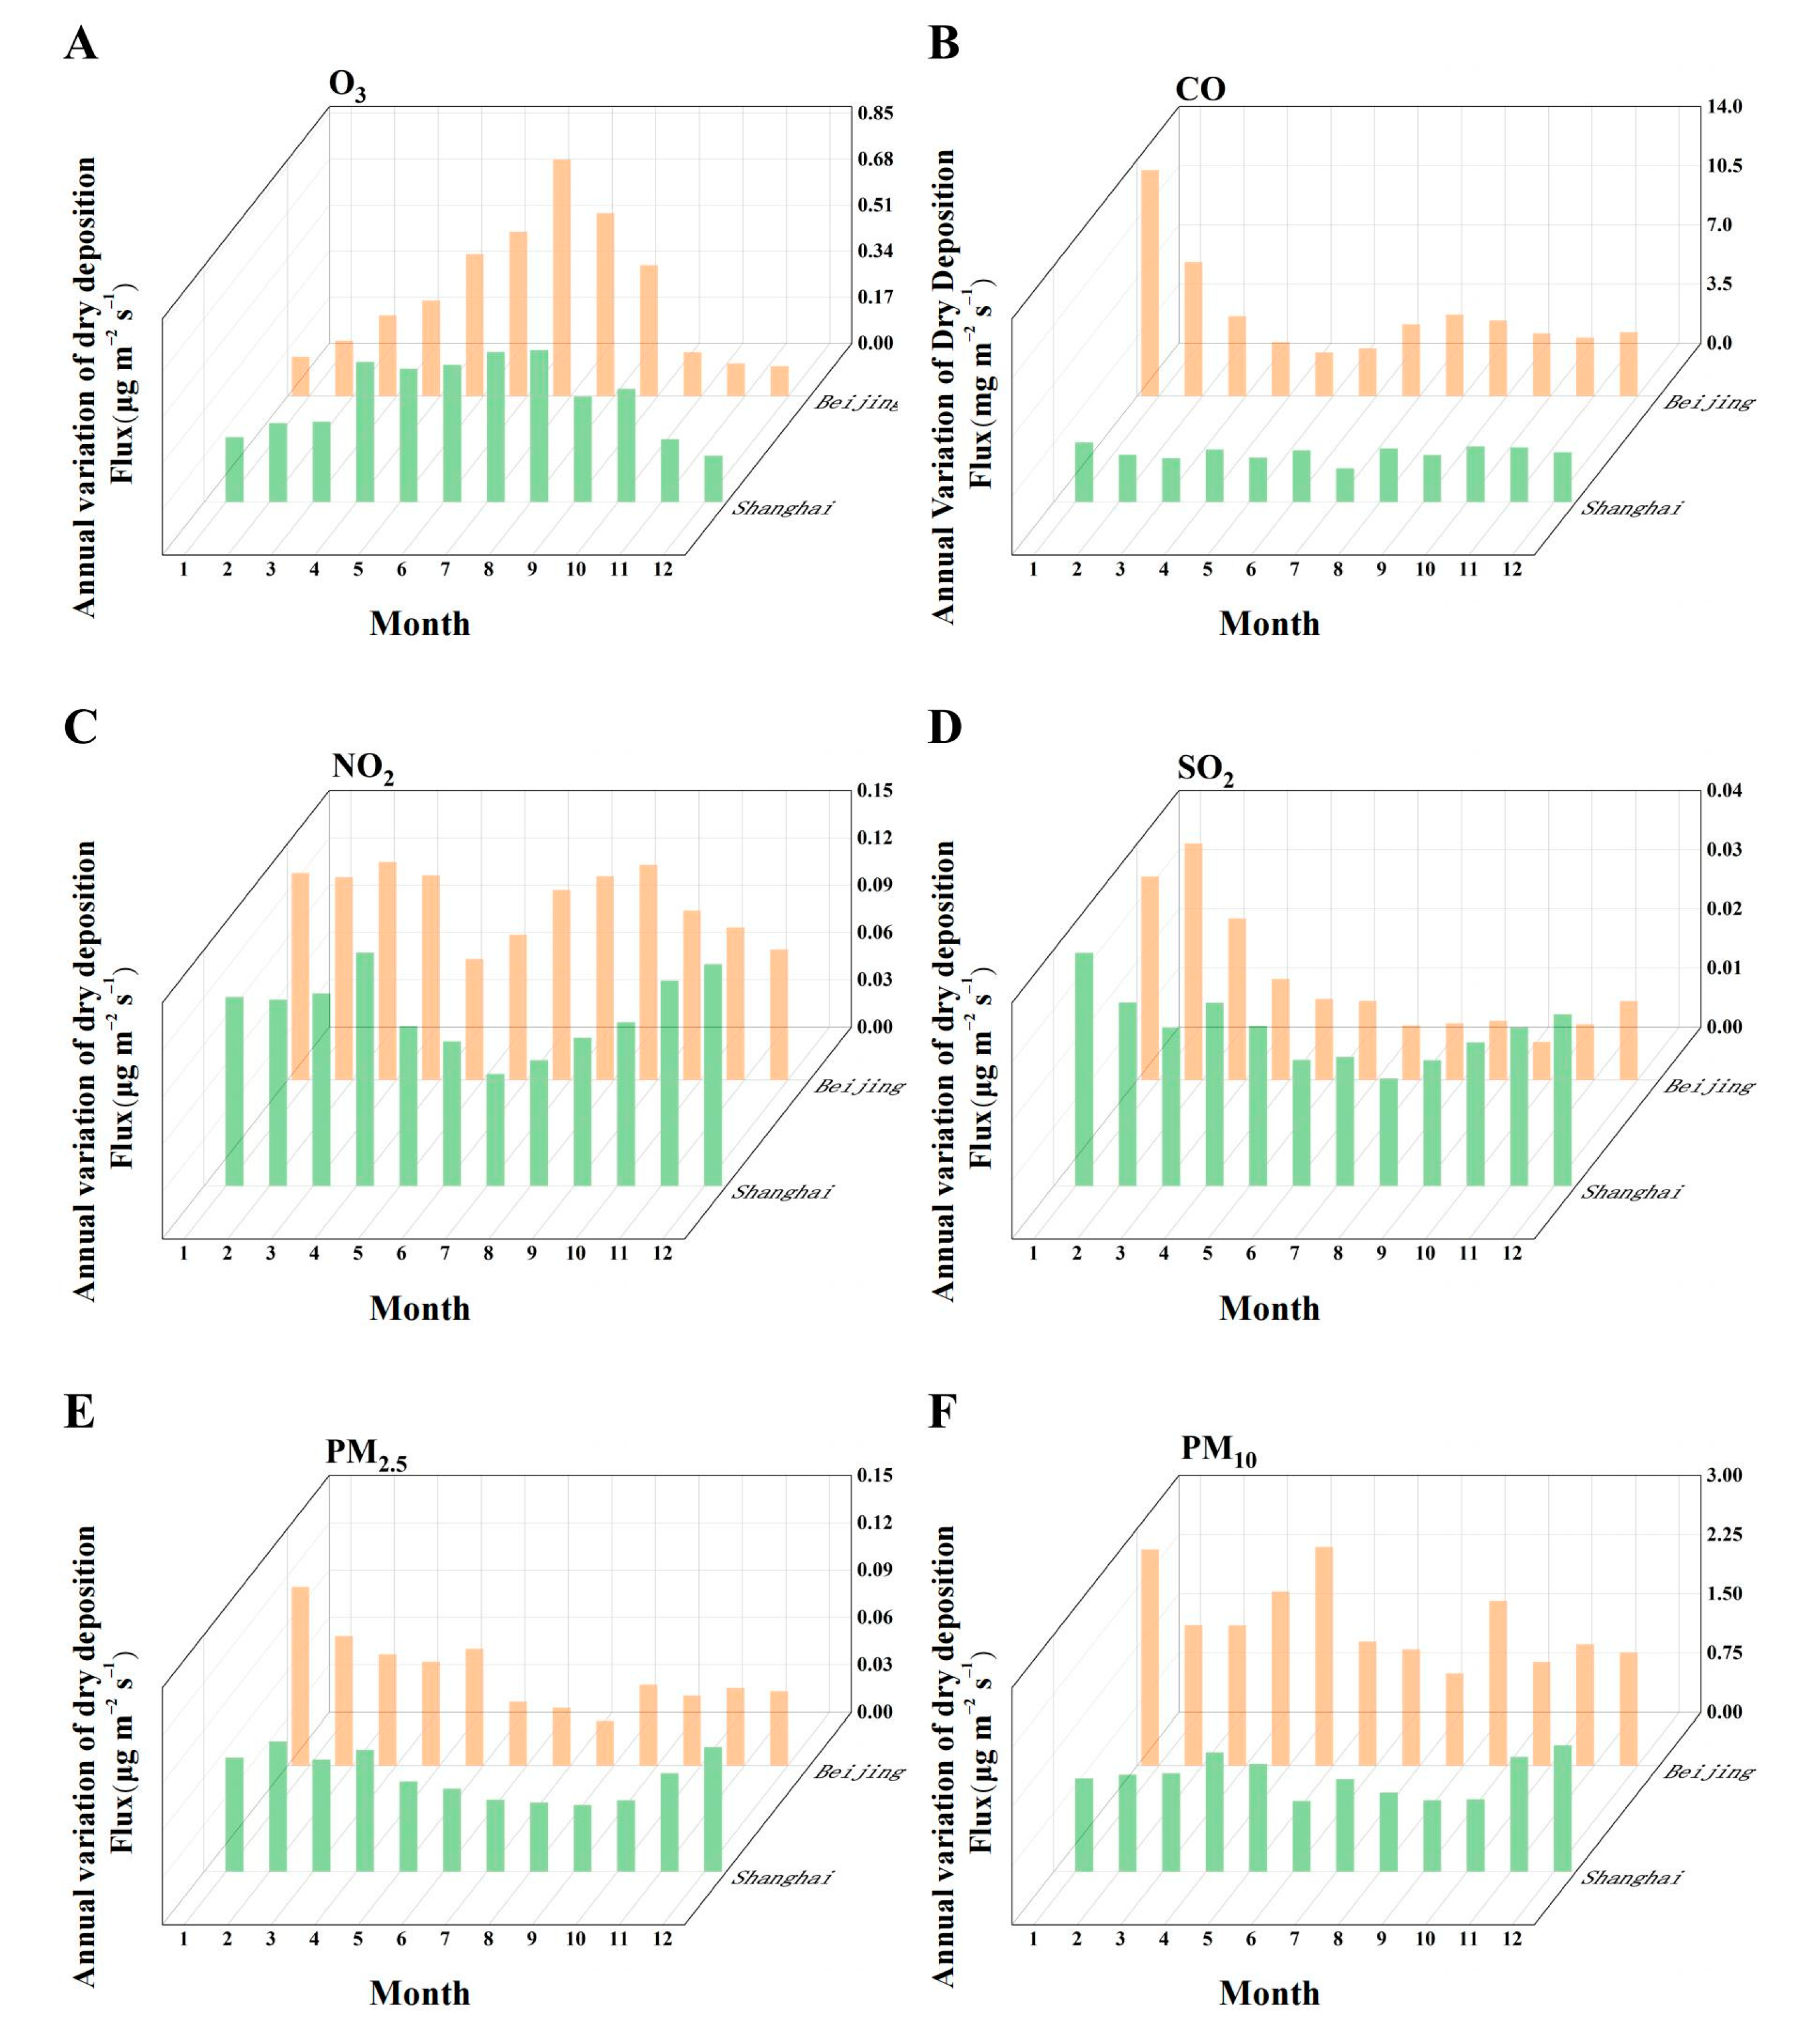
Dry-deposition flux and seasonal concentrations: The dry-deposition flux of ozone is higher in summer and lower in winter in each city, consistent with the seasonal changes in the concentration of ozone. In summer and winter, the concentrations of CO and NO2 in the air in Beijing are higher, while the corresponding fluxes in Shanghai are better in spring and autumn. In winter, the dry-deposition fluxes of SO2 and particulate matter are larger, while they are smaller in summer, consistent with the seasonal fluctuation and trend in concentration.
(3).
Influence of environmental factors: Ambient temperature plays a decisive role in the dry deposition of gaseous pollutants in both cities. Relatively speaking, humidity and stomatal conductance have less influence on the dry-deposition rate of gaseous pollutants, while differences in vegetation characteristics between cities also have a certain impact. Pollutant concentration has a significant effect on the dry deposition process of particulate matter. Changes in plant species caused by geographical and climatic changes have little impact on the dry deposition of particulate matter.
(4).
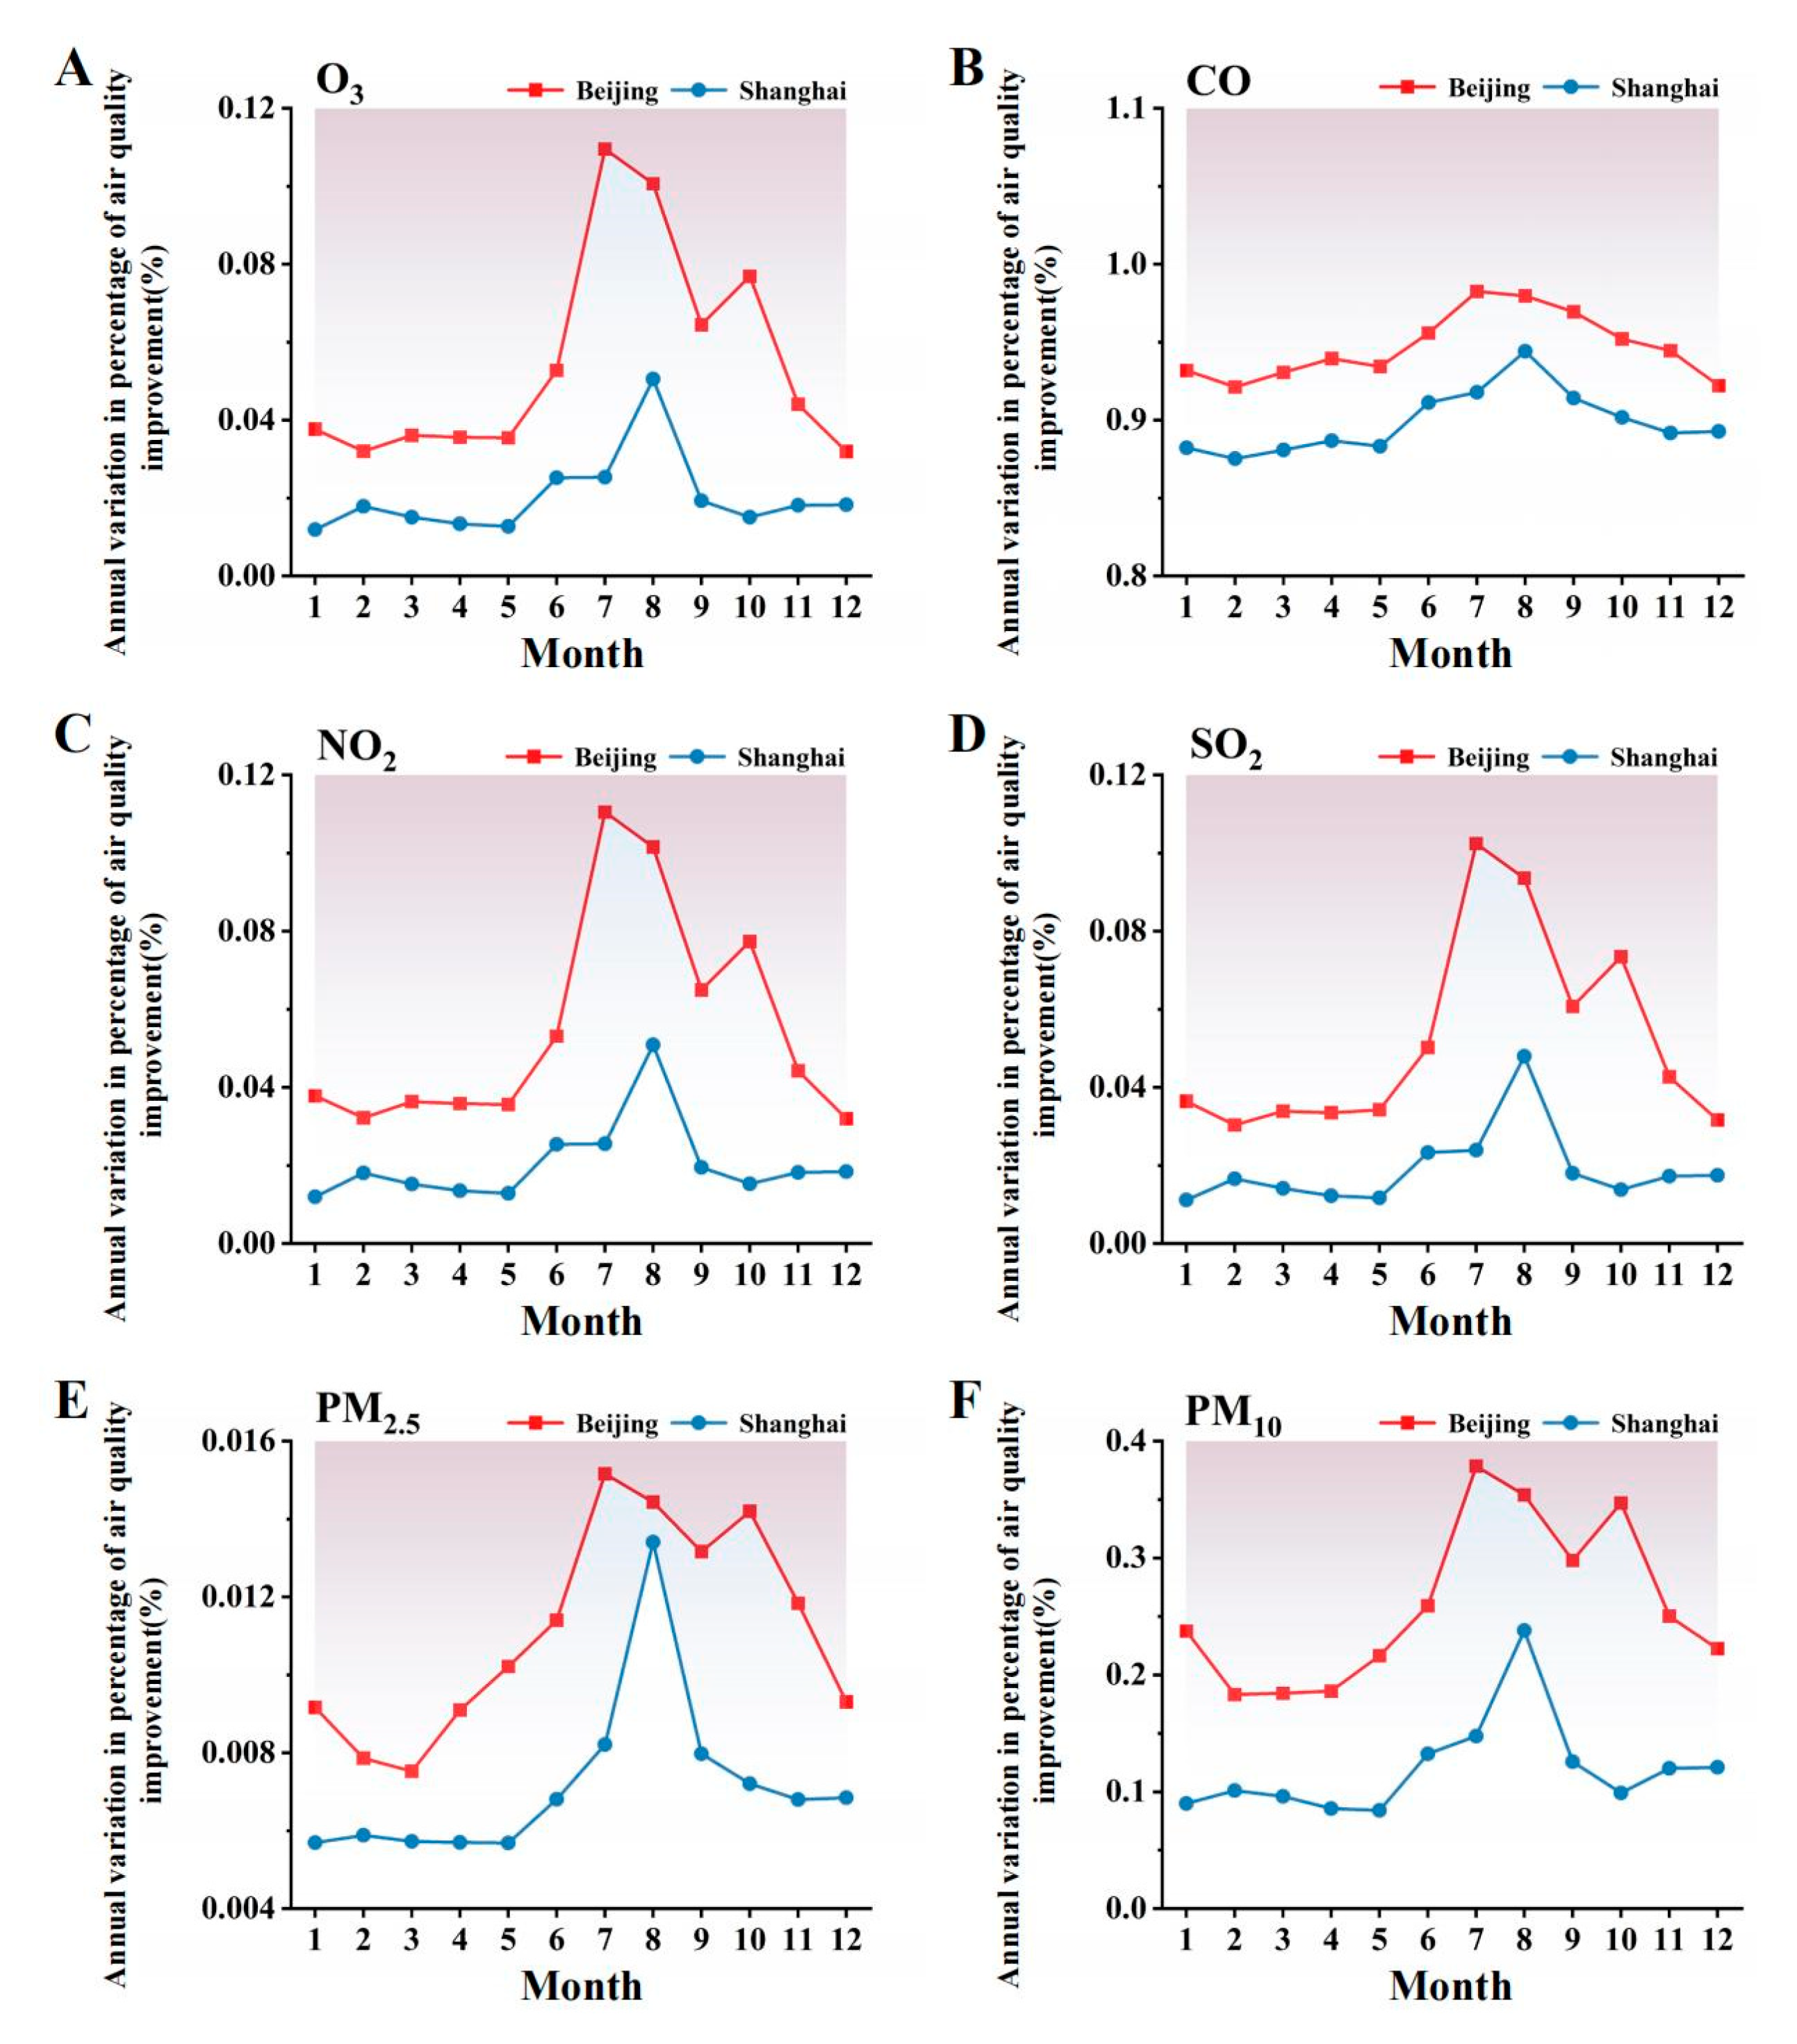
Seasonal and regional differences: Dry deposition exhibits significant seasonal and regional differences in pollutant removal and air-quality improvement. Beijing’s performance in reducing O3, CO, and NO2 is particularly prominent in summer. In winter and spring, Beijing achieves significant results in reducing SO2, PM2.5, and PM10. The urban green vegetation in both cities has a higher capacity to eliminate ozone in summer and a lower capacity in winter, fluctuating with the seasons.
(5).
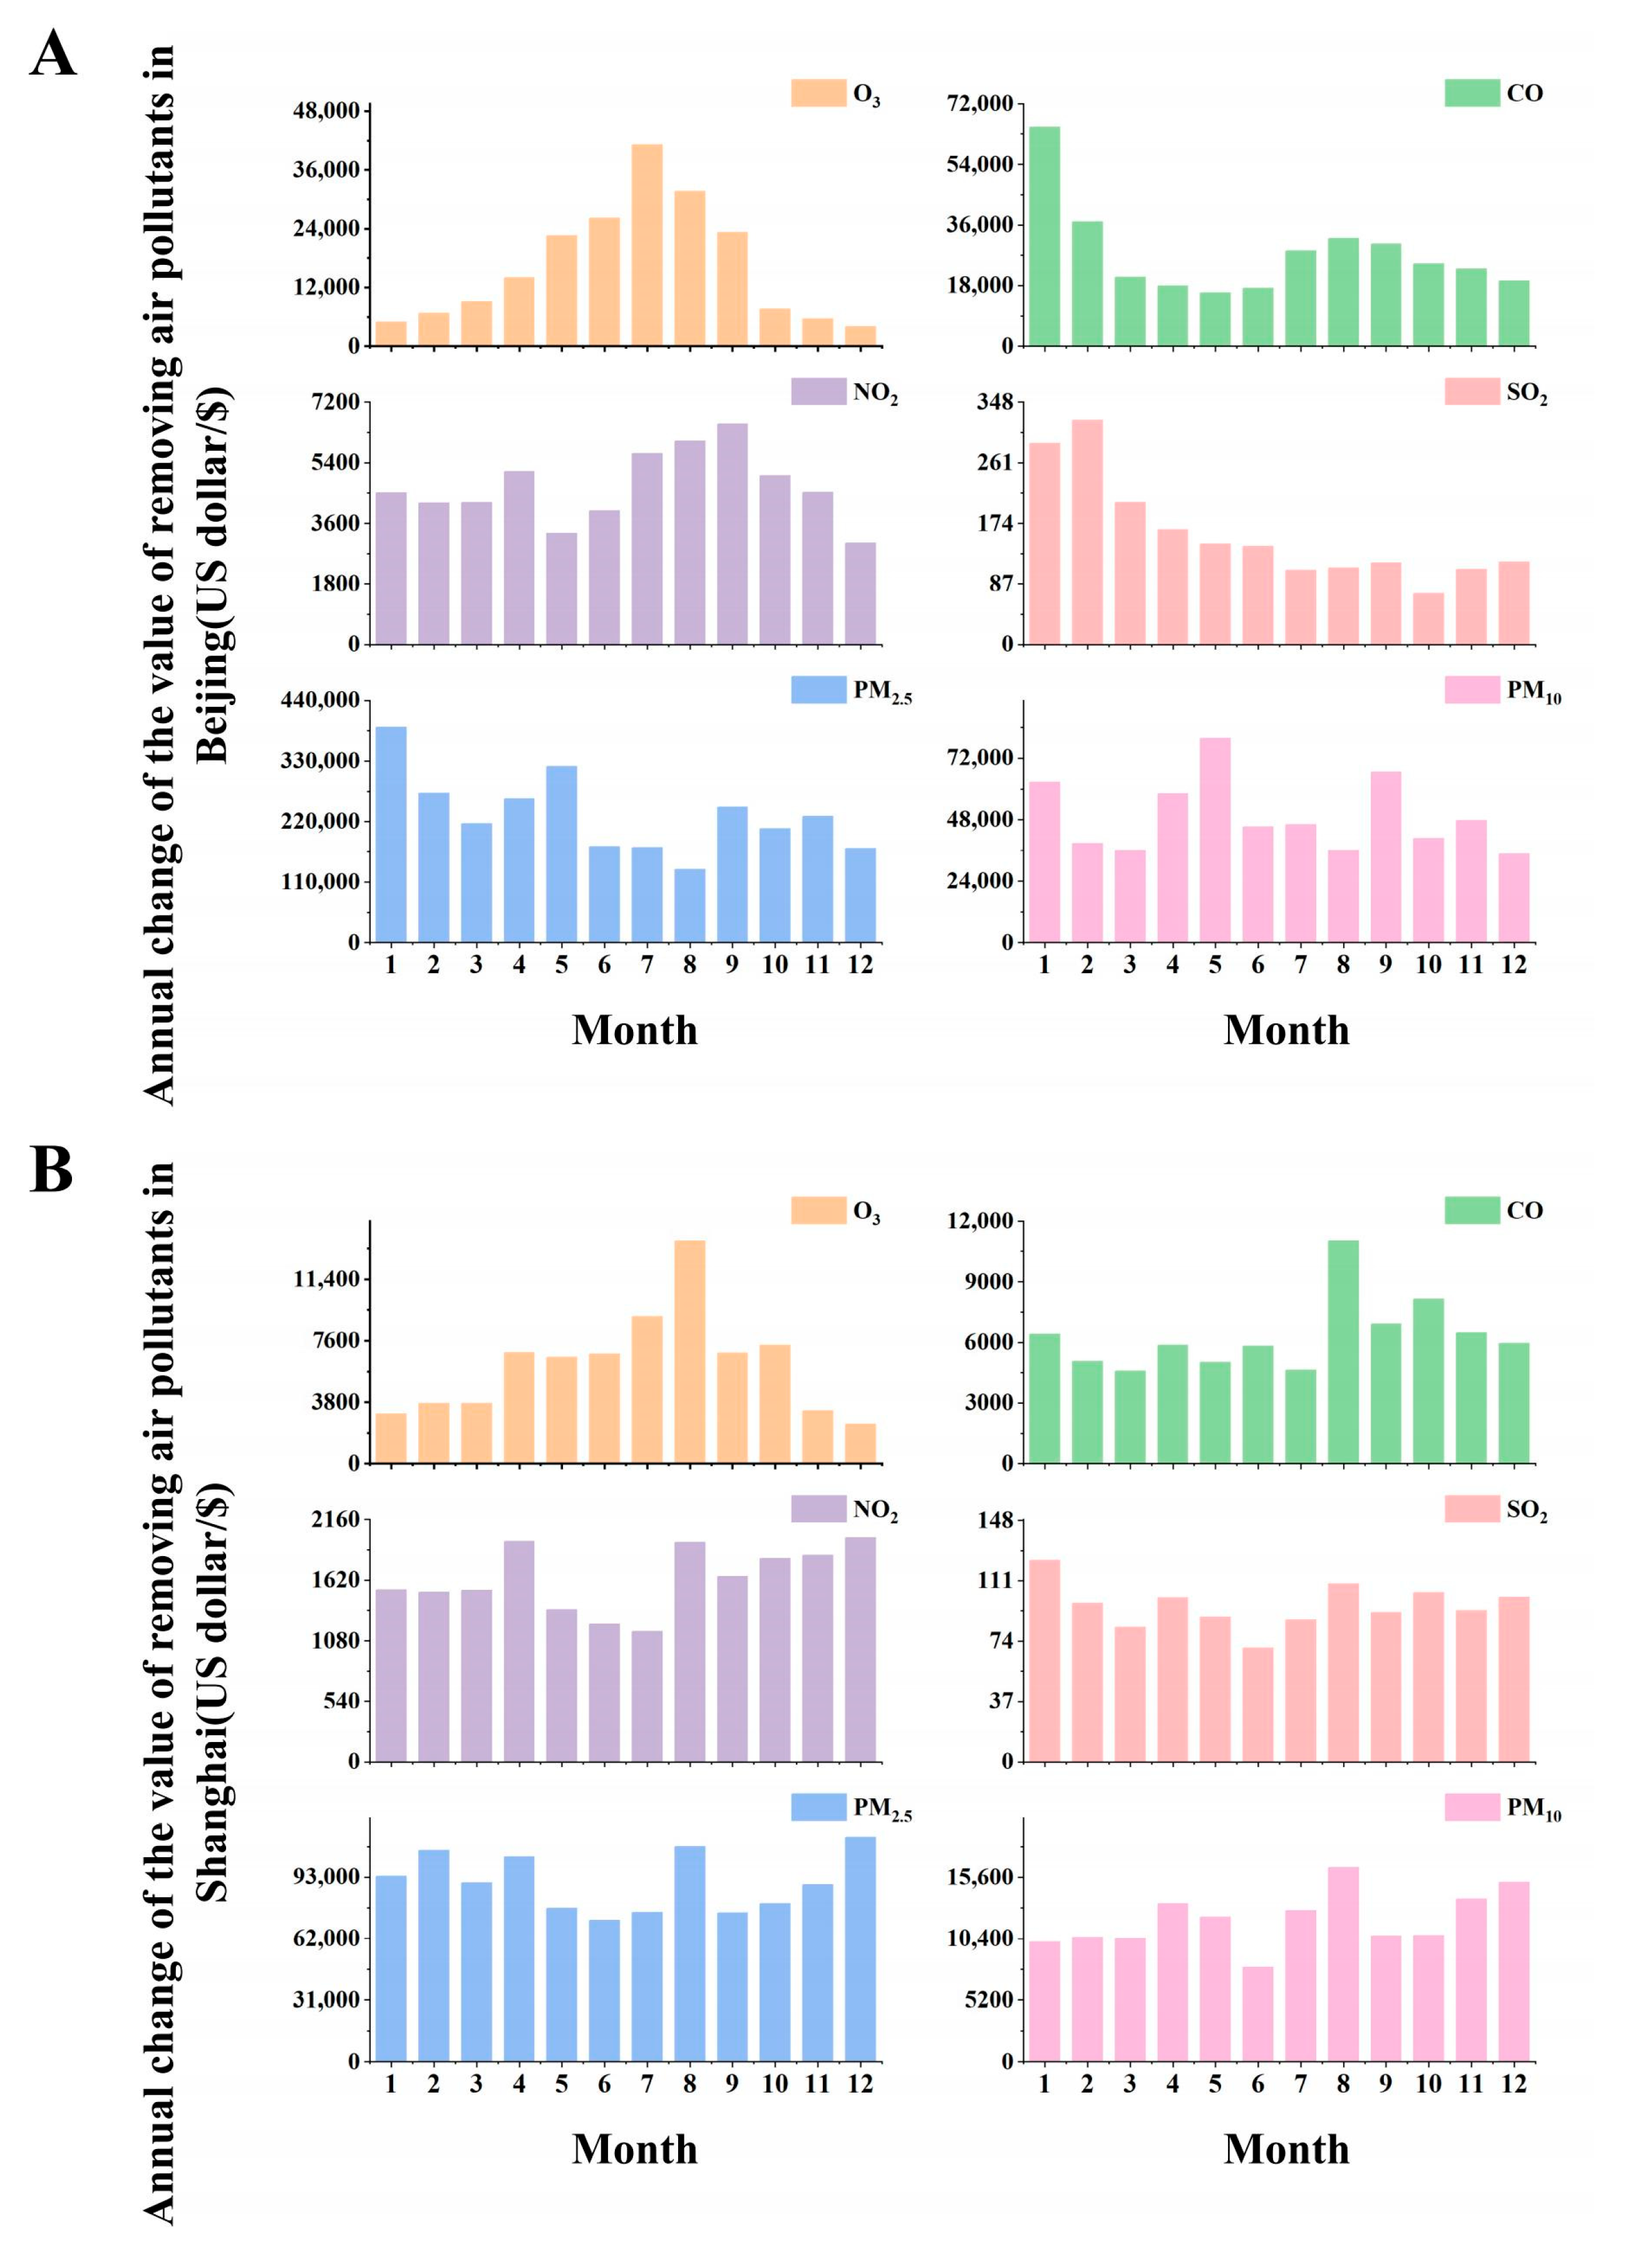
Monetary value of pollutant removal: Beijing has the higher ozone-removal value between the two cities, especially in summer. In summer, the ozone removal value in each region also shows obvious advantages. In winter, Beijing’s CO and NO2 purification values are relatively high. Additionally, the purification values of SO2 and particulate matter are particularly prominent in Beijing, whereas Shanghai’s fluctuation is relatively stable.

Author Contributions

Conceptualization, H.P.; methodology, S.S. and D.M.; software, S.S. and Y.Q.; validation, M.Q.; formal analysis, F.X.; investigation, W.D. and Y.Q.; resources, J.C. and Y.S.; data curation, H.P. and M.Q.; writing—original draft preparation, H.P. and S.S.; writing—review and editing, H.P. and S.S.; visualization, W.D.; supervision, T.Z.; project administration, Y.R.; funding acquisition, J.C., Y.R. and T.Z. All authors have read and agreed to the published version of the manuscript.

Funding

This research was funded by several funds. We acknowledge the financial support from the Zhejiang Provincial Natural Science Foundation of China (grant numbers LQ20D050002, Recipient: Yuan Ren, Ph.D.), the National Key Research and Development Program of China (grant numbers 2023YFF1304604, Recipient: Jian Chen), the National Natural Science Foundation of China (grant numbers 32101573, Recipient: Yuan Ren, Ph.D.), and the project on Demonstration of rapid restoration and ecological benefit evaluation technology of damaged forest ecosystem in Zhejiang Province (grant numbers 2022C02019, Recipient: Yan Li).

Institutional Review Board Statement

The study was conducted in accordance with the Declaration of Helsinki, and the protocol was approved by the Ethics Committee of College of Forestry and Biotechnology, Zhejiang A & F University.

Data Availability Statement

The data that support the findings of this study are available from the corresponding author upon reasonable request.

Acknowledgments

Authors acknowledge the financial support from the Zhejiang Provincial Natural Science Foundation of China from Yuan Ren, and thank Yan Shi for contributions to the theoretical framework of the study and Yingying Qiu for assistance with the literature review and background research.

Conflicts of Interest

The authors declare no conflicts of interest.

Appendix A

Table A1. Effect on model output (Dry-deposition flux) of changes in input variables.
CityBeijingShanghai
InputvariableTempHumidityPCSCLAITempHumidityPCSCLAI
Pollutant
O3−20%0.77−0.15−0.200.06−0.68−0.76−0.68−0.200.08−0.68
+20%−0.79−0.690.20−0.08−0.68−0.77−0.680.20
−50%3.33−0.68−0.500.30−0.685.89−0.68−0.50
+50%−0.79−0.690.50−0.12−0.68−0.77−0.680.50
CO−20%−0.72−0.66−0.200.03−0.66−0.78−0.70−0.20
+20%−0.76−0.660.20−0.09−0.66−0.79−0.700.20
−50%4.32−0.66−0.500.24−0.665.91−0.70−0.50
+50%−0.76−0.660.50−0.14−0.66−0.79−0.700.50
NO2−20%−0.73−0.66−0.200.120.04−0.75−0.67−0.20
+20%−0.76−0.660.200.10−0.09−0.76−0.680.20
−50%4.00−0.66−0.500.140.256.24−0.67−0.50
+50%−0.76−0.660.500.10−0.14−0.76−0.680.50
SO2−20%−0.66−0.60−0.200.00−0.60−0.70−0.63−0.20
+20%−0.69−0.600.20−0.09−0.60−0.71−0.630.20
−50%4.84−0.60−0.500.15−0.606.53−0.63−0.50
+50%−0.68−0.600.50−0.12−0.60−0.71−0.630.50
PM2.5−20%−0.020.00−0.200.000.00−0.010.000.50
+20%0.010.000.200.000.000.000.00−0.20
−50%−0.070.00−0.500.000.00−0.030.000.20
+50%0.030.000.500.000.000.010.00−0.50
PM10−20%0.000.00−0.200.000.000.000.00−0.20
+20%0.000.000.200.000.000.000.000.20
−50%0.000.00−0.500.000.000.000.00−0.50
+50%0.000.000.500.000.000.000.000.50
Table A2. Top 10 list of O3 dry-deposition rates for urban greening tree species in Beijing and Shanghai (m s−1).
BeijingShanghai
PlantEvergreen/DeciduousVdgPlantEvergreen/DeciduousVdg
1Zelkova serrata (Thunb.) MakinoDeciduous0.00395Photinia serratifolia (Desf.) KalkmanEvergreen0.00401
2Populus tomentosa Carr.Deciduous0.00359Zelkova serrata (Thunb.) MakinoDeciduous0.00381
3Prunus triloba Lindl.Deciduous0.00354Melia azedarach L.Deciduous0.00323
4Rhus typhina L.Deciduous0.00350Prunus cerasifera ‘Atropurpurea’ Ehrh.Deciduous0.00318
5Fraxinus pennsylvanica MarshallDeciduous0.00348Metasequoia glyptostroboides Hu & W.C. ChengEvergreen0.00312
6Toona sinensis (A. Juss.) M. Roem.Deciduous0.00336Cryptomeria japonica var. sinensis (Sieb. & Zucc.) Dallim. & A.B. Jacks.Evergreen0.00312
7Melia azedarach L.Deciduous0.00336Styphnolobium japonicum ‘Pendula’ (L.) SchottDeciduous0.00307
8Prunus cerasifera ‘Atropurpurea’ Ehrh.Deciduous0.00331Aesculus chinensis BungeDeciduous0.00302
9Metasequoia glyptostroboides Hu & W.C. ChengEvergreen0.00324Cercis chinensis BungeDeciduous0.00295
10Styphnolobium japonicum ‘Pendula’ (L.) SchottDeciduous0.00319Catalpa ovata G. DonDeciduous0.00293
Table A3. Top-10 list of CO dry-deposition rates for urban-greening tree species in Beijing and Shanghai (m s−1).
BeijingShanghai
PlantEvergreen/DeciduousVdgPlantEvergreen/DeciduousVdg
1Zelkova serrata (Thunb.) MakinoDeciduous0.00437Photinia serratifolia (Desf.) KalkmanEvergreen0.00450
2Populus tomentosa Carr.Deciduous0.00395Zelkova serrata (Thunb.) MakinoDeciduous0.00426
3Prunus triloba Lindl.Deciduous0.00390Melia azedarach L.Deciduous0.00356
4Rhus typhina L.Deciduous0.00385Prunus cerasifera ‘Atropurpurea’ Ehrh.Deciduous0.00350
5Fraxinus pennsylvanica MarshallDeciduous0.00383Metasequoia glyptostroboides Hu & W.C. ChengEvergreen0.00343
6Toona sinensis (A. Juss.) M. Roem.Deciduous0.00369Cryptomeria japonica var. sinensis (Sieb. & Zucc.) Dallim. & A.B. Jacks.Evergreen0.00343
7Melia azedarach L.Deciduous0.00369Styphnolobium japonicum ‘Pendula’ (L.) SchottDeciduous0.00337
8Prunus cerasifera ‘Atropurpurea’ Ehrh.Deciduous0.00363Aesculus chinensis BungeDeciduous0.00331
9Metasequoia glyptostroboides Hu & W.C. ChengEvergreen0.00355Cercis chinensis BungeDeciduous0.00322
10Styphnolobium japonicum ‘Pendula’ (L.) SchottDeciduous0.00349Catalpa ovata G. DonDeciduous0.00320
Table A4. Top-10 list of NO2 dry-deposition rates for urban greening tree species in Beijing and Shanghai (m s−1).
BeijingShanghai
PlantEvergreen/DeciduousVdgPlantEvergreen/DeciduousVdg
1Zelkova serrata (Thunb.) MakinoDeciduous0.00402Photinia serratifolia (Desf.) KalkmanEvergreen0.00409
2Populus tomentosa Carr.Deciduous0.00365Zelkova serrata (Thunb.) MakinoDeciduous0.00388
3Prunus triloba Lindl.Deciduous0.00360Melia azedarach L.Deciduous0.00328
4Rhus typhina L.Deciduous0.00356Prunus cerasifera ‘Atropurpurea’ Ehrh.Deciduous0.00323
5Fraxinus pennsylvanica MarshallDeciduous0.00354Metasequoia glyptostroboides Hu & W.C. ChengEvergreen0.00317
6Toona sinensis (A. Juss.) M. Roem.Deciduous0.00341Cryptomeria japonica var. sinensis (Sieb. & Zucc.) Dallim. & A.B. Jacks.Evergreen0.00317
7Melia azedarach L.Deciduous0.00341Styphnolobium japonicum ‘Pendula’ (L.) SchottDeciduous0.00312
8Prunus cerasifera ‘Atropurpurea’ Ehrh.Deciduous0.00336Aesculus chinensis BungeDeciduous0.00307
9Metasequoia glyptostroboides Hu & W.C. ChengEvergreen0.00329Cercis chinensis BungeDeciduous0.00299
10Styphnolobium japonicum ‘Pendula’ (L.) SchottDeciduous0.00324Catalpa ovata G. DonDeciduous0.00297
Table A5. Top 10 list of SO2 dry-deposition rates for urban-greening tree species in Beijing and Shanghai (m s−1).
BeijingShanghai
PlantEvergreen/DeciduousVdgPlantEvergreen/DeciduousVdg
1Zelkova serrata (Thunb.) MakinoDeciduous0.00345 Photinia serratifolia (Desf.) KalkmanEvergreen0.00346
2Populus tomentosa Carr.Deciduous0.00316 Zelkova serrata (Thunb.) MakinoDeciduous0.00330
3Prunus triloba Lindl.Deciduous0.00313 Melia azedarach L.Deciduous0.00285
4Rhus typhina L.Deciduous0.00309 Prunus cerasifera ‘Atropurpurea’ Ehrh.Deciduous0.00281
5Fraxinus pennsylvanica MarshallDeciduous0.00307 Metasequoia glyptostroboides Hu & W.C. ChengEvergreen0.00276
6Toona sinensis (A. Juss.) M. Roem.Deciduous0.00298 Cryptomeria japonica var. sinensis (Sieb. & Zucc.) Dallim. & A.B. Jacks.Evergreen0.00276
7Melia azedarach L.Deciduous0.00298 Styphnolobium japonicum ‘Pendula’ (L.) SchottDeciduous0.00273
8Prunus cerasifera ‘Atropurpurea’ Ehrh.Deciduous0.00294 Aesculus chinensis BungeDeciduous0.00269
9Metasequoia glyptostroboides Hu & W.C. ChengEvergreen0.00289 Cercis chinensis BungeDeciduous0.00263
10Styphnolobium japonicum ‘Pendula’ (L.) SchottDeciduous0.00284 Catalpa ovata G. DonDeciduous0.00262

References

  1. Chen, S.; Chen, B.; Feng, K.; Liu, Z.; Fromer, N.; Tan, X.; Alsaedi, A.; Hayat, T.; Weisz, H.; Schellnhuber, H.J.; et al. Physical and Virtual Carbon Metabolism of Global Cities. Nat. Commun. 2020, 11, 182. [Google Scholar] [CrossRef] [PubMed]
  2. Gately, C.K.; Hutyra, L.R.; Peterson, S.; Sue Wing, I. Urban Emissions Hotspots: Quantifying Vehicle Congestion and Air Pollution Using Mobile Phone GPS Data. Environ. Pollut. 2017, 229, 496–504. [Google Scholar] [CrossRef] [PubMed]
  3. Lelieveld, J.; Evans, J.S.; Fnais, M.; Giannadaki, D.; Pozzer, A. The Contribution of Outdoor Air Pollution Sources to Premature Mortality on a Global Scale. Nature 2015, 525, 367–371. [Google Scholar] [CrossRef] [PubMed]
  4. Suh, H.H.; Bahadori, T.; Vallarino, J.; Spengler, J.D. Criteria Air Pollutants and Toxic Air Pollutants. Environ. Health Perspect. 2000, 108, 625. [Google Scholar] [CrossRef] [PubMed]
  5. Fujii, S.; Cha, H.; Kagi, N.; Miyamura, H.; Kim, Y.-S. Effects on Air Pollutant Removal by Plant Absorption and Adsorption. Build. Environ. 2005, 40, 105–112. [Google Scholar] [CrossRef]
  6. Wang, B.; Song, Z.; Sun, L. A Review: Comparison of Multi-Air-Pollutant Removal by Advanced Oxidation Processes—Industrial Implementation for Catalytic Oxidation Processes. Chem. Eng. J. 2021, 409, 128136. [Google Scholar] [CrossRef]
  7. Barwise, Y.; Kumar, P. Designing Vegetation Barriers for Urban Air Pollution Abatement: A Practical Review for Appropriate Plant Species Selection. NPJ Clim. Atmos. Sci. 2020, 3, 12. [Google Scholar] [CrossRef]
  8. Young, R.F. Managing Municipal Green Space for Ecosystem Services. Urban For. Urban Green. 2010, 9, 313–321. [Google Scholar] [CrossRef]
  9. Janhäll, S. Review on Urban Vegetation and Particle Air Pollution—Deposition and Dispersion. Atmos. Environ. 2015, 105, 130–137. [Google Scholar] [CrossRef]
  10. Liu, J.; Zhu, L.; Wang, H.; Yang, Y.; Liu, J.; Qiu, D.; Ma, W.; Zhang, Z.; Liu, J. Dry Deposition of Particulate Matter at an Urban Forest, Wetland and Lake Surface in Beijing. Atmos. Environ. 2016, 125, 178–187. [Google Scholar] [CrossRef]
  11. Fitzky, A.C.; Sandén, H.; Karl, T.; Fares, S.; Calfapietra, C.; Grote, R.; Saunier, A.; Rewald, B. The Interplay Between Ozone and Urban Vegetation—BVOC Emissions, Ozone Deposition, and Tree Ecophysiology. Front. For. Glob. Change 2019, 2, 50. [Google Scholar] [CrossRef]
  12. Young, P.J.; Archibald, A.T.; Bowman, K.W.; Lamarque, J.-F.; Naik, V.; Stevenson, D.S.; Tilmes, S.; Voulgarakis, A.; Wild, O.; Bergmann, D.; et al. Pre-Industrial to End 21st Century Projections of Tropospheric Ozone from the Atmospheric Chemistry and Climate Model Intercomparison Project (ACCMIP). Atmos. Chem. Phys. 2013, 13, 2063–2090. [Google Scholar] [CrossRef]
  13. Lockwood, A.L.; Filley, T.R.; Rhodes, D.; Shepson, P.B. Foliar Uptake of Atmospheric Organic Nitrates. Geophys. Res. Lett. 2008, 35. [Google Scholar] [CrossRef]
  14. Shen, J.L.; Tang, A.H.; Liu, X.J.; Fangmeier, A.; Goulding, K.T.W.; Zhang, F.S. High Concentrations and Dry Deposition of Reactive Nitrogen Species at Two Sites in the North China Plain. Environ. Pollut. 2009, 157, 3106–3113. [Google Scholar] [CrossRef] [PubMed]
  15. Hardacre, C.; Wild, O.; Emberson, L. An Evaluation of Ozone Dry Deposition in Global Scale Chemistry Climate Models. Atmos. Chem. Phys. 2015, 15, 6419–6436. [Google Scholar] [CrossRef]
  16. Sakata, M.; Marumoto, K.; Narukawa, M.; Asakura, K. Regional Variations in Wet and Dry Deposition Fluxes of Trace Elements in Japan. Atmos. Environ. 2006, 40, 521–531. [Google Scholar] [CrossRef]
  17. Lovett, G.M.; Traynor, M.M.; Pouyat, R.V.; Carreiro, M.M.; Zhu, W.-X.; Baxter, J.W. Atmospheric Deposition to Oak Forests along an Urban−Rural Gradient. Environ. Sci. Technol. 2000, 34, 4294–4300. [Google Scholar] [CrossRef]
  18. Wu, Z.Y.; Zhang, L.; Wang, X.M.; Munger, J.W. A Modified Micrometeorological Gradient Method for Estimating O3 Dry Deposition over a Forest Canopy. Atmos. Chem. Phys. 2015, 15, 7487–7496. [Google Scholar] [CrossRef]
  19. Wesely, M. A Review of the Current Status of Knowledge on Dry Deposition. Atmos. Environ. 2000, 34, 2261–2282. [Google Scholar] [CrossRef]
  20. Mohan, M. Analysis of Various Schemes for the Estimation of Atmospheric Stability Classification. Atmos. Environ. 1998, 32, 3775–3781. [Google Scholar] [CrossRef]
  21. Nowak, D.J.; Hirabayashi, S.; Bodine, A.; Hoehn, R. Modeled PM2.5 Removal by Trees in Ten U.S. Cities and Associated Health Effects. Environ. Pollut. 2013, 178, 395–402. [Google Scholar] [CrossRef] [PubMed]
  22. Nowak, D.J.; Crane, D.E.; Stevens, J.C. Air Pollution Removal by Urban Trees and Shrubs in the United States. Urban For. Urban Green. 2006, 4, 115–123. [Google Scholar] [CrossRef]
  23. Huang, J.; Zheng, Y.; Xu, J.; Zhao, H.; Yuan, Y.; Chu, Z. O3 Dry Deposition Flux Observation and Soil Resistance Modeling over a Bare Soil in Nanjing Area in Autumn. Chin. J. Appl. Ecol. 2016, 27, 3196–3204. [Google Scholar] [CrossRef]
  24. Kang, M.; Cai, Y.; Wang, X.; Zha, T.; Zhu, L.; Niu, Y.; Zhou, J.; Zhang, Z. Control of Evapotranspiration by Surface Resistance and Environmental Factors in Poplar (Populus × euramericana) Plantations. Acta Ecol. Sin. 2016, 36, 5508–5518. [Google Scholar] [CrossRef]
  25. Lin, G.; Cai, X.; Hu, M.; Li, H. An Overview of Atmospheric Aerosol Dry Deposition. China Environ. Sci. 2018, 38, 3211–3220. [Google Scholar] [CrossRef]
  26. Li, S. Observational Modelling of Ozone Dry Deposition Mechanisms in Winter Wheat Fields. Master’s Thesis, Nanjing University of Information Engineering, Nanjing, China, 2015. Available online: https://kns.cnki.net/KCMS/detail/detail.aspx?dbcode=CMFD&dbname=CMFD201502&filename=1015566495.nh (accessed on 21 July 2024).
  27. Li, S.; Zheng, Y.; Wu, R.; Yin, J.; Xu, J.; Zhao, H.; Sun, J. Observation of Ozone Dry Deposition in the Field of Winter Wheat. Chin. J. Appl. Ecol. 2016, 27, 1811–1819. [Google Scholar] [CrossRef]
  28. Franklin, M.; Zeka, A.; Schwartz, J. Association between PM2.5 and All-Cause and Specific-Cause Mortality in 27 US Communities. J. Expo. Sci. Environ. Epidemiol. 2007, 17, 279–287. [Google Scholar] [CrossRef] [PubMed]
  29. Rushdi, A.I.; Al-Mutlaq, K.F.; Al-Otaibi, M.; El-Mubarak, A.H.; Simoneit, B.R.T. Air Quality and Elemental Enrichment Factors of Aerosol Particulate Matter in Riyadh City, Saudi Arabia. Arab. J. Geosci. 2013, 6, 585–599. [Google Scholar] [CrossRef]
  30. Xiao, Y.; Wang, S.; Li, N.; Xie, G.; Lu, C.; Zhang, B.; Zhang, C. Atmospheric PM2.5 Removal by Green Spaces in Beijing. Resour. Sci. 2015, 37, 1149–1155. [Google Scholar]
  31. Zhang, X.; Yin, S.; Jiang, C.; Xiong, F.; Zhu, P.; Zhou, P. PM2.5 Deposition Velocity and Impact Factors on Leaves of Typical Tree Species in Shanghai. J. East China Norm. Univ. (Nat. Sci.) 2016, 6, 27–37. [Google Scholar]
  32. Cao, J. Observation and Modelling of Ozone Dry Deposition Fluxes from Agricultural Fields in Nanjing Area. Master’s Thesis, Nanjing University of Information Engineering, Nanjing, China, 2019. Available online: https://kns.cnki.net/KCMS/detail/detail.aspx?dbcode=CMFD&dbname=CMFD201901&filename=1018130574.nh (accessed on 21 July 2024).
  33. Liu, J.; Shi, W.; Chen, P. Exploring Travel Patterns during the Holiday Season—A Case Study of Shenzhen Metro System During the Chinese Spring Festival. ISPRS Int. J. Geo-Inf. 2020, 9, 651. [Google Scholar] [CrossRef]
  34. Li, C. Pollution Characteristics of Sulfur Dioxide and Its Influencing Factors in Shanghai. Environ. Sanit. Eng. 2010, 18, 18–20. [Google Scholar]
  35. Meng, Z.; Xu, X.; Zhou, H.; Yu, X.; Dai, X.; Wang, J.; Lin, T.; Ying, Z.; Zhang, H.; Zhou, F.; et al. Distribution Characteristics of SO2, NO2 and NH3 in the Atmosphere in Different Regions of China and Influencing Factors. In Proceedings of the 26th Annual Meeting of the Chinese Meteorological Society: Atmospheric Composition, Weather, Climate and Environmental Changes, Hangzhou, China, 14 October 2009; Available online: https://kns.cnki.net/KCMS/detail/detail.aspx?dbcode=CPFD&dbname=CPFD0914&filename=ZGQX200910013015 (accessed on 16 May 2024).
  36. Yuan, Y. Observation and Modelling of Ozone Dry Deposition Fluxes in Bare Soil. Master’s Thesis, Nanjing University of Information Engineering, Nanjing, China, 2018. Available online: https://kns.cnki.net/KCMS/detail/detail.aspx?dbcode=CMFD&dbname=CMFD201801&filename=1017294988.nh (accessed on 21 July 2024).
  37. Huang, J. Simulation of Dry Deposition Characteristics and Non-Stomatal Resistance of Ozone in Winter Wheat Fields under Different Humidity Conditions. Master’s Thesis, Nanjing University of Information Engineering, Nanjing, China, 2021. [Google Scholar] [CrossRef]
  38. Shen, Y.; Zhang, L.; Fang, X.; Ji, H.; Li, X.; Zhao, Z. Spatiotemporal Patterns of Recent PM2.5 Concentrations over Typical Urban Agglomerations in China. Sci. Total Environ. 2019, 655, 13–26. [Google Scholar] [CrossRef] [PubMed]
  39. Xie, L.; Huang, F.; Gan, X.; Wen, X.; Huang, Y. Research Progress on the Purification Effects of Urban Forest Vegetation on Atmospheric Particulate Pollution Matter. For. Environ. Sci. 2017, 33, 96–103. [Google Scholar]
  40. Fu, Z.; Cheng, L.; Ye, X.; Ma, Z.; Wang, R.; Duan, Y.; Juntao, H.; Chen, J. Characteristics of Aerosol Chemistry and Acidity in Shanghai after PM2.5 Satisfied National Guideline: Insight into Future Emission Control. Sci. Total Environ. 2022, 827, 154319. [Google Scholar] [CrossRef] [PubMed]
  41. Han, L.; Zhou, W.; Li, W.; Qian, Y. Global Population Exposed to Fine Particulate Pollution by Population Increase and Pollution Expansion. Air Qual. Atmos. Health 2017, 10, 1221–1226. [Google Scholar] [CrossRef]
  42. Zhao, X. Dust Retention Capacity and Dry Deposition Rate of Ultrafine Particles in Different Green Plant Configuration Models. Master’s Thesis, Xi’an University of Architecture and Technology, Xi’an, China, 2023. [Google Scholar] [CrossRef]
  43. Chen, Y. Ion Chemical Signatures in Atmospheric Particulate Matter and Precipitation in Shanghai, China. Master’s Thesis, Shanghai Normal University, Shanghai, China, 2018. Available online: https://kns.cnki.net/KCMS/detail/detail.aspx?dbcode=CMFD&dbname=CMFD201801&filename=1017154204.nh (accessed on 21 July 2024).
  44. Chen, Z. Study on the Effect of Greening System on the Outdoor Thermal Environment of Building Clusters in Hot and Humid Areas. Ph.D. Thesis, South China University of Technology, Guangzhou, China, 2010. Available online: https://kns.cnki.net/KCMS/detail/detail.aspx?dbcode=CDFD&dbname=CDFD0911&filename=2010227776.nh (accessed on 21 July 2024).
  45. Cui, L.; Kang, X.; Zhao, X.; Li, W.; Ma, M.; Zhang, M.; Wei, Y. Spatiotemporal Variation in the Microclimate Effects of Typical Urban Wetland in Beijing. Chin. J. Ecol. 2015, 34, 212–218. [Google Scholar] [CrossRef]
  46. Churg, A.; Brauer, M.; Del Carmen Avila-Casado, M.; Fortoul, T.I.; Wright, J.L. Chronic Exposure to High Levels of Particulate Air Pollution and Small Airway Remodeling. Environ. Health Perspect. 2003, 111, 714–718. [Google Scholar] [CrossRef]
  47. Hoek, G.; Krishnan, R.M.; Beelen, R.; Peters, A.; Ostro, B.; Brunekreef, B.; Kaufman, J.D. Long-Term Air Pollution Exposure and Cardio-Respiratory Mortality: A Review. Environ. Health 2013, 12, 43. [Google Scholar] [CrossRef]
  48. Zhai, H. Study on the Impact of Land Use/Land Cover on Atmospheric Particulate Matter—A Case Study of Beijing-Tianjin-Hebei Region. Ph.D. Thesis, Shandong University of Science and Technology, Qingdao, China, 2021. [Google Scholar] [CrossRef]
  49. Liu, L. Eco-Efficiency Analysis of Urban Green Space Based on i-Tree Eco Model—A Case Study of Typical Urban Green Space in Zhengzhou City. Master’s Thesis, North China University of Water Resources and Hydropower, Zhengzhou, China, 2023. [Google Scholar] [CrossRef]
Figure 1. Map of the study areas.
Forests 15 01286 g001
Figure 2. Experimental validation of the dry-deposition model adopted in this study. (A) Experimental determination of ozone dry-deposition flux. (B) Modeling of ozone dry-deposition flux. (C) Correlation between measured and simulated ozone dry-deposition flux.
Forests 15 01286 g002
Figure 3. Seasonal variation in dry-deposition velocities (Vd) of (A) O3, (B) CO, (C) NO2, (D) SO2, (E) PM2.5, (F) PM10 in two cities.
Forests 15 01286 g003
Figure 4. Annual variation in aerodynamic drag (Ra, s m⁻1) in Beijing and Shanghai.
Forests 15 01286 g004
Figure 5. Annual variation in boundary-layer-transport resistance (Rb, s m−1) of the gas pollutants O3, CO, NO2, and SO2 in (A) Beijing and (B) Shanghai.
Forests 15 01286 g005
Figure 6. Annual variation in canopy resistance (Rc, s m−1) of gas pollutants O3, CO, NO2, and SO2 in (A) Beijing and (B) Shanghai.
Forests 15 01286 g006
Figure 7. Annual variation in quasi-laminar-flow-sub-layer resistance (Rp, s m−1) of gas pollutants with PM2.5 and PM10 in Beijing and Shanghai.
Forests 15 01286 g007
Figure 8. Annual variation in (A) O3, (B) CO, (C) NO2, (D) SO2, (E) PM2.5, (F) PM10 concentration in two cities.
Forests 15 01286 g008
Figure 9. Annual variation in dry-deposition fluxes of (A) O3, (B) CO, (C) NO2, (D) SO2, (E) PM2.5, (F) PM10 in two cities.
Forests 15 01286 g009
Figure 10. Seasonal variation in percentage of air-quality improvement (%) of (A) O3, (B) CO, (C) NO2, (D) SO2, (E) PM2.5, (F) PM10 through dry deposition in two cities.
Forests 15 01286 g010
Figure 11. The annual changes in the removal of O3, CO, NO2, SO2, PM2.5, and PM10 in Beijing (A) and Shanghai (B).
Forests 15 01286 g011
Figure 12. The annual changes in the removal values of O3, CO, NO2, SO2, PM2.5, and PM10 in Beijing (A) and Shanghai (B).
Forests 15 01286 g012
Disclaimer/Publisher’s Note: The statements, opinions and data contained in all publications are solely those of the individual author(s) and contributor(s) and not of MDPI and/or the editor(s). MDPI and/or the editor(s) disclaim responsibility for any injury to people or property resulting from any ideas, methods, instructions or products referred to in the content.

