Article

Spatial Pattern of Forest Age in China Estimated by the Fusion of Multiscale Information

1
State Key Laboratory of Earth Surface Processes and Resource Ecology, Beijing Normal University, Beijing 100875, China
2
Key Laboratory of Environmental Change and Natural Disaster of Ministry of Education, Faculty of Geographical Science, Beijing Normal University, Beijing 100875, China
*
Author to whom correspondence should be addressed.
Forests 2024, 15(8), 1290; https://doi.org/10.3390/f15081290
Submission received: 6 June 2024 / Revised: 21 July 2024 / Accepted: 22 July 2024 / Published: 24 July 2024

Abstract

:
Forest age is one of most important biological factors that determines the magnitude of vegetation carbon sequestration. A spatially explicit forest age dataset is crucial for forest carbon dynamics modeling at the regional scale. However, owing to the high spatial heterogeneity in forest age, accurate high-resolution forest age data are still lacking, which causes uncertainty in carbon sink potential prediction. In this study, we obtained a 1 km resolution forest map based on the fusion of multiscale age information, i.e., the ninth (2014–2018) forest inventory statistics of China, with high accuracy at the province scale, and a field-observed dataset covering 6779 sites, with high accuracy at the site scale. Specifically, we first constructed a random forest (RF) model based on field-observed data. Utilizing this model, we then generated a spatially explicit forest age map with a 1 km resolution (random forest age map, RF map) using remotely sensed data such as tree height, elevation, meteorology, and forest distribution. This was then used as the basis for downscaling the provincial-scale forest inventory statistics of the forest ages and retrieving constrained maps of forest age (forest inventory constrained age maps, FIC map), which exhibit high statistical accuracy at both the province scale and site scale. The main results included the following: (1) RF can be used to estimate the site-scale forest age accurately (R2 = 0.89) and has the potential to predict the spatial pattern of forest age. However, (2) owing to the impacts of sampling error (e.g., field-observed sites are usually located in areas exhibiting relatively favorable environmental conditions) and the spatial mismatch among different datasets, the regional-scale forest age predicted by the RF model could be overestimated by 71.6%. (3) The results of the downscaling of the inventory statistics indicate that the average age of forests in China is 35.1 years (standard deviation of 21.9 years), with high spatial heterogeneity. Specifically, forests are older in mountainous and hilly areas, such as northeast, southwest, and northwest China, than in southern China. The spatially explicit dataset of the forest age retrieved in this study encompasses synthesized multiscale forest age information and is valuable for the research community in assessing the carbon sink potential and modeling carbon dynamics.

1. Introduction

Forests are an important component of terrestrial ecosystems, storing 33%–46% of terrestrial carbon [1,2], and forest carbon exchange plays an important role in the global carbon balance. During the 1990–2009 period, the global forest cumulative carbon sink reached approximately 116 Pg C, which could offset 90% of the cumulative fossil emissions (126 Pg C) [3]. Obviously, forest carbon sinks are an effective way to offset fossil fuel emissions and could greatly mitigate climate change caused by elevated CO2 concentrations [4]. The State of the World’s Forests 2022 report published by the Food and Agriculture Organization (FAO) forecasts that maintaining forest areas between 2020 and 2050 could achieve the target of reducing emissions by 3.6 billion tons of CO2 equivalent annually, contributing a 14% reduction toward keeping global warming below 1.5 °C. However, there is very high uncertainty in the estimation of forest carbon stocks; therefore, how to accurately predict and model forest carbon sinks has become the main issue of widespread concern in the academic community.
Forest carbon sinks are influenced by a variety of biotic and abiotic factors, such as forest origin, forest type, forest age, geography, climate, and soil [5]. As a very important internal biological factor, forest age affects aboveground biomass, primary productivity, litter decomposition, etc., and plays a significant role in determining carbon stocks and sinks in forest ecosystems [6,7,8,9]. In general, aboveground biomass and primary productivity increase with forest age, reaching a maximum when the canopy is closed after adulthood, and thereafter decrease, resulting in an S-shaped growth curve [10,11]. The balance between the photosynthesis and respiration of trees also fundamentally changes with age [12], causing a notable variation in the forest biomass carbon density among different stand ages, and it has been shown that the average biomass carbon density of old-growth forests can reach 3.7 times that of young-growth forests [13]. In mature forest scenario-based research, it has also been determined that the forest carbon density first increases but then decreases with increasing forest age [14,15]. Model parameterization based on mature forests commonly leads to the underestimation of forest carbon sequestration, especially in regions with many plantations and young forests. Moreover, owing to the lack of spatial distribution data on forest age, this variable has not been given enough attention in most previous studies, which has resulted in increased uncertainty in model estimation and difficulty in accurately predicting the future carbon sequestration potential of forests [7,15,16,17].
Although the importance of stand age for forest carbon sinks and trends has been widely recognized, accurately reflecting the spatial distribution pattern of forest age is an enormous challenge [18,19,20,21]. Stand age generally refers to the average age of a forest stand and is also often considered the time experienced since the last strong disturbance. Thus, stand age is affected not only by natural factors such as site conditions, climate, fire, and pests but also by human factors such as logging and thinning [10,22]. Traditional stand age determination is focused mainly on individual stands, and the direct determination method is mainly used. Although this method is considered the most accurate forest age determination method, obtaining the forest age at large spatial scales is not only difficult but also time-consuming [23]. Although satellite remote sensing can be employed to dynamically monitor forest changes, such as the forest tree height estimated from LiDAR remote sensing [11,16,24], the NDVI retrieved from optical remote sensing [25], land cover change [26], and the phenology [23], which can be used to estimate forest age, the spatial distributions of different forest age datasets greatly vary, and uncertainty is high because of differences in data quality levels or sampling errors across observation sites. Although forest subcompartment data from the Forest Management Inventory can provide forest age information, the corresponding update frequency is low, and data acquisition is difficult. The commonly used forest age inventory statistics are often based on the summary results of administrative regions with low spatial resolutions (e.g., province-scale data), making it difficult to accurately describe their spatial pattern [27]. How to combine forest inventory statistics with remotely sensed information to reliably estimate forest age is currently a hot topic in the academic community [25]. With the wide application of machine learning methods, combining these methods with remotely sensed information and forest inventory statistics is a feasible development direction [11,28], which could help to obtain forest age datasets that are consistent with forest inventory statistics in terms of quantity and exhibit a reasonable spatial distribution pattern.
At present, forest age estimation in China is mainly based on the relationship between tree height and forest age [11,16,29]. In most forest ecosystems, there is a good correlation between forest age and forest structure, and among them, the vertical structure information of forest tree height is usually considered the most closely related variable to forest age [30,31]. It has been found that there exists a suitable correlation between forest age and tree height, which suggests that tree height is a very important explanatory variable in statistical models for estimating forest age [32]. In previous studies, forest origin was not considered when estimating forest age or only the age of plantations was estimated without obtaining a forest age distribution map covering all of China. China has been committed to afforestation since the 1970s, and the area of planted forests is the largest in the world. There are large differences in forest age between planted and natural forests. If the origin of forests is not considered, the age of forests will be greatly over- or underestimated, which will lead to the under- or overestimation, respectively, of carbon sinks in China. In addition, China’s forests also have characteristics such as a low forest age and low carbon density, which implies that there is a significant potential for increasing carbon sinks in the future [19]. Therefore, to accurately map forest age in China and effectively evaluate forest carbon sink potential to support the realization of China’s carbon peaking and carbon neutrality targets, it is necessary to consider both tree height and stand characteristics when estimating forest age in China by fusing forest inventory and remotely sensed information with a machine learning method.
In this study, we aim to develop a forest age estimation method that integrates forest inventory data with multivariate data. This method integrates the quantitative accuracy of forest inventory age statistical information at the provincial scale with the spatial continuity advantage of spatially continuous remote sensing information. Through downscaling methods, we obtain spatially distributed products of China’s forest age that are reasonable in terms of both quantitative and spatial distribution patterns. This included (1) the random forest (RF) model being used as a basic tool to obtain forest age products with an initial resolution of 1 km in China. This product exhibits favorable spatial continuity and can reflect the spatial change in stand age in China but possible statistical discrepancies due to sampling errors caused by the nonuniformity of observation sites. (2) This was then used as the basis for downscaling the provincial forest ages estimated from the ninth (2014–2018) forest inventory statistics, and optimized maps of forest age that exhibited satisfactory spatial continuity and high accuracy at both the provincial and national scales were retrieved. (3) In addition, we compared the optimized forest age map with other forest age datasets (i.e., the MPI-BGC dataset).

2. Data and Methods

2.1. Data

(1)
Field observation data
A total of 6779 publicly available field data, including forest type and plot conditions, were collected, with ages ranging from 1 to 360 years (Figure 1). The recorded information for each sample plot included six variables: longitude, latitude, average annual temperature, annual precipitation, forest age, and tree height and altitude [33,34]. These data were collected from stands that were typical of the area and did not experience disturbances, such as pruning, thinning, fire, and other factors. There are missing values in the collected station data of the mean annual precipitation (MAP) and mean annual temperature (MAT), and some values are extracted from remotely sensed data; however, the datasets used are different. To ensure data uniformity, the MAP and MAT data were uniformly extracted across all stations from 1970 to 2014 in China on the basis of the MAT and MAP at the 1 km scale [35].
(2)
National forest inventory data
The forest resource inventory data (FID) were obtained from the China Forest Resources Report 2014–2018 published by the China Forestry Publishing House [36]. The forest inventory is a national survey of forest resources conducted every five years in China since 1973. The FID includes forest type, forest area, stock volume, etc. However, there is no specific age of stand, and it is only divided into five grades: young forest, middle-aged forest, near-mature forest, mature forest, and overmature forest (Table S1). According to the tree species (group) classification table in the Technical Regulations for Continuous Forest Inventory, the dominant tree species in each province in the arbor forest statistical table of the forest inventory data were divided into coniferous forests, broad-leaved forests, and coniferous and broad-leaved mixed forests. Then, the average age of the three major forest types (Table S2) and the average age in each province were calculated by the method of Dai Ming [25], and the method is described in the Supplementary Materials.
(3)
Remotely sensed tree height data
The remotely sensed tree height data used in this paper originated from the forest height map of China with a 30 m resolution generated by Liu et al. by fusing the Global Ecosystem Dynamics Investigation (GEDI), Ice, Cloud, and land Elevation Satellite-2 (ICESat-2) Advanced Topographic Laser Altimeter System (ATLAS) and Sentinel-2 images, and the data were interpolated by a neural network (NNGI) [37]. The application of these data greatly reduces the saturation effect when using optical images, and regression models are used to determine forest canopy height; when interpolation is used, this generates more continuous and complete tree height spatial data, which increases the accuracy of the data [31,37].
(4)
Forest distribution data
The forest distribution data of China were obtained from the 8th forest inventory data of China from 2009 to 2013. ArcGIS 10.2 and ENVI 5.3 software were used to process the forest distribution map of the 8th forest inventory data, including digitalization, spatial registration, reprojection, and resampling steps. Finally, a forest type map of China with a spatial resolution of 1 km was obtained. In these data, China’s forests were divided into forest stands, economic forests, and bamboo forests. On the basis of their origin, forest stands were divided into planted and natural forests, including three forest types: coniferous forests, mixed coniferous and broad-leaved forests, and broad-leaved forests. The forest types covered in this study included only stands, excluding economic forests and bamboo forests. In these data, coniferous forests account for 35.4%, while broad-leaved forests account for 59.5%. According to the results of the 9th National Forest Inventory, the total area of arbor forest in China is 180 million hectares, with the area proportions of the three forest types being 34.4%, 57.7%, and 7.9%, respectively. When the two sets of data are compared, the difference in the results is not significant.
(5)
Meteorological data and elevation data
Climate factors are important in the process of forest growth and determine the type and growth rate of forests on a regional scale [38,39]. The meteorological data originated from the monthly climate dataset of China from 1901 to 2017 and had a spatial resolution of 1 km [40,41]. According to monthly data processing, the MAT and MAP from 1970 to 2014 were obtained. This dataset was generated by the delta spatial downscaling method using the meteorological dataset with a spatial resolution of 0.5° released by the CRU and the climate dataset released by WorldClim. The reliability of the data was also verified on the basis of data from independent meteorological observation stations across China, and the accuracy of the data was suitably guaranteed [35]. Influenced by the monsoon climate, China exhibits significant spatial heterogeneity in temperature and precipitation (Figure S1). The elevation data were retrieved from the Chinese 1 km resolution digital elevation model (DEM) data provided by Big Earth Data for the Three Poles, which can reflect local topographic features [42]. Table 1 provides detailed information about the data.

2.2. Methods

2.2.1. Observation Site-Based Random Forest Model

The RF algorithm is a nonlinear statistical ensemble method that is classified as a machine learning method [43]. In ecological studies, collinearity exists among many variables, and multiple factors may act on a single variable. In such cases, RF is an excellent choice, as it is insensitive to multicollinearity and can effectively predict the effects of up to several thousand explanatory variables without being prone to overfitting the data [44,45,46]. RF often performs well even in comparisons of multiple machine learning models [31].
In most forest ecosystems, forest age is highly correlated with forest structure. Among them, tree height, which contains information on the vertical structure of forests, is commonly considered the most closely related variable to stand age [30]. It has been widely shown that forest age and tree height are highly correlated, with correlation coefficients up to 0.752 [32]. Therefore, tree height is essential for estimating forest age.
Moreover, forests are the products of environmental co-action. To estimate forest age, we considered the correlations between forest age and six variables: tree height, forest type, forest origin, MAT, MAE, and elevation. Using the randomForest package in R 4.1.2, we constructed a random forest regression model that incorporates these variables to predict forest age (age ~ H, forest type, forest origin, MAT, MAP, and elevation). To evaluate the model’s performance in predicting forest age, two key metrics were employed: root mean square error (RMSE) and mean absolute error (MAE).
R M S E = 1 m i m ( y i y ^ i ) 2
M A E = 1 m i = 1 m | y i y ^ i |
where RMSE is the root mean square error, MAE is the mean absolute error, m is the number of data points, yi is the true value, and y ^ i is the predicted value.

2.2.2. Downscaling

On the basis of RF and processed remote sensing data maps, we retrieved an initial spatially explicit map of forest age (RF age map) at a 1 km resolution. Because of the spatial scale difference between the tree height and environmental data observed at the station and the tree height and environmental data retrieved via remote sensing, there is a possible deviation in the absolute magnitude of forest age at the grid scale, but the relative age between the different grid points is comparable. In order to ensure more accurate data in terms of quantity, we used the RF age map as a basis and applied Formula (3) for downscaling the FID at the provincial scale to obtain a 1 km resolution forest age product, which is not only consistent with the forest inventory statistics (mean value) but also exhibits consistency in the spatial distribution of the relative magnitude of forest age derived from remote sensing inversion. Figure 2 shows a detailed framework for the forest age estimation proposed in this study.
a g e x ( p t r ) = m e a n p t + ( A g e x ( p t r ) A g e m i n ( p t r ) A g e m a x ( p t r ) A g e m i n ( p t r ) × 2 1 ) × r a g
where x denotes a pixel; meanpt denotes the average age of forest type t in province p calculated from the FID; Agex(ptr) denotes forest age in a given pixel predicted by the random forest model of forest type t in province p; Agemin(ptr) and Agemax(ptr) denote the minimum and maximum ages, respectively, predicted by the random forest model for forest type t in province p; and rag is half of the age range of each forest age group (rag = 0.5 × (maximum forest age-minimum forest age). When the average forest age of the age group is older than 10 years (meanpt > 10), a constant value of 10 is adopted according to the Technical Regulations for Continuous Forest Inventories. When the average forest age of the age group is younger than 10 years (0 < meanpt < 10), rag is set to a constant value of meanpt-1 (assuming that the minimum forest age of young forests is 1).

3. Results

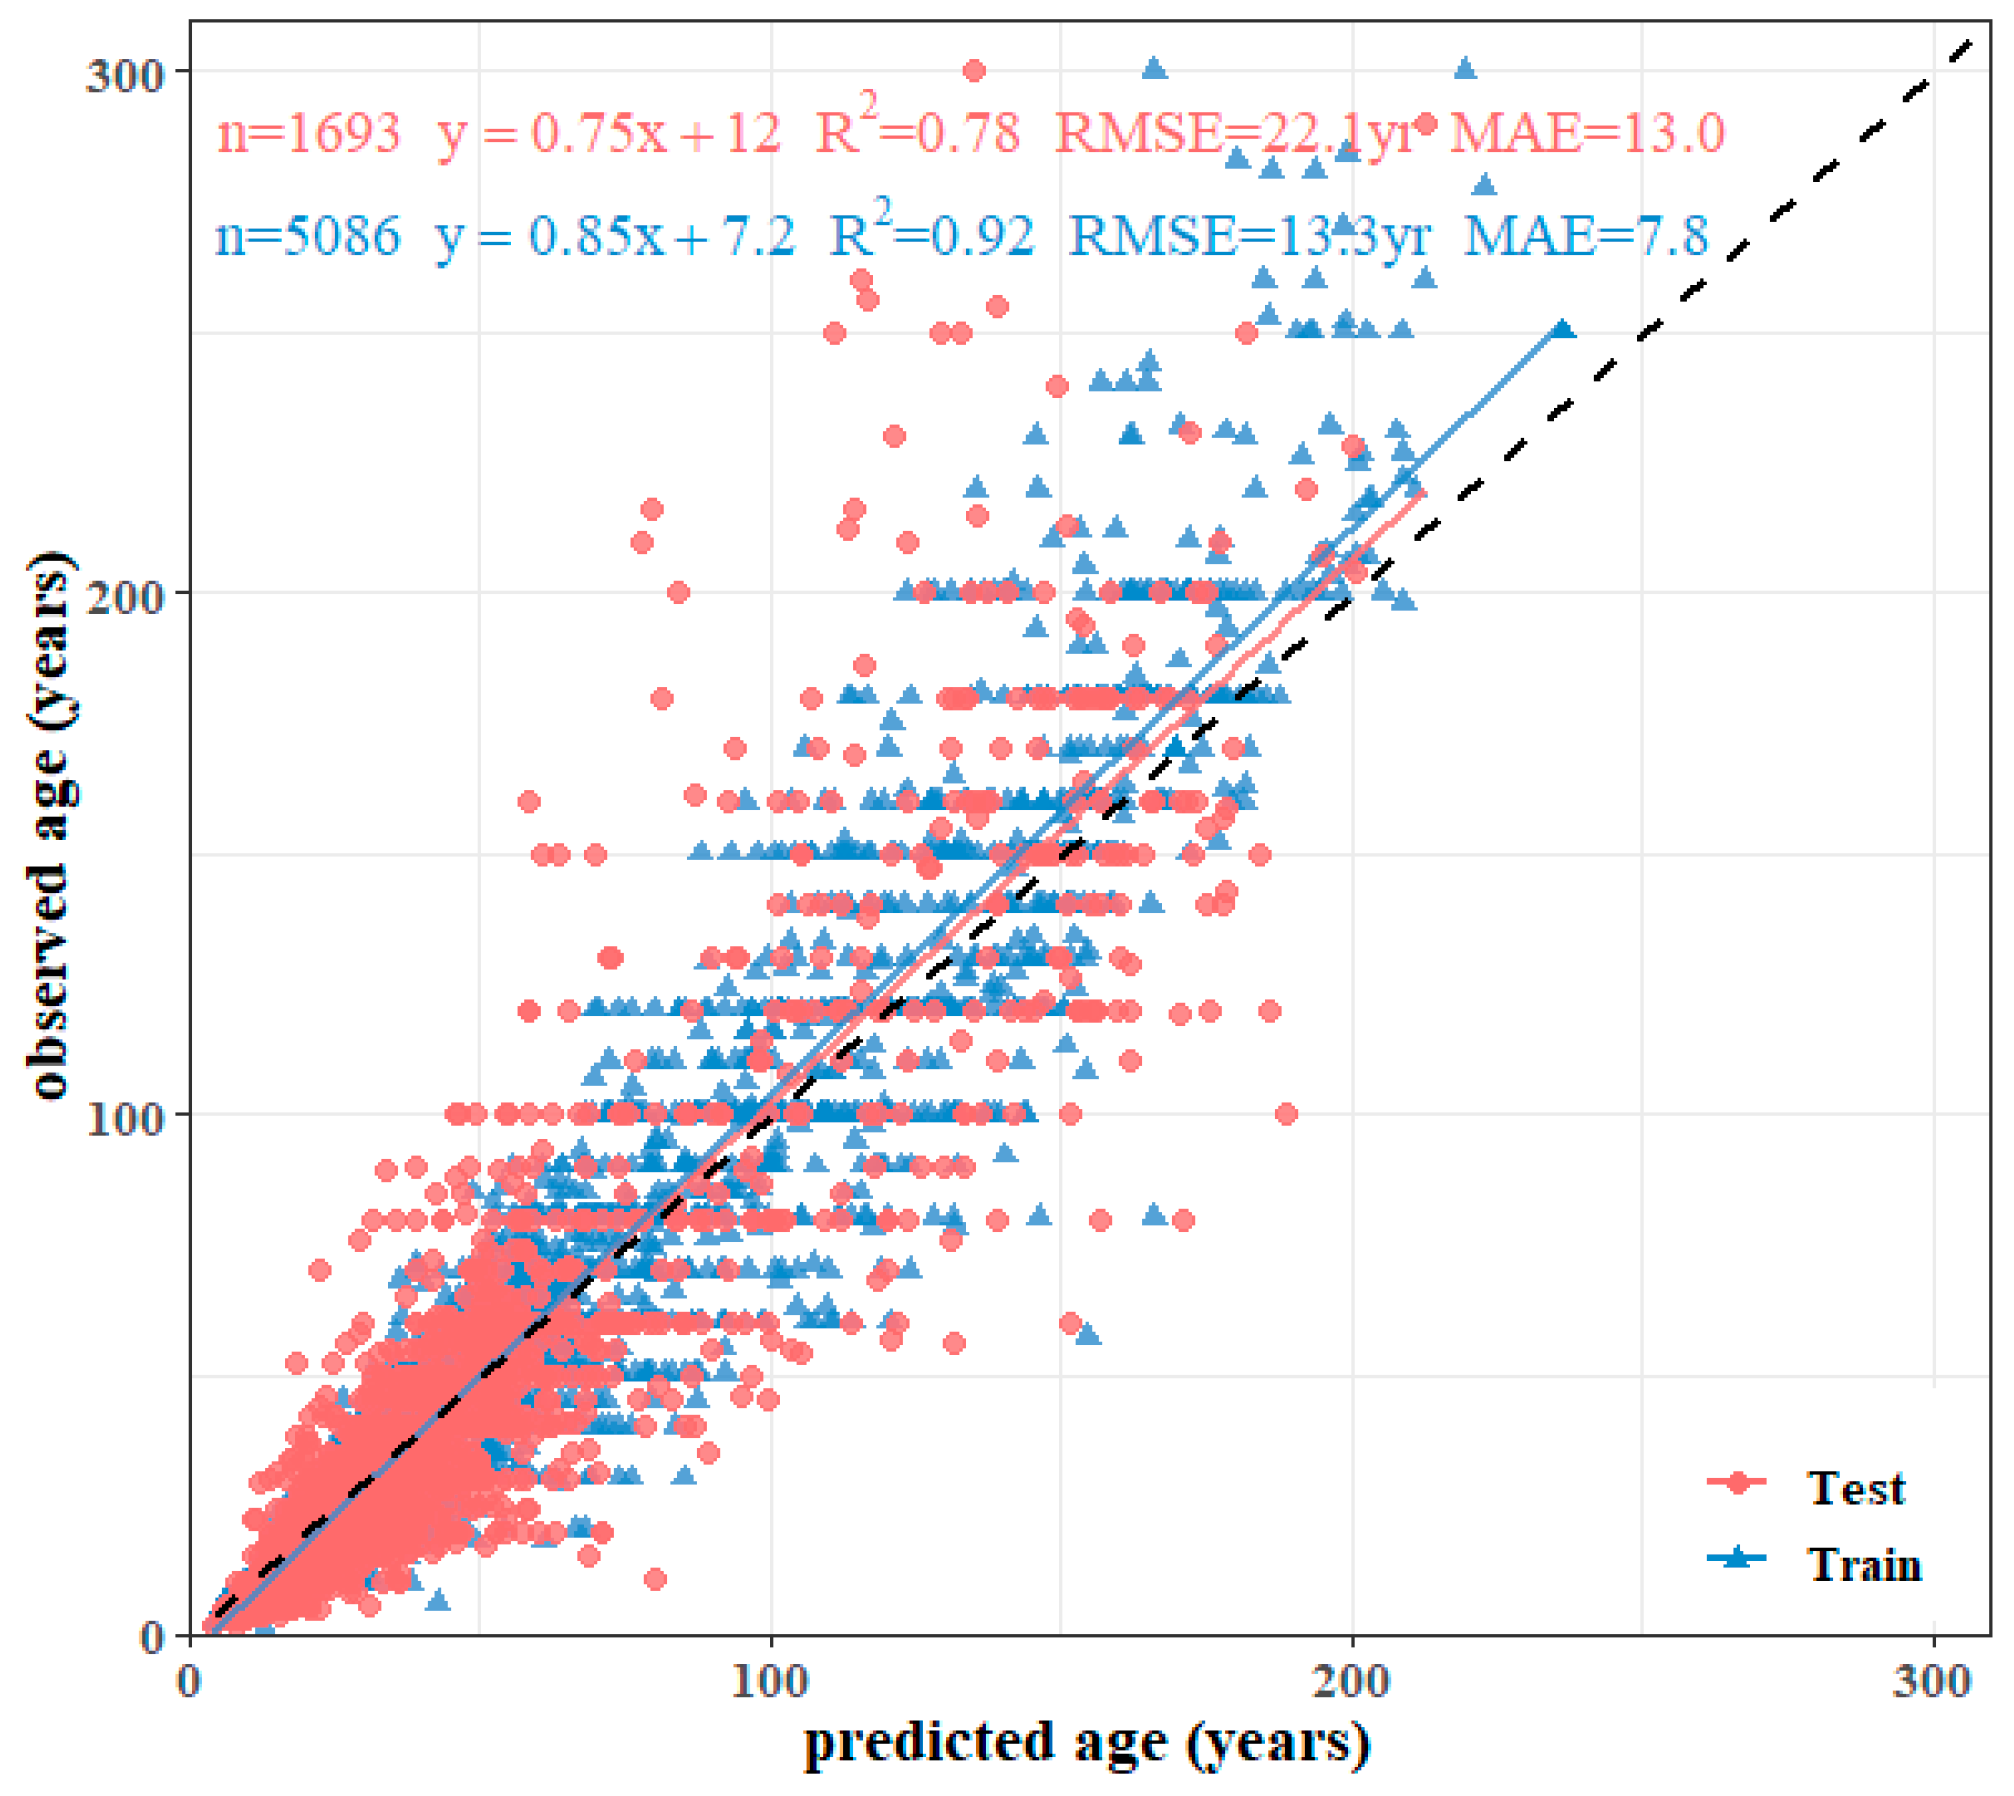
3.1. Random Forest Prediction of Forest Age in China

The random forest regression model exhibited good performance in modeling forest age, with R2 values of 0.92 and 0.78 for the training and testing sets, respectively. Overall, the model explained 85% of the total variation in forest age, with an MAE value less than 13.0 (Figure 3). These results indicated that RF could be used to estimate forest age in China favorably at the site scale.
On the basis of RF, we generated a spatially explicit forest age map for China (Figure 4). The map shows that forest age clearly exhibits spatial heterogeneity, with older forest age in the northeastern and southwestern regions and younger forest ages in the southeast hilly area. The forests in mountainous areas are generally older, which agrees with the distribution pattern of forest age in China. In the China forest age map predicted by RF, forests aged between 20 and 80 years old dominate in China, accounting for 78% of the total forest area. Forests 0–20 years and over 120 years in age each account for less than 4% of the total forests (Figure 5).
Although this method has good prediction accuracy at the site scale, the forest age obtained via RF is older than that based on the FID at the provincial scale (Figure 6). In comparison, the degree of overestimation of forest age in Guangxi is the most, reaching 156.45%, while Shaanxi Province exhibits the best prediction effect, where the estimated forest age is merely 11.78% older than the actual. On a national scale, the RF forest age is older than that based on the FID, and the predicted frequency of young-age forests (0–40 years old) is much younger than that on the basis of the FID, whereas the frequency of old-age forests (>40 years old) is older than that based on the FID (Figure 5). The possible reasons for these results could be that the sample site survey was conducted with a preference for well-grown stands and the influence of extremely high values at the various sites, which could lead to the overestimation of stand age. Therefore, the RF prediction results cannot be adopted as final results, which were used in this study as the basis for downscaling the forest age of provincial FID to obtain reliable forest age data for China at the regional scale (i.e., at the provincial and national scales).

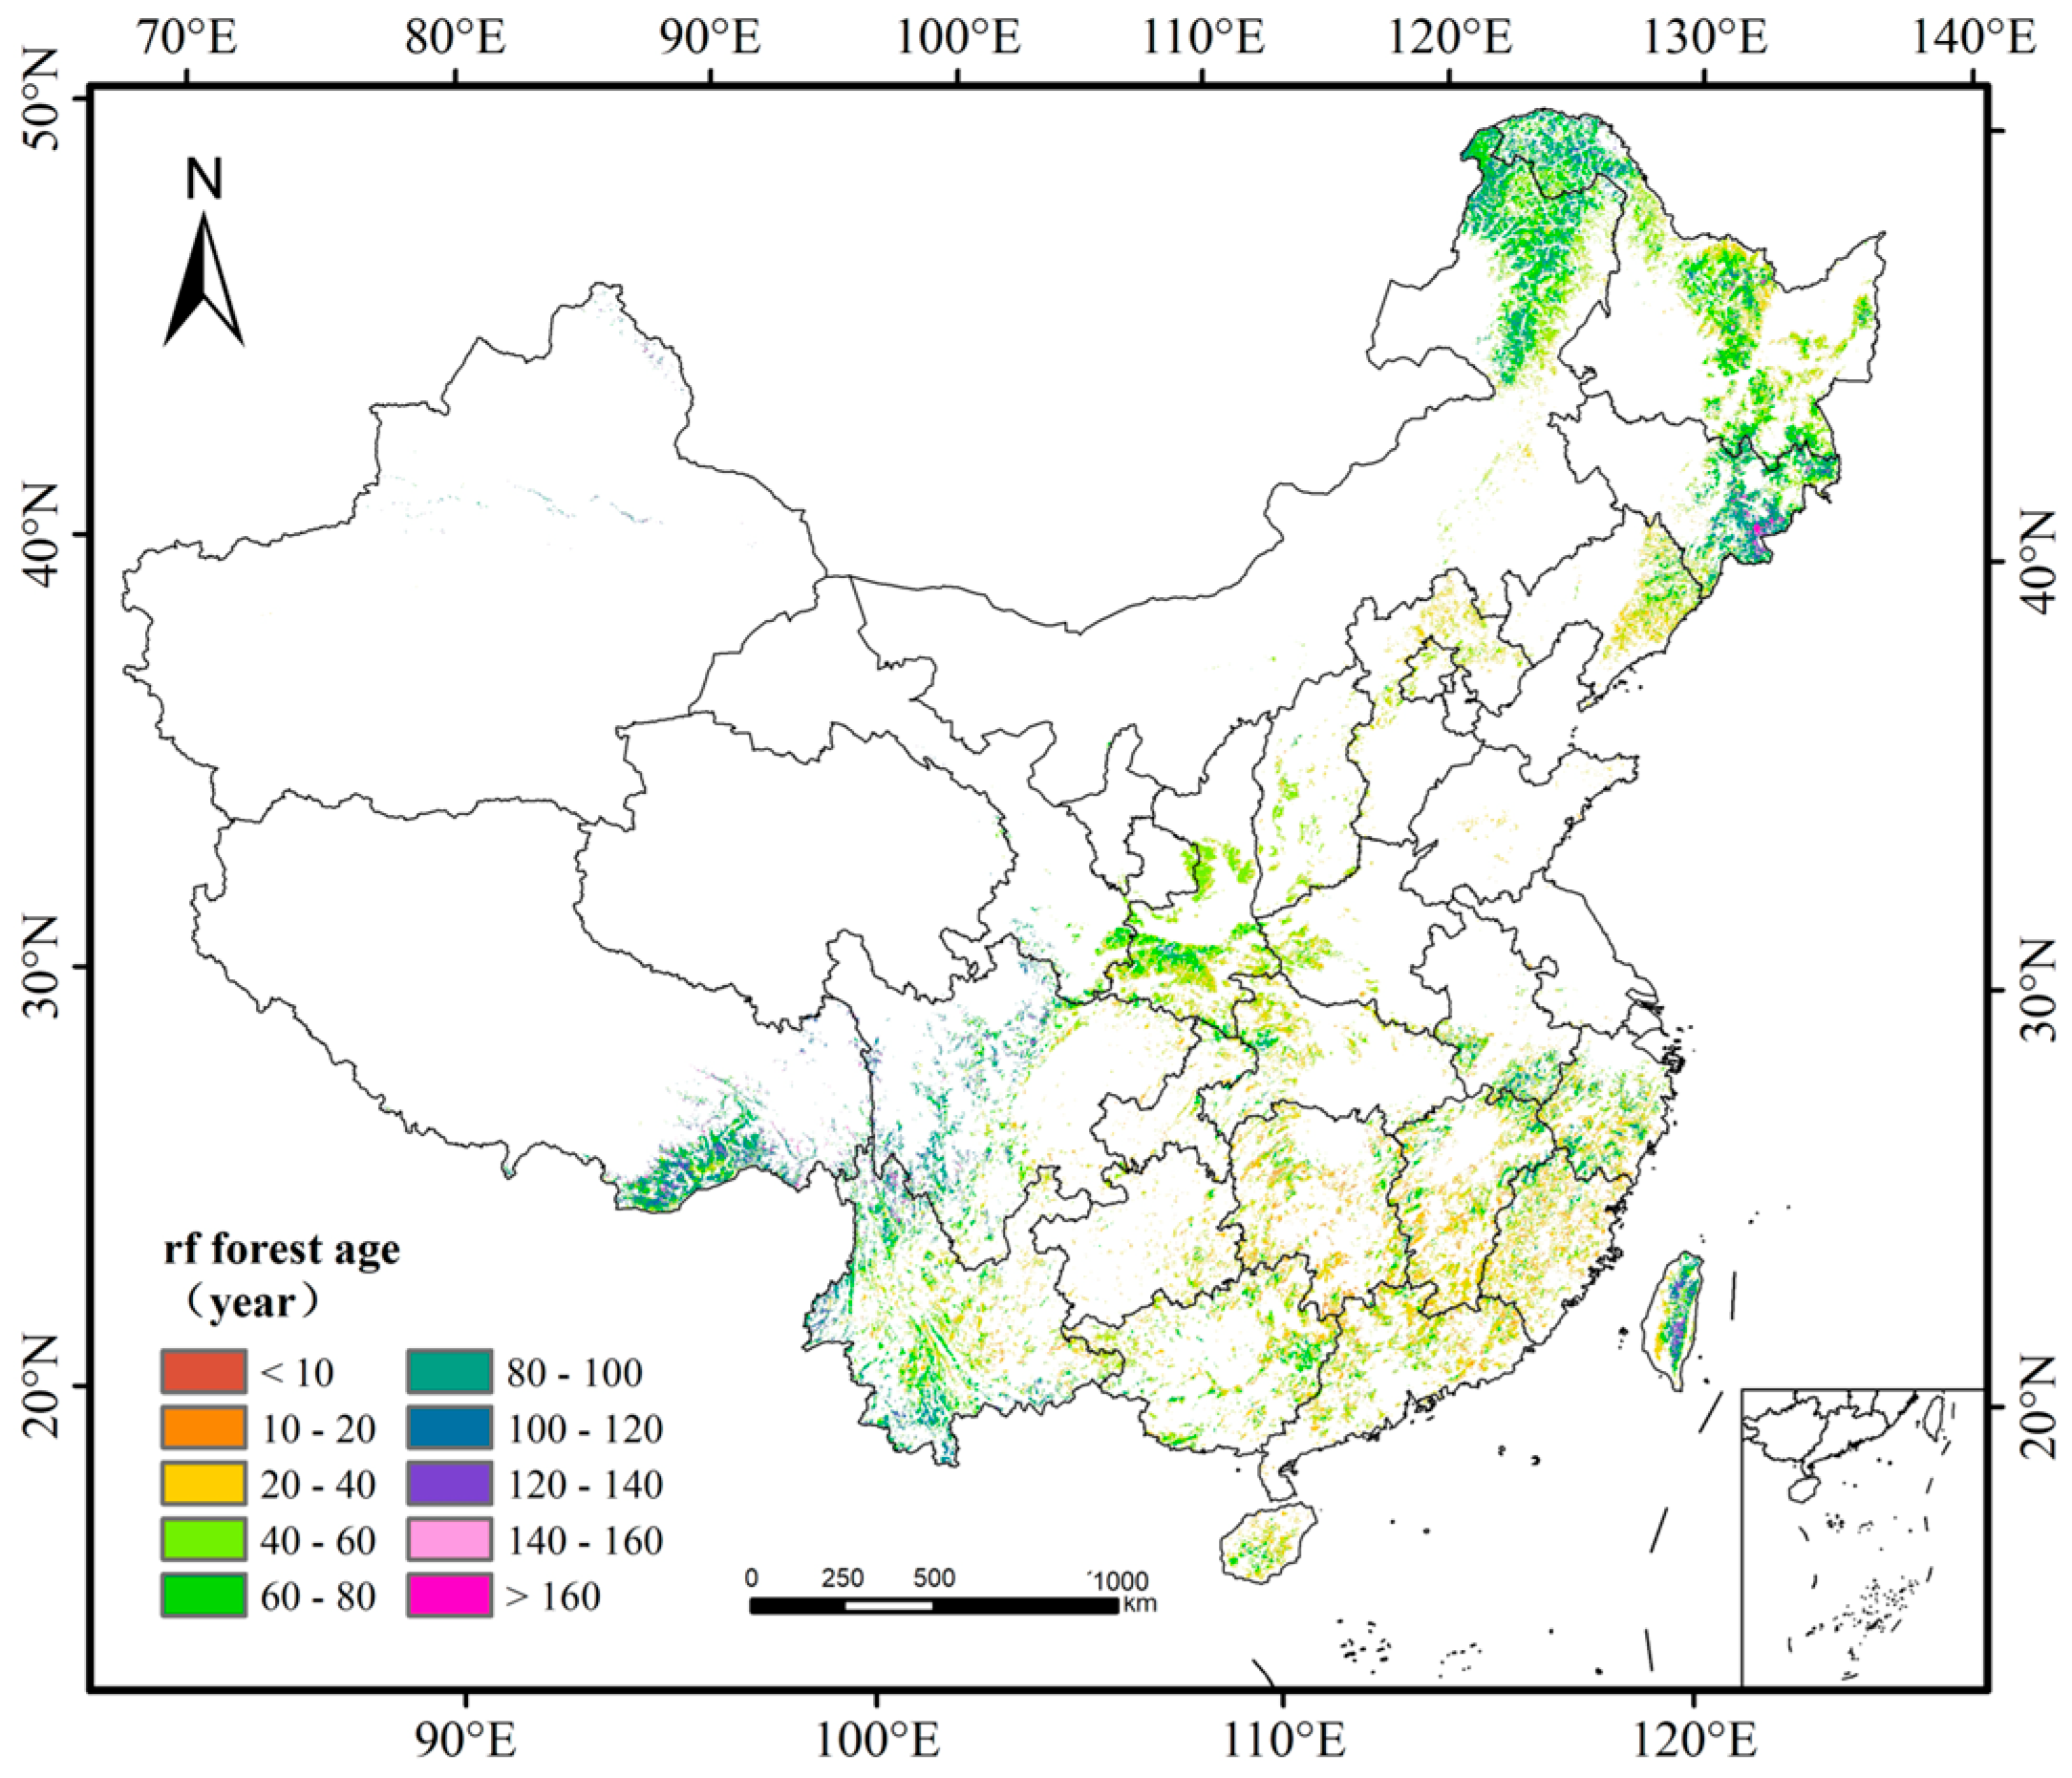
3.2. Forest Age Maps after Forest Inventory Downscaling

We downscaled the provincial FID based on the RF age map to obtain an FIC age map (Figure 7). The overall forest age of Chinese forests decreased from 57.4 (standard deviation of 28.5 years) to 35.1 years (standard deviation of 21.9 years) (Figure 5). The average ages of China’s coniferous forests, broad-leaved forests, and mixed coniferous and broad-leaved forests were 38.6 years, 32.8 years, and 37.6 years, respectively. The decrease in forest age over 60 years and the increase in forest age ranging from 0 to 60 years led to an increase in the proportion of middle-aged and young forests and a decrease in the proportion of old forests. Forests younger than 60 years account for 86.9% of the total national forests, among which forests aged 20–40 years account for the highest proportion, at 37.0%. These forests are distributed mainly in eastern and southern-central China, which is a densely populated region where forests are mostly planted, exhibiting a short growth period. Forests older than 60 years are distributed mainly in Heilongjiang, Jilin, Liaoning, Inner Mongolia, Shaanxi, Sichuan, and Tibet. These areas encompass the main mountain ranges in China, which are far from human settlements and are less disturbed. Trees in these areas grow and die naturally, and they encompass abundant age classes and are relatively old.
At the provincial scale, the average forest age in the six provinces of Tianjin, Guangxi, Guangdong, Hunan, Hubei, and Guizhou is less than 20 years, whereas in three provinces of Qinghai, Tibet, and Xinjiang, the average forest age is more than 50 years. Among these provinces, Xinjiang Province has the oldest forest, reaching 94.3 years, whereas Tianjin Province has the youngest forest, at 17.3 years. Moreover, 50% of the provinces had an average forest age between 20 and 50 years.
The forest ages obtained from RF are generally older than those of the FID, and the FIC forest ages are similar to the FID results. However, the results for two provinces, namely Qinghai Province and Xinjiang Uygur Autonomous Region, are relatively poor, with ages that are 12 years older and 31 years younger, respectively, than the FID estimates, but the forest area in these two provinces is small, and the error can be accepted (Figure 8).

4. Discussion

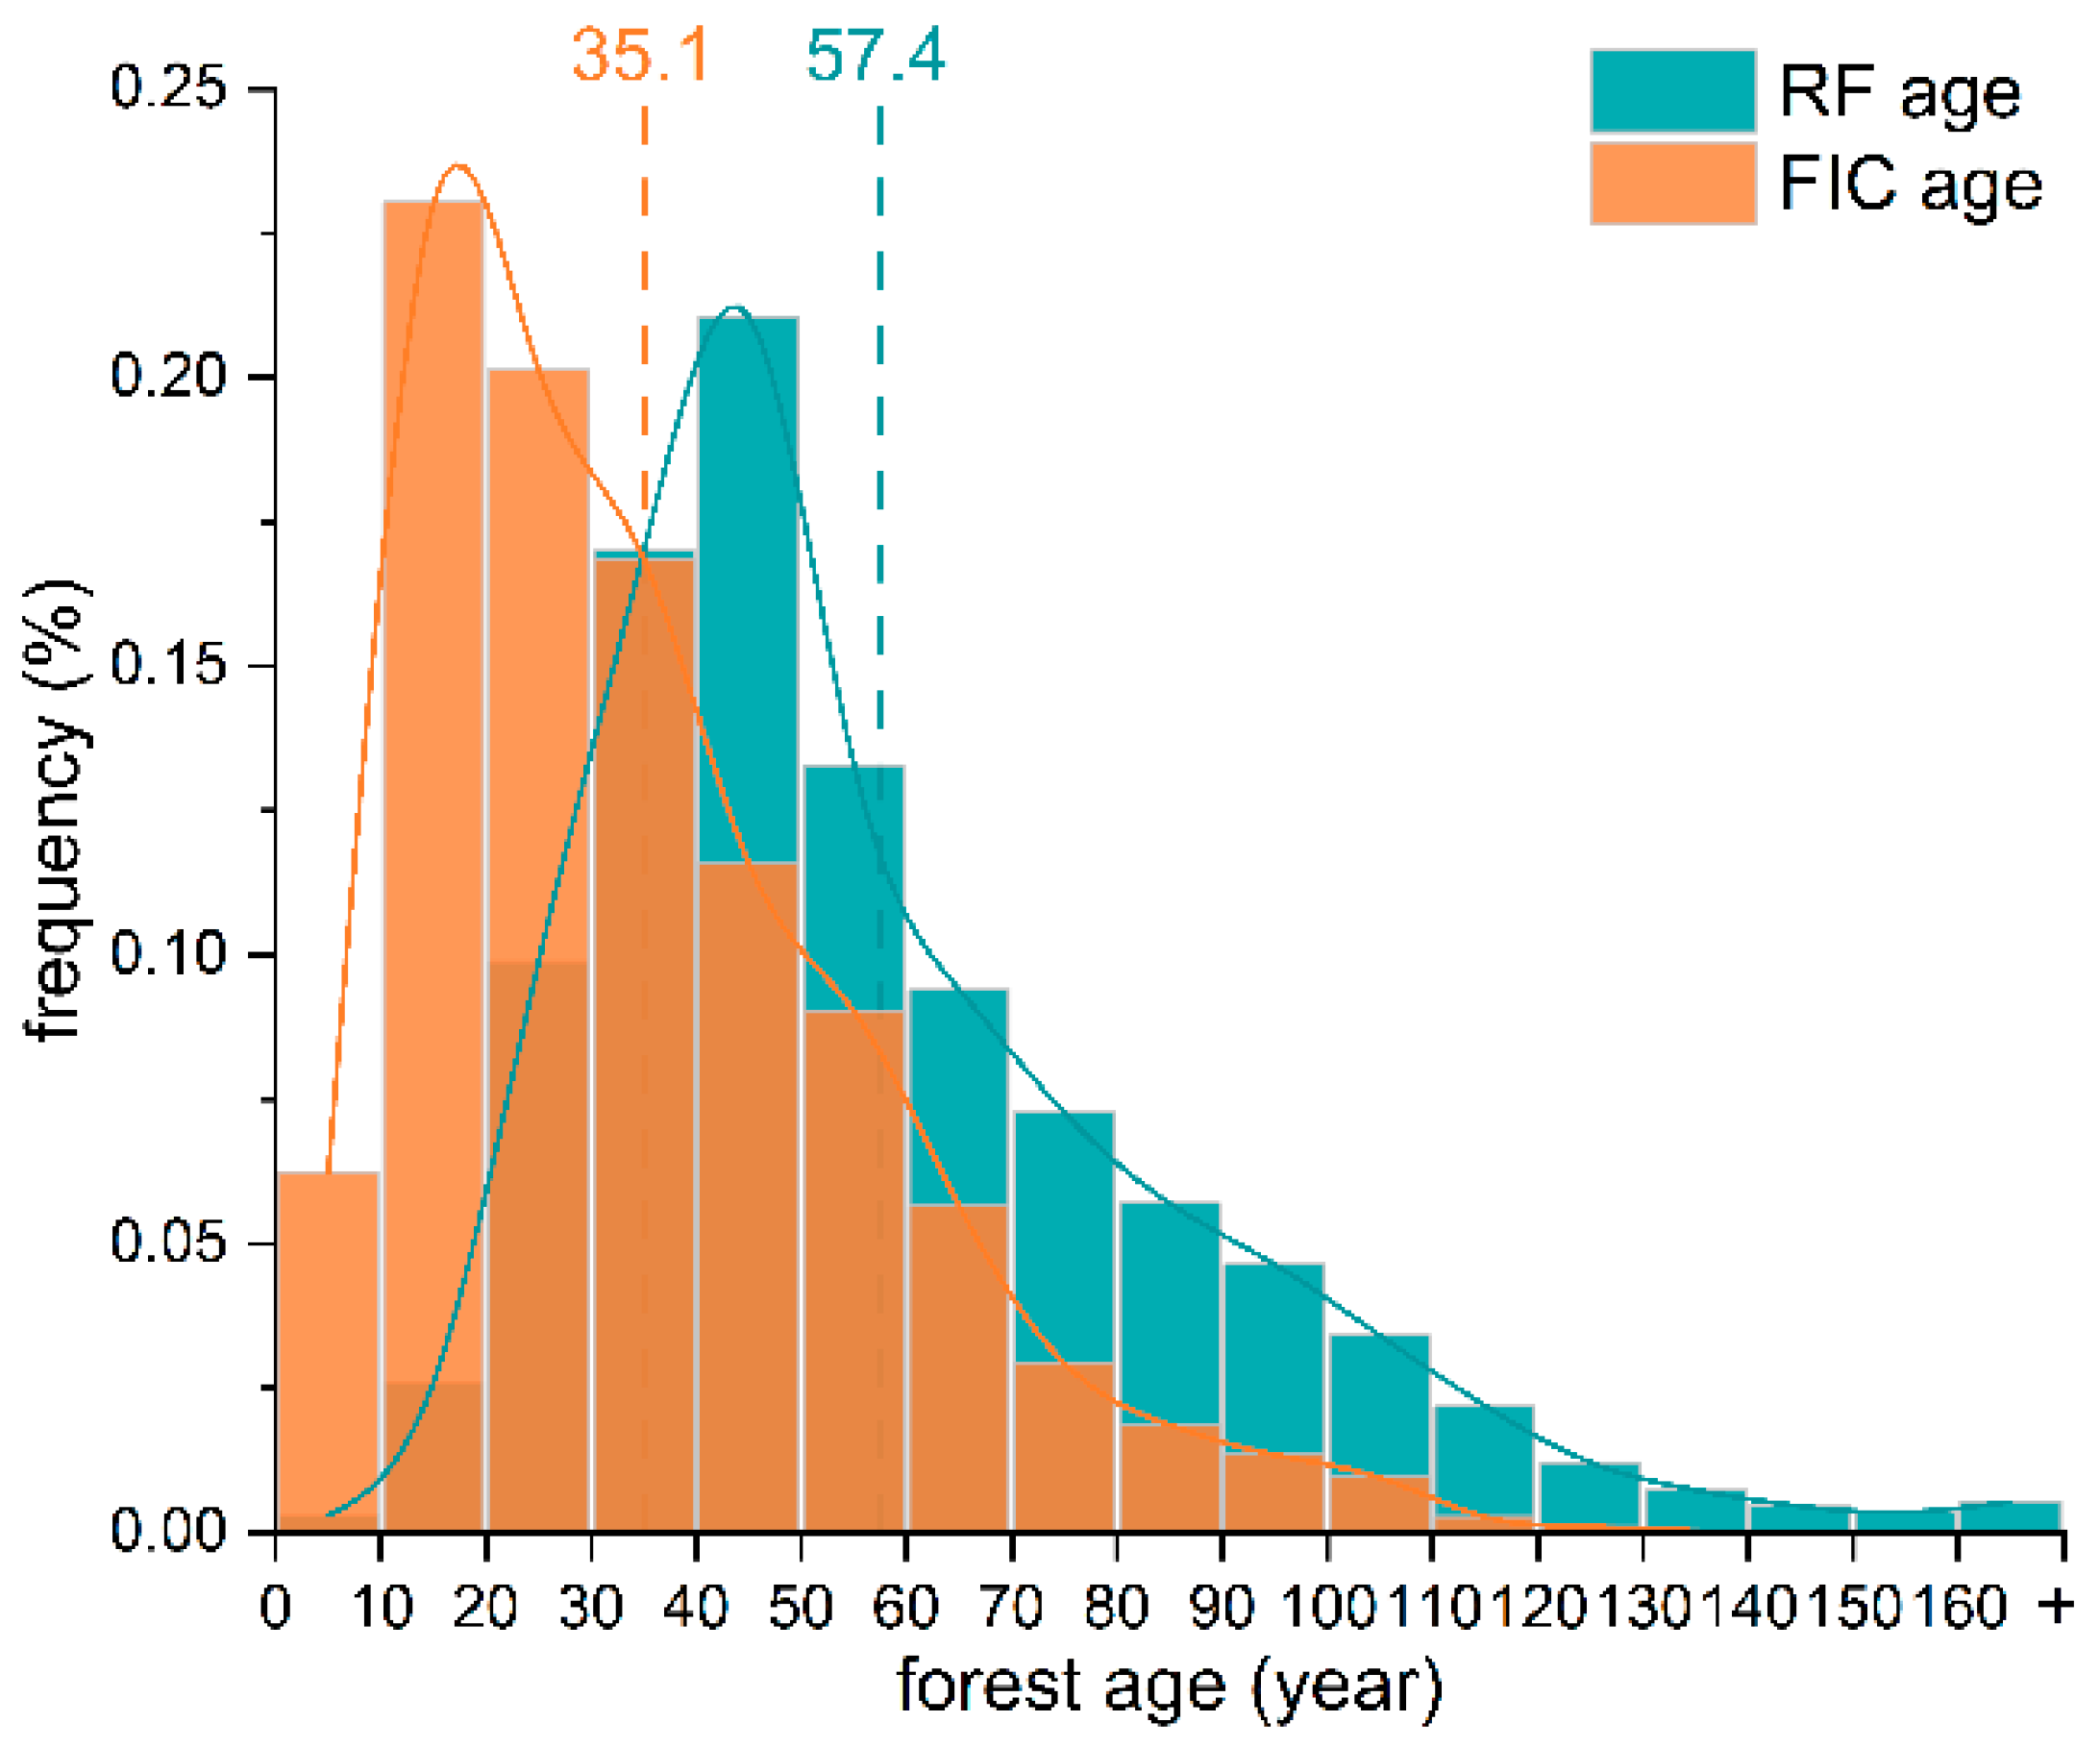
4.1. Differences between the Different Forest Age Datasets

In this study, a reliable 1 km resolution forest age dataset was obtained on the basis of a logical framework of data fusion and downscaling, and we compared the obtained dataset with the RF age dataset and the MPI-BGC dataset [47] at the provincial and regional scales. It was found that the FIC forest age dataset yielded better results than the other two datasets at the provincial scale, with reductions in prediction errors of 71.65% and 55.95%, respectively. It is noteworthy that although RF could estimate forest age well at the site scale, it suffers the potential problem of high systematic deviation at the large regional scale (e.g., at the provincial and national scales). This is because it was easily influenced by the sampling point data, so it produced regional estimation deviation [48]. The MPI-BGC forest age dataset, which is a global-scale forest age dataset, provided an acceptable forest age prediction effect in China. Specifically, for 21 out of 30 provinces, the prediction errors are less than 10 years compared to FID. However, a significant prediction error is also found in the Xinjiang Uygur Autonomous Region, where the predicted age is approximately double the actual age.
At the regional scale, the FIC forest age dataset was also the best, with R2 and RMSE values of 0.98 and 1.7 years, respectively. Further analysis reveals that the forest ages in the northern and southwestern parts were overestimated by 3.1 and 2.1 years, respectively, compared to the FID estimates. Conversely, the forest age in the northwestern part was 1.7 years younger than the FID age, whereas the forest ages in the other three regions differed by no more than 0.5 years from the FID age.
In contrast, the RF age dataset performed the worst among the three datasets because it only integrated the remote sensing and ground station data without calibration based on the FID. The MPI-BGC dataset fused with the FID performed well in the China forest age estimation, but it does not consider tree height, which is highly correlated with forest age, so the estimation effect was also inferior to that of our FIC forest age dataset.
We also compared the RF forest age dataset and the MPI-BGC forest age dataset with the FIC forest age dataset in space (Figure 9). It was found that the forest ages predicted by RF were younger in Shanxi and Jiangsu Provinces than the FIC ages were, and the RF prediction values for the other 28 provinces were mostly older, especially in regions with older forests, such as the Changbai Mountain region in Jilin Province and the Hengduan Mountains region in southwest China.
A comparison between our optimized forest age (i.e., FIC age) dataset and the MPI-BGC forest age dataset revealed that the use of the latter mainly caused overestimation. The areas with forest age overestimation were distributed mainly in the northeastern and southwestern regions, whereas the areas with forest age underestimation were distributed mainly in the southeastern region. According to the percentage deviation of forest age, the age based on the MPI-BGC dataset was notably older for young forests, and the age in some pixels was even overestimated by more than a factor of 10 (Figure S3). This suggests that the forest carbon sink potential in China could be underestimated because the older the forest is, the lower its carbon sequestration capacity is [9,49]. Moreover, the FIC map was obtained by downscaling the FID, which suitably agreed with the FID forest age, while the MPI-BGC forest age deviated from the FID age, with nine provinces of the observed provincial age difference of more than 10 years (Figure S4). This discrepancy may be related not only to the variables selected for prediction but also to the FIC forest age dataset used, which provides a high spatial accuracy by fusing tree height data and the FID at the provincial scale.
Compared with existing forest age products, it is observed that many of them rely solely on remote sensing and field observation data, without incorporating forest inventory statistics as constraints, which leads to the inaccurate estimation of forest age at the national scale [11,16]. Therefore, it is imperative to employ FID as constraints for forest age estimation.

4.2. Analysis of the RF Parameters

Six variables were selected for estimating forest stand age in RF. The importance of the six variables decreased in the following order: tree height, MAT, forest type, forest origin, elevation, and MAP. Consistent with the findings of Zhang et al. and Chen et.al. [11,50], our results show that tree height is a key factor of the forest age model, and the importance and degree of influence on the estimation results were much greater than those of the other variables (Figure S2).
This is because canopy height is not only related to the growth period of trees but also the result of a combination of temperature, precipitation, and other environmental variables [31,51]. Canopy height already contains some environmental information. Many researchers and scholars have estimated forest age by extracting the time of disturbance (e.g., fire, logging) occurrence [50,52,53], but in fact, the change in canopy height also reveals a partial degree of information about such disturbances [54]. Therefore, it is effective to choose canopy height as a variable to predict forest age. Additionally, different forest attributes (e.g., forest type) also determine the age of forests, indicating the need to consider not only environmental variables but also forest attributes when estimating stand age.

4.3. Uncertainty and Prospects

Sufficient and representative site data are needed to estimate the distribution pattern of forest age by fusing remotely sensed data and site data via the RF model. Although most site data collected in this study pertain to forests younger than 200 years, there are also sites with forest ages greater than 200 years, constituting 1.26% of the total. However, the research scale of this study is 1 km, which is much larger than that of the 10 m × 10 m and 20 m × 20 m rectangular sample plots commonly used in investigations. With respect to forests that are constantly updated with successional characteristics, the overall age of forest stands is typically not very old. Therefore, sites without old forest ages do not greatly influence the spatial distribution trend in forest age. Moreover, the collected site data cover all age groups, which can suitably reflect the relationships between forest age and tree height and other related variables.
The FID reflects growth in Chinese forests through the investigation of fixed sample plots, but unfortunately, it is regrettable that only aggregated data of provincial administrative regions and forest age are classified into five classes, namely young, middle-aged, near-mature, mature, and overmature forests, with no specific forest age. The median age of each age class was used as the forest age of the considered period. However, this may be subject to uncertainty because the forest age of a given period is not necessarily uniformly distributed. With respect to age estimation for overmature forests, we only added an age class value to the minimum age, which may lead to the underestimation of the age of older forests. Fortunately, the area of old-growth forests in China constitutes a relatively small proportion, with overmature forests accounting for merely 6.4% of the total [36].
There is uncertainty in the forest area, especially the area of planted forests [55]. Since the 1970s, China has been committed to afforestation activities, and the area of planted forests has continuously increased. According to the ninth National Forest Resources Inventory of China, the areas of planted and natural forests are 57 million hectares and 123 million hectares, accounting for 31.8% and 68.2%, respectively, of the total forest area of China. However, the forest base map used only contains a plantation area of 25 million hectares, accounting for 11.7% of the total forest area (Figure S5). The age of planted forests in China is 13.9 years, while the age of natural forests is 37.5 years. Notably, there is a large difference between these two types of forests. Treating planted forests as natural forests could lead to forest age overestimation; for example, the overestimation of the age of planted forests was very obvious with the MPI-BGC forest age dataset, with 60.0% of planted forests overestimated by more than 50%, which is approximately twice as high as that of the natural forests (34.0%). The age of planted forests is also influenced by human activities, and the difference in age between managed and unmanaged planted forests can range from 5 to 10 years [29]. This fact further complicates the accurate assessment of the ecological characteristics of planted forests. Many studies have estimated carbon sinks in Chinese forests based on the relationship between stand age and biomass [19,21], and the overestimation of stand age in planted forests will undoubtedly challenge the accuracy of these estimates, mainly leading to the underestimation of carbon sinks. Therefore, when using the forest age map, it should be used in conjunction with suitable datasets to avoid inaccurate results due to information mismatch [16].
Chinese planted forests are currently dominated by young and middle-aged forests [36], which provide a larger carbon sink potential than older forests. However, most of the existing models do not consider the potential impact of forest age on carbon sinks [17]. In terms of model development, the parameterization of process models is usually based on mature forests [14], while few models have focused sufficiently on the role of forest age and succession stage when estimating forest carbon dynamics, making it difficult for these models to accurately reproduce dynamic trajectories of changes in carbon cycle components, such as biomass, or other age-related changes in forest age [56]. Therefore, the spatial distribution map of forest age based on RF and FID could provide an important basis for the accurate prediction of carbon sinks in China. In the future, more detailed forest vegetation type maps and additional factors affecting forest age should be considered to obtain more detailed and accurate forest age distribution maps.

5. Conclusions

In this study, we retrieved a high-accuracy and 1 km resolution forest map of China by fusing multiscale age information. RF can effectively reveal the intrinsic relationships between variables such as forest age and tree height in China (R2 = 0.78,RMSE = 13.0). However, there is a certain degree of overestimation, primarily due to the significant spatial variability in forest age and the tendency to select well-growing stands during plot sampling. Therefore, large-scale statistical corrections are necessary when simulating spatial patterns. According to the FIC map, it is highly consistent with FID at the provincial scale and national scale. The average age of forests in China is 35.1 years, with high spatial heterogeneity. Forest age is generally older in the northeastern and southwestern mountain regions than in the southern and eastern regions. Overall, the forest age distribution map is important for estimating the current status and potential of forest carbon sinks in China.

Supplementary Materials

The following supporting information can be downloaded at: https://www.mdpi.com/article/10.3390/f15081290/s1, Figure S1: Temperature and precipitation in China, 1970–2014; Figure S2: Importance of random forest variables; Figure S3: Percentage deviation between MPI-BGC age and FIC age; Figure S4: Differences between the different forest age datasets at the provincial scale; Figure S5: Proportion of artificial and natural forests in different provinces; Table S1: Criteria for Surveying Dominant Tree Species (Groups) by Age Class; Table S2: The average age of different forest age classes of dominant tree species; Table S3: Year of Forest Inventory in Each Province.

Author Contributions

Conceptualization, T.Z.; Methodology, Y.X. and J.Z. (Jingyu Zeng); Software, Y.Z. and Q.L.; Validation, X.L.; Formal analysis, Y.X., Q.L. and J.Z. (Jingzhou Zhang); Investigation, Y.Z. and J.Z. (Jingzhou Zhang); Resources, J.Z. (Jingyu Zeng), H.L. and X.L.; Data curation, Y.X. and H.L.; Writing—original draft, Y.X.; Writing—review & editing, T.Z. and J.Z. (Jingyu Zeng); Visualization, Y.X.; Supervision, T.Z.; Project administration, T.Z.; Funding acquisition, T.Z. All authors have read and agreed to the published version of the manuscript.

Funding

This study was supported by the National Natural Science Foundation of China (42277206) and the second Tibetan Plateau Scientific Expedition and Research Program (2019QZKK0405).

Data Availability Statement

The data underlying this article will be shared on reasonable request to the corresponding author.

Acknowledgments

We thank all the data providers for the field observations and explicit environmental dataset.

Conflicts of Interest

The authors declare no conflict of interest.

References

  1. Bonan, G.B. Forests and Climate Change: Forcings, Feedbacks, and the Climate Benefits of Forests. Science 2008, 320, 1444–1449. [Google Scholar] [CrossRef] [PubMed]
  2. Liu, W.; Wang, X.; Lu, F.; Ouyang, Z. Regional and global estimates of carbon stocks and carbon sequestration capacity in forest ecosystems: A review. Chin. J. Appl. Ecol. 2015, 26, 2881–2890. [Google Scholar] [CrossRef]
  3. Pan, Y.; Birdsey, R.A.; Fang, J.; Houghton, R.; Kauppi, P.E.; Kurz, W.A.; Phillips, O.L.; Shvidenko, A.; Lewis, S.L.; Canadell, J.G.; et al. A Large and Persistent Carbon Sink in the World’s Forests. Science 2011, 333, 988–993. [Google Scholar] [CrossRef] [PubMed]
  4. Yu, G.; Chen, Z.; Piao, S.; Peng, C.; Ciais, P.; Wang, Q.; Li, X.; Zhu, X. High Carbon Dioxide Uptake by Subtropical Forest Ecosystems in the East Asian Monsoon Region. Proc. Natl. Acad. Sci. USA 2014, 111, 4910–4915. [Google Scholar] [CrossRef] [PubMed]
  5. Xu, L.; Shi, Y.; Fang, H.; Zhou, G.; Xu, X.; Zhou, Y.; Tao, J.; Ji, B.; Xu, J.; Li, C.; et al. Vegetation Carbon Stocks Driven by Canopy Density and Forest Age in Subtropical Forest Ecosystems. Sci. Total Environ. 2018, 631–632, 619–626. [Google Scholar] [CrossRef] [PubMed]
  6. Pan, Y.; Luo, T.; Birdsey, R.; Hom, J.; Melillo, J. New Estimates of Carbon Storage and Sequestration in China’s Forests: Effects of Age-Class and Method On Inventory-Based Carbon Estimation. Clim. Chang. 2004, 67, 211–236. [Google Scholar] [CrossRef]
  7. Liu, Y.; Yu, G.; Wang, Q.; Zhang, Y. How Temperature, Precipitation and Stand Age Control the Biomass Carbon Density of Global Mature Forests: Controls on Biomass Carbon Density of Global Mature Forests. Glob. Ecol. Biogeogr. 2014, 23, 323–333. [Google Scholar] [CrossRef]
  8. Tang, X.; Li, H.; Ma, M.; Yao, L.; Peichl, M.; Arain, A.; Xu, X.; Goulden, M. How Do Disturbances and Climate Effects on Carbon and Water Fluxes Differ between Multi-Aged and Even-Aged Coniferous Forests? Sci. Total Environ. 2017, 599–600, 1583–1597. [Google Scholar] [CrossRef]
  9. Chen, Z.; Yu, G.; Wang, Q. Effects of Climate and Forest Age on the Ecosystem Carbon Exchange of Afforestation. J. For. Res. 2020, 31, 365–374. [Google Scholar] [CrossRef]
  10. Pan, Y.; Chen, J.M.; Birdsey, R.; McCullough, K.; He, L.; Deng, F. Age Structure and Disturbance Legacy of North American Forests. Biogeosciences 2011, 8, 715–732. [Google Scholar] [CrossRef]
  11. Zhang, Y.; Yao, Y.; Wang, X.; Liu, Y.; Piao, S. Mapping Spatial Distribution of Forest Age in China. Earth Space Sci. 2017, 4, 108–116. [Google Scholar] [CrossRef]
  12. Köhl, M.; Neupane, P.R.; Lotfiomran, N. The impact of tree age on biomass growth and carbon accumulation capacity: A retrospective analysis using tree ring data of three tropical tree species grown in natural forests of Suriname. PLoS ONE 2017, 12, e0181187. [Google Scholar] [CrossRef] [PubMed]
  13. Guo, Z.; Hu, H.; Li, P.; Li, N.; Fang, J. Spatio-Temporal Changes in Biomass Carbon Sinks in China’s Forests from 1977 to 2008. Sci. China Life Sci. 2013, 56, 661–671. [Google Scholar] [CrossRef] [PubMed]
  14. Liu, Y.; Yu, G.; Wang, Q.; Zhang, Y.; Xu, Z. Carbon Carry Capacity and Carbon Sequestration Potential in China Based on an Integrated Analysis of Mature Forest Biomass. Sci. China Life Sci. 2014, 57, 1218–1229. [Google Scholar] [CrossRef] [PubMed]
  15. Shang, R.; Chen, J.M.; Xu, M.; Lin, X.; Li, P.; Yu, G.; He, N.; Xu, L.; Gong, P.; Liu, L.; et al. China’s Current Forest Age Structure Will Lead to Weakened Carbon Sinks in the near Future. Innovation 2023, 4, 100515. [Google Scholar] [CrossRef]
  16. Zhang, C.; Ju, W.; Chen, J.M.; Li, D.; Wang, X.; Fan, W.; Li, M.; Zan, M. Mapping Forest Stand Age in China Using Remotely Sensed Forest Height and Observation Data. J. Geophys. Res. Biogeosci. 2014, 119, 1163–1179. [Google Scholar] [CrossRef]
  17. Yao, Y.; Li, Z.; Wang, T.; Chen, A.; Wang, X.; Du, M.; Jia, G.; Li, Y.; Li, H.; Luo, W.; et al. A New Estimation of China’s Net Ecosystem Productivity Based on Eddy Covariance Measurements and a Model Tree Ensemble Approach. Agric. For. Meteorol. 2018, 253, 84–93. [Google Scholar] [CrossRef]
  18. Alexandrov, G.A. Carbon Stock Growth in a Forest Stand: The Power of Age. Carbon Balance Manag. 2007, 2, 4. [Google Scholar] [CrossRef]
  19. Xu, B.; Guo, Z.; Piao, S.; Fang, J. Biomass Carbon Stocks in China’s Forests between 2000 and 2050: A Prediction Based on Forest Biomass-Age Relationships. Sci. China Life Sci. 2010, 53, 776–783. [Google Scholar] [CrossRef]
  20. He, N.; Wen, D.; Zhu, J.; Tang, X.; Xu, L.; Zhang, L.; Hu, H.; Huang, M.; Yu, G. Vegetation Carbon Sequestration in Chinese Forests from 2010 to 2050. Glob. Chang. Biol. 2017, 23, 1575–1584. [Google Scholar] [CrossRef]
  21. Zhang, C.; Ju, W.; Chen, J.; Fang, M.; Wu, M.; Chang, X.; Wang, T.; Wang, X. Sustained Biomass Carbon Sequestration by China’s Forests from 2010 to 2050. Forests 2018, 9, 689. [Google Scholar] [CrossRef]
  22. Pregitzer, K.S.; Euskirchen, E.S. Carbon Cycling and Storage in World Forests: Biome Patterns Related to Forest Age. Glob. Change Biol. 2004, 10, 2052–2077. [Google Scholar] [CrossRef]
  23. Li, D.; Ju, W.; Fan, W.; Gu, Z. Estimating the Age of Deciduous Forests in Northeast China with Enhanced Thematic Mapper Plus Data Acquired in Different Phenological Seasons. JARS 2014, 8, 083670. [Google Scholar] [CrossRef]
  24. Spracklen, B.; Spracklen, D.V. Synergistic Use of Sentinel-1 and Sentinel-2 to Map Natural Forest and Acacia Plantation and Stand Ages in North-Central Vietnam. Remote Sens. 2021, 13, 185. [Google Scholar] [CrossRef]
  25. Dai, M.; Zhou, T.; Yang, L.; Jia, G. Spatial pattern of forest ages in China retrieved from national-level inventory and remote sensing imageries. Geogr. Res. 2011, 30, 172–184. [Google Scholar] [CrossRef]
  26. Xiao, Y.; Wang, Q.; Tong, X.; Atkinson, P.M. Thirty-Meter Map of Young Forest Age in China. Earth Syst. Sci. Data 2023, 15, 3365–3386. [Google Scholar] [CrossRef]
  27. Piao, S.; He, Y.; Wang, X.; Chen, F. Estimation of China’s Terrestrial Ecosystem Carbon Sink: Methods, Progress and Prospects. Sci. China Earth Sci. 2022, 65, 641–651. [Google Scholar] [CrossRef]
  28. Xu, W.; Jin, X.; Liu, J.; Yang, X.; Ren, J.; Zhou, Y. Analysis of Spatio-Temporal Changes in Forest Biomass in China. J. For. Res. 2022, 33, 261–278. [Google Scholar] [CrossRef]
  29. Yu, Z.; Zhao, H.; Liu, S.; Zhou, G.; Fang, J.; Yu, G.; Tang, X.; Wang, W.; Yan, J.; Wang, G.; et al. Mapping Forest Type and Age in China’s Plantations. Sci. Total Environ. 2020, 744, 140790. [Google Scholar] [CrossRef]
  30. Racine, E.B.; Coops, N.C.; St-Onge, B.; Bégin, J. Estimating Forest Stand Age from LiDAR-Derived Predictors and Nearest Neighbor Imputation. For. Sci. 2014, 60, 128–136. [Google Scholar] [CrossRef]
  31. Lin, X.; Shang, R.; Chen, J.M.; Zhao, G.; Zhang, X.; Huang, Y.; Yu, G.; He, N.; Xu, L.; Jiao, W. High-Resolution Forest Age Mapping Based on Forest Height Maps Derived from GEDI and ICESat-2 Space-Borne Lidar Data. Agric. For. Meteorol. 2023, 339, 109592. [Google Scholar] [CrossRef]
  32. Yang, X.; Liu, Y.; Wu, Z.; Yu, Y.; Li, F.; Fan, W. Forest Age Mapping Based on Multiple-Resource Remote Sensing Data. Environ. Monit Assess 2020, 192, 734. [Google Scholar] [CrossRef] [PubMed]
  33. Guo, Q.; Ren, H. Productivity as Related to Diversity and Age in Planted versus Natural Forests. Glob. Ecol. Biogeogr. 2014, 23, 1461–1471. [Google Scholar] [CrossRef]
  34. Luo, Y.; Zhang, X.; Wang, X.; Lu, F. Biomass and Its Allocation of Chinese Forest Ecosystems. Ecology 2014, 95, 2026. [Google Scholar] [CrossRef]
  35. Peng, S.; Ding, Y.; Liu, W.; Li, Z. 1 Km Monthly Temperature and Precipitation Dataset for China from 1901 to 2017. Earth Syst. Sci. Data 2019, 11, 1931–1946. [Google Scholar] [CrossRef]
  36. Zhang, J. National Forestry and Grassland Administration China Forest Resources Report (2014–2018); China Forestry Publishing House: Beijing, China, 2019; ISBN 978-7-5038-9982-9. [Google Scholar]
  37. Liu, X.; Su, Y.; Hu, T.; Yang, Q.; Liu, B.; Deng, Y.; Tang, H.; Tang, Z.; Fang, J.; Guo, Q. Neural Network Guided Interpolation for Mapping Canopy Height of China’s Forests by Integrating GEDI and ICESat-2 Data. Remote Sens. Environ. 2022, 269, 112844. [Google Scholar] [CrossRef]
  38. Thom, D.; Rammer, W.; Seidl, R. The Impact of Future Forest Dynamics on Climate: Interactive Effects of Changing Vegetation and Disturbance Regimes. Ecol. Monogr. 2017, 87, 665–684. [Google Scholar] [CrossRef] [PubMed]
  39. Seidl, R.; Thom, D.; Kautz, M.; Martin-Benito, D.; Peltoniemi, M.; Vacchiano, G.; Wild, J.; Ascoli, D.; Petr, M.; Honkaniemi, J.; et al. Forest Disturbances under Climate Change. Natrue Clim. Chang. 2017, 7, 395–402. [Google Scholar] [CrossRef]
  40. Peng, S. 1-Km Monthly Precipitation Dataset for China (1901–2021) [Dataset]. A Big Earth Data Platform for Three Poles. 2020. Available online: https://poles.tpdc.ac.cn/en/data/faae7605-a0f2-4d18-b28f-5cee413766a2/ (accessed on 8 July 2024).
  41. Peng, S. 1-Km Monthly Mean Temperature Dataset for China (1901–2022); National Tibetan Plateau Data Center: Beijing, China, 2019. [Google Scholar] [CrossRef]
  42. Tang, G. Digital Elevation Model of China (1KM). National Tibetan Plateau/Third Pole Environment Data Center. 2019. Available online: https://data.tpdc.ac.cn/zh-hans/data/12e91073-0181-44bf-8308-c50e5bd9a734/ (accessed on 8 July 2024).
  43. Breiman, L. Random Forests. Mach. Learn. 2001, 45, 5–32. [Google Scholar] [CrossRef]
  44. Zeng, J.; Zhou, T.; Wang, Q.; Xu, Y.; Lin, Q.; Zhang, Y.; Wu, X.; Zhang, J.; Liu, X. Spatial Patterns of China’s Carbon Sinks Estimated from the Fusion of Remote Sensing and Field-Observed Net Primary Productivity and Heterotrophic Respiration. Ecol. Inform. 2023, 76, 102152. [Google Scholar] [CrossRef]
  45. Wang, Y.; Peng, Y.; Hu, X.; Zhang, P. Fine-Resolution Forest Height Estimation by Integrating ICESat-2 and Landsat 8 OLI Data with a Spatial Downscaling Method for Aboveground Biomass Quantification. Forests 2023, 14, 1414. [Google Scholar] [CrossRef]
  46. Xu, H.; He, B.; Guo, L.; Yan, X.; Zeng, Y.; Yuan, W.; Zhong, Z.; Tang, R.; Yang, Y.; Liu, H.; et al. Global Forest Plantations Mapping and Biomass Carbon Estimation. J. Geophys. Res. Biogeosciences 2024, 129, e2023JG007441. [Google Scholar] [CrossRef]
  47. Besnard, S.; Koirala, S.; Santoro, M.; Weber, U.; Nelson, J.; Gütter, J.; Herault, B.; Kassi, J.; N’Guessan, A.; Neigh, C.; et al. Mapping Global Forest Age from Forest Inventories, Biomass and Climate Data. Earth Syst. Sci. Data 2021, 13, 4881–4896. [Google Scholar] [CrossRef]
  48. Couronné, R.; Probst, P.; Boulesteix, A.-L. Random Forest versus Logistic Regression: A Large-Scale Benchmark Experiment. BMC Bioinform. 2018, 19, 270. [Google Scholar] [CrossRef] [PubMed]
  49. Peichl, M.; Arain, M.A.; Brodeur, J.J. Age Effects on Carbon Fluxes in Temperate Pine Forests. Agric. For. Meteorol. 2010, 150, 1090–1101. [Google Scholar] [CrossRef]
  50. Cheng, K.; Chen, Y.; Xiang, T.; Yang, H.; Liu, W.; Ren, Y.; Guan, H.; Hu, T.; Ma, Q.; Guo, Q. A 2020 Forest Age Map for China with 30&thinsp;m Resolution. Earth Syst. Sci. Data 2024, 16, 803–819. [Google Scholar] [CrossRef]
  51. Schumacher, J.; Hauglin, M.; Astrup, R.; Breidenbach, J. Mapping Forest Age Using National Forest Inventory, Airborne Laser Scanning, and Sentinel-2 Data. For. Ecosyst. 2020, 7, 60. [Google Scholar] [CrossRef]
  52. Li, P.; Li, H.; Si, B.; Zhou, T.; Zhang, C.; Li, M. Mapping Planted Forest Age Using LandTrendr Algorithm and Landsat 5–8 on the Loess Plateau, China. Agric. For. Meteorol. 2024, 344, 109795. [Google Scholar] [CrossRef]
  53. Zhang, S.; Xu, H.; Liu, A.; Qi, S.; Hu, B.; Huang, M.; Luo, J. Mapping of Secondary Forest Age in China Using Stacked Generalization and Landsat Time Series. Sci. Data 2024, 11, 302. [Google Scholar] [CrossRef]
  54. Senf, C.; Mori, A.S.; Müller, J.; Seidl, R. The Response of Canopy Height Diversity to Natural Disturbances in Two Temperate Forest Landscapes. Landsc. Ecol. 2020, 35, 2101–2112. [Google Scholar] [CrossRef]
  55. Wang, W.; Tang, X.; Huang, M.; Zhou, G.; Ying, G.; Wang, J.; Wen, D. Forest Ecosystem Carbon Stocks in China—Dynamics and Mechanisms; Science Press: Beijing, China, 2018; ISBN 978-7-5088-5393-2. [Google Scholar]
  56. Anderson-Teixeira, K.J.; Miller, A.D.; Mohan, J.E.; Hudiburg, T.W.; Duval, B.D.; DeLucia, E.H. Altered Dynamics of Forest Recovery under a Changing Climate. Glob. Chang. Biol. 2013, 19, 2001–2021. [Google Scholar] [CrossRef] [PubMed]
Figure 1. Distribution of the sample plots and forest regions in China. (a) Geographical distribution of the sample plots; (b) commonly used geographical and administrative divisions in China (due to data limitations, forest age estimation in this paper does not include Shanghai, Hong Kong, Macao, or Taiwan).
Forests 15 01290 g001
Figure 2. Technology roadmap for retrieving forest age by fusing multiscale age information. Obs Data denotes field observation data. RS Data denotes remotely sensed data. RF age map denotes the initial spatially explicit forest age map estimated by the random forest model based on the field observation age dataset, and FIC age map denotes the downscaled forest age map through the forest inventory statistics.
Forests 15 01290 g002
Figure 3. Model performance evaluation. The blue points denote the training set data, totaling 5086 points, the red points indicate the test set data, totaling 1693 points, and the black dashed line is the 1:1 line.
Forests 15 01290 g003
Figure 4. Initial spatial distribution of forest age estimated by the RF model.
Forests 15 01290 g004
Figure 5. Frequency of RF forest ages and FIC forest ages.
Forests 15 01290 g005
Figure 6. Deviations in the predicted forest age between the RF model and FID at the provincial scale. The top left small plot shows the age frequency difference between the FID and RF results.
Forests 15 01290 g006
Figure 7. Spatial distribution map of FIC forest age. Because forest inventory is a time-consuming survey, the timing of forest inventory is not consistent across provinces (Table S3). To be precise, the applicable time for each province in this map is consistent with the survey time. We chose the middle year as the representative time, so this map applies to 2016.
Forests 15 01290 g007
Figure 8. Differences between the real forest age dataset and the three forest age datasets at different spatial scales. (AC) show the provincial-scale results, and (DF) show the regional-scale results; the red solid line is the regression line, and the black dashed line is the 1:1 line.
Forests 15 01290 g008
Figure 9. Spatial differences between the RF, MPI-BGC, and FIC forest ages. (a) shows spatial differences in RF and FIC forest ages, and (b) shows spatial differences in MPI-BGC and FIC forest ages.
Forests 15 01290 g009
Table 1. Data sources used in this study.
Types of DataData NamesResolution/ScaleData Sources
Forest statistical dataForest inventory data (2014–2018) China Forest Resources Report 2014–2018
Forest height dataNNGI-Forest Canopy Height (2019)30 m[37]
Forest distribution dataforest type and origin map (2009–2013)1 km
Meteorological dataAnnual average temperature (1970–2014)0.0083333°(~1 km)https://poles.tpdc.ac.cn/zh-hans/ (last accessed on 8 July 2024)
Annual average precipitation (1970–2014)0.0083333°(~1 km)
Elevation dataDigital elevation model of China1 km
Field observation dataField observation data (1978–2008)>100 m2[33,34]
Administrative divisionChinese administrative division (2020)
Disclaimer/Publisher’s Note: The statements, opinions and data contained in all publications are solely those of the individual author(s) and contributor(s) and not of MDPI and/or the editor(s). MDPI and/or the editor(s) disclaim responsibility for any injury to people or property resulting from any ideas, methods, instructions or products referred to in the content.

