
The Impact of Future Land Use Change on Carbon Emission and Its Optimization Strategy

 , ,
, ,
Abstract
1. Introduction
2. Materials and Methods
2.1. Data Sources
2.2. Methods
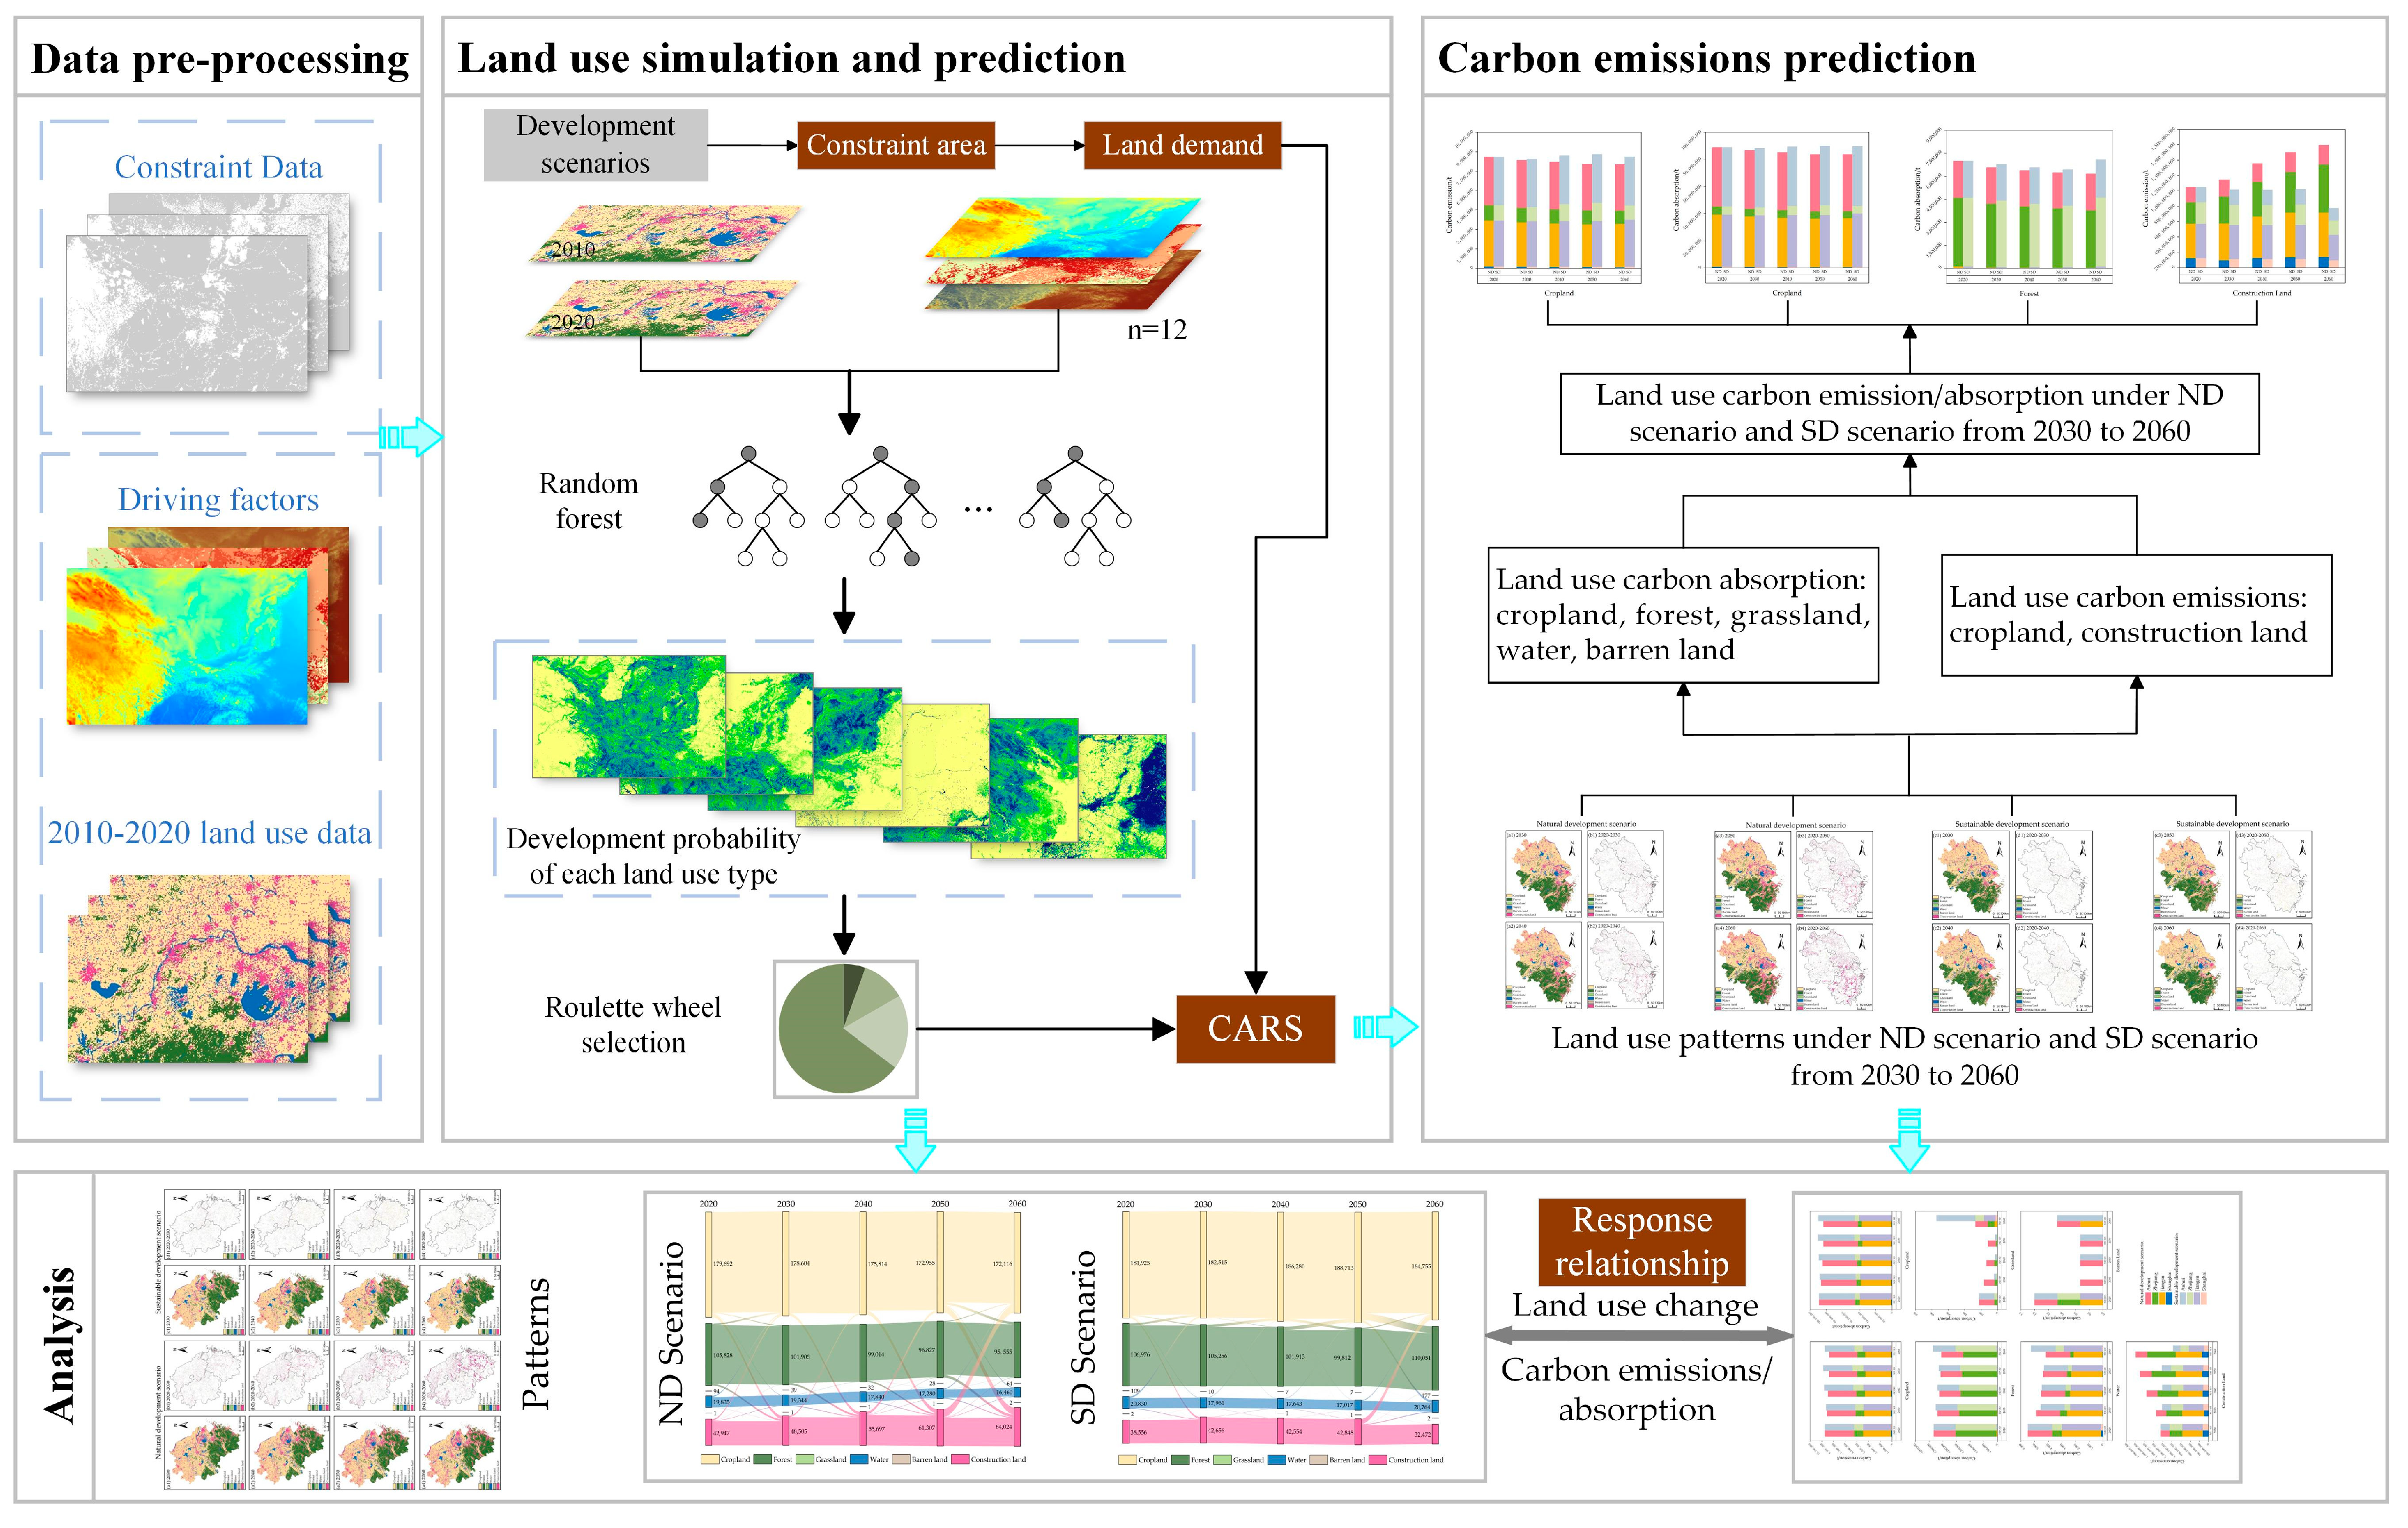
2.2.1. PLUS Model
2.2.2. Scenario Settings
2.2.3. Model Validation and Accuracy Evaluation
2.2.4. Calculation of Land Use Carbon Absorption
2.2.5. Calculation of Land Use Carbon Emissions
2.2.6. Land Use Carbon Absorption/Emission Prediction
3. Results
3.1. Accuracy Assessment
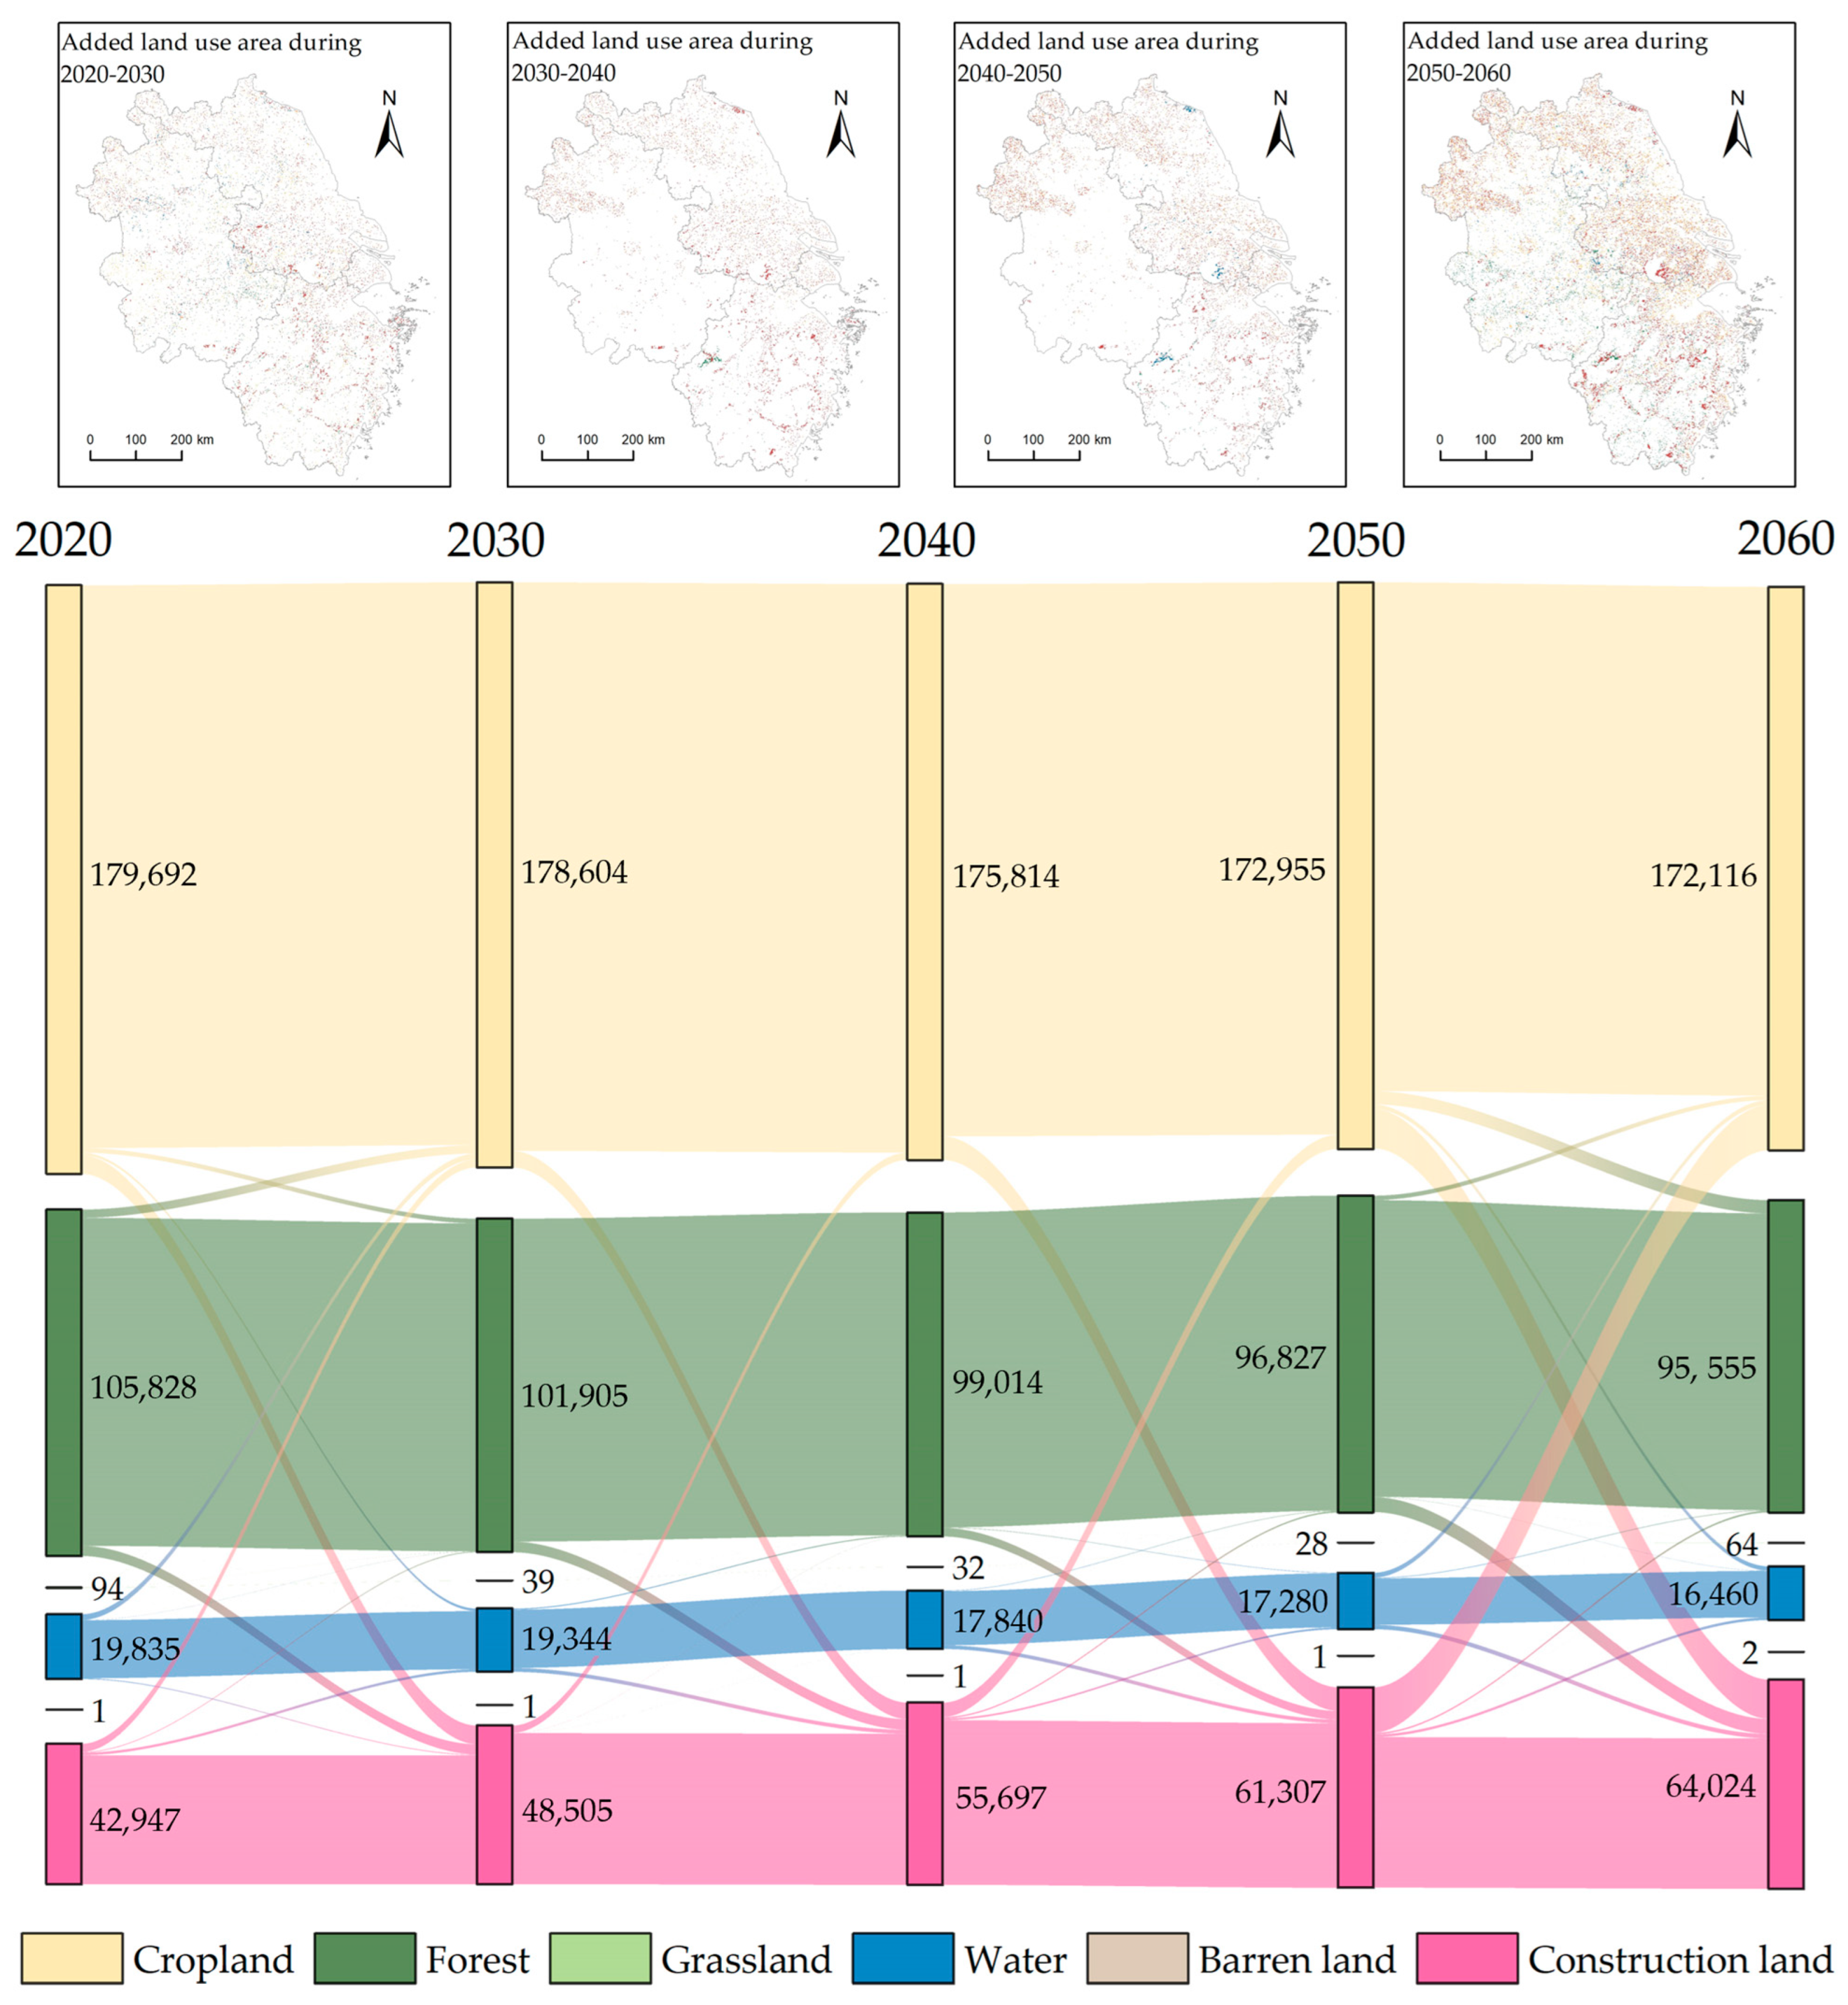
3.2. Spatiotemporal Dynamics of Future Land Use during 2030–2060
3.2.1. Changes in the Quantity of Future Land Use during 2030–2060
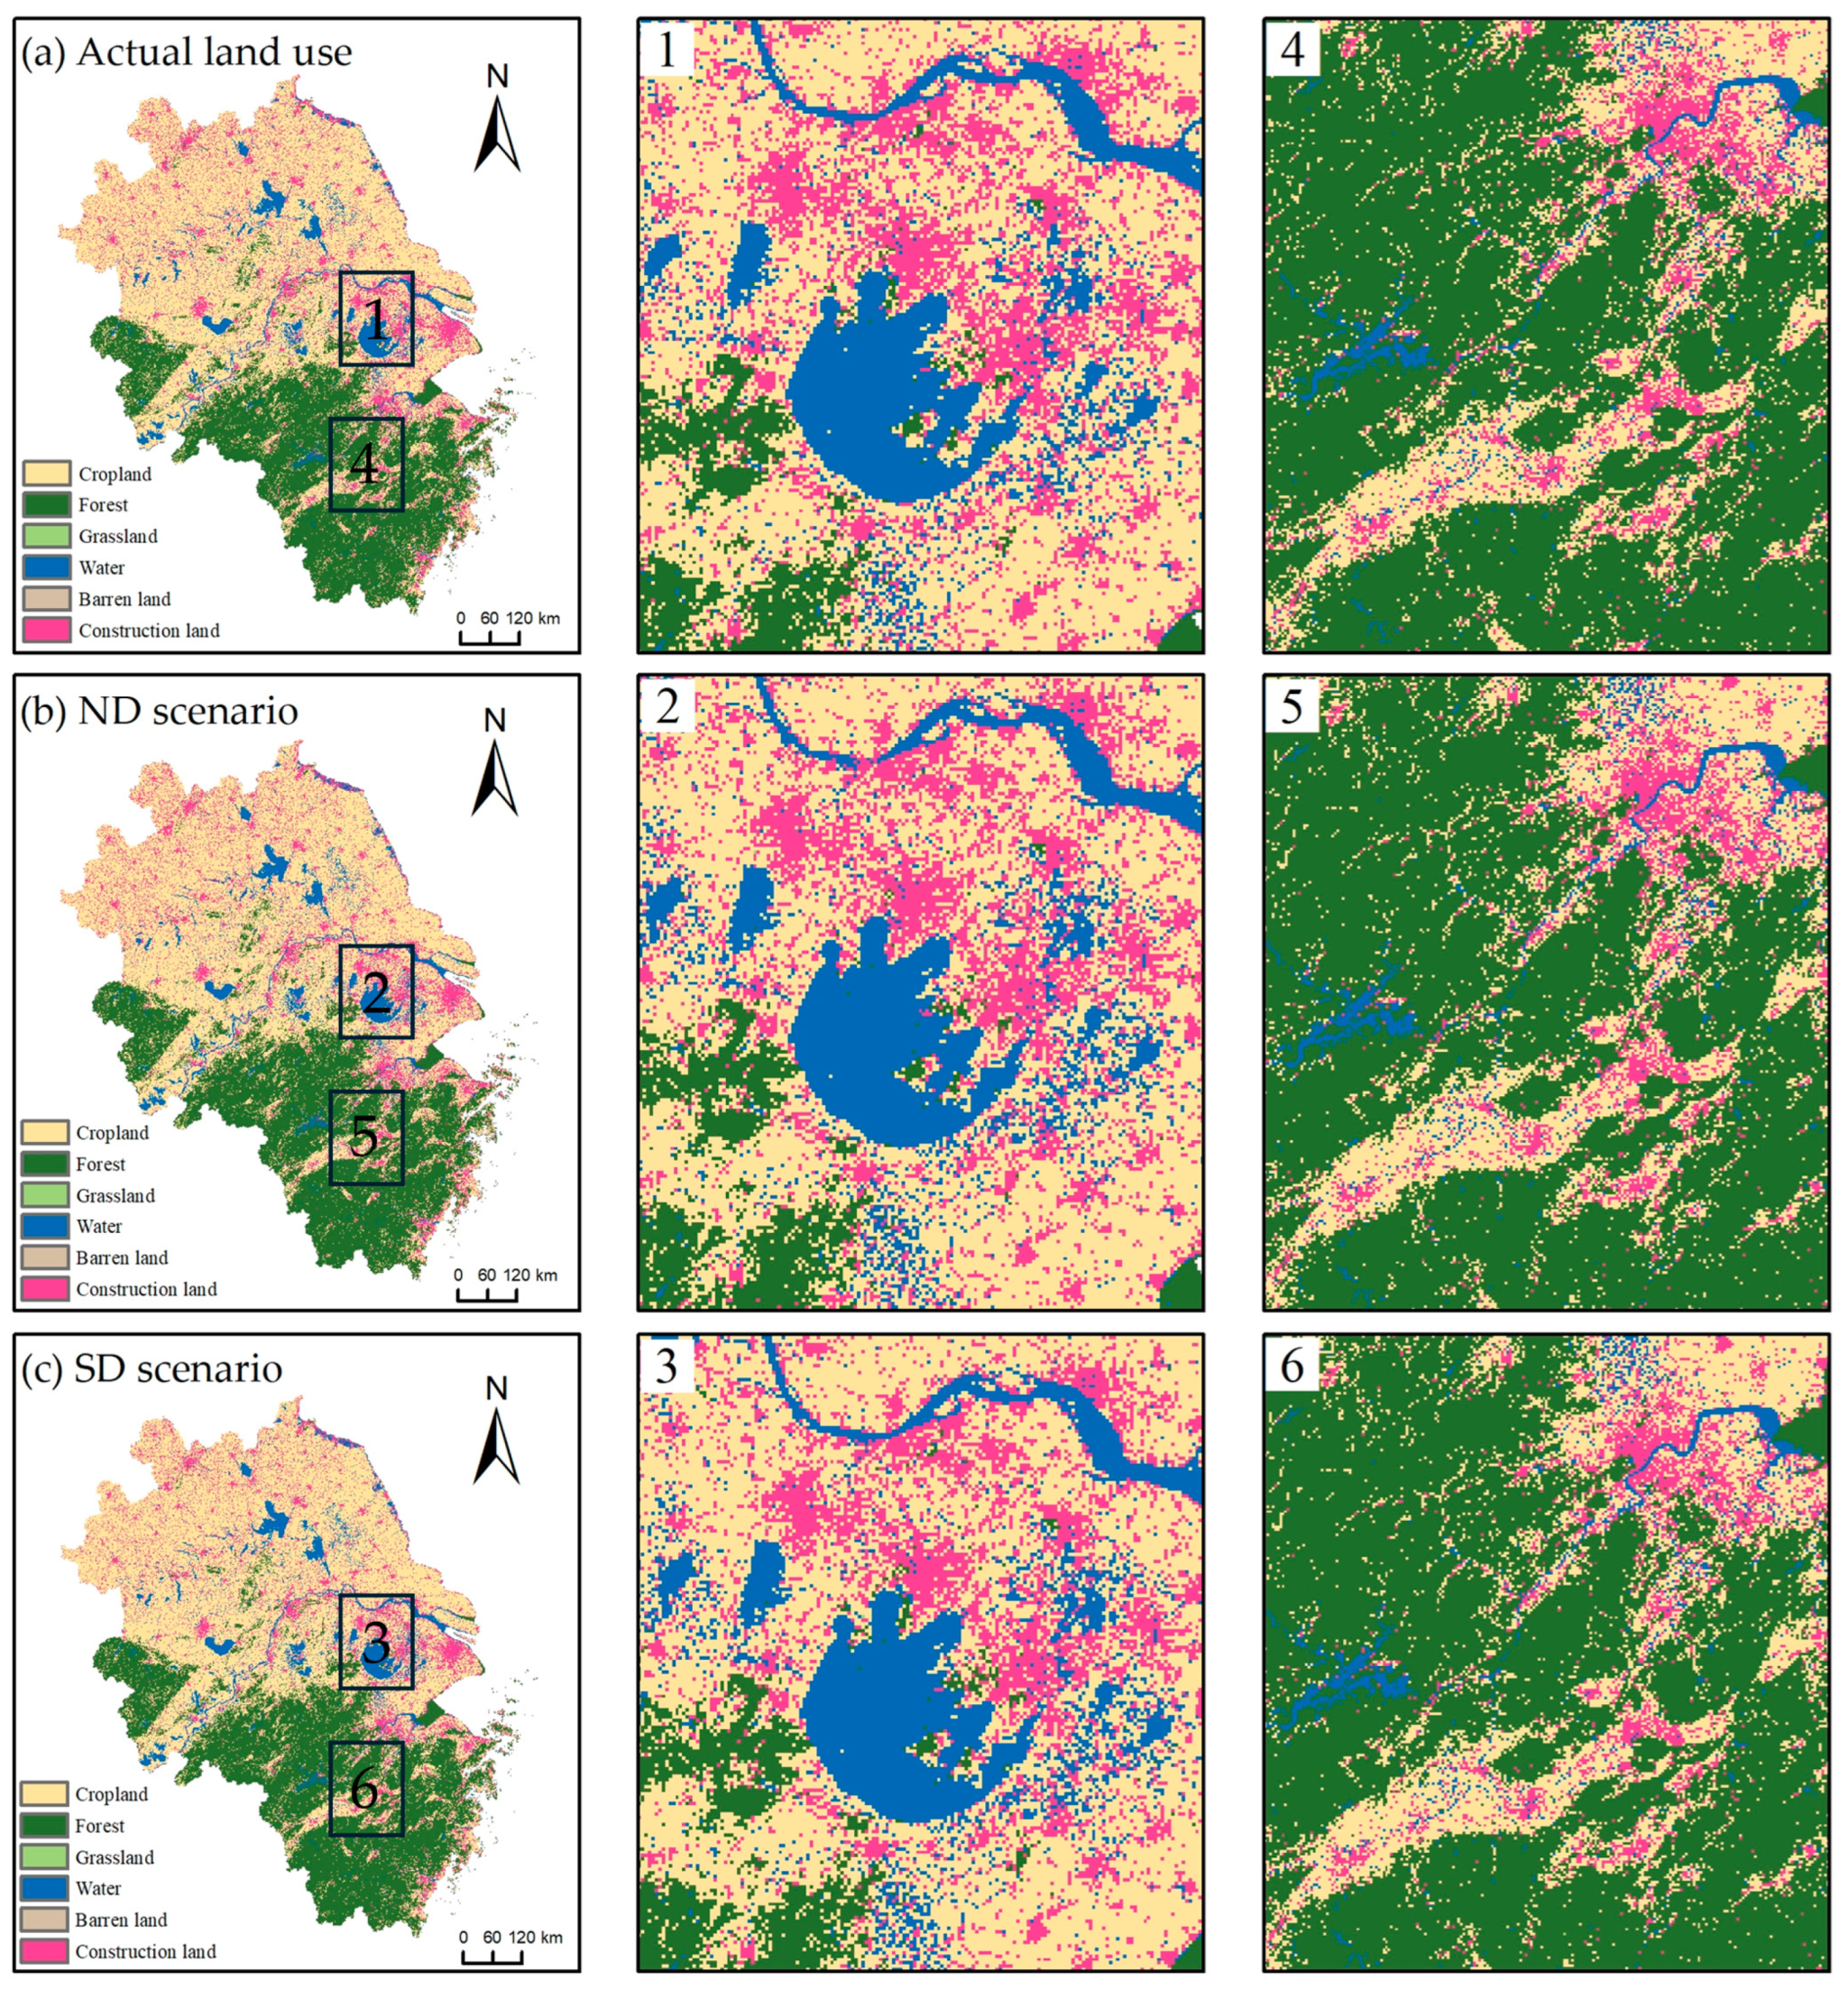
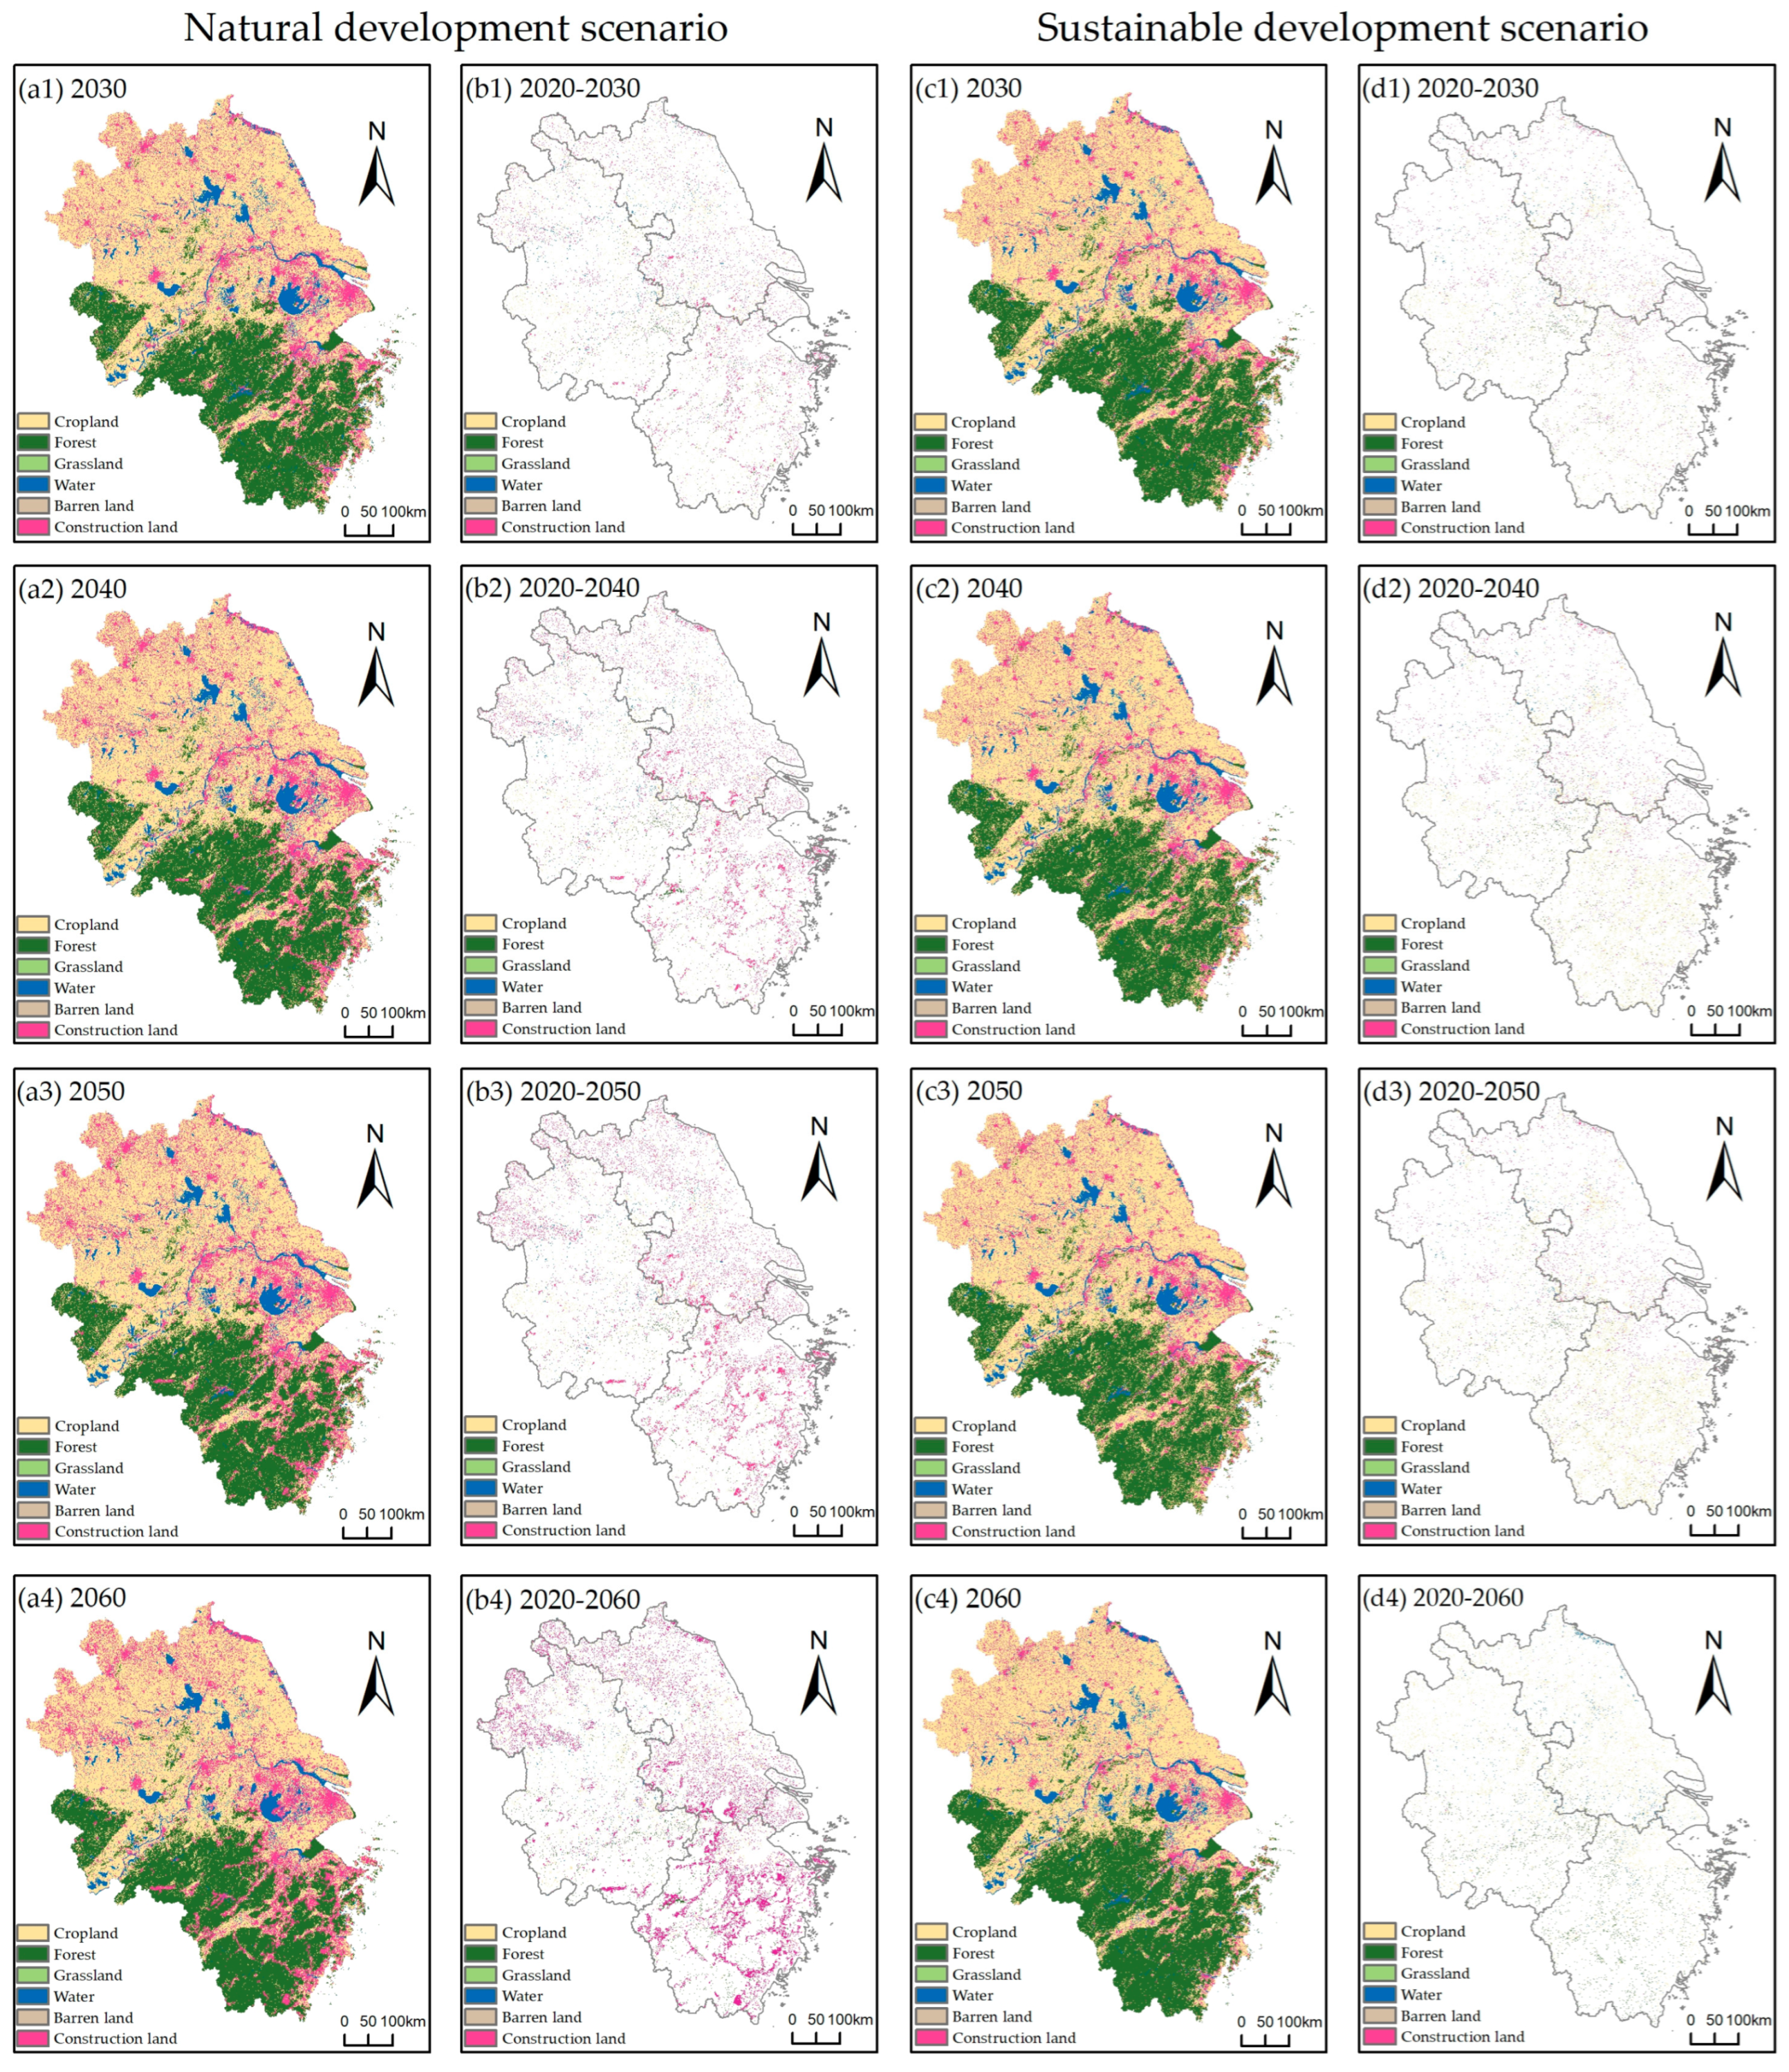
3.2.2. Changes in the Spatial Patterns of Future Land Use during 2030–2060
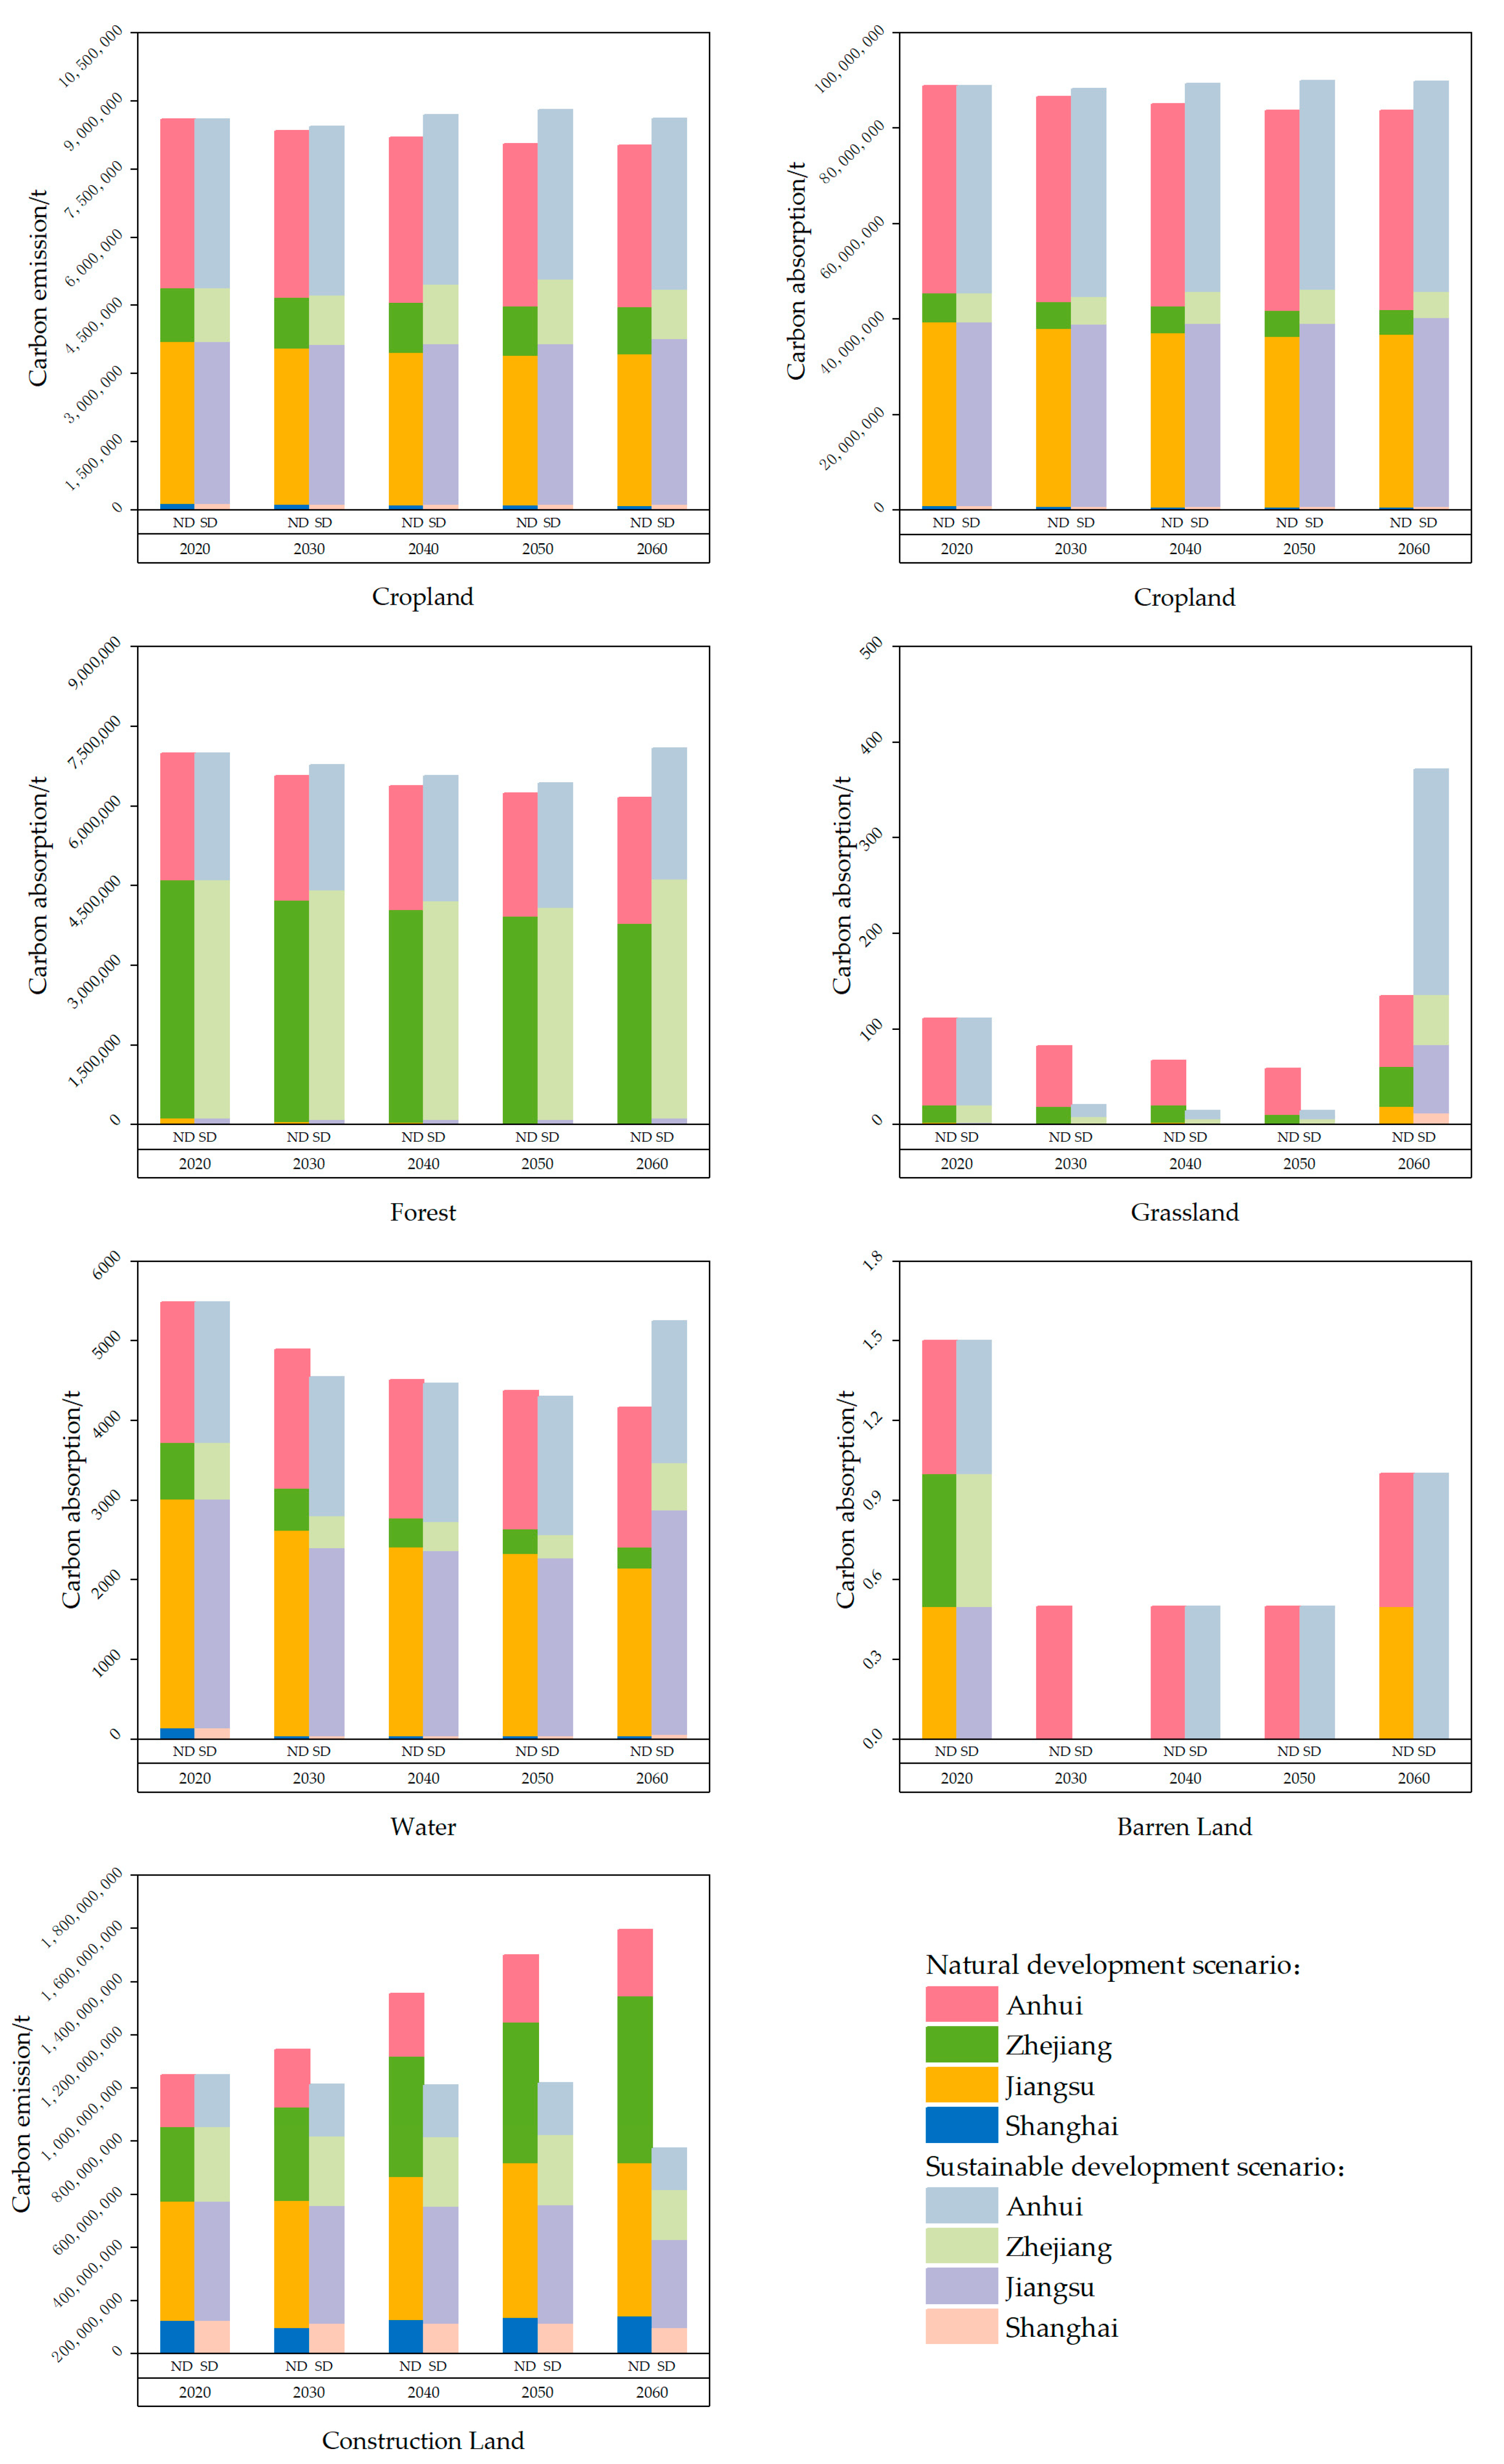
3.3. Analysis of Future Land Use Carbon Absorption/Emissions
4. Discussion
4.1. Policy Implications
4.2. Advantages, Limitations, and Perspectives
5. Conclusions
Author Contributions
Funding
Data Availability Statement
Conflicts of Interest
References
- Calvin, K.; Dasgupta, D.; Krinner, G.; Mukherji, A.; Thorne, P.W.; Trisos, C.; Romero, J.; Aldunce, P.; Barrett, K.; Blanco, G.; et al. IPCC, 2023: Climate Change 2023: Synthesis Report. Contribution of Working Groups I, II and III to the Sixth Assessment Report of the Intergovernmental Panel on Climate Change; Lee, H., Romero, J., Eds.; IPCC: Geneva, Switzerland, 2023. [Google Scholar]
- Dong, Y.; Jin, G.; Deng, X. Dynamic Interactive Effects of Urban Land-Use Efficiency, Industrial Transformation, and Carbon Emissions. J. Clean. Prod. 2020, 270, 122547. [Google Scholar] [CrossRef]
- Friedlingstein, P.; O’Sullivan, M.; Jones, M.W.; Andrew, R.M.; Hauck, J.; Olsen, A.; Peters, G.P.; Peters, W.; Pongratz, J.; Sitch, S.; et al. Global Carbon Budget 2020. Earth Syst. Sci. Data 2020, 12, 3269–3340. [Google Scholar] [CrossRef]
- Raich, J.W.; Potter, C.S. Global Patterns of Carbon Dioxide Emissions from Soils. Glob. Biogeochem. Cycles 1995, 9, 23–36. [Google Scholar] [CrossRef]
- Ballantyne, A.P.; Alden, C.B.; Miller, J.B.; Tans, P.P.; White, J.W.C. Increase in Observed Net Carbon Dioxide Uptake by Land and Oceans During the Past 50 Years. Nature 2012, 488, 70–72. [Google Scholar] [CrossRef] [PubMed]
- Zhu, E.; Deng, J.; Zhou, M.; Gan, M.; Jiang, R.; Wang, K.; Shahtahmassebi, A. Carbon Emissions Induced by Land-Use and Land-Cover Change from 1970 to 2010 in Zhejiang, China. Sci. Total Environ. 2019, 646, 930–939. [Google Scholar] [CrossRef]
- Xie, H.; Zhai, Q.; Wang, W.; Yu, J.; Lu, F.; Chen, Q. Does Intensive Land Use Promote a Reduction in Carbon Emissions? Evidence from the Chinese Industrial Sector. Resour. Conserv. Recycl. 2018, 137, 167–176. [Google Scholar] [CrossRef]
- Fu, Y.; Zhou, T.; Yao, Y.; Qiu, A.; Wei, F.; Liu, J.; Liu, T. Evaluating Efficiency and Order of Urban Land Use Structure: An Empirical Study of Cities in Jiangsu, China. J. Clean. Prod. 2021, 283, 124638. [Google Scholar] [CrossRef]
- Zhang, C.; Zhao, L.; Zhang, H.; Chen, M.; Fang, R.; Yao, Y.; Zhang, Q.; Wang, Q. Spatial-Temporal Characteristics of Car-bon Emissions from Land Use Change in Yellow River Delta Region, China. Ecol. Indic. 2022, 136, 108623. [Google Scholar] [CrossRef]
- He, S.; Yu, S.; Li, G.; Zhang, J. Exploring the Influence of Urban Form on Land-Use Efficiency from a Spatiotemporal Het-erogeneity Perspective: Evidence from 336 Chinese Cities. Land Use Policy 2020, 95, 104576. [Google Scholar] [CrossRef]
- Gao, X.; Zhang, A.; Sun, Z. How Regional Economic Integration Influence on Urban Land Use Efficiency? A Case Study of Wuhan Metropolitan Area, China. Land Use Policy 2020, 90, 104329. [Google Scholar] [CrossRef]
- Zhu, X.; Li, Y.; Zhang, P.; Wei, Y.; Zheng, X.; Xie, L. Temporal–Spatial Characteristics of Urban Land Use Efficiency of China’s 35mega Cities Based on DEA: Decomposing Technology and Scale Efficiency. Land Use Policy 2019, 88, 104083. [Google Scholar] [CrossRef]
- Le Quéré, C.; Raupach, M.R.; Canadell, J.G.; Marland, G.; Bopp, L.; Ciais, P.; Conway, T.J.; Doney, S.C.; Feely, R.A.; Foster, P.; et al. Trends in the Sources and Sinks of Carbon Dioxide. Nat. Geosci. 2009, 2, 831–836. [Google Scholar] [CrossRef]
- Cao, M.; Tian, Y.; Wu, K.; Chen, M.; Chen, Y.; Hu, X.; Sun, Z.; Zuo, L.; Lin, J.; Luo, L.; et al. Future Land-Use Change and Its Impact on Terrestrial Ecosystem Carbon Pool Evolution Along the Silk Road Under SDG Scenarios. Sci. Bull. 2023, 68, 740–749. [Google Scholar] [CrossRef]
- Yang, B.; Chen, X.; Wang, Z.; Li, W.; Zhang, C.; Yao, X. Analyzing Land Use Structure Efficiency with Carbon Emissions: A Case Study in the Middle Reaches of the Yangtze River, China. J. Clean. Prod. 2020, 274, 123076. [Google Scholar] [CrossRef]
- Popp, A.; Calvin, K.; Fujimori, S.; Havlik, P.; Humpenöder, F.; Stehfest, E.; Bodirsky, B.L.; Dietrich, J.P.; Doelmann, J.C.; Gusti, M.; et al. Land-use Futures in the Shared Socio-Economic Pathways. Glob. Environ. Chang. 2017, 42, 331–345. [Google Scholar] [CrossRef]
- Meinshausen, M.; Nicholls, Z.R.J.; Lewis, J.; Gidden, M.J.; Vogel, E.; Freund, M.; Beyerle, U.; Gessner, C.; Nauels, A.; Bauer, N.; et al. The Shared Socio-Economic Pathway (SSP) Greenhouse Gas Concentrations and Their Extensions to 2500. Geosci. Model Dev. 2020, 13, 3571–3605. [Google Scholar] [CrossRef]
- Wang, G.; Han, Q.; de Vries, B. Assessment of the Relation between Land Use and Carbon Emission in Eindhoven, the Netherlands. J. Environ. Manag. 2019, 247, 413–424. [Google Scholar] [CrossRef]
- He, J.; Zhang, P. Evaluation of Carbon Emissions Associated with Land Use and Cover Change in Zhengzhou City of China. Reg. Sustain. 2022, 3, 1–11. [Google Scholar] [CrossRef]
- Verburg, P.H.; Soepboer, W.; Veldkamp, A.; Limpiada, R.; Espaldon, V.; Mastura, S.S.A. Modeling the Spatial Dynamics of Regional Land Use: The CLUE-S Model. Environ. Manag. 2002, 30, 391–405. [Google Scholar] [CrossRef] [PubMed]
- Liu, X.; Liang, X.; Li, X.; Xu, X.; Ou, J.; Chen, Y.; Li, S.; Wang, S.; Pei, F. A Future Land Use Simulation Model (FLUS) for Simulating Multiple Land Use Scenarios by Coupling Human and Natural Effects. Landsc. Urban Plan. 2017, 168, 94–116. [Google Scholar] [CrossRef]
- Feng, Y.; Chen, S.; Tong, X.; Lei, Z.; Gao, C.; Wang, J. Modeling Changes in China’s 2000–2030 Carbon Stock Caused by Land Use Change. J. Clean. Prod. 2020, 252, 119659. [Google Scholar] [CrossRef]
- Liang, X.; Guan, Q.; Clarke, K.C.; Liu, S.; Wang, B.; Yao, Y. Understanding the Drivers of Sustainable Land Expansion Using a Patch-Generating Land Use Simulation (PLUS) Model: A Case Study in Wuhan, China. Comput. Environ. Urban Syst. 2021, 85, 101569. [Google Scholar] [CrossRef]
- Gao, F.; Xin, X.; Song, J.; Li, X.; Zhang, L.; Zhang, Y.; Liu, J. Simulation of LUCC Dynamics and Estimation of Carbon Stock under Different SSP-RCP Scenarios in Heilongjiang Province. Land 2023, 12, 1665. [Google Scholar] [CrossRef]
- Zhang, X.; Zhang, D. Urban Carbon Emission Scenario Prediction and Multi-Objective Land Use Optimization Strategy under Carbon Emission Constraints. J. Clean. Prod. 2023, 430, 139684. [Google Scholar] [CrossRef]
- Rong, T.; Zhang, P.; Zhu, H.; Jiang, L.; Li, Y.; Liu, Z. Spatial Correlation Evolution and Prediction Scenario of Land Use Carbon Emissions in China. Ecol. Inform. 2022, 71, 101802. [Google Scholar] [CrossRef]
- Li, Y.-N.; Cai, M.; Wu, K.; Wei, J. Decoupling Analysis of Carbon Emission from Construction Land in Shanghai. J. Clean. Prod. 2019, 210, 25–34. [Google Scholar] [CrossRef]
- Yang, J.; Huang, X. The 30 m Annual Land Cover Dataset and Its Dynamics in China from 1990 to 2019. Earth Syst. Sci. Data 2021, 13, 3907–3925. [Google Scholar] [CrossRef]
- Xu, T.; Gao, J.; Coco, G. Simulation of Urban Expansion via Integrating Artificial Neural Network with Markov Chain—Cellular Automata. Int. J. Geogr. Inf. Sci. 2019, 33, 1960–1983. [Google Scholar] [CrossRef]
- Zhang, Y.; Liu, Y.; Wang, Y.; Liu, D.; Xia, C.; Wang, Z.; Wang, H.; Liu, Y. Urban Expansion Simulation towards Low-Carbon Development: A Case Study of Wuhan, China. Sustain. Cities Soc. 2020, 63, 102455. [Google Scholar] [CrossRef]
- Wang, Z.; Li, X.; Mao, Y.; Li, L.; Wang, X.; Lin, Q. Dynamic Simulation of Land Use Change and Assessment of Carbon Storage Based on Climate Change Scenarios at the City Level: A Case Study of Bortala, China. Ecol. Indic. 2022, 134, 108499. [Google Scholar] [CrossRef]
- Ji, X.; Sun, Y.; Guo, W.; Zhao, C.; Li, K. Land Use and Habitat Quality Change in the Yellow River Basin: A Perspective with Different CMIP6-Based Scenarios and Multiple Scales. J. Environ. Manag. 2023, 345, 118729. [Google Scholar] [CrossRef] [PubMed]
- Zhang, X.Y.; Zhang, X.; Li, D.H.; Lu, L.; Yu, H. Multi-scenario simulation of the impact of urban land use change on ecosystem service value: A case study of Shenzhen City. Acta Ecol. Sin. 2022, 42, 2086–2097. [Google Scholar]
- Wei, L.; Zhou, L.; Sun, D.Q.; Tang, X.L. Spatiotemporal pattern evolution and scenario simulation of urban agglomeration expansion in the Yellow River Basin: A case study of Hubao Urban agglomeration of Hubei and Yu. Geogr. Res. 2022, 41, 1610–1622. [Google Scholar]
- Tan, X.; Dong, L.; Chen, D.; Gu, B.; Zeng, Y. China’s Regional CO2 Emissions Reduction Potential: A Study of Chongqing City. Appl. Energy 2016, 162, 1345–1354. [Google Scholar] [CrossRef]
- Wei, B.; Kasimu, A.; Reheman, R.; Zhang, X.; Zhao, Y.; Aizizi, Y.; Liang, H. Spatiotemporal Characteristics and Prediction of Carbon Emissions/Absorption from Land Use Change in the Urban Agglomeration on the Northern Slope of the Tianshan Mountains. Ecol. Indic. 2023, 151, 110329. [Google Scholar] [CrossRef]
- Zhang, P.; He, J.; Hong, X.; Zhang, W.; Qin, C.; Pang, B.; Li, Y.; Liu, Y. Carbon Sources/Sinks Analysis of Land Use Changes in China Based on Data Envelopment Analysis. J. Clean. Prod. 2018, 204, 702–711. [Google Scholar] [CrossRef]
- Tang, M.; Zhang, Z.; Liu, Y.; Zhang, H. Regional-Based Strategies for Municipality Carbon Mitigation: A Case Study of Chongqing in China. Energy Rep. 2022, 8, 4672–4694. [Google Scholar] [CrossRef]
- Cao, W.; Yuan, X. Region-County Characteristic of Spatial-Temporal Evolution and Influencing Factor on Land Use-Related CO2 Emissions in Chongqing of China, 1997–2015. J. Clean. Prod. 2019, 231, 619–632. [Google Scholar] [CrossRef]
- Kuang, B.; Lu, X.; Zhou, M.; Chen, D. Provincial Cultivated Land Use Efficiency in China: Empirical Analysis Based on the SBM-DEA Model with Carbon Emissions Considered. Technol. Forecast. Soc. Chang. 2020, 151, 119874. [Google Scholar] [CrossRef]
- Buendia, E.E.C.; Tanabe, K.; Kranjc, A.; Jamsranjav, B.; Fukuda, M.; Ngarize, S.; Osako, A.; Pyrozhenko, Y.; Shermanau, P.; Federici, S. 2019 Refinement to the 2006 IPCC Guidelines for National Greenhouse Gas Inventories; IPCC: Kyoto, Japan, 2019. [Google Scholar]
- Wu, X.; Fu, B.; Wang, S.; Song, S.; Li, Y.; Xu, Z.; Wei, Y.; Liu, J. Decoupling of SDGs Followed by Re-Coupling as Sustainable Development Progresses. Nat. Sustain. 2022, 5, 452–459. [Google Scholar] [CrossRef]
- Tang, J.; Song, P.; Hu, X.; Chen, C.; Wei, B.; Zhao, S. Coupled Effects of Land Use and Climate Change on Water Supply in SSP–RCP Scenarios: A Case Study of the Ganjiang River Basin, China. Ecol. Indic. 2023, 154, 110745. [Google Scholar] [CrossRef]


| Data Type | Data Subcategory | Data Description | Data Sources |
|---|---|---|---|
| Land use | Land use data | Three epochs in 2010, 2015, and 2020 with 30 m resolution | https://earthengine.google.com/ (accessed on 15 March 2024) |
| Natural environmental factors | Distance to water | Distance to water bodies such as rivers, lakes, reservoirs, etc. | Taken from 2020 land use data |
| DEM | 1 km resolution raster data | https://www.resdc.cn/ (accessed on 15 March 2024) | |
| Slope | Derived from DEM | ||
| Soil type | 1 km resolution raster data | ||
| Average annual temperature | Average temperature in 2015 | ||
| Average annual precipitation | Average precipitation in 2015 | ||
| Socio-economic factors | Population | Spatialized expression of population density in 2015 | |
| GDP | Spatialized expression of GDP value in 2015 | ||
| Distance to railway | Distance to railway | OpenStreetMap | |
| Distance to highway | Distance to highway | ||
| Distance to primary roads | Distance to primary roads in 2021 | ||
| Distance to secondary roads | Distance to secondary roads in 2021 | ||
| limiting factors | Water-restricted area | First-class rivers and watersheds with areas > 10 km2 | |
| Terrain-restricted area | Elevation > 950 m | ||
| Nature reserve | Vector data in 2021 | ||
| Cropland-restricted area | Reference to the relevant provisions on the delineation of permanent basic farmland | ||
| Statistical data | Energy consumption data | Provincial consumption of major energy sources | China National Bureau of Statistics |
| Agricultural production activity data | Economic production of major crops and other relevant data |
| Crop Type | Crop Carbon Uptake Rate | Water Content Rate | Crop Economic Coefficient |
|---|---|---|---|
| Rice | 0.45 | 0.12 | 0.40 |
| Wheat | 0.48 | 0.12 | 0.40 |
| Corn | 0.47 | 0.13 | 0.40 |
| Beans | 0.45 | 0.13 | 0.34 |
| Potatoes | 0.42 | 0.70 | 0.70 |
| Cotton | 0.45 | 0.08 | 0.10 |
| Sorghum | 0.45 | 0.12 | 0.35 |
| Tobacco | 0.45 | 0.85 | 0.55 |
| Oil seed | 0.45 | 0.10 | 0.30 |
| Land Use Type | Carbon Absorption Factor (t/hm2) | References |
|---|---|---|
| Forest | 0.644 | [37] |
| Grassland | 0.021 | [9,27] |
| Water | 0.253 | [38,39] |
| Barren Land | 0.005 | [38,39] |
| Tillage | Agricultural Machinery | Fertilizer | Pesticide | Agricultural Film | Irrigation | |
|---|---|---|---|---|---|---|
| Coefficient | 312.6 | 0.18 | 0.8956 | 4.9341 | 5.18 | 25 |
| Unit | kg·km−2 | kg·kw−1 | kg·kg−1 | kg·kg−1 | kg·kg−1 | kg·hm−2 |
| Types of Energy | Carbon Emission Coefficient | Standard Coal Coefficient |
|---|---|---|
| Coal | 0.7559 | 0.7143 tce/t |
| Crude oil | 0.5857 | 1.4286 tce/t |
| Coke | 0.8550 | 0.9714 tce/t |
| Fuel oil | 0.6185 | 1.4286 tce/t |
| Gasoline | 0.5538 | 1.4714 tce/t |
| Kerosene | 0.5714 | 1.4714 tce/t |
| Diesel oil | 0.5921 | 1.4571 tce/t |
| Natural gas | 0.4483 | 1.3300 tce/103 m3 |
| Electricity | 0.7935 | 0.4040 tce/103 kw·h |
| Scenario | Simulation Accuracy for All Land Use Types | Simulation Accuracy for Cropland | Simulation Accuracy for Forest | Simulation Accuracy for Construction Land | |||||
|---|---|---|---|---|---|---|---|---|---|
| FoM | Kappa | OA (%) | PA (%) | UA (%) | PA (%) | UA (%) | PA (%) | UA (%) | |
| SD | 0.403 | 0.952 | 97.0 | 97.5 | 97.1 | 98.6 | 97.5 | 92.2 | 99.7 |
| ND | 0.360 | 0.932 | 95.8 | 96.4 | 96.8 | 97.2 | 97.4 | 91.6 | 90.3 |
| 2030 | 2040 | 2050 | 2060 | |||||
|---|---|---|---|---|---|---|---|---|
| ND | SD | ND | SD | ND | SD | ND | SD | |
| Cropland | 178,604 | 182,515 | 175,814 | 186,280 | 172,955 | 188,713 | 172,116 | 184,755 |
| Forest | 101,905 | 105,256 | 99,014 | 101,913 | 96,827 | 99,812 | 95,555 | 110,051 |
| Grassland | 39 | 10 | 32 | 7 | 28 | 7 | 64 | 177 |
| Water | 19,344 | 17,961 | 17,840 | 17,643 | 17,280 | 17,017 | 16,460 | 20,764 |
| Barren land | 1 | 0 | 1 | 1 | 1 | 1 | 2 | 2 |
| Construction land | 48,505 | 42,656 | 55,697 | 42,554 | 61,307 | 42,848 | 64,024 | 32,472 |
| ND Scenario | SD Scenario | |||||||||
|---|---|---|---|---|---|---|---|---|---|---|
| Shanghai | Jiangsu | Zhejiang | Anhui | YRDR | Shanghai | Jiangsu | Zhejiang | Anhui | YRDR | |
| 2020 * | 125.39 | 411.94 | 272.63 | 152.24 | 962.20 | 125.39 | 411.94 | 272.63 | 152.24 | 962.20 |
| 2030 | 99.46 | 442.93 | 343.76 | 173.44 | 1059.59 | 114.92 | 407.18 | 253.35 | 152.92 | 928.40 |
| 2040 | 129.20 | 504.53 | 444.41 | 192.88 | 1271.02 | 114.82 | 405.66 | 251.46 | 152.94 | 924.89 |
| 2050 | 137.70 | 548.54 | 520.42 | 210.96 | 1417.62 | 115.02 | 410.56 | 253.96 | 152.70 | 932.25 |
| 2060 | 142.51 | 542.06 | 622.15 | 206.17 | 1512.88 | 99.46 | 292.93 | 179.81 | 112.04 | 684.23 |
Disclaimer/Publisher’s Note: The statements, opinions and data contained in all publications are solely those of the individual author(s) and contributor(s) and not of MDPI and/or the editor(s). MDPI and/or the editor(s) disclaim responsibility for any injury to people or property resulting from any ideas, methods, instructions or products referred to in the content. |
© 2024 by the authors. Licensee MDPI, Basel, Switzerland. This article is an open access article distributed under the terms and conditions of the Creative Commons Attribution (CC BY) license (https://creativecommons.org/licenses/by/4.0/).
Share and Cite
Sun, Y.; Zhi, J.; Han, C.; Xue, C.; Zhao, W.; Liu, W.; Bao, S. The Impact of Future Land Use Change on Carbon Emission and Its Optimization Strategy. Forests 2024, 15, 1292. https://doi.org/10.3390/f15081292
Sun Y, Zhi J, Han C, Xue C, Zhao W, Liu W, Bao S. The Impact of Future Land Use Change on Carbon Emission and Its Optimization Strategy. Forests. 2024; 15(8):1292. https://doi.org/10.3390/f15081292
Chicago/Turabian StyleSun, Yang, Junjun Zhi, Chenxu Han, Chen Xue, Wenjing Zhao, Wangbing Liu, and Shanju Bao. 2024. "The Impact of Future Land Use Change on Carbon Emission and Its Optimization Strategy" Forests 15, no. 8: 1292. https://doi.org/10.3390/f15081292
APA StyleSun, Y., Zhi, J., Han, C., Xue, C., Zhao, W., Liu, W., & Bao, S. (2024). The Impact of Future Land Use Change on Carbon Emission and Its Optimization Strategy. Forests, 15(8), 1292. https://doi.org/10.3390/f15081292