Article

Soil Fungal Function Centralization Enhances the Decomposition of Fine Roots at Canopy Gap Borders

1
Engineering Research Center of Chuanxibei RHS Construction at Mianyang Normal University of Sichuan Province, Mianyang Normal University, Mianyang 621000, China
2
Ecological Security and Protection Key Laboratory of Sichuan Province, Mianyang Normal University, Mianyang 621000, China
3
College of Forestry, Sichuan Agricultural University, Chengdu 611130, China
*
Authors to whom correspondence should be addressed.
Forests 2024, 15(8), 1293; https://doi.org/10.3390/f15081293
Submission received: 4 June 2024 / Revised: 17 July 2024 / Accepted: 22 July 2024 / Published: 24 July 2024
(This article belongs to the Special Issue Fungal Diversity in Forests)

Abstract

:
Canopy gaps can result in abiotic heterogeneities and diverse niches from gap borders to centers, potentially affecting fine root decompositions mediated by soil fungal communities. Despite extensive discussions on the relationship between soil fungi and fine root decomposition, the mechanism by which gap locations regulate fine root decomposition through the soil fungal community remains elusive. Here, we conducted an in situ field decomposition experiment of Chinese Toon (Toona sinensis) fine roots in a low-efficiency weeping cypress (Cupressus funebris) plantation forest across three microhabitats: gap centers, gap borders, and closed canopy areas. Soil fungal communities were determined using internal transcribed spacer (ITS) sequencing after two years of field incubation. Results showed that soil properties and nutrient content in residual roots varied across the three microhabitats, with the gap borders exhibiting the highest decomposition rates. While fungal α-diversity remained relatively consistent, taxonomic compositions differed significantly. Decomposition rates did not show significant correlations with soil properties, observed fungal ASVs, or overall community composition. However, they positively correlated with the relative abundance of saprotrophic Sordariomycetes, which in turn positively correlated with soil total nitrogen (with a highest correlation), peaking at the gap borders. Overall community variations were primarily driven by soil temperature and magnesium content in residual roots. Further analysis revealed high fungal community similarities and low dispersal limitations between the gap borders and closed canopy areas, with more phylogenetically clustered communities at the borders. These results demonstrate that the gap borders possess a high decomposition rate, likely due to the centralization of functions driven by soil fungi such as saprotrophs existing in the “microbial seed bank” or migrating from closed canopy areas. These findings highlight the key role of soil fungi, especially saprotrophic fungi, in fine root decomposition at the gap borders, stressing the importance of soil fungi-driven mechanisms in nutrient cycling, and also informing sustainable forest management practices.

1. Introduction

Canopy gaps, often resulting from natural treefalls or selective logging, are common in forest ecosystems. Once a gap is formed, it can be a localized site for the regeneration and subsequent growth of diverse seeds [1], thereby enhancing plant diversity. As canopy gaps have become increasingly critical for maintaining biodiversity and ecosystem stability [2], a gap-based silviculture practice has been included int forest managing proposals. Yet, environmental conditions caused by canopy gaps not only actuate plant successions [3,4,5], but also affect litter decompositions. The latter, in turn, may regulate plant successions within the gaps, and even the gap-based reforestation effects in low-efficiency plantations, by mediating soil nutrients for plants, e.g., ammonium and nitrate nitrogen, and available phosphorus [6]. Fine root (roots with a diameter ≤ 2 mm) decompositions, accounting for around 33% of annual forest litter inputs [7], have been identified as a primary pathway for nutrient returning from plant tissues to soils [8], and even their contributions to nutrient returning and the soil active carbon pool are greater than those of leaf litter in several studies [9,10,11]. Thus, understanding how canopy gaps influence fine root decompositions and associated ecological mechanisms is crucial for optimizing gap-based silviculture practices.
Fine root decomposition involves material exchanges with the environments, and it can be affected by numerous factors [12], e.g., abiotic conditions such as climates and soil properties, substrate quality, and decomposers like soil microbes and fauna [7,13,14]. The decomposition initiates with a rapid eluviation, influenced by abiotic factors like soil temperature and moisture, followed by the slow microbiological breakdowns of complex substances [15]. The latter phase represents a gradual release of chemical elements from plant tissues to soils, and thus likely plays vital roles in sustaining soil nutrient contents and the overall health of above-ground plants. Despite the fact that both bacteria and fungi can contribute to fine root decompositions [7,16], the latter are often recognized to play more prominent roles in this process [17]. This is because fungi excel at breaking down complex substances like lignin and cellulose compared to bacteria [18], and they can also form symbiotic connections with plants to improve the uptake of nutrients released from fine roots [19]. Thus, the relationships between soil fungi and fine root decompositions have received great attention in recent decades [20,21,22,23,24,25,26,27]. It is reported that roots in forests are primarily decomposed by saprophytic fungi [28,29]. Some soil fungi, e.g., basidiomycetes, can secrete enzymes to break down plant cell walls during the decomposition of fine roots, which could further affect organic matter breakdowns [7]. This emphasizes the significance of soil fungal taxonomic composition in fine root decompositions. However, understanding the relationships between fungal communities and fine root decompositions may become more complicated when taking canopy gaps into account, because a gap not only represents a proxy of environmental heterogeneity in contrast to closed canopy areas [14], but is also able to create different environmental conditions from the borders to the centers [17].
Previous studies suggest a high decomposition rate of soil organic matters in canopy gaps compared to closed canopy areas [1], and the decomposition rates are higher in small gaps or closed areas compared to large ones [13,30,31,32,33,34,35,36], although exceptions still exist [37]. Evidence also shows that the gap border is an area with an optimal microclimate and substrate to improve soil microbial biomass and activity [38], and humification is suppressed in gap centers [39]. These studies imply a need to comprehend the mechanism by which gap locations regulate fine root decompositions before assessing the effect of gap sizes. This is because the responses of decomposition rate to abiotic heterogeneities from the border to the center of a gap likely pose a potential confounding factor in assessing the effect of gap sizes. Some studies have investigated fine root decompositions [8,9,12,40] and their relationships with fungi [26]. However, to date, we still lack sufficient evidence to comprehend how gap locations regulate fine root decompositions through soil fungal communities. A previous study indicates that soil fungal communities at the gap borders closely resemble those found in closed canopy areas, as opposed to the centers [17]. This suggests that soil fungal communities at the gap borders are more likely to share individuals with closed canopy areas than those at the centers, probably because of less dispersal limitation and a more similar microhabitat. Given that the gap borders represent an area with optimal microclimates and substrates [38], it is hypothesized that the canopy gap border possesses a high decomposition rate of fine roots due to the centralization of function mediated by soil fungal species existing in the “microbial seed bank” or migrating from closed canopy areas.
Weeping cypress (Cupressus funebris) has been widely used for afforestation in China [17], particularly in the hilly regions of central Sichuan. Yet, inadequate management practices have led to increasing declines in the ecological benefits of Cupressus funebris plantations, resulting in numerous low-productivity stands. Selective logging and replanting with diverse tree species can effectively prevent the continued formation of low-efficiency stands in plantations by rapidly increasing plant diversity. As a tree species with strong environmental adaptability, and considerable economic and ecological significance, Chinese Toon Toona sinensis is widely distributed throughout the Sichuan Basin, and it is also a prominent native tree species in the hilly regions of central Sichuan. Replanting Toona sinensis trees within canopy gaps caused by selective logging can be a favorable strategy to increase plant diversity in low-productivity plantations. Under such a scenario, an in situ decomposition experiment of Chinese Toon (Toona sinensis) fine roots in a low-efficiency Cupressus funebris plantation (Hexin, Deyang, Sichuan Province, China) across three microhabitats including closed canopy areas (CC), gap centers (GCs), and gap borders (GBs) was conducted to test the above hypothesis. After 2-year field experiments, internal transcribed spacer (ITS) sequencing was employed to investigate soil fungal communities. By incorporating soil properties, nutrient content in residual roots, and the decomposition rate over a period of two years, this study aimed to illustrate how canopy gap locations regulate the decomposition of Toona sinensis fine roots in Cupressus funebris plantations through soil fungal communities. This study uncovered the fungus-driven mechanism by which canopy gap locations regulate the decomposition of fine roots through fungal communities, providing novel insights for optimizing gap-based silviculture practices in low-efficiency Cupressus funebris plantations.

2. Materials and Methods

2.1. Site Description

This study was conducted in a plantation forest ecosystem in Hexin, Deyang, Sichuan, China (104°25′30″–104°25′45″ E, 31°04′08″–31°04′15″ N). The elevation of study areas ranges from 510 to 530 m above sea level. The average annual temperature ranges from 15 to 17 °C, and the average annual precipitation is approximately 906 mm. Soils in the study areas are classified as purple soil. The plantation forest is dominated by Cupressus funebris, with an age of around 30 years, and a density of around 2500 plants/hm2. Due to the improper management, the plantation has become a low-efficiency ecosystem. Other tree species in the study area include German oak (Quercus acutissima), alder (Alnus cremastogyne), tungoil tree (Vernicia fordii), paper mulberry (Moraceae broussonetia), and privet (Ligustrum lucidum); the shrub layer consists of linden arrowwood (Viburnum dilatatum), Chinese sumac (Rhuschinensis), and pyracantha (Pyracantha fortuneana); and the herbaceous layer includes brake (Pteris multifida), sedge (Carex brunnea), and arthraxon (Arthraxon hispidus).

2.2. Experimental Design and Sample Collection

In March 2012, a gap-based reforestation practice was applied in the areas with similar site conditions and consistent growth status and management levels, resulting in 4 canopy gaps, each approximately 200 m2. These canopy gap areas favored the growth of tree species [41]. All gaps were oriented north–south, measuring 20 m in length, and 14 m in width, forming a near-ellipse (Figure 1A,B), with each spaced at least 40 m. After gap creations, tree branches and trunks were removed. In April 2012, 2-year-old Toona sinensis seedlings, around 30 cm tall, were replanted in these gaps. Each seedling was planted in a 50 cm × 50 cm × 50 cm (length × width × depth) hole, spaced 1.5 m × 1.0 m apart (length × width). Thirteen Toona sinensis seedlings were replanted in each canopy gap. In August 2015, roots were collected from each Toona sinensis tree using a root auger. All roots were immediately brought back to the laboratory, and carefully dissected with forceps into the first five order roots, following the root branch order described in a previous study [42]. Then, roots with a diameter ≤ 2 mm were oven-dried at 70 °C until reaching a constant weight, and cut into segments of around 2 cm in length before thorough mixing. Finally, 4 g of dried roots was placed in 10 cm × 20 cm (width × length) nylon bags with 100 μm mesh and sealed for later use (36 bags in total). In November 2015, the bags were evenly buried (a depth of 5–15 cm) at the center (GC) and border (GB) of 4 canopy gaps. The definitions of GC and GB are illustrated in Figure 1B. All burial sites were within the canopy projection range of the Toona sinensis tree, around 30 cm away from the trunk. As a control, 4 closed canopy areas (20 m × 20 m) (CC) were established. The GC, GB, and CC had 3 biological replicates, respectively. Before burying nylon bags, we collected 250 g of in situ soils at each burial site, removed all visible rocks, plant roots, and residues, immediately placed them in each bag containing 4 g of dried roots, and mixed thoroughly. After a 2-year in situ decomposition, soils and root residuals were sampled in October 2017. During sampling, 150 g of soil from each bag was collected, placed in a resealable bag, and stored at 4 °C before being transported back to the laboratory. Soils were sieved through a 2 mm mesh and divided into 2 parts: one freeze-dried and stored at −20 °C for DNA extraction, while the other at 4 °C for soil property measurements. Toona sinensis fine roots within the bags were also taken back to the laboratory for residual weight and nutrient content analysis. A total of 36 soil samples and 36 residual root samples were collected for subsequent analyses in this study.

2.3. Soil Property and Root Nutrient Content Measurement

Soil temperature (ST) at a depth of 5–15 cm was measured in situ by using an iButton DS 1921G (DS1921-G, Maxim, Integrated, San Jose, CA, USA) before sampling [17]. Soil moisture content (SMC) was determined through drying fresh soils at 105 °C for 48 h. Soil pH was measured in a soil–water slurry (1:5, w/v) by using a pH meter [43]. Soil available phosphorus (SAP) was assessed using a molybdenum antimony anti-colorimetric method [44]. Soil total organic carbon (SOC) was determined by the wet oxidation method [17,45]. Soil total nitrogen (STN) was determined by using the Kjeldahl method [46]. Residual root total carbon (RTC) and nitrogen (RTN) contents were measured using an elemental analyzer (Vario MAX cube, Elementar, Frankfurt, Germany). Residual root carbon-to-nitrogen ratio (RCN) denotes the ratio of RTC to RTN. Residual root calcium (RCa) and magnesium (RMg) contents were measured by a Flame Atomic Absorption Spectrometer (Spectr AA 220FS, Varian, Palo Alto, CA, USA). Residual root lignin (RLig) and cellulose (RCel) content were measured through using acid-detergent fiber methods [47]. The hemicellulose (RHem) content was determined using the methods of Blumenkrantz and Asboe-Hansen [48]. The decomposition rate (DRR) was calculated through using the following equation based on the initial (Mi) and residual (Mr) weights of Toona sinensis roots.
D e c o m p o s i t i o n   r a t e = 1 M r M i × 100 %

2.4. DNA Extraction, Sequencing, Bioinformatics Analysis, and Ecological Metric Calculation

A PowerSoil® DNA Isolation Kit (MoBio, Carlsbad, CA, USA) was employed to extract DNA from 0.25 g of freeze-dried soils, and a Nano-Drop ND-1000 Spectrophotometer (Nano-Drop Technologies Inc., Wilmington, DE, USA) was used to check the quality of DNA. Polymerase chain reaction (PCR) amplification was then performed on high-quality genomic DNA through using gITS7F and ITS4R primers [49]. Details about the PCR reaction system and amplification program, as well as the high-throughput sequencing of ITS, are available in Supplementary Method S1.1. Due to the fact that one soil sample from the gap borders failed to be amplified, ITS sequencing was carried out on a final count of 35 samples. Raw ITS sequences were analyzed through using the QIIME 2 workflow [50] (version 2023.7), and the amplicon sequence variants (ASVs) produced by such a workflow were taxonomically annotated against the UNITE v2019.02.02 database [51]. Details about the bioinformatics analysis of sequencing data are available in Supplementary Method S1.2. Observed fungal ASVs and Bray–Curtis distances were calculated by using the microgeo R package (v0.1.2) [52]. The standardized effect size measurement of the mean nearest taxon distance (ses.MNTD) was estimated with 999 iterations through using the picante R package (v1.8.2) [53]. A ses.MNTD significantly less than zero indicates a more phylogenetically clustered community [54]. The β-nearest taxon index (βNTI) and the ecological processes related to fungal community assembly (also referred to as the community assembly process) were inferred using the iCAMP R package (v1.5.12) [55]. A βNTI value above +2 and below –2 suggests that the community assembly is significantly greater and less than the null expectation, respectively, and is most probably influenced by deterministic ecological processes [56].

2.5. Statistical Analysis

The overall differences in all abiotic factors (including soil properties and root nutrient content), soil properties, and root nutrient content were visualized through a principal coordinates analysis (PCoA), and then assessed using the analysis of similarity (ANOSIM) based on Euclidean distances. For fungal communities, the same analyses were performed based on Bray–Curtis distances. Individual soil properties, root nutrient content metrics, decomposition rates, the relative abundance of differential lineages, observed fungal ASVs (α–diversity), Bray–Curtis distances, ses.MNTD, and the βNTI were compared through using a Wilcoxon rank sum test. Spearman rank correlation analysis was used to reveal the relationships between abiotic factors and decomposition rates, observed fungal ASVs, and the relative abundance of differential lineages, and all p-values were adjusted through using a false discovery rate (FDR). Abiotic factors significantly (p < 0.05) correlated with decomposition rate were further visualized via a scatter diagram. Taxonomic compositions at the class level and the contribution of community assembly processes were visualized in a form of stacked bar chart. The unique and shared fungal ASV numbers among groups were visualized using a Venn diagram. Differential abundance analyses (Random Forest algorithm) were utilized to reveal fungal ASVs significantly varied across gap locations (p < 0.01). Significant ASVs were subsequently subjected to a functional guild prediction through using the microeco R package (v0.1.2) [57] and FungalTraits database (version: 1.2_ver_16Dec_2020V.1.2) [58]. Only the significant ASVs with a known functional guild and a class-level taxonomy were discussed. To identify key factors impacting the fungal community, a redundancy analysis (RDA, Bray–Curtis distance) was used, and the contribution of variables to community variations was estimated using the envfit() function of the vegan R package (v2.6.4) [59]. A partial mantel test was also employed to reveal the relationships between abiotic factors and soil fungal communities. Variance partitioning analysis (VPA) was used to reveal the contributions of soil properties, root nutrient content metrics, and both of them to community variations, using the varpart() function of the vegan R package (v2.6.4) [59]. Spearman rank correlations between abiotic factor sets and soil fungal communities were inferred by using the bioenv() function of the vegan R package (v2.6.4) [59], and the factor set with the highest correlation coefficient was further fitted to the Bray–Curtis distances of communities using a scatter diagram. All statistical analyses were conducted in R v4.1.2, and the R packages mainly included vegan (v2.6.4) [59], microeco (v0.1.2) [57], ggplot2 (v3.5.0) [60], and ggpubr (v0.6.0), https://github.com/kassambara/ggpubr).

3. Results

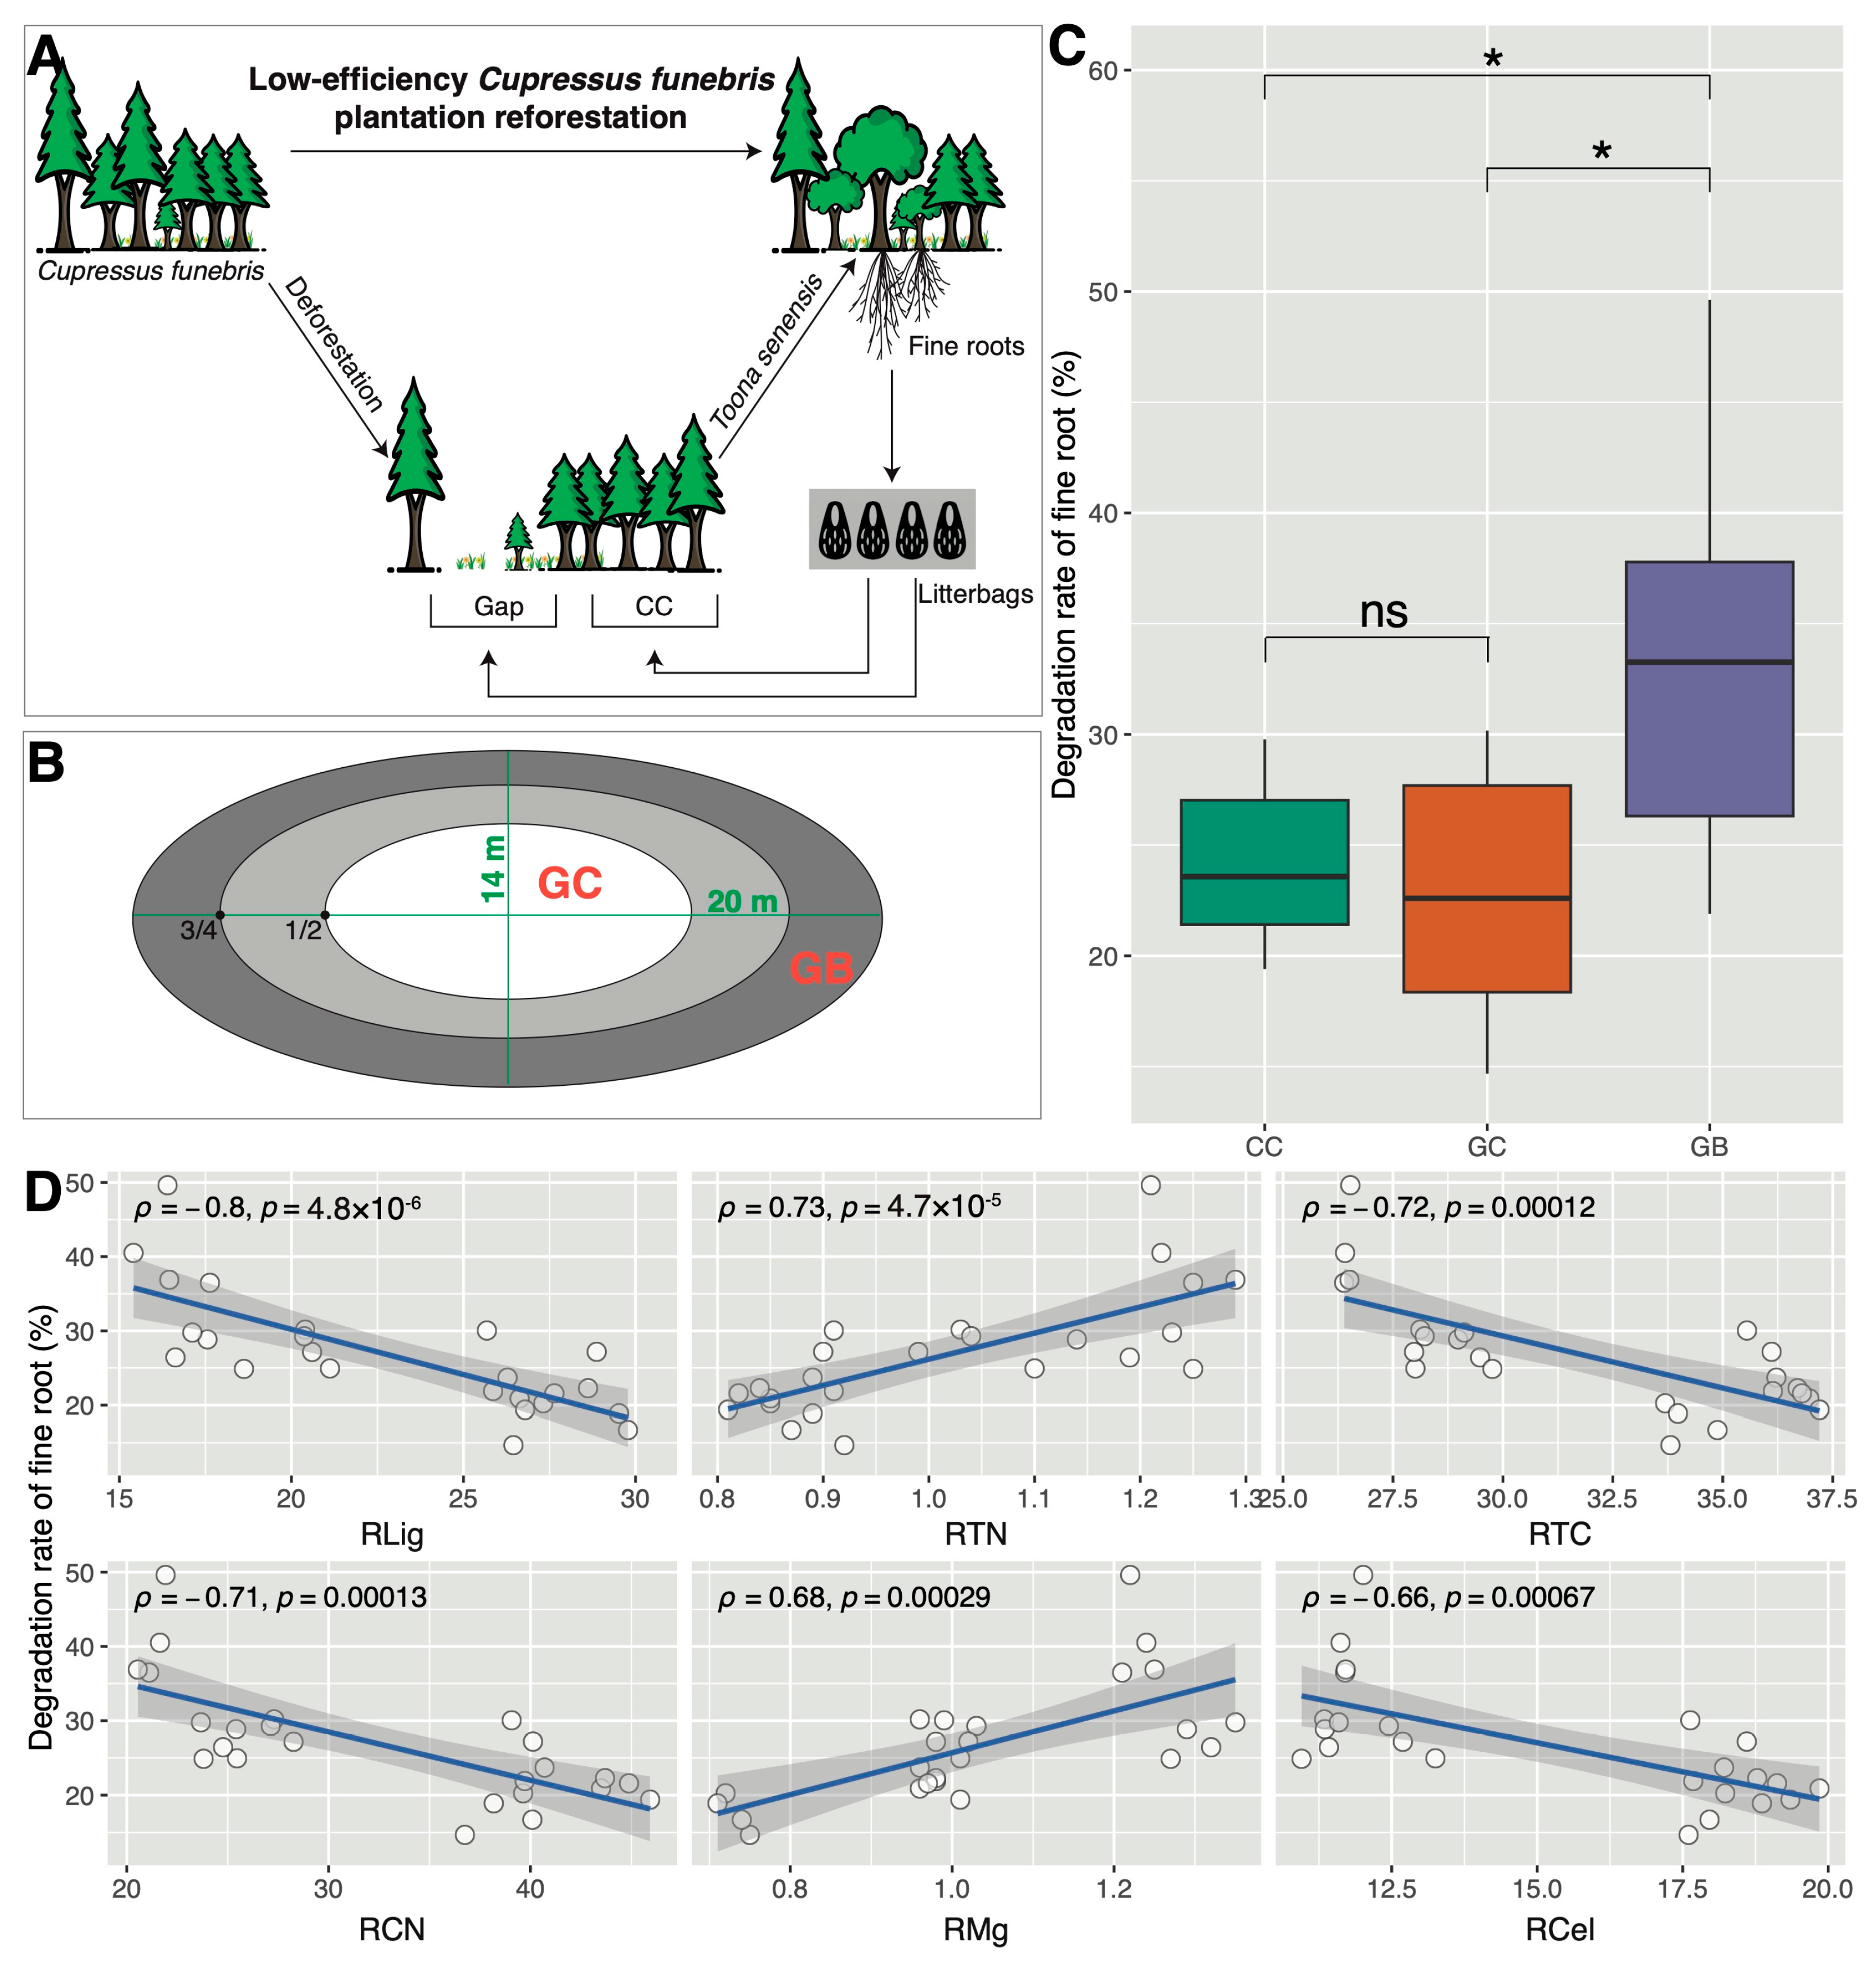
3.1. Shifts in Soil Properties and Decomposition Rates across Gap Locations

The PCoA revealed significant differences (p < 0.05) in microhabitats among the three gap locations (Figure S1, Table S1). Specifically, the highest values of ST and soil pH were detected at the GC, while the lowest values were detected at the CC. Instead, the highest SWC was detected at the CC, with the lowest at the GC. Furthermore, the highest values of SOC, STN, and SAP were found at the GB, while the lowest values were observed at the CC (Figure S2A). The highest RTC, RCN, and RHem were found at the CC, and the lowest values were observed at the GB; the lowest RCa and RMg were detected at the GC, but no significant differences were detected between the CC and GB for these two metrics; the highest RLig was observed at the GC, whereas the lowest value was found at GB, though several differences were not statistically significant (p > 0.05); there were no significant differences among the three gap locations for RTN and RCel (Figure S2B). The highest decomposition rates were detected at the GB, and they were significantly greater than those at the CC and GC (p < 0.05); no significant difference in the decomposition rate was found between the CC and GC (Figure 1C). Spearman rank correlation analyses revealed no significant correlations between decomposition rates and soil properties (p > 0.05). Instead, root properties including RLig (ρ = −0.8, p < 0.001), RTN (ρ = 0.73, p < 0.001), RTC (ρ = −0.72, p < 0.001), RCN (ρ = −0.71, p < 0.001), RMg (ρ = 0.68, p < 0.001), and RCel (ρ = −0.66, p < 0.001) significantly correlated with the decomposition rate of fine roots (Figure 1D and Figure S3).

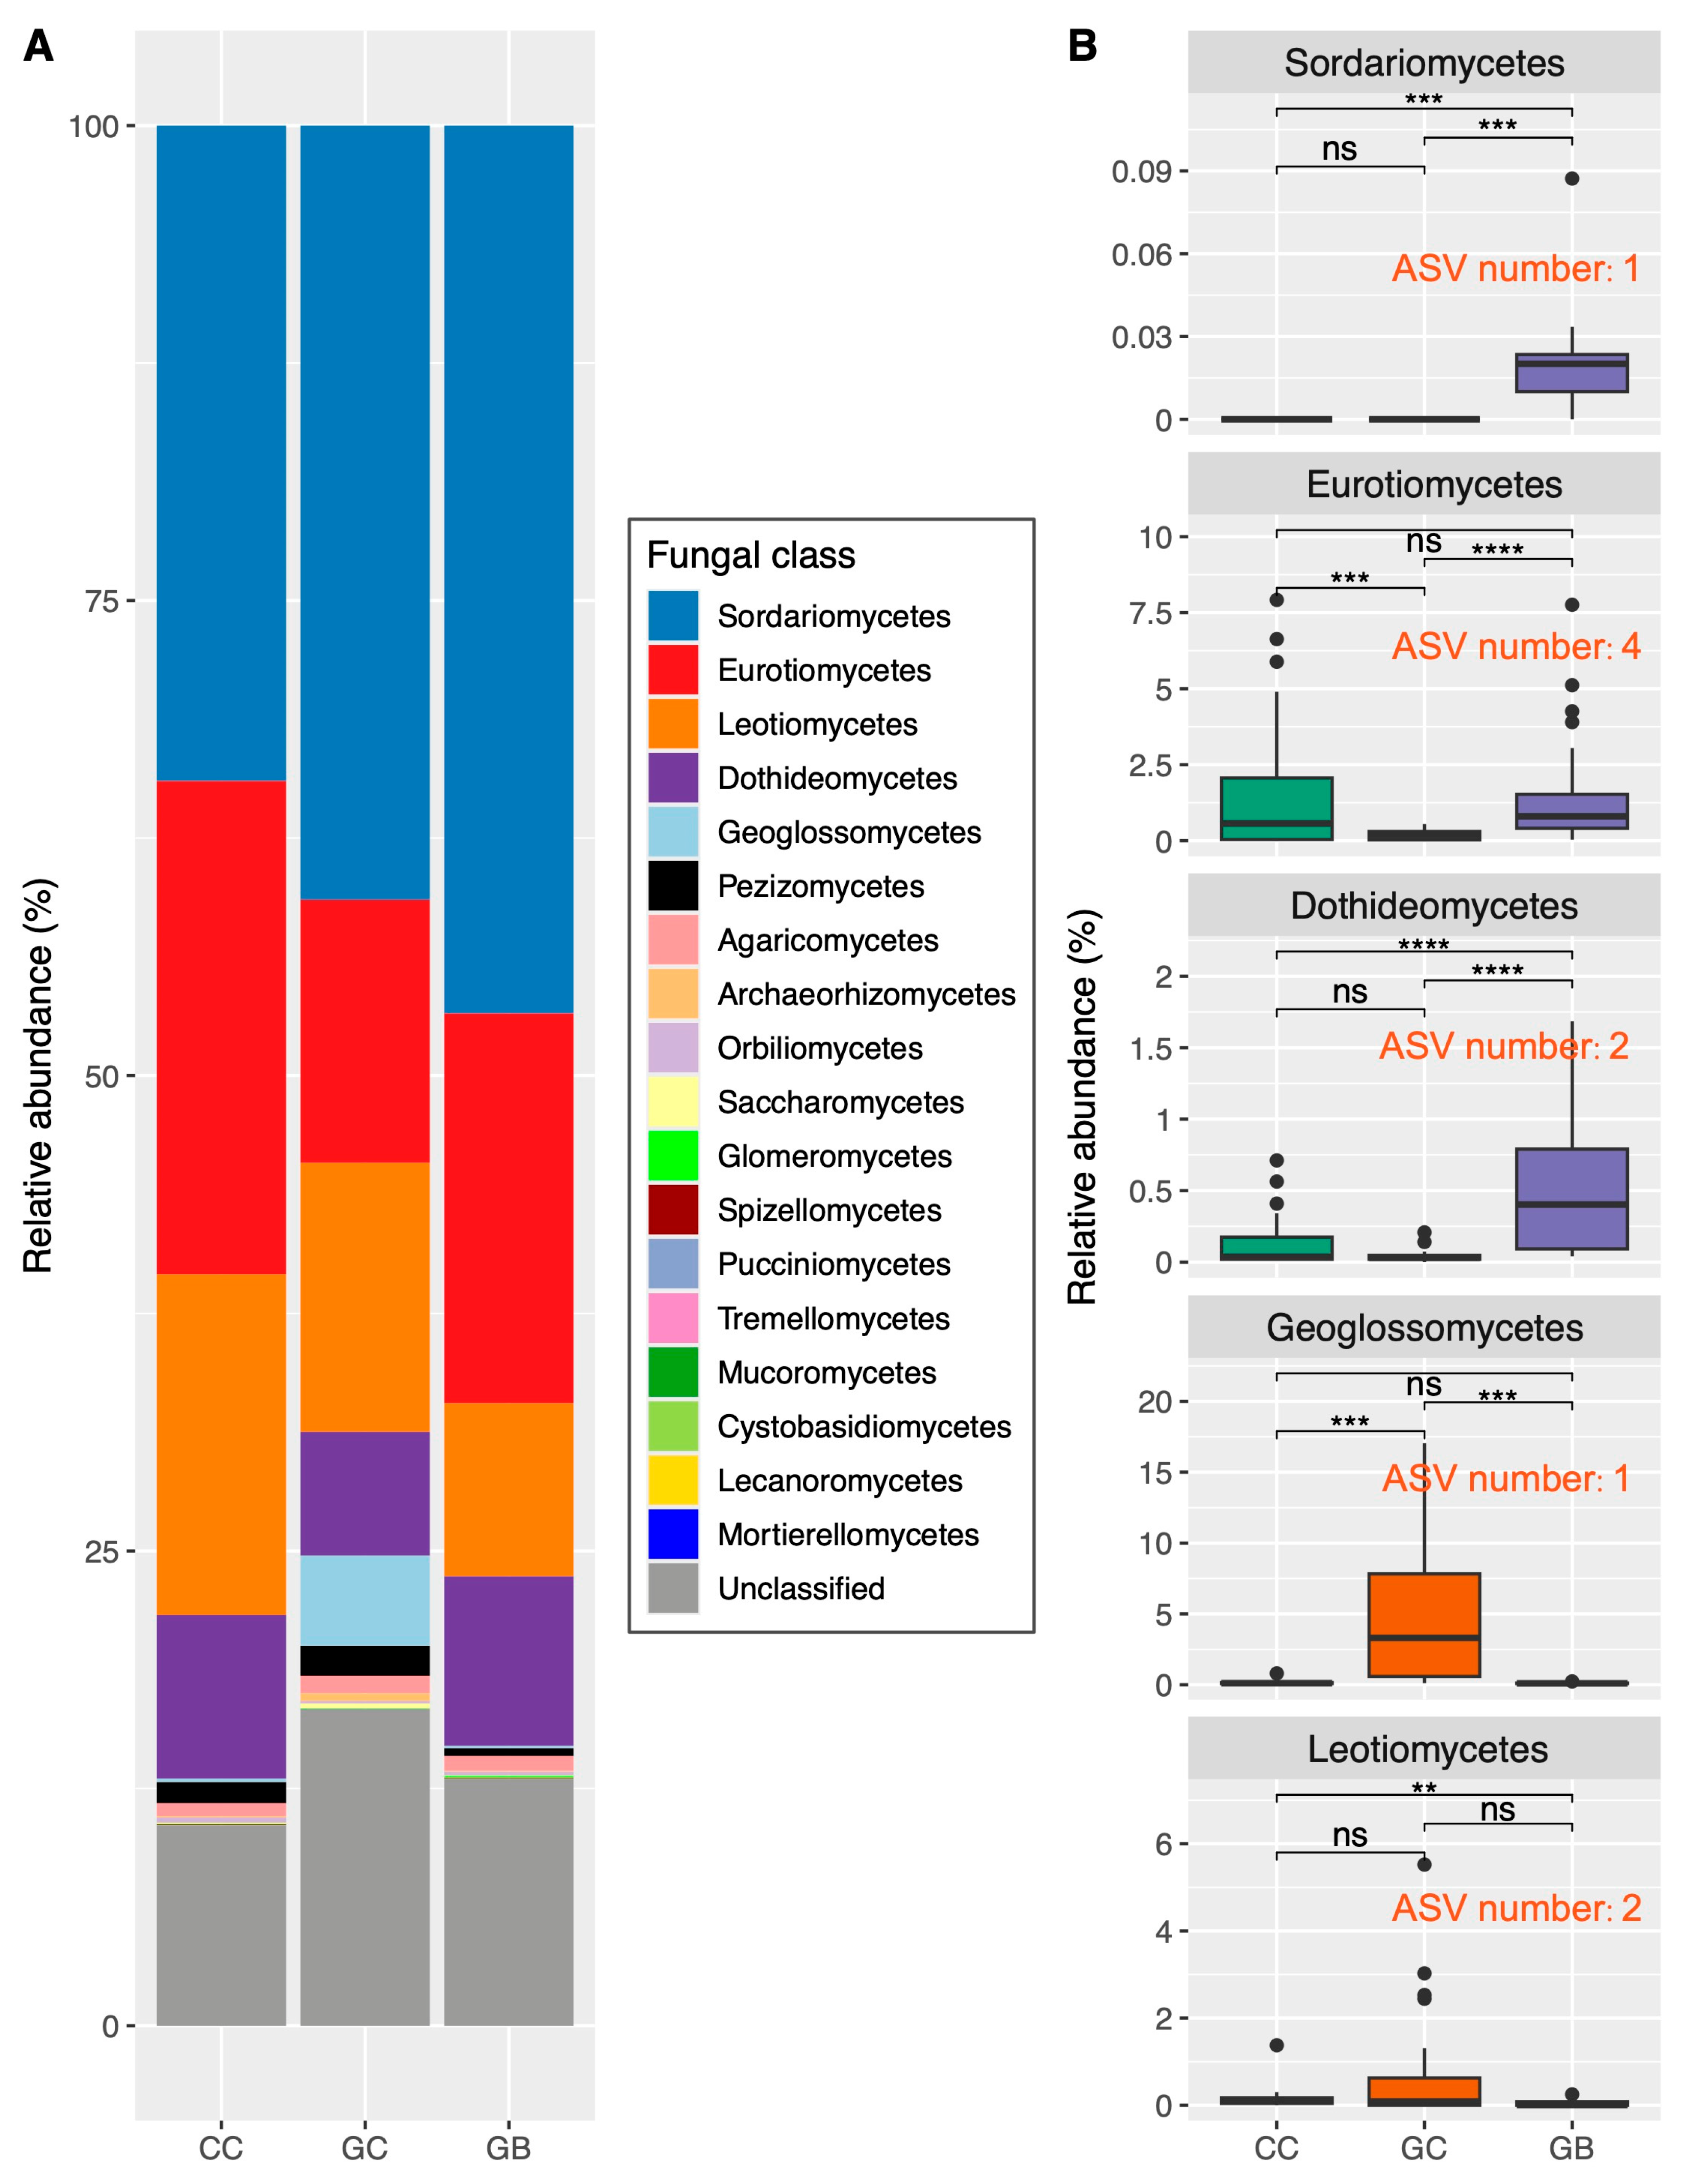
3.2. Shifts in Fungal Taxonomic Composition across Gap Locations and Associated Key Drivers

Soil fungal communities at the three gap locations were primarily composed of five class-level lineages: Sordariomycetes, Eurotiomycetes, Leotiomycetes, Dothideomycetes, and Geoglossomycetes (Figure 2A). The highest relative abundance of Sordariomycetes was found in soils at the GB, while the lowest was detected at the CC. Eurotiomycetes and Dothideomycetes were more predominant in soils at the CC and GB compared to the GC. Instead, Geoglossomycetes showed a higher relative abundance in GC soils. Leotiomycetes were more predominant in soils at the CC and GC than at the GB (Figure 2A). Differential abundance analyses based on the Random Forest algorithm identified 27 fungal ASVs which significantly varied across the three canopy gap locations (p < 0.01), in which 13 differential fungal ASVs were precisely classified into the five aforementioned class-level lineages related to saprotrophs (including soil, wood, and unspecified saprotrophs), animal parasites, and mycoparasites (Figure 2B and Figure S4).
Specifically, the relative abundances of saprotrophic Sordariomycetes and Dothideomycetes in soils at the GB were significantly higher than those at the CC and GC. Although the shifting trend across gap locations was similar, the relative abundance of saprotrophic Eurotiomycetes did not differ significantly between the CC and GB. Instead, the relative abundances of saprotrophic Geoglossomycetes and Leotiomycetes were relatively higher at the GC compared to the CC and GB, despite the fact that several differences were not statistically significant (Figure 2B). The lowest relative abundance of animal parasitic Sordariomycetes was found at the GC, while the highest relative abundance of mycoparasitic Sordariomycetes was observed at the GC (Figure S4). Correlation analysis showed that different class-level lineages responded variably to environmental changes caused by gap locations. Specifically, the relative abundances of saprotrophic Eurotiomycetes (ρ = 0.74, p < 0.05), mycoparasitic Sordariomycetes (ρ = −0.71, p < 0.05), and saprotrophic Geoglossomycetes (ρ = −0.68, p < 0.05) showed the highest correlations with SWC; the saprotrophic Leotiomycetes (ρ = −0.57, p < 0.05), saprotrophic Dothideomycetes (ρ = 0.60, p < 0.05), and animal parasitic Sordariomycetes (ρ = 0.63, p < 0.05) showed the highest correlations with RCa; and the saprotrophic Sordariomycetes (ρ = 0.74, p < 0.05) exhibited the highest correlation with STN (Figure S5). Notably, only the relative abundance of saprotrophic Sordariomycetes significantly (ρ = 0.46, p < 0.05) correlated with the decomposition rate of Toona sinensis fine roots in the present study (Figure S5).

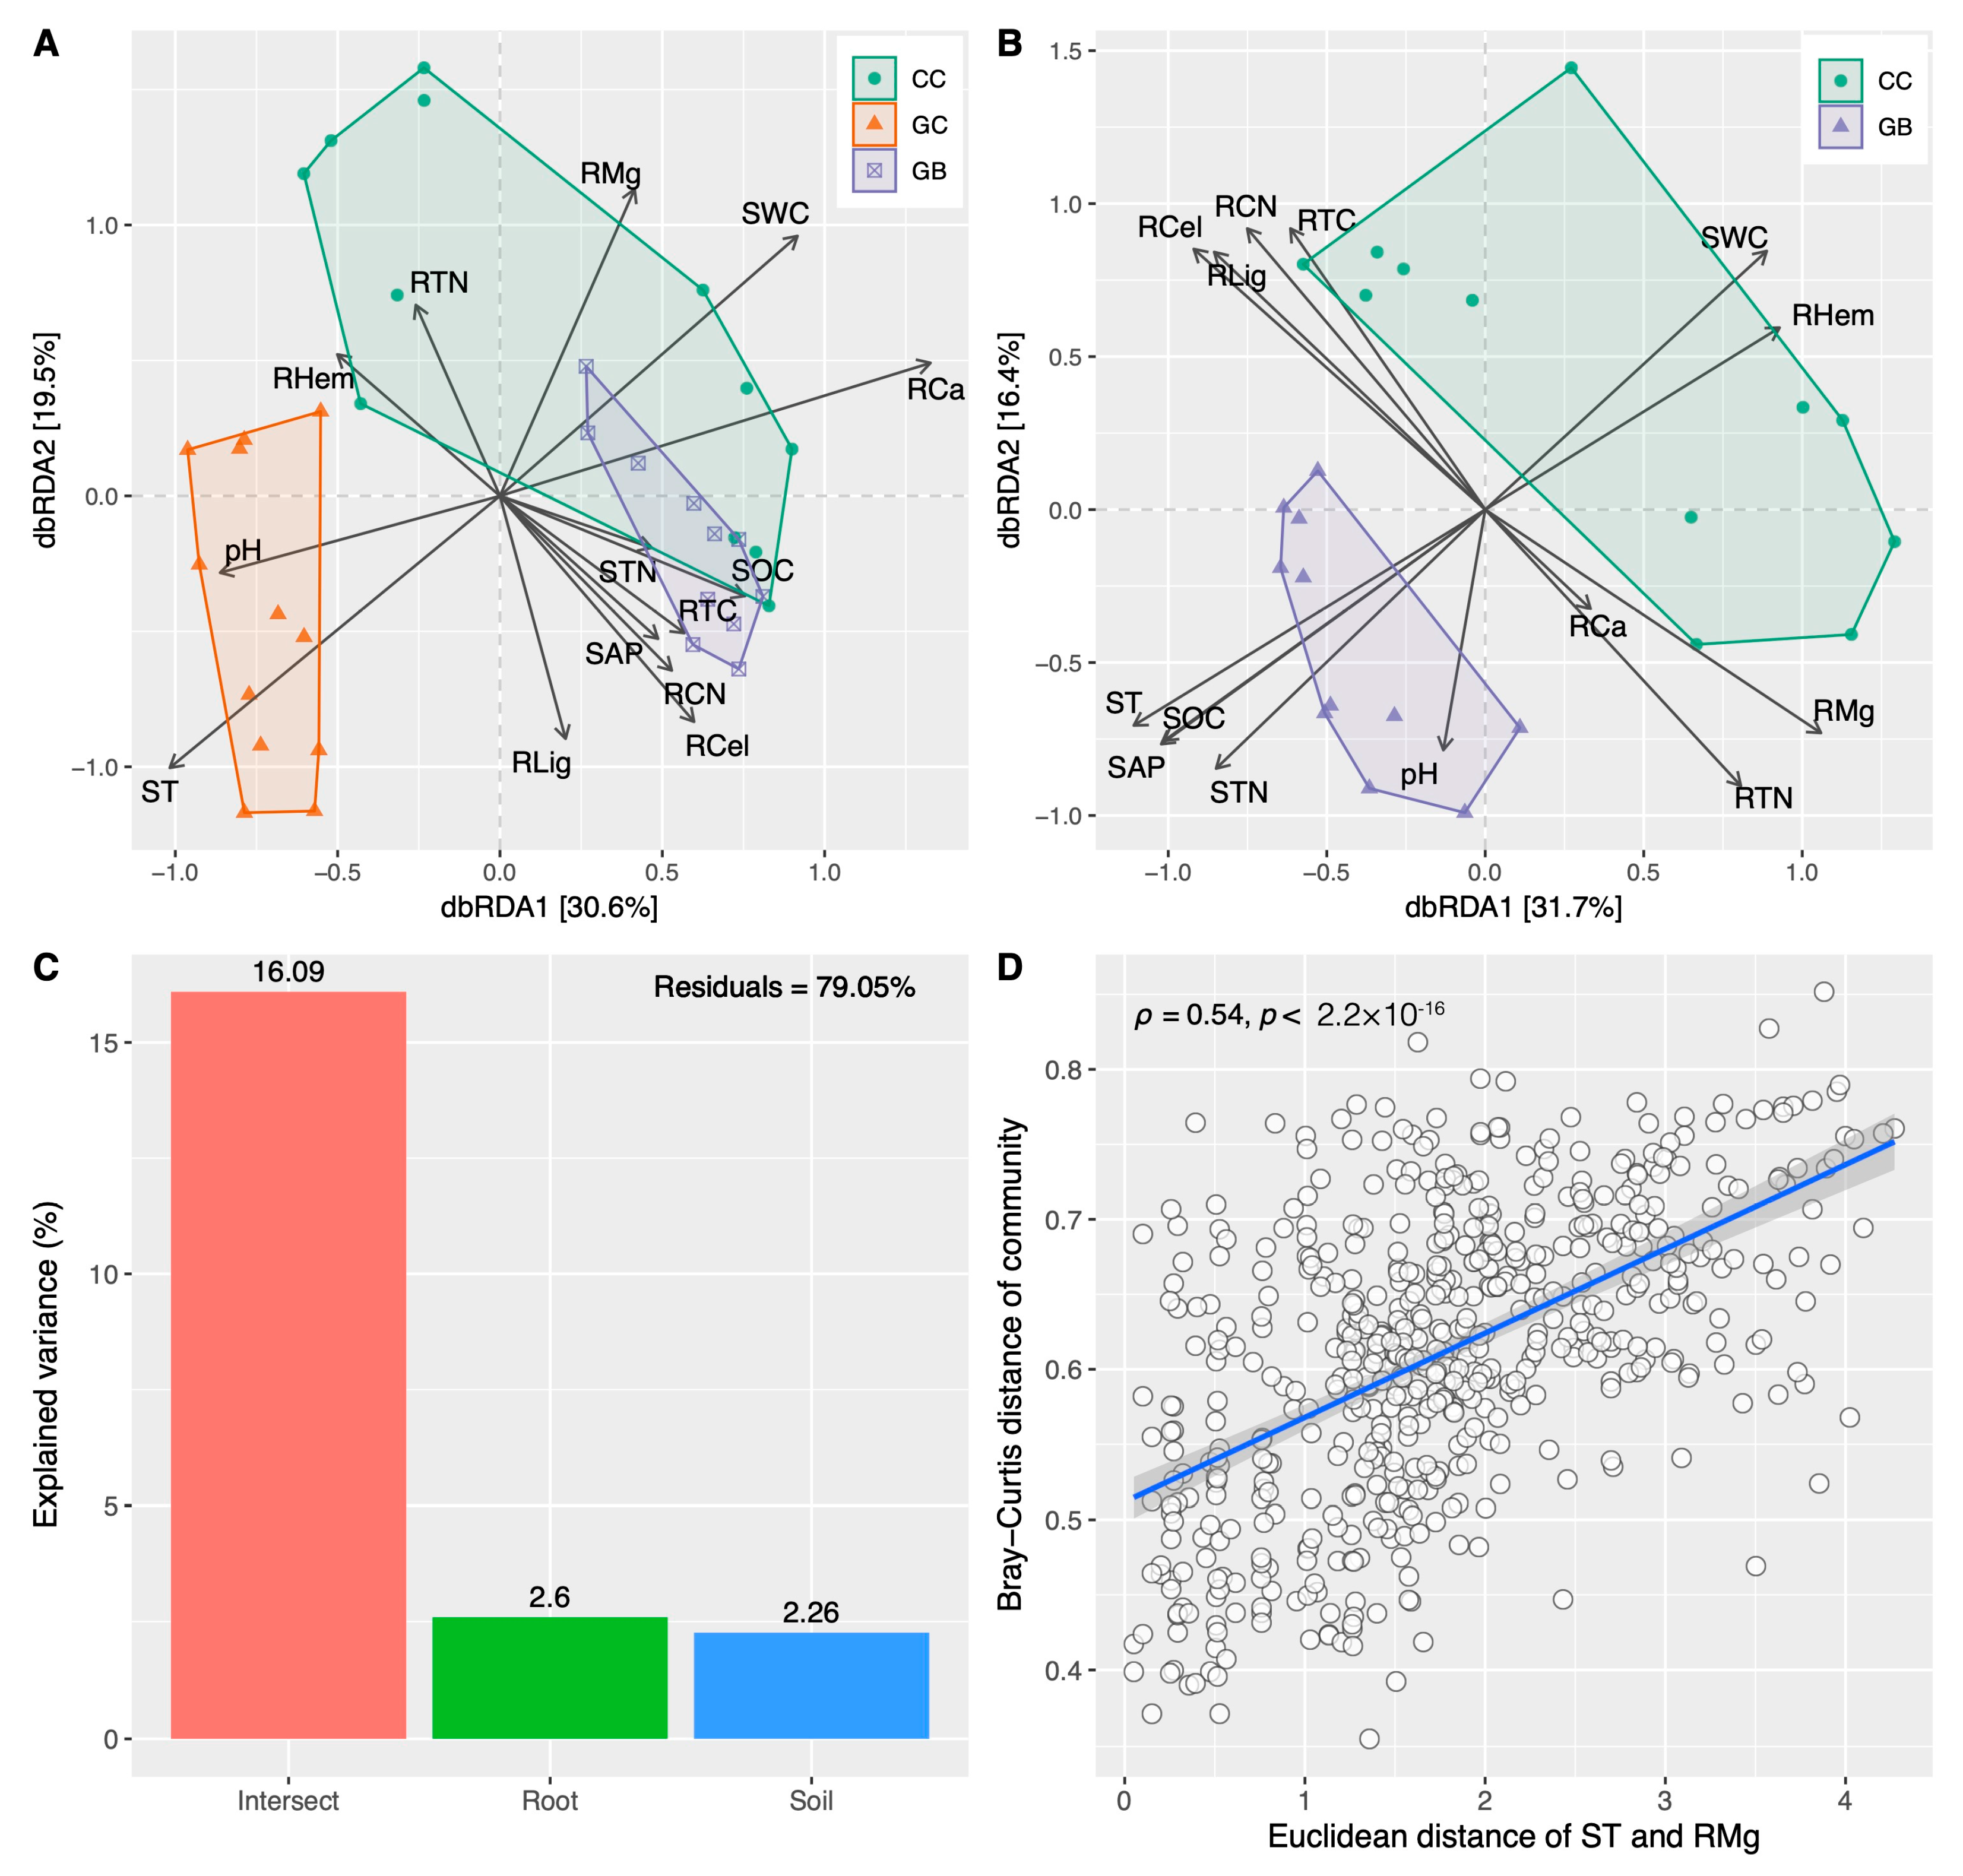
3.3. Shifts in Fungal Diversity and Community across Gap Locations and Their Key Drivers

Observed fungal ASVs (α-diversity) did not show significant differences among gap locations, although the lowest value was detected in soils at the GB (Figure 3A). The highest number of unique ASVs was found in soils at the GC, while the lowest was at the GB. The number of shared ASVs between the GB and CC, as well as between the GC and CC, was higher than that between the GC and GB (Figure 3B). Spearman rank correlation analysis did not reveal significant correlations between observed ASVs and the environmental properties measured in this study (Figure S3). The PCoA showed significant differences in fungal community structure (p < 0.001) (Figure 3C, Table S2); the highest community dispersion was observed in soils at the CC, while the lowest was at the GB (Figure 3D). Furthermore, soil fungal communities were more similar between the GB and CC than between the GC and CC (Figure 3E). The RDA showed that ST, SWC, RMg, and RCa were the key factors driving differences in fungal communities among gap locations (Figure 4A and Figure S6A). Although RCel was the most critical factor in driving the shifts of fungal communities when considering only soils collected from the CC and GB (Figure 4B and Figure S6B), the differences in SWC, RHem, ST, SOC, SAP, and STN appeared to be the primary factors driving community differences between these two gap locations (Figure 4B). Further analysis indicated that the joint effect of soil and root properties primarily impacted fungal communities among gap locations (Figure 4C), with the joint effect of ST and RMg being the most influential (Figure 4D and Figure S7).
A phylogenetic null model indicated the lowest ses.MNTD in soils at the GB and the highest at the GC (Figure 5A), suggesting more phylogenetically clustered fungal communities in soils at the GB and less phylogenetically clustered fungal communities at the GC. The median of the βNTI ranged from −2 to 2 in soils at the CC and GB, while it was less than −2 at the GC, despite the fact that there were no significant differences among gap locations (Figure 5B). When comparing the GB and CC (GB vs. CC), the median of the βNTI ranged from −2 to 2, while it was less than −2 when comparing the GC and CC (GC vs. CC) (Figure 5C). Fungal communities exhibited the highest dispersal limitation in soils at the CC, while the lowest was detected in soils at the GB. Additionally, the highest ecological drift was found in soils at the GB, contrasting with the lowest in soils at the GC; there was a relatively higher influence of homogeneous selection on fungal communities in soils at the GC compared to the CC and GB (Figure 5D). Also, the influences of homogeneous selection and dispersal limitation on communities were lower in the comparison between the GB and CC (GB vs. CC) than in the comparison between the GC and CC (GC vs. CC); the impacts of ecological drift showed an opposite trend (Figure 5E).

4. Discussion

4.1. Gap Borders Exhibit the Highest Decomposition Rate of Toona Senensis Fine Roots

Fine root decomposition, severing as a primary pathway for nutrient returning from plant tissues to the soils [8], is a complicated ecological process triangularly regulated by substrate qualities, abiotic conditions, and decomposers [8,14]. As a reforestation practice of low-efficiency plantations, creating artificial canopy gaps not only leads to environmental heterogeneity in contrast to the closed canopy area [14], but also forms varying habitats from the border to the center of a gap [17]. Despite many studies about fine root decompositions [8,9,12,40], the impacts of gap location on fine root decompositions remain elusive. In this study, the decomposition rate of Toona sinensis fine roots at the gap borders was greater than that at the centers and closed canopy areas (Figure 1C). This supports our hypothesis, and is consistent with previous studies about litter decomposition [61,62], implying an edge effect on the decomposition of Toona sinensis fine roots in low-efficiency Cupressus funebris plantations.
We also found a higher decomposition rate at closed canopy areas compared to gap centers, although the difference was not statistically significant (Figure 1C). This confirms Ni et al.’s (2016) observation of suppressed litter humification at gap centers compared to closed canopy areas after 2 years of field incubations [39]. However, regarding the impacts of gap location on litter decomposition, several studies also indicate opposite findings. For example, Li et al. (2016) suggest that gap location does not significantly impact the mass loss of foliar litters derived from cypress, Minjiang fir, larch, and red birch after one year of decompositions [63]. He et al. (2016) observed a 2-year decomposition period in alpine fir forests, finding that carbon, nitrogen, and phosphorus release rates tended to be increased from the closed canopy areas to gap centers for two types of shrub foliar litter [64]. These varying findings about litter decompositions, contrasting with our study, might be caused by a range of factors such as substrate quality, microhabitats, and decomposers [14]. However, evidence indicates that regardless of differences in microhabitats (soils without plant and soils covered by two types of plant species), the successions of soil fungal communities are closely related to the decomposition of fine roots [26]. This further stresses a need to reveal fungus-driven mechanisms regulating the decomposition of fine roots in response to canopy gap locations, rather than solely focusing on abiotic factors. It also emphasizes the importance of the present study in advancing our understanding of below-ground nutrient cycling in low-efficiency Cupressus funebris plantations subjected to gap-based reforestation practices, especially through the lens of soil fungal communities.

4.2. Saprophytic Fungi Rather Than Soil Properties Mainly Determine Fine Root Decomposition

Evidence shows that a range of abiotic conditions such as soil temperature and moisture vary across gap locations due to differences in net radiation, rainfall, and plant transpiration [32,65,66]. We observed significant shifts in soil properties across three gap locations in this study (Figures S1B and S2A). However, the decomposition rate did not significantly correlate with any soil metrics (Figure S3), despite soil properties being recognized as vital factors regulating litter or fine root decomposition [7,14]. A possible explanation for such a finding contradicting previous notions could be that we might have overlooked key soil properties closely associated with the decomposition of Toona sinensis fine roots. Another possibility is that gap locations regulate the decomposition of Toona sinensis fine root through additional mechanisms beyond the microhabitats alone, particularly in the Cupressus funebris plantations. Evidence indicates that abiotic factors closely related to gap locations, such as soil temperature and moisture, mainly affect the initial phase of fine root decomposition [15], while later decomposition phases are aided by fungi which are effective in dissolving complex substrates such as lignin and cellulose [18]. Our previous study also implies that soil fungal communities significantly varied across canopy gap locations [17]. Since our samples were collected after two years of incubation, the decomposition at this stage might be primarily driven by the fungus-mediated biological breakdown of complex substances like lignin and cellulose, rather than abiotic factors resulting from gap locations.
Yet, we did not observe significant correlations between decomposition rate and observed fungal ASVs (Figure S3), or between decomposition rate and fungal community composition (Table S3). A recent study indicates that the fungal community does not directly affect decomposition rates, but rather does so through mediating functional groups such as saprotrophs [21]. This fully supports two findings in this study. First, the relative abundances of saprotrophic Sordariomycetes, Eurotiomycetes, and Dothideomycetes showed highly similar changing patterns with decomposition rates across the three gap locations (Figure 1C and Figure 2A,B). Second, the decomposition rates positively correlated with the relative abundances of saprotrophic Sordariomycetes, while RHem negatively correlated with those of both saprotrophic Sordariomycetes and Dothideomycetes (Figure S5). Evidence shows that roots in forests are mainly decomposed by saprophytic fungi [28,29], some of which secrete enzymes that can disrupt plant cell walls [7]. Under such a scenario, our findings suggest that some saprophytic fungi primarily govern the decomposition of Toona sinensis fine roots, while abiotic conditions shaped by gap locations, e.g., ST, SWC, soil pH, SOC, STN, and SAP (Figure S5), may regulate the decomposition by affecting saprophytic fungi.

4.3. Phylogenetic Clustering Results in the Centralization of Soil Saprophytic Fungi Functions

Many studies have revealed the relationships between fungi and fine root decompositions [20,21,22,23,24,25,26,27], or highlighted the importance of saprophytic fungi in fine root decompositions [7,20,21]. Our previous study also suggests that numerous abiotic factors such as soil temperature and moisture significantly contribute to fungal community shifts across gap locations [17]. Yet, we still lack evidence to establish a link between soil fungal community shifts resulting from varying gap locations and the decomposition of fine roots. In this study, our findings suggest that the gap borders possess a high decomposition rate likely because of the centralization of functions mediated by soil fungi existing in the “microbial seed bank” or migrating from closed canopy areas. This inference confirms our hypothesis, and is supported by two pieces of evidence at least.
Firstly, fungal communities at the gap borders showed less dispersion (Figure 3C,D), and were more influenced by phylogenetic clustering (Figure 5A). Evidence shows that phylogenetic clustering is driven by the local extinction of species that are phylogenetically and functionally dissimilar to species present in the community, or the colonization of species that are phylogenetically and functionally similar to the residents [67]. We found that the relative abundance of saprophytic Sordariomycetes, which was highest at the gap borders and closely linked to the decomposition rates, exhibited the highest positive correlation with STN among all abiotic metrics (Figure 2B and Figure S5). Besides, STN showed the highest value at the gap borders (Figure S2A), and a high STN significantly influenced fungal communities at the borders (Figure 4A,B and Figure S6A,B). Evidence indicates that nitrogen application can increase the decomposition rate of fine roots [7]. This suggests that several soil saprophytic fungi involved in fine root decompositions might thrive at the gap borders, thereby enhancing decomposition rates. Given the relatively low diversity and unique ASV number at the gap borders (Figure 3A,B), it is also likely that several species have been excluded from communities in these areas. These results suggest a functional centralization of saprophytic fungi caused by phylogenetic clustering.
Secondly, soil fungal communities at the gap borders closely resembled those within the closed canopy areas, with fewer dispersal limitations between them (Figure 3C,E and Figure 5E). Evidence indicates that a dispersal limitation among local communities can allow the composition of communities to diverge through stochastic changes in local population sizes [68]. In this light, our findings suggest that soil fungal communities at the gap borders and closed canopy areas most likely shared the consequences of an ecological event caused by stochastic processes (e.g., random birth and death) with each other. This probably resulted in the high similarity in communities between the gap borders and closed canopy areas (Figure 3C,E). Given that the gap borders actually represent a remodeled environment based on closed canopy areas in this study, the assembly of soil fungal communities at the gap borders was also likely impacted by the legacy effects. That is, soil fungi participating in the functional centralizations at the gap borders likely originate from local “microbial seed bank” or migrate from closed canopy areas.

5. Conclusions

By simulating the field decomposition of Toona sinensis fine roots across three different microhabitats—gap centers, gap borders, and closed canopy areas—in a low-efficiency Cupressus funebris plantation, this study revealed how canopy gap locations influence fine root decompositions through soil fungal communities. We demonstrated that gap borders harbor a relatively high decomposition rate probably due to the centralization of functions mediated by soil fungi like saprotrophs existing in the “microbial seed bank” or migrating from closed canopy areas. This study highlights the key roles of soil fungi, especially saprotrophic fungi, in the decomposition of Toona sinensis fine roots, underscoring the significance of fungus-driven mechanisms in nutrient cycling, and providing valuable insights for forest management practices in plantations.

Supplementary Materials

The following supporting information can be downloaded at https://www.mdpi.com/article/10.3390/f15081293/s1: Figure S1: Principal coordinates analysis (PCoA) of all environmental factors (including soil properties and root nutrient content metrics) (A), soil properties (B) and root nutrient content metrics (C); Figure S2: Comparisons of soil properties (A) and root nutrient content metrics (B) among closed canopy areas (CC), gap centers (GC), and gap borders (GB) based on the pairwise Wilcoxon rank sum tests; Figure S3: Spearman rank correlations between environmental factors (including soil properties and root nutrient content metrics) and fine root decomposition rate (DRR), and observed ASVs (amplicon sequence variants); Figure S4: The relative abundance of non-saprotrophic class Sordariomycetes consisting of ASVs significantly (p < 0.01) varied across closed canopy areas (CC), gap centers (GC), and gap borders (GB); Figure S5: Spearman rank correlations between environmental factors (including decomposition rate, soil properties and root nutrient content metrics) and the relative abundance of differential lineages; Figure S6: The relative contributions of soil properties and root nutrient content metrics to the differences in fungal communities among closed canopy areas (CC), gap centers (GC) and gap borders (GB) (A), and between closed canopy areas and gap borders (B); Figure S7: Spearman rank correlations between soil fungal community and environmental factor sets (including soil properties and root nutrient content metrics); Table S1: The analysis of similarity (ANOSIM) based on Euclidean distances for all environmental factors (including soil properties and root nutrient content metrics), soil properties and root nutrient content metrics; Table S2: The analysis of similarity (ANOSIM) based on Bray-Curtis distances for soil fungal communities; Table S3: Partial mantel test between soil fungal community and environmental factors (including decomposition rate, soil properties and root nutrient content metrics) [49,50,51,69,70,71,72,73,74,75].

Author Contributions

H.L., C.L. and D.L. conceived the ideas, conducted the experiments, analyzed the data, and wrote the manuscript. X.L. revised the manuscript. A.A. contributed to field investigations. Z.H., G.L., Y.Y. and Q.W. contributed to the discussions. All authors have read and agreed to the published version of the manuscript.

Funding

This research was funded by the Natural Science Foundation of Sichuan Province (2022NSFSC1175, 2023NSFSC1194), the Innovation Team Project of Mianyang Normal University (CXTD2023LX01), the Scientific Research Initiation Project of Mianyang Normal University (QD2020A17, QD2023A01), the Sichuan Science and Technology Program (2024NSFSC0849), and the National Natural Science Foundation of China (32071747, 42307571).

Data Availability Statement

Raw ITS sequencing data have been deposited into the Sequence Read Archive (SRA, PRJNA1119707).

Acknowledgments

The authors thank the supporter of this project.

Conflicts of Interest

The authors declare no conflicts of interest.

References

  1. Muscolo, A.; Bagnato, S.; Sidari, M.; Mercurio, R. A review of the roles of forest canopy gaps. J. For. Res. 2014, 25, 725–736. [Google Scholar] [CrossRef]
  2. Nygaard, P.H.; Strand, L.T.; Stuanes, A.O. Gap formation and dynamics after long-term steady state in an old-growth Picea abies stand in Norway: Above- and belowground interactions. Ecol. Evol. 2018, 8, 462–476. [Google Scholar] [CrossRef] [PubMed]
  3. Kelemen, K.; Mihók, B.; Gálhidy, L.; Standovár, T. Dynamic response of herbaceous vegetation to gap opening in a Central European beech stand. Silva Fenn. 2012, 46, 53–65. [Google Scholar] [CrossRef]
  4. McNab, W.H.; Kilgo, J.C.; Blake, J.I.; Zarnoch, S.J. Effect of gap size on composition and structure of regeneration 19 years after harvest in a southeastern bottomland forest, USA. Can. J. For. Res. 2020, 51, 380–392. [Google Scholar] [CrossRef]
  5. Fahey, R.T.; Puettmann, K.J. Patterns in spatial extent of gap influence on understory plant communities. For. Ecol. Manag. 2008, 255, 2801–2810. [Google Scholar] [CrossRef]
  6. Tong, R.; Ji, B.; Wang, G.G.; Lou, C.; Ma, C.; Zhu, N.; Yuan, W.; Wu, T. Canopy gap impacts on soil organic carbon and nutrient dynamic: A meta-analysis. Ann. For. Sci. 2024, 81, 12. [Google Scholar] [CrossRef]
  7. Saha, S.; Huang, L.; Khoso, M.A.; Wu, H.; Han, D.; Ma, X.; Poudel, T.R.; Li, B.; Zhu, M.; Lan, Q.; et al. Fine root decomposition in forest ecosystems: An ecological perspective. Front. Plant Sci. 2023, 14, 1277510. [Google Scholar] [CrossRef]
  8. Zhao, R.; Zhu, Y.-j.; Mao, Z.; Gu, W.; Zhang, H.; Long, F.; Sun, T. Predicting fine root decomposition from functional traits in 10 temperate tree species. Forests 2023, 14, 372. [Google Scholar] [CrossRef]
  9. Fujimaki, R.; Takeda, H.; Wiwatiwitaya, D. Fine root decomposition in tropical dry evergreen and dry deciduous forests in Thailand. J. For. Res. 2008, 13, 338–346. [Google Scholar] [CrossRef]
  10. Hobbie, S.; Oleksyn, J.; Eissenstat, D.; Reich, P. Fine root decomposition rates do not mirror those of leaf litter among temperate tree species. Oecologia 2009, 162, 505–513. [Google Scholar] [CrossRef]
  11. Wang, H.; Liu, S.; Mo, J. Correlation between leaf litter and fine root decomposition among subtropical tree species. Plant Soil 2010, 335, 289–298. [Google Scholar] [CrossRef]
  12. Zhang, Y.; Xiao, L.; Guan, D.; Chen, Y.; Motelica-Heino, M.; Peng, Y.; Lee, S.Y. The role of mangrove fine root production and decomposition on soil organic carbon component ratios. Ecol. Indic. 2021, 125, 107525. [Google Scholar] [CrossRef]
  13. Huang, Y.; Yang, X.; Zhang, D.-j.; Zhang, J. The effects of gap size and litter species on colonization of soil fauna during litter decomposition in Pinus massoniana plantations. Appl. Soil Ecol. 2020, 155, 103611. [Google Scholar] [CrossRef]
  14. Chen, J.; Zhu, J.; Wang, Z.; Xing, C.; Chen, B.; Wang, X.; Wei, C.; Liu, J.-f.; He, Z.-s.; Xu, D.-w. Canopy gaps control litter decomposition and nutrient release in subtropical forests. Forests 2023, 14, 673. [Google Scholar] [CrossRef]
  15. He, L.; Jia, Z.; Li, Q.-X.; Feng, L.; Yang, K. Fine-root decomposition characteristics of four typical shrubs in sandy areas of an arid and semiarid alpine region in western China. Ecol. Evol. 2019, 9, 5407–5419. [Google Scholar] [CrossRef]
  16. Zhao, B.; Xing, P.; Wu, Q.L. Interactions between bacteria and fungi in macrophyte leaf litter decomposition. Environ. Microbiol. 2020, 23, 1130–1144. [Google Scholar] [CrossRef]
  17. Li, D.; Li, X.; Su, Y.; Li, X.; Yin, H.; Li, X.; Guo, M.; He, Y. Forest gaps influence fungal community assembly in a weeping cypress forest. Appl. Microbiol. Biotechnol. 2019, 103, 3215–3224. [Google Scholar] [CrossRef]
  18. Bonfante, P.; Genre, A. Mechanisms underlying beneficial plant-fungus interactions in mycorrhizal symbiosis. Nat. Commun. 2010, 1, 48. [Google Scholar] [CrossRef] [PubMed]
  19. Schädler, M.; Brandl, R.; Kempel, A. “Afterlife” effects of mycorrhization on the decomposition of plant residues. Soil Biol. Biochem. 2010, 42, 521–523. [Google Scholar] [CrossRef]
  20. Argiroff, W.A.; Zak, D.; Upchurch, R.; Pellitier, P.; Belke, J.P. Fungal community composition and genetic potential regulate fine root decay in northern temperate forests. Mol. Ecol. 2023, 32, 2005–2021. [Google Scholar] [CrossRef] [PubMed]
  21. Cheng, X.; Jiang, S.; El-Naggar, A.; Tang, Y.; Liu, X.; Zhang, J. Dynamics of fine root decomposition in different vegetation types: Investigating the impact of soil fungal communities and enzyme activities. Forests 2023, 14, 1321. [Google Scholar] [CrossRef]
  22. Fahey, T.; Fahey, C.; Goebel, M.; Antunes, P.M.; Yavitt, J. Fine root decomposition and macronutrient release in temperate forests: Examining the litter bag and intact soil core approaches and their relationship with fungal community composition. Appl. Soil Ecol. 2024, 193, 105147. [Google Scholar] [CrossRef]
  23. Fisk, M.; Fahey, T.; Sobieraj, J.; Staniec, A.C.; Crist, T.O. Rhizosphere disturbance influences fungal colonization and community development on dead fine roots. Plant Soil 2011, 341, 279–293. [Google Scholar] [CrossRef]
  24. Gray, L.; Kernaghan, G. Fungal succession during the decomposition of ectomycorrhizal fine roots. Microb. Ecol. 2019, 79, 271–284. [Google Scholar] [CrossRef] [PubMed]
  25. Kohout, P.; Charvátová, M.; Štursová, M.; Mašínová, T.; Tomšovský, M.; Baldrian, P. Clearcutting alters decomposition processes and initiates complex restructuring of fungal communities in soil and tree roots. ISME J. 2018, 12, 692–703. [Google Scholar] [CrossRef]
  26. Kohout, P.; Sudová, R.; Brabcová, V.; Vosolsobě, S.; Baldrian, P.; Albrechtová, J. Forest microhabitat affects succession of fungal communities on decomposing fine tree roots. Front. Microbiol. 2021, 12, 541583. [Google Scholar] [CrossRef] [PubMed]
  27. Li, A.; Fahey, T.; Pawlowska, T.; Fisk, M.; Burtis, J. Fine root decomposition, nutrient mobilization and fungal communities in a pine forest ecosystem. Soil Biol. Biochem. 2015, 83, 76–83. [Google Scholar] [CrossRef]
  28. Baldrian, P. Forest microbiome: Diversity, complexity and dynamics. FEMS Microbiol. Rev. 2016, 41, 109–130. [Google Scholar] [CrossRef] [PubMed]
  29. Purahong, W.; Wubet, T.; Lentendu, G.; Schloter, M.; Pecyna, M.; Kapturska, D.; Hofrichter, M.; Krüger, D.; Buscot, F. Life in leaf litter: Novel insights into community dynamics of bacteria and fungi during litter decomposition. Mol. Ecol. 2016, 25, 4059–4074. [Google Scholar] [CrossRef]
  30. Zhang, Q.; Zak, J.C. Effects of gap size on litter decomposition and microbial activity in a subtropical forest. Ecology 1995, 76, 2196–2204. [Google Scholar] [CrossRef]
  31. Xu, J.; Xue, L.; Su, Z. Impacts of forest gaps on soil properties after a severe ice storm in a Cunninghamia lanceolata Stand. Pedosphere 2016, 26, 408–416. [Google Scholar] [CrossRef]
  32. Sariyildiz, T. Effects of gap-size classes on long-term litter decomposition rates of beech, oak and chestnut species at high elevations in Northeast Turkey. Ecosystems 2008, 11, 841–853. [Google Scholar] [CrossRef]
  33. Ritter, E. Litter decomposition and nitrogen mineralization in newly formed gaps in a Danish beech (Fagus sylvatica) forest. Soil Biol. Biochem. 2005, 37, 1237–1247. [Google Scholar] [CrossRef]
  34. Prescott, C.E.; Hope, G.D.; Blevins, L.L. Effect of gap size on litter decomposition and soil nitrate concentrations in a high-elevation spruce fir forest. Can. J. For. Res. 2003, 33, 2210–2220. [Google Scholar] [CrossRef]
  35. Muscolo, A.; Sidari, M.; Mercurio, R. Influence of gap size on organic matter decomposition, microbial biomass and nutrient cycle in Calabrian pine (Pinus laricio, Poiret) stands. For. Ecol. Manag. 2007, 242, 412–418. [Google Scholar] [CrossRef]
  36. Han, M.; Tang, M.; Shi, B.; Jin, G. Effect of canopy gap size on soil respiration in a mixed broadleaved-Korean pine forest: Evidence from biotic and abiotic factors. Eur. J. Soil Biol. 2020, 99, 103194. [Google Scholar] [CrossRef]
  37. Denslow, J.; Ellison, A.; Sanford, R.E. Treefall gap size effects on above- and below-ground processes in a tropical wet forest. J. Ecol. 1998, 86, 597–609. [Google Scholar] [CrossRef]
  38. Scharenbroch, B.; Bockheim, J. Impacts of forest gaps on soil properties and processes in old growth northern hardwood-hemlock forests. Plant Soil 2007, 294, 219–233. [Google Scholar] [CrossRef]
  39. Ni, X.; Yang, W.; Tan, B.; Li, H.; He, J.; Xu, L.; Wu, F. Forest gaps slow the sequestration of soil organic matter: A humification experiment with six foliar litters in an alpine forest. Sci. Rep. 2016, 6, 19744. [Google Scholar] [CrossRef] [PubMed]
  40. Yuan, Z.; Chen, H.Y. Fine root dynamics with stand development in the boreal forest. Funct. Ecol. 2012, 26, 991–998. [Google Scholar] [CrossRef]
  41. Wang, G.; Liu, F. The influence of gap creation on the regeneration of Pinus tabuliformis planted forest and its role in the near-natural cultivation strategy for planted forest management. For. Ecol. Manag. 2011, 262, 413–423. [Google Scholar] [CrossRef]
  42. Pregitzer, K.S.; DeForest, J.L.; Burton, A.J.; Allen, M.F.; Ruess, R.W.; Hendrick, R.L. Fine root architecture of nine north American trees. Ecol. Monogr. 2002, 72, 293–309. [Google Scholar] [CrossRef]
  43. Li, C.; Liao, H.; Li, D.; Jing, Y. Abundant species govern the altitude patterns of bacterial community in natural and disturbed subalpine forest soils. Diversity 2024, 16, 242. [Google Scholar] [CrossRef]
  44. Olsen, S.R. Estimation of Available Phosphorus in Soils by Extraction with Sodium Bicarbonate; US Department of Agriculture: Washington, DC, USA, 1954.
  45. Brändli, R.C.; Bergsli, A.; Ghosh, U.; Hartnik, T.; Breedveld, G.D.; Cornelissen, G. Quantification of activated carbon contents in soils and sediments using chemothermal and wet oxidation methods. Environ. Pollut. 2009, 157, 3465–3470. [Google Scholar] [CrossRef]
  46. Bremner, J. Total nitrogen. In Methods of Soil Analysis: Part 2 Chemical and Microbiological Properties; American Society of Agronomy, Soil Science Society of America: Madison, WI, USA, 1965; Volume 9, pp. 1149–1178. [Google Scholar]
  47. Rowland, A.; Roberts, J.D. Lignin and cellulose fractionation in decomposition studies using acid-detergent fibre methods. Commun. Soil Sci. Plant Anal. 1994, 25, 269–277. [Google Scholar] [CrossRef]
  48. Blumenkrantz, N.; Asboe-Hansen, G. New method for quantitative determination of uronic acids. Anal. Biochem. 1973, 54, 484–489. [Google Scholar] [CrossRef] [PubMed]
  49. Li, C.; Liao, H.; Li, D.; Jing, Y. The fungal functional guilds at the early-stage restoration of subalpine forest soils disrupted by highway construction in Southwest China. Forests 2024, 15, 636. [Google Scholar] [CrossRef]
  50. Bolyen, E.; Rideout, J.R.; Dillon, M.R.; Bokulich, N.A.; Abnet, C.C.; Al-Ghalith, G.A.; Alexander, H.; Alm, E.J.; Arumugam, M.; Asnicar, F.; et al. Reproducible, interactive, scalable and extensible microbiome data science using QIIME 2. Nat. Biotechnol. 2019, 37, 852–857. [Google Scholar] [CrossRef]
  51. Nilsson, R.H.; Larsson, K.; Taylor, A.F.S.; Bengtsson-Palme, J.; Jeppesen, T.; Schigel, D.; Kennedy, P.; Picard, K.T.; Glöckner, F.; Tedersoo, L.; et al. The UNITE database for molecular identification of fungi: Handling dark taxa and parallel taxonomic classifications. Nucleic Acids Res. 2018, 47, D259–D264. [Google Scholar] [CrossRef]
  52. Li, C.; Liu, C.; Li, H.; Liao, H.; Xu, L.; Yao, M.; Li, X. The microgeo: An R package rapidly displays the biogeography of soil microbial community traits on maps. FEMS Microbiol. Ecol. 2024, 100, fiae087. [Google Scholar] [CrossRef]
  53. Kembel, S.W.; Cowan, P.D.; Helmus, M.R.; Cornwell, W.K.; Morlon, H.; Ackerly, D.D.; Blomberg, S.P.; Webb, C.O. Picante: R tools for integrating phylogenies and ecology. Bioinformatics 2010, 26, 1463–1464. [Google Scholar] [CrossRef] [PubMed]
  54. Tripathi, B.M.; Stegen, J.C.; Kim, M.; Dong, K.; Adams, J.M.; Lee, Y.K. Soil pH mediates the balance between stochastic and deterministic assembly of bacteria. ISME J. 2018, 12, 1072–1083. [Google Scholar] [CrossRef] [PubMed]
  55. Ning, D.L.; Yuan, M.T.; Wu, L.W.; Zhang, Y.; Guo, X.; Zhou, X.S.; Yang, Y.F.; Arkin, A.P.; Firestone, M.K.; Zhou, J.Z. A quantitative framework reveals ecological drivers of grassland microbial community assembly in response to warming. Nat. Commun. 2020, 11, e4717. [Google Scholar] [CrossRef] [PubMed]
  56. Stegen, J.C.; Lin, X.; Konopka, A.E.; Fredrickson, J.K. Stochastic and deterministic assembly processes in subsurface microbial communities. ISME J. 2012, 6, 1653–1664. [Google Scholar] [CrossRef] [PubMed]
  57. Liu, C.; Cui, Y.; Li, X.; Yao, M. microeco: An R package for data mining in microbial community ecology. FEMS Microbiol. Ecol. 2021, 97, fiaa255. [Google Scholar] [CrossRef] [PubMed]
  58. Põlme, S.; Abarenkov, K.; Henrik Nilsson, R.; Lindahl, B.D.; Clemmensen, K.E.; Kauserud, H.; Nguyen, N.; Kjøller, R.; Bates, S.T.; Baldrian, P.; et al. FungalTraits: A user-friendly traits database of fungi and fungus-like stramenopiles. Fungal Divers. 2020, 105, 1–16. [Google Scholar] [CrossRef]
  59. Dixon, P. VEGAN, a package of R functions for community ecology. J. Veg. Sci. 2003, 14, 927–930. [Google Scholar] [CrossRef]
  60. Wickham, H. ggplot2: Elegant Graphics for Data Analysis; Springer: Berlin/Heidelberg, Germany, 2016. [Google Scholar]
  61. Remy, E.; Wuyts, K.; Nevel, L.v.; Smedt, P.D.; Boeckx, P.; Verheyen, K. Driving factors behind litter decomposition and nutrient release at temperate forest edges. Ecosystems 2017, 21, 755–771. [Google Scholar] [CrossRef]
  62. Zhang, Y.; Zhang, D.J.; Li, X.; Liu, H.; Zhang, M.J.; Yang, W.Q.; Zhang, J. Edge effects of forest gap in Pinus massoniana plantations on the decomposition of leaf litter recalcitrant components of Cinnamomum camphora and Toona ciliata. Ying Yong Sheng Tai Xue Bao 2016, 27, 1116–1124. [Google Scholar]
  63. Li, H.; Wu, F.; Yang, W.; Xu, L.; Ni, X.; He, J.; Tan, B.; Hu, Y. Effects of forest gaps on litter lignin and cellulose dynamics vary seasonally in an alpine forest. Forests 2016, 7, 27. [Google Scholar] [CrossRef]
  64. He, W.; Wu, F.; Yang, W.; Zhang, D.; Xu, Z.; Tan, B.; Zhao, Y.; Justine, M.F. Gap locations influence the release of carbon, nitrogen and phosphorus in two shrub foliar litter in an alpine fir forest. Sci. Rep. 2016, 6, 22014. [Google Scholar] [CrossRef]
  65. Ritter, E.; Dalsgaard, L.; Einhorn, K. Light, temperature and soil moisture regimes following gap formation in a semi-natural beech-dominated forest in Denmark. For. Ecol. Manag. 2005, 206, 15–33. [Google Scholar] [CrossRef]
  66. Zhu, J.; Matsuzaki, T.; Lee, F.-q.; Gonda, Y. Effect of gap size created by thinning on seedling emergency, survival and establishment in a coastal pine forest. For. Ecol. Manag. 2003, 182, 339–354. [Google Scholar] [CrossRef]
  67. Li, S.-P.; Cadotte, M.W.; Meiners, S.J.; Hua, Z.-S.; Jiang, L.; Shu, W.-S. Species colonisation, not competitive exclusion, drives community overdispersion over long-term succession. Ecol. Lett. 2015, 18, 964–973. [Google Scholar] [CrossRef] [PubMed]
  68. Stegen, J.C.; Lin, X.; Fredrickson, J.K.; Chen, X.; Kennedy, D.W.; Murray, C.J.; Rockhold, M.L.; Konopka, A. Quantifying community assembly processes and identifying features that impose them. ISME J. 2013, 7, 2069–2079. [Google Scholar] [CrossRef] [PubMed]
  69. Žifčáková, L.; Větrovský, T.; Howe, A.; Baldrian, P. Microbial activity in forest soil reflects the changes in ecosystem properties between summer and winter. Environ. Microbiol. 2015, 18, 288–301. [Google Scholar] [CrossRef]
  70. Rognes, T.; Flouri, T.; Nichols, B.; Quince, C.; Mahé, F. VSEARCH: A versatile open source tool for metagenomics. PeerJ 2016, 4, e2584. [Google Scholar] [CrossRef] [PubMed]
  71. Callahan, B.; McMurdie, P.J.; Rosen, M.J.; Han, A.W.; Johnson, A.J.; Holmes, S.P. DADA2: High resolution sample inference from Illumina amplicon data. Nat. Methods 2016, 13, 581–583. [Google Scholar] [CrossRef]
  72. Thompson, L.R.; Sanders, J.G.; McDonald, D.; Amir, A.; Ladau, J.; Locey, K.J.; Prill, R.J.; TripathI, A.; Gibbons, S.M.; Ackermann, G.; et al. A communal catalogue reveals Earth’s multiscale microbial diversity. Nature 2017, 551, 457–463. [Google Scholar] [CrossRef]
  73. Katoh, K.; Misawa, K.; Kuma, K.; Miyata, T. MAFFT: A novel method for rapid multiple sequence alignment based on fast Fourier transform. Nucleic Acids Res. 2002, 30, 3059–3066. [Google Scholar] [CrossRef]
  74. Price, M.N.; Dehal, P.S.; Arkin, A.P. FastTree: Computing large minimum evolution trees with profiles instead of a distance matrix. Mol. Biol. Evol. 2009, 26, 1641–1650. [Google Scholar] [CrossRef] [PubMed]
  75. Price, M.N.; Dehal, P.S.; Arkin, A.P. FastTree 2–approximately maximum-likelihood trees for large alignments. PLoS ONE 2010, 5, e9490. [Google Scholar] [CrossRef] [PubMed]
Figure 1. Experimental designs (A) in this study, the definition of gap centers (GC) and borders (GB) (B), the decomposition rate of Chinese Toon (Toona sinensis) fine roots (C), and the relationships between decomposition rate and the nutrient content in residual roots (D). ρ-values and p-values in panel (D) represent Spearman rank correlation coefficients and associated significance, respectively. RLig: lignin content in residual roots; RTN: total nitrogen in residual roots; RTC: total carbon in residual roots; RCN: the ratio of RTC to RTN; RMg: magnesium content in residual roots; and RCel: cellulose content in residual roots. CC: closed canopy areas; * p < 0.05. A symbol of “ns” represents a p-value greater than 0.05.
Forests 15 01293 g001
Figure 2. Taxonomic composition of soil fungal communities at class level (A) and the relative abundance of five class-level saprotrophic lineages consisting of ASVs varied significantly (p < 0.01) across closed canopy areas (CC), gap centers (GC), and gap borders (GB) (B). The numbers with an orange color in panel (B) represent the numbers of ASVs identified for each class-level saprotrophic lineage. A symbol of “ns” indicates a p-value greater than 0.05. ASV: amplicon sequence variants. ** p < 0.01, *** p < 0.001, **** p < 0.0001.
Forests 15 01293 g002
Figure 3. Shifts in observed fungal ASVs across the microhabitats of closed canopy areas (CC), gap centers (GC), and gap borders (GB) (A), unique ASVs in each microhabitat and shared ones between or among microhabitats (B), principal coordinates analysis (PCoA) of soil fungal communities based on Bray–Curtis distances (C), and the comparison of Bray–Curtis distances within each microhabitat (D), and between microhabitats (E). A symbol of “ns” in panel (A) and panel (D) indicates a p-value greater than 0.05. Numbers in panel (B) represent the ASV numbers. FCM: fungal community; ASV: amplicon sequence variant. **** p < 0.0001.
Forests 15 01293 g003
Figure 4. Redundancy analysis (RDA, Bray−Curtis distance) for fungal communities in soils at closed canopy areas (CC), gap centers (GC), and gap borders (GB) (A,B), variance partitioning analysis (VPA) for fungal communities (C), and the relationship between the Bray−Curtis distances of fungal communities and the Euclidean distances of soil temperature (ST) and magnesium content in residual roots (RMg) (D). The numbers on the top of bars in panel (C) represent the explained proportions of fungal community differences. ρ-values and p-values in panel (D) represent Spearman correlation coefficient and associated significance, respectively. ST: soil temperature; SWC: soil moisture content; SOC: soil total organic carbon; STN: soil total nitrogen; SAP: soil available phosphorus; RTC: root total carbon; RTN: root total nitrogen; RCN: the ratio of RTC to RTN; RCa: root calcium content; RMg: root magnesium content; RLig: root lignin content; RCel: root cellulose content; and RHem: root hemicellulose content.
Forests 15 01293 g004
Figure 5. The standardized effect size measurement of the mean nearest taxon distance (ses.MNTD) (A) and β-nearest taxon index (βNTI) (B) within the microhabitats of closed canopy areas (CC), gap centers (GC), and gap borders (GB), the βNTI between the GC and CC, and the GB and CC (C), and the community assembling processes within each microhabitat (D) and between microhabitats (E). A symbol of “ns” in panels (AC) represents a p-value greater than 0.05. * p < 0.05.
Forests 15 01293 g005
Disclaimer/Publisher’s Note: The statements, opinions and data contained in all publications are solely those of the individual author(s) and contributor(s) and not of MDPI and/or the editor(s). MDPI and/or the editor(s) disclaim responsibility for any injury to people or property resulting from any ideas, methods, instructions or products referred to in the content.

