Article

Observed Vertical Dispersion Patterns of Particulate Matter in Urban Street Canyons and Dominant Influencing Factors

1
School of Environmental Art, Hubei Institute of Fine Arts, Wuhan 430202, China
2
Department of Biology Sciences, Institute of Environment Sciences, University of Quebec at Montreal, Montreal, QC H3C 3P8, Canada
3
College of Urban and Rural Construction, Shanxi Agricultural University, Jinzhong 030810, China
4
Soil and Water Conservation Department, Changjiang River Scientific Research Institute, Wuhan 430010, China
5
College of Horticulture and Forestry Sciences/Hubei Engineering Technology Research Center for Forestry Information, Huazhong Agricultural University, Wuhan 430070, China
6
School of Geographic Sciences, Hunan Normal University, Changsha 410081, China
*
Authors to whom correspondence should be addressed.
Forests 2024, 15(8), 1319; https://doi.org/10.3390/f15081319 (registering DOI)
Submission received: 22 June 2024 / Revised: 25 July 2024 / Accepted: 27 July 2024 / Published: 29 July 2024

Abstract

:
When developing strategies aimed at mitigating air pollution in densely populated urban areas, it is vital to accurately investigate the vertical distribution of airborne particulate matter (PM) and its primary influencing factors. For this study, field experiments were conducted to quantify the vertical distribution and dispersion processes of PM at five vertical heights related to trees—including at street level near vehicular emission sources (0.3 m), pedestrian breathing height (1.5 m), beneath the canopy (6 m), mid-canopy (9 m), and the top of the canopy (12 m)—within a street-facing building in Wuhan, China. Comparing the vertical dispersion patterns of PM with six particle sizes (PM1, PM2.5, PM4, PM7, PM10, and total suspended particulates—TSPs), larger particles exhibited more pronounced variations with height, notably TSPs (correlation coefficient of −0.95) and PM10 (−0.84). The findings consistently revealed a downward trend in PM concentrations across various particle sizes with increasing height, indicating a negative linear correlation between particle concentrations and altitude within the street canyon. For every 1% increase in vertical height, the PM2.5 concentration decreased by approximately 5.44%, the PM10 concentration decreased by 132.1%, and the TSP concentration decreased by 180.6%. These findings show potential for guiding building designers in developing effective strategies, such as optimal vent placement, in order to mitigate the intrusion of outdoor air pollution—particularly PM2.5—into indoor environments. Furthermore, this research provides novel insights for residents living in street-facing buildings and individuals with respiratory diseases, aiding them in the selection of residential floors to minimize health risks associated with exposure to respirable PM.

1. Introduction

Under conditions of vertical homogeneity and turbulence, pollutants disperse vertically from street canyons to the free-surface layer [1,2,3]. However, regardless of factors such as prevailing wind conditions and the presence of trees, hedges, or vegetation, only a minimal proportion of PM2.5 (about 0.1%–3%) disperses to the free-surface layer, while the majority (approximately 97%) is retained within the street canyon [4,5]. Due to difficulties related to data collection, air pollution assessments in urban areas often neglect the vertical distribution of atmospheric particulate matter (PM), leading to miscalculation of the pollution exposure for residents living on different floors along the vertical axis [6,7]. This influences the floor residents who choose to live in street-facing buildings, especially those with respiratory diseases, such as pneumoconiosis and asthma [8,9]. Diseases related to PM from traffic emissions also include respiratory tuberculosis; malignant neoplasm of the trachea, bronchus, and lung; pulmonary embolism; diseases of the respiratory system; and acute or chronic lower respiratory infection [10].
Although numerous studies have explored the vertical dispersion of several air pollutants (or PM) of a single size, the specific characteristics of the vertical distribution of PM of varying sizes in tree-planted street canyons remain unclear [11,12]. Uncertainty exists regarding the features of the vertical distribution of PM, with some previous studies noting that some gaseous pollutants (e.g., CO) and PM2.5 typically present an exponential decrease with height in street canyons [13,14,15]. Conversely, for short-lived traffic-related emissions, such as NO and NO2, concentrations, can even increase in street canyons with height under certain weather conditions, which are conducive to photochemical activity [16,17,18], where this effect depends on the lifetime of the gaseous pollutants [19]. However, conflicting findings exist regarding particle distributions in street canyons [20]. Wu Y. et al. [21] conducted vertical measurements of PM near major roads in Macao using monitors, and observed a significant reduction in the concentrations of PM as the height above the ground increased from 2 m to 79 m. At a height of 79 m, the concentrations of PM10 and PM2.5 decreased to approximately 60% and 62%, respectively, while 80% of the maximum values were recorded at 2 m above ground level. Meanwhile, other studies, such as those of Michallef and Colls [22] and Park S.K. et al. [23], have suggested that particle concentrations increase with height in the near-surface boundary layer, or remain uniformly distributed throughout the canyon’s depth. Nevertheless, Chen and Mao [24] noted that PM10 concentrations were similar between the 7th and 14th floors, with a significant decrement from the 7th to the 2nd floor. On the other hand, Bullin J.A. et al. [25] reported a nearly even distribution of total suspended particles (TSPs) in vertical profiles. A one-week measurement of particles ranging from 5 to 1000 nm in a street canyon in Cambridge, UK, revealed that the largest nanoparticles were predominantly near road level, close to pollution sources. Size-fractionated particle number concentrations (PNCs) at heights of 0.20 m and 1.0 m were found to be similar, within a range of 0.5% to 12.5% [26,27]. Additionally, an empirical study in Brisbane, Australia, demonstrated changes in particle size distribution with increasing height. During nucleation, particles smaller than 30 nm in size and the total particle concentration increased with height (7% to 65% and 5% to 46%, respectively), while the PM2.5 concentration decreased by 36% to 52% with height [28].
Therefore, the variation in particle concentration with vertical height still remains unclear. Some studies have indicated decreases in the PM2.5 and PM10 concentrations with height, while others have suggested increases or a uniform distribution of TSP and other particles within the canyon’s depth. There are also findings of decreasing PM10 and nanoparticle concentrations with height, which stabilizes after reaching a certain height range. Thus, variations in PM of different sizes have been observed at different vertical heights. Moreover, in typical vertical street canyon experiments, only three locations are commonly compared—the building top, pedestrian height, and exhaust height—with limited comparisons among positions related to trees [20,29]. Notably, few studies have explored the trends of PM at multiple vertical heights relative to street tree canopies. Studies on the vertical distribution of PM in street canyons have exhibited specific variations among different geographical regions [27,30,31]. To date, few studies in this research area have been conducted in central China. To address these knowledge gaps, this study aims to (1) quantify variations in PM concentrations and dispersion processes at multiple vertical heights, including the emission source height, pedestrian height, and various canopy levels, and (2) investigate the distribution of PM with different particle sizes across vertical heights and the associated influencing factors.

2. Research Methods

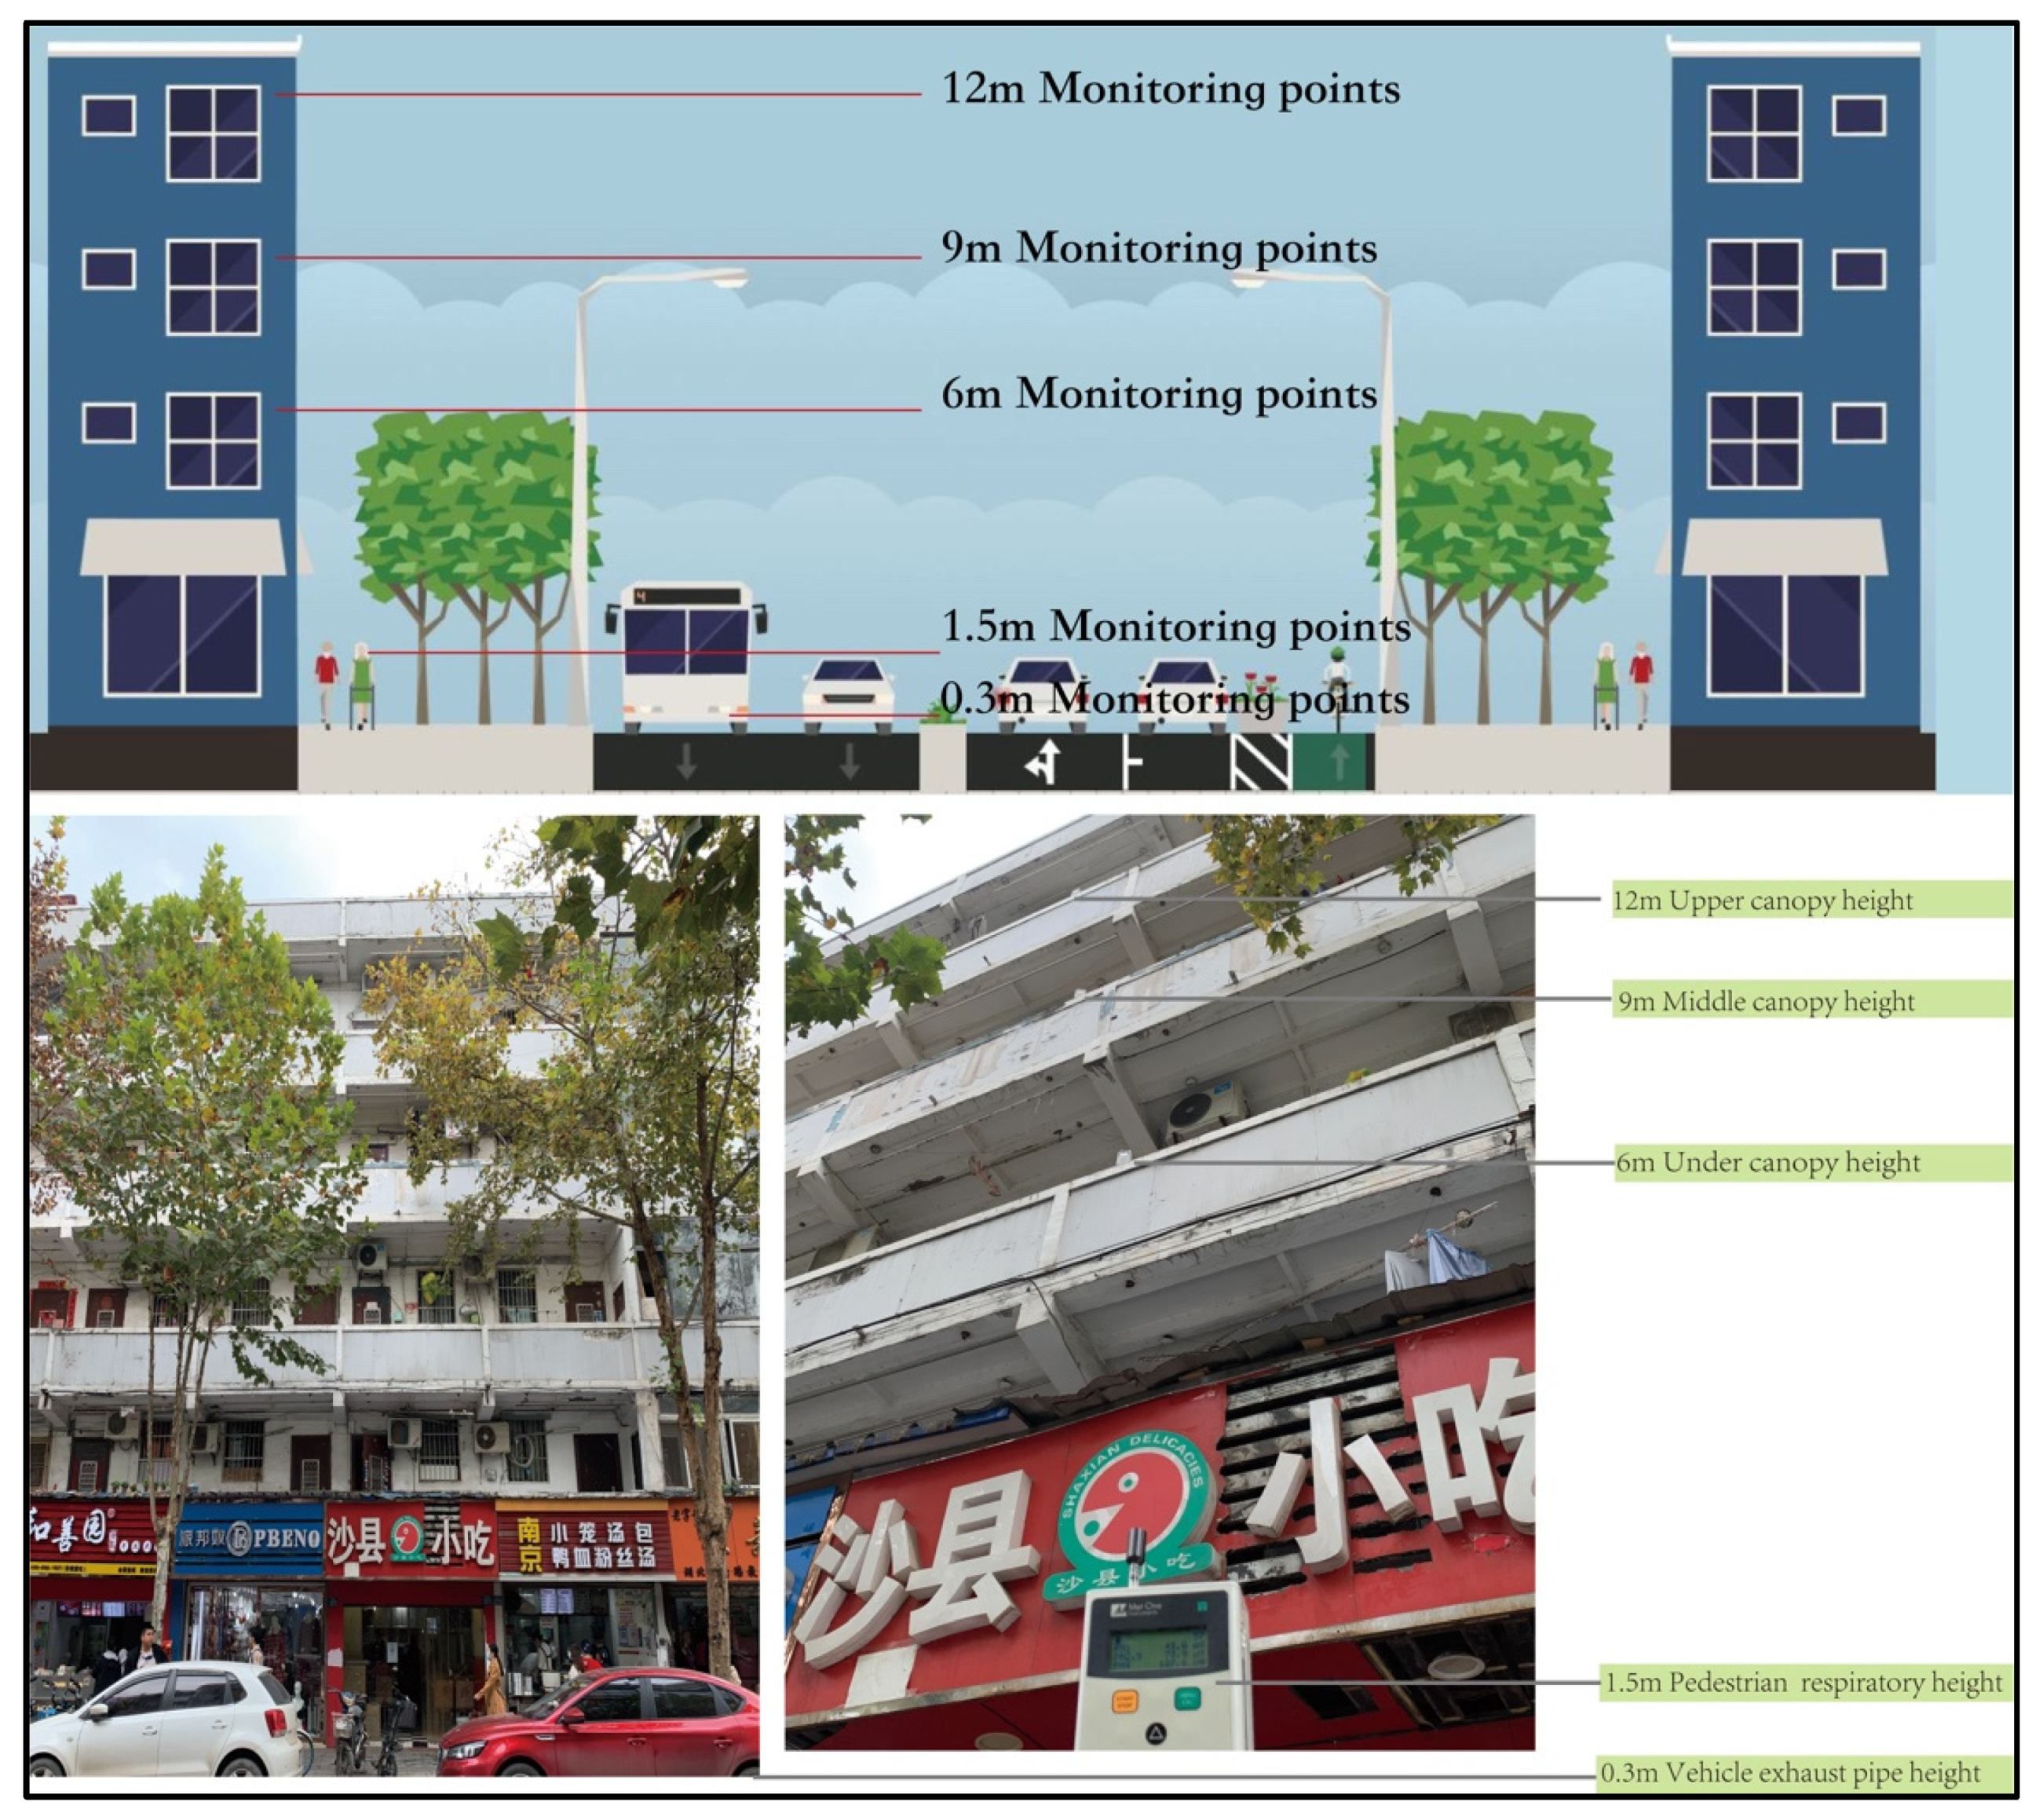
2.1. Site Description and Measurement Times

Through on-site inspections, vertical pollutant distribution characteristics in a typical street canyon were investigated. The simultaneous monitoring of PMs was conducted in a vertical orientation at five heights (0.3 m, 1.5 m, 6 m, 9 m, and 12 m) within a street-facing building on Jiefang Road, Wuchang District, Wuhan, China (as shown in Figure 1). Under physics consideration, 12 m (4th floor, upper canopy height), 9 m (3rd floor, middle of the canopy), 6 m (2nd floor, height position under the canopy or branches), along with 1.5 m (the average height at which most pedestrians’ respiratory organs are exposed to pollutants), and 0.3 m (typical motor vehicle’s tailpipe height) were selected.
The street-facing building is situated in a neighborhood of densely packed and symmetrically arranged buildings. The measurement locations were carefully chosen to avoid other local sources of industrial pollution. This ensured that traffic exhaust emissions were the dominant pollution source within the street canyon. The experiment was conducted in a section of the street canyon at a leeward wall with a street tree canopy density of approximately 32% (Figure 1). A street canyon planted with pruned Platanus × acerifolia Willd. trees was specifically selected for this experiment, and the height positions of the canopy corresponded to the height positions of the three upper monitoring points.
The experiment was conducted during November and December 2020 on five clear-sky days. Our study was conducted under stable weather conditions; namely, calm/light air circulation conditions (with a daily average wind speed between 0 and 1.5 m/s, as determined by the Beaufort scale and the Commission for Climatology (CCI)). Sampling occurred between 7:00 a.m. and 7:00 p.m., covering the period from the morning rush hour to the evening peak traffic, effectively capturing diurnal variations in PM concentrations at the sampling points. This time frame was chosen in order to balance the impact of uneven traffic flow and mitigate other time-sensitive factors on the experiments. Hourly monitoring cycles were employed, with each experiment repeated thrice. Simultaneous monitoring was conducted at five different vertical heights within the same street canyon. Each monitoring point yielded 36 sets of PM data per day (comprising 6 particle size fractions).

2.2. Measurement Methods and Statistical Analyses

Six diameters of PM—namely PM1, PM2.5, PM4, PM7, PM10, and TSPs—were measured at different heights in a synchronous manner. The PM concentration data (μg/m3) were measured utilizing METONE Hash six-channel AEROCET 531s dust particle counters (Met One Instrument Inc., Grants Pass, OR, USA, 2003). The AEROCET 531S is a full-featured handheld mass monitor and particle counter that can simultaneously measure six mass concentration ranges. Five instruments (and a backup instrument) were used to measure the PM concentrations at five sites at each height simultaneously. For calibration, the flow rate of the AEROCET 531s instrument (2.83 L/min ± 5%) was calibrated with a spherical flowmeter (9801) before utilization in the field. Before each measurement, auto-zeroing was performed to prevent air leaks or debris in the particle sensor. The ambient temperature and relative humidity were measured five times per hour to obtain the average values using an Thermo Hygrometer 8703 (AZ Instrument Corp., Taichung, Taiwan, China), and the hourly traffic flow was measured using an SXH5136 counter (Sanda Electronics Co., Ltd., Yiwu, China) at a ground-level location.
Linear regression models were used to establish equations to quantify the relationship between the six PM concentration levels and the vertical heights, and the models’ validity was assessed according to the R2 values and 95% confidence intervals. We used linear regression models for simplicity and interpretability, consistent with previous studies [7,30], and data characteristics. Additionally, Spearman’s rank correlation coefficient was calculated in R statistical software (version 4.2.3) in order to examine the associations among vertical height, temperature, humidity, and the concentrations of the six PM fractions (PM1, PM2.5, PM4, PM7, PM10, and TSPs) at each monitoring site. Correlation matrices were generated to explore the relationships between the meteorological factors and the PM concentrations in detail.

3. Results

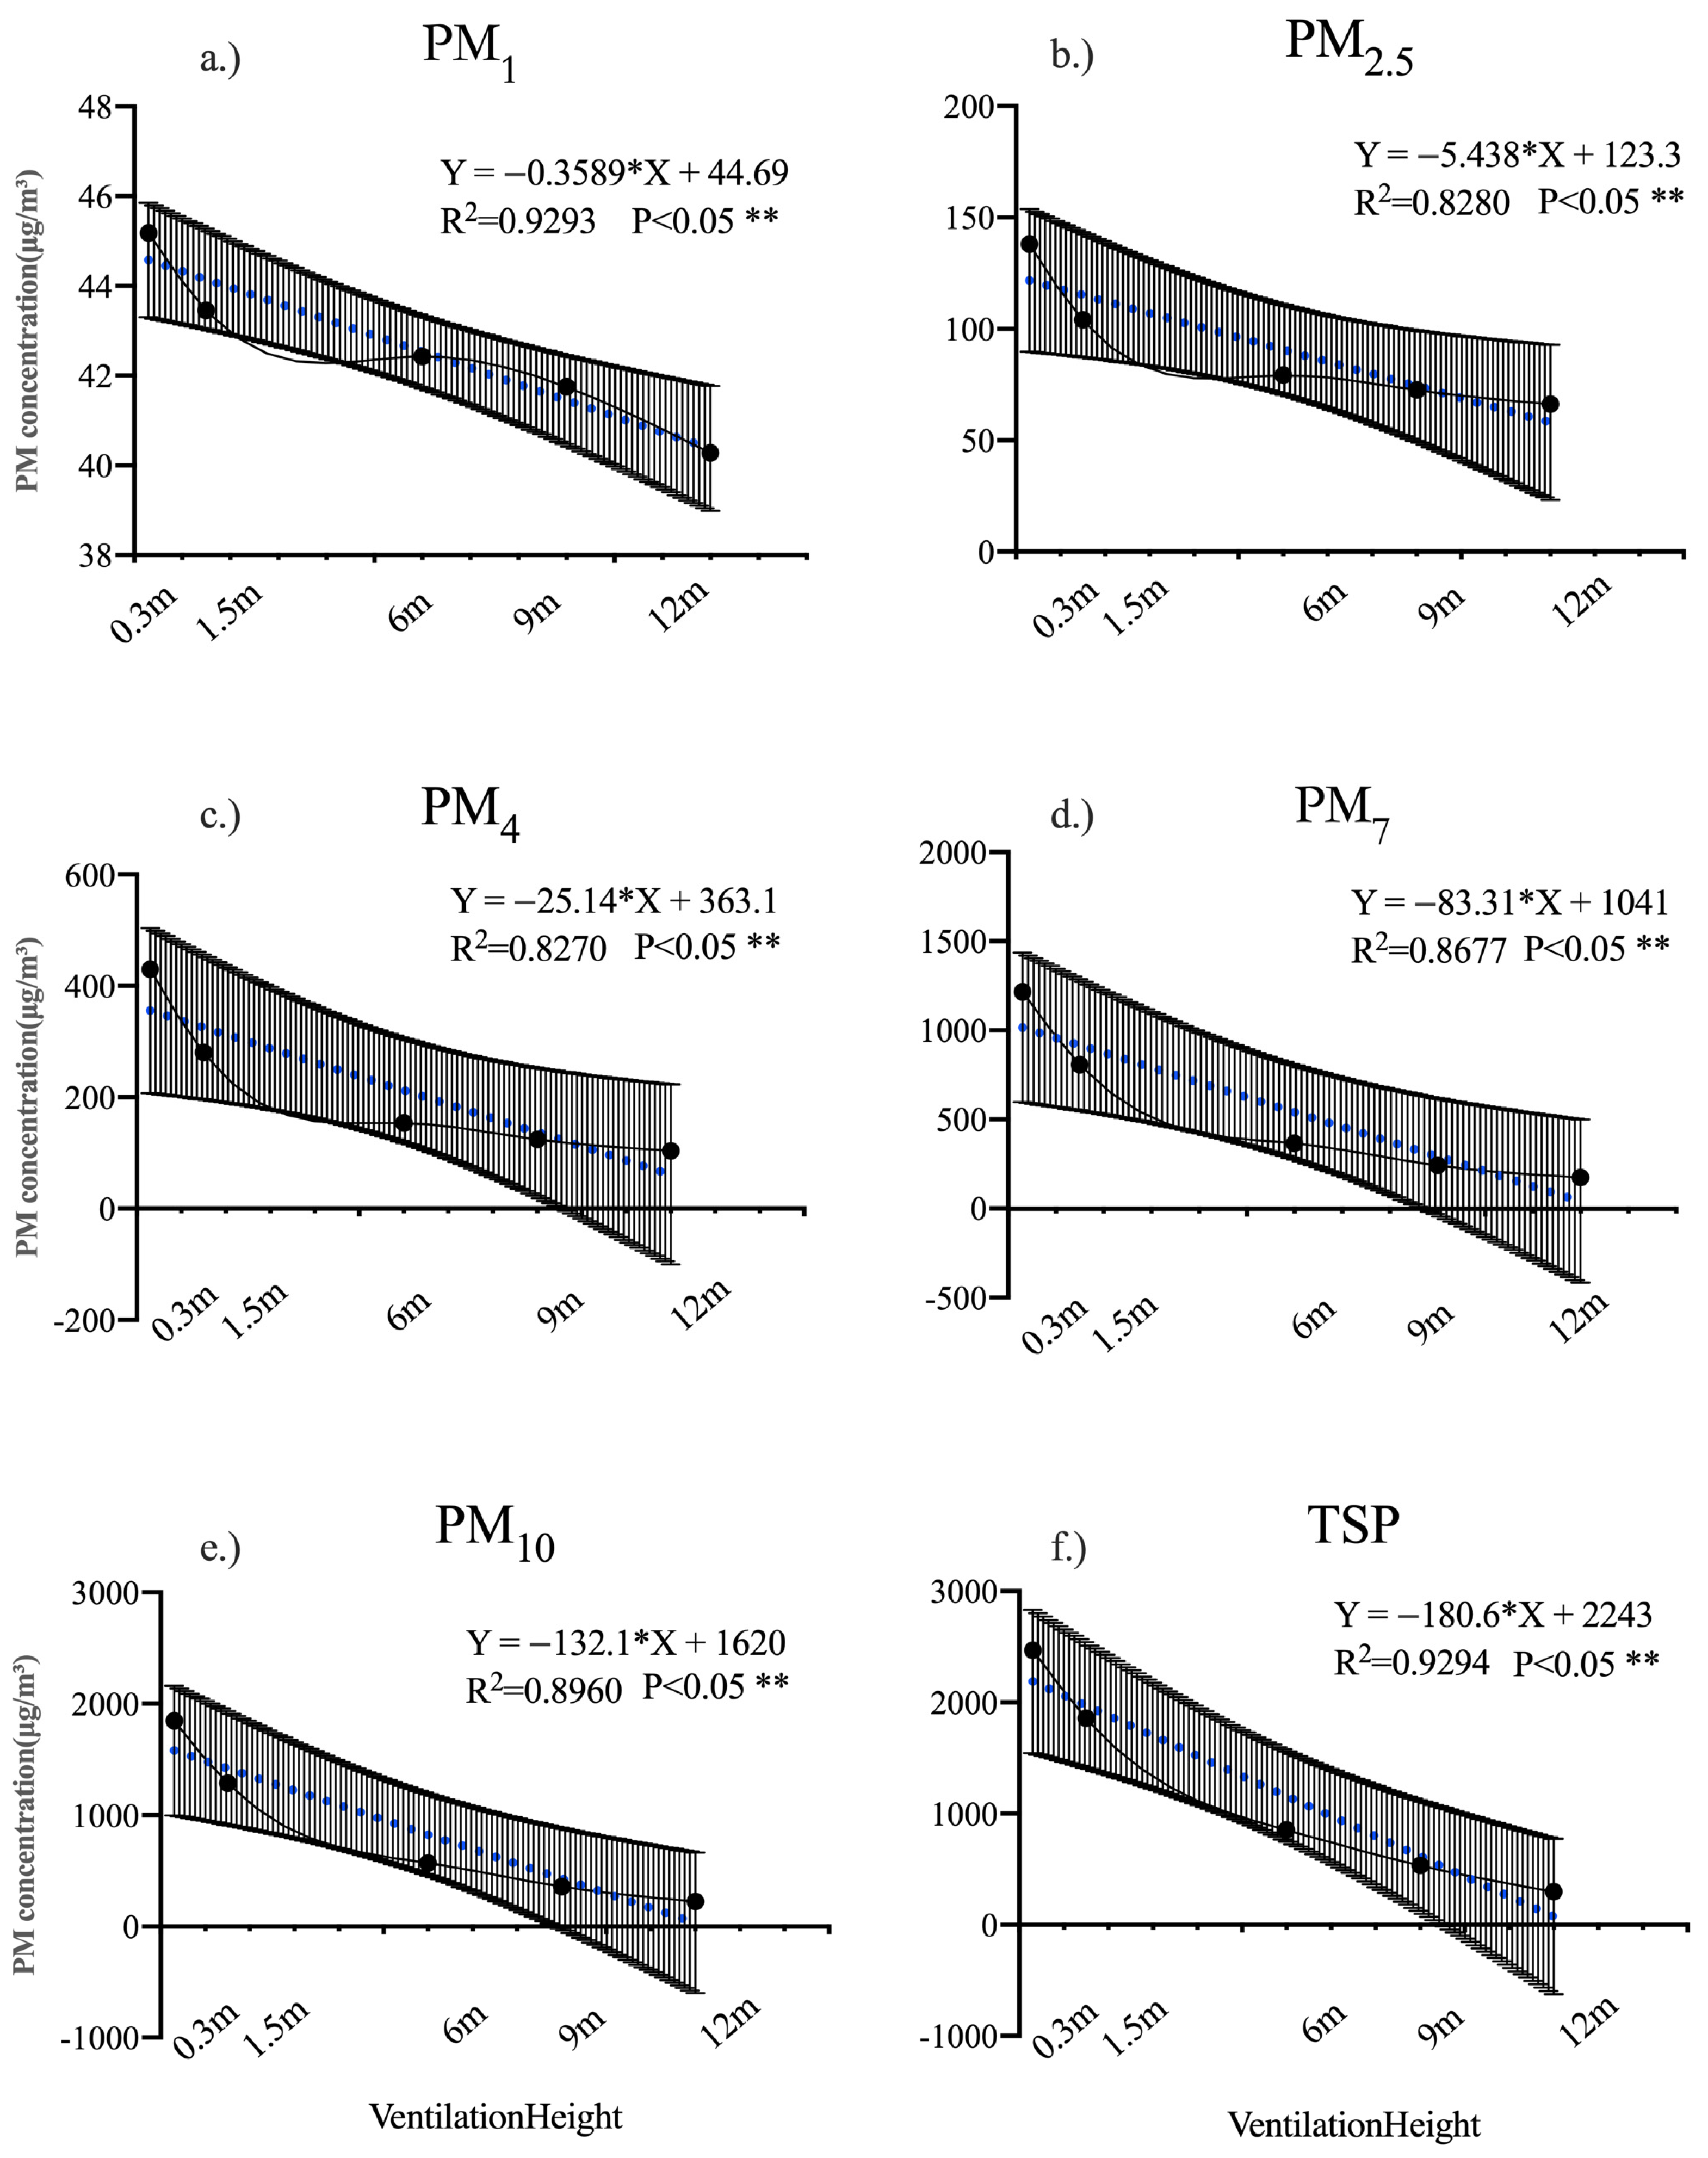
3.1. Relationship between PM Concentrations and Vertical Height in Street Canyons

A linear regression model was used to examine the relationships between the vertical height and the concentrations of the six distinct PM sizes in the street canyon (as shown in Figure 2), consistently revealing negative linear correlations between the vertical height and PM concentration (p < 0.05). Daily average concentrations of each PM size exhibited similar trends across the various heights examined. The R2 values in the regression equations ranged from 0.82 to 0.93, indicating a robust model fit for all particle sizes. As the vertical height increased, the PM concentrations gradually decreased.
The PM2.5 regression equation is y = −5.438x +123.3 (R2 = 0.8280), which indicates that, for every 1% increase in vertical height, the PM2.5 concentration decreases by about 5.44%. Similarly, for every 1% increase in vertical height, the PM1 concentration decreases by 0.36%, the PM4 concentration decreases by 25.14%, and the PM7 concentration decreases by 83.31%. The PM10 regression equation is y = −132.1x + 1620 (R2 = 0.8960), representing a 132.1% decrease in the PM10 concentration for each 1% increase in vertical height. Furthermore, the TSP regression equation is y = −180.6x + 2243 (R2 = 0.9294), representing a 180.6% decrease in the TSP concentration for every 1% increase in vertical height. The regression equations indicate that the larger the particle size, the more significant the changes in the PM concentration among different sites, and similarly, the greater the effect of vertical height on the PM concentrations.

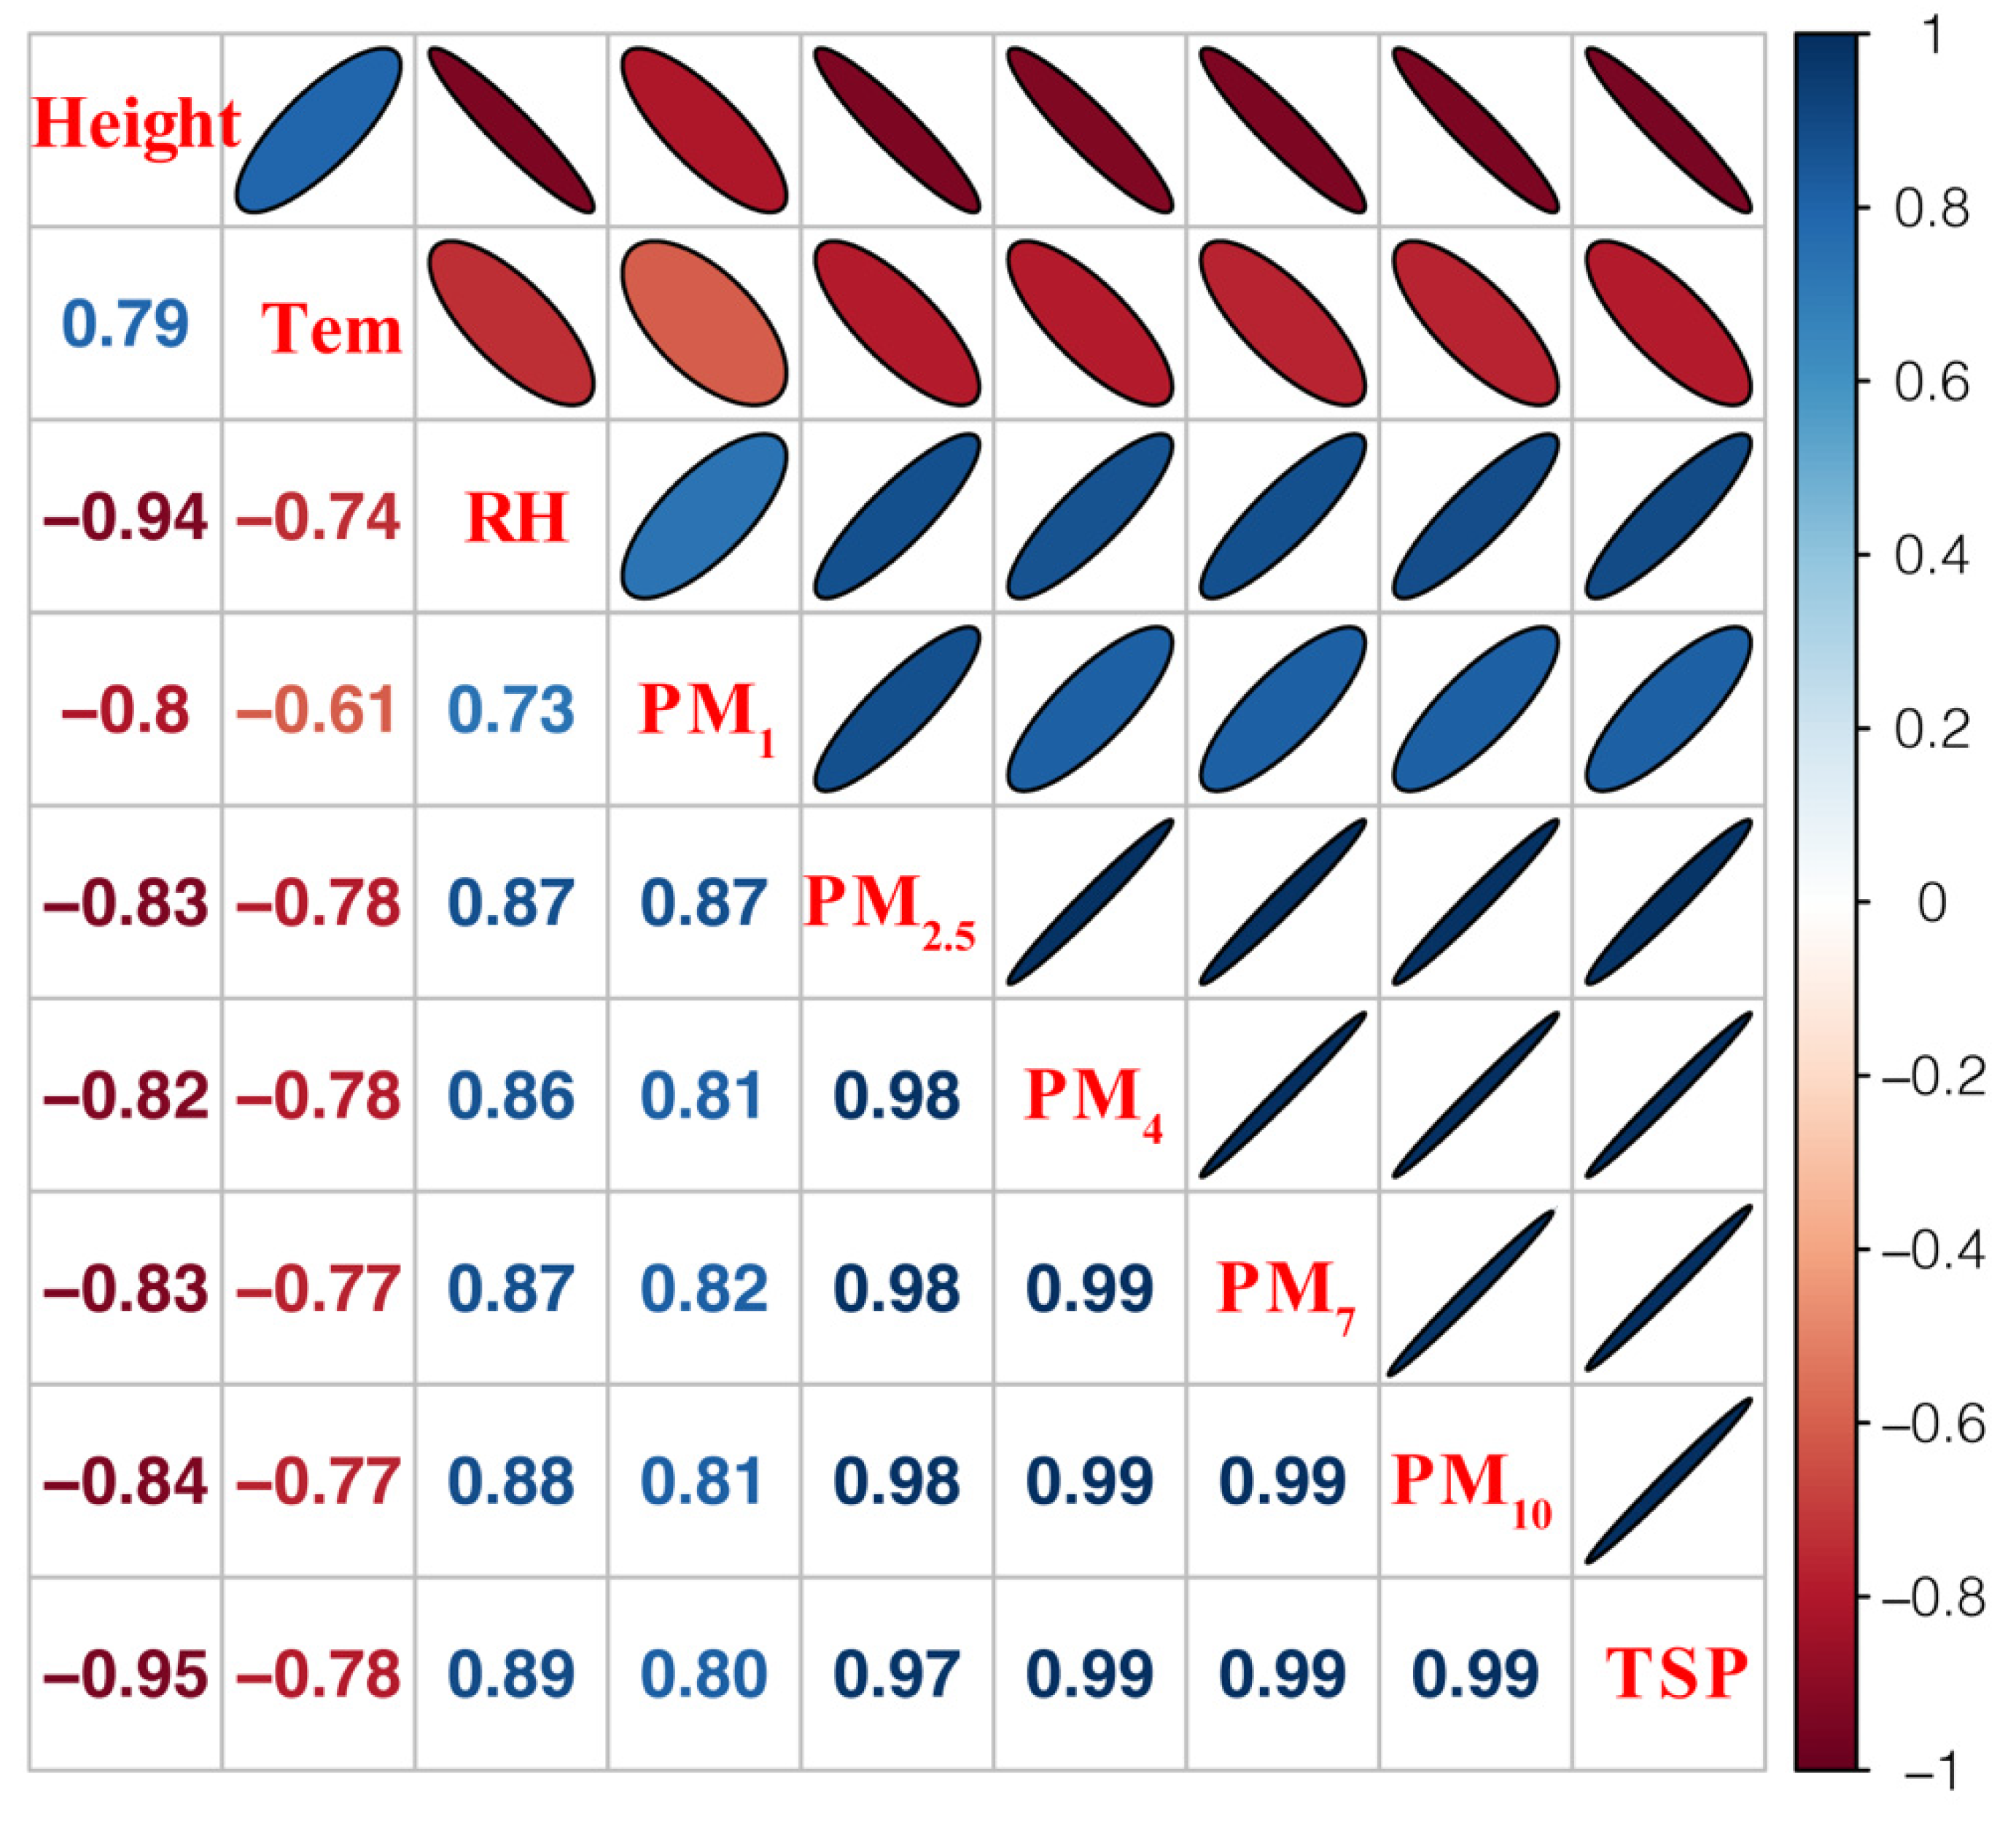
3.2. Influencing Factors of PM Vertical Dispersion in Street Canyons

A strong positive correlation among the particle concentrations of various sizes at different heights was observed during the experiment (as shown in Figure 3), with the correlation coefficients notably peaking at 0.99 for larger particles, such as PM4, PM7, PM10, and TSP. In contrast, a negative correlation was found between the atmospheric PM and the vertical heights. The correlation coefficients for the particles of different sizes ranged from −0.8 to −0.95. Interestingly, the correlation coefficients tended to increase in absolute value with an increasing particle size. Notably, PM2.5 exhibited a particularly high negative correlation with vertical height, surpassing PM4, with a coefficient of −0.83. The most pronounced negative correlation was observed between the TSP and vertical height, with a correlation coefficient of −0.95.
Furthermore, significant correlations were observed among the vertical height, humidity (significant negative correlation at −0.94), and temperature (positive correlation at 0.79). The relative humidity showed a significant positive correlation with the PM concentrations at different heights, with correlation coefficients generally increasing with the particle size (ranging from 0.73 to 0.89); the highest correlation coefficient (0.89) was observed with the TSP. Conversely, the atmospheric temperature exhibited a negative correlation with the PM of various sizes at different heights, displaying correlation coefficients of −0.78 with PM2.5 and the TSP, −0.61 with PM1, and −0.77 with PM10. There was also a negative correlation between the relative humidity and temperature.

4. Discussion

4.1. Vertical Distribution Characteristics of PM in Street Canyons

Our experimental findings revealed a consistently negative linear relationship between the atmospheric PM concentrations and vertical height within the street canyon, with the most pronounced negative correlation observed for the total suspended particulates (TSP). Our results are in alignment with the results of an observational campaign at three height levels (1.5, 27, and 69 m above street level) in Shenyang, China, which indicated that PM tended to settle on the ground in the street canyon and the PM concentration was reduced with height in summer [31]. Furthermore, we found that for every 1% increment in vertical height, the PM2.5 concentration decreased by about 5.44%, the PM10 concentration decreased by 132.1%, and the TSPs decreased by 180.6% from the ground floor to the fourth floor (12 m). Larger particles (i.e., PM10 and TSPs) exhibited more substantial concentration variations across the different vertical heights, highlighting the impact of height on particle concentration. Affected by solar radiation and tree shading in microclimate environments, between 0.3 and 12 m, as the height increased, the atmospheric temperature gradually rose while the relative humidity declined, leading to a sharp decrease in the PM concentration. The correlation of PM with humidity was found to be positive, while the temperature was observed to have a negative correlation with PM10 over a diurnal timescale [32,33]. The RH generally showed a positive correlation with PM10 up to a threshold value of 75% RH, beyond which the correlation ceased. The RH affects the natural deposition process of PM, whereby moisture particles adhere to the PM, influencing atmospheric PM concentrations [32].
In our field study comparing near-surface concentrations to those at the roof level, we observed a decline in the particle concentrations with increasing height, consistent with the observations of earlier studies [16,34,35]. Additionally, the pollutant concentrations tended to follow a gradually decreasing trend vertically. This finding has also been reported by Yassin and Ohba [1], who observed an exponential decrease with vertical height. Furthermore, our study compared the vertical dispersion patterns of PM with different particle sizes (PM1, PM4, PM7, PM10, and TSP), revealing that larger particles exhibited a stronger negative correlation between the vertical height and PM concentration. In particular, strong negative correlations were observed between the height and the concentrations of TSP (r = −0.95) and PM10 (r = −0.84). The results of this study are consistent with those of several previous studies, including those using field experiments [21,27,30], drone observations [36], wind tunnel modeling [1], and computational fluid dynamics (CFD) simulations [35]. The earliest similar studies originated from Horvath H. et al. [37], who reported a 17% reduction in diesel particle concentrations at 27 m compared to street level. Li X. et al. [38] observed a reduction in particle numbers at a height of 38 m compared to 1.5 m; in particular, by 72% and 85%, when winds blew parallel and perpendicular to a street canyon, respectively. Another study found that the particle number at street level (0.2–2.6 m height) was approximately 6.5 times higher than at the rooftop (20 m height) [39]. Goel and Kumar [40] conducted a study in Guildford, UK, and concluded that residents on the second floor (4.7 m) experienced a 40% reduction in pollutant exposure around a four-lane intersection compared to those on the first floor. The vertical reduction in PM was approximately 132 times stronger than the horizontal reduction.
Studies on PM are relevant to reducing health risks for residents. Our study focused on vehicle exhaust emissions as a pollution source and observed higher concentrations of PM2.5 near the ground and lower concentrations near the roof adjacent to the leeward wall, yielding findings consistent with the simulation performed by Zhang Y.W. et al. [41]. Notably, there were significantly lower PM concentrations with every 1% increase in vertical height, and PM2.5, PM10, and TSP concentrations decreased by about 5.44%, 132.1%, and 180.6%, respectively, from the ground floor to the fourth floor. Our results indicate that variations in the PM concentrations at various heights within a building can be leveraged by residents to tailor their exposure to air pollution, thereby mitigating associated health risks based on individual preferences and needs. It is worth noting that PM from vehicle emissions is easily trapped in street canyons, which not only affects roadway pedestrians and vehicle drivers but can also easily lead to it being introduced into the indoor air environment by vertical dispersion through building ventilation systems. Pateraki S. et al. [9] assessed PM in a 19 m-high building located next to one of the busiest roads in Athens. The vertical concentration ratio decreased with increasing height (1st/5th floor: 1.21, 1.13, and 1.09 for PM10, PM2.5, and PM1, respectively), highlighting the importance of the building height choices with respect to the resident’s exposure level. Furthermore, Kalaiarasan M. et al. [8] conducted experiments considering multi-story public buildings in Singapore, and concluded that residents of the middle floors face higher health risks of respiratory diseases (reaching up to 1.81 and 1.34 times), compared to those on upper floors, across all age groups. The results of vertically orientated studies are expected to help building designers to develop effective strategies to control the ingress of external PM—especially respirable PM2.5—into inhabited environments. These findings are also critical for designing targeted mitigation measures, such as installing air filtration systems at specific heights or optimizing exterior window sealing for street-facing buildings. It will also help residents of buildings along the street and patients suffering from respiratory diseases (e.g., pneumoconiosis) to choose appropriate floors in order to minimize the damage caused by PM1 and PM2.5. PM vertical distribution data help to assess the PM2.5 exposure levels in different populations and patient groups, which can lead to better health risk assessments and more effective public health advisories.
Future investigations into the vertical dispersion patterns of PM concentrations in street canyons should examine the impacts of varying vegetation density, porosity, spacing, and plant combinations on air pollution dispersion and may consider customized designs to enhance ventilation and air circulation within building infrastructure to improve the surrounding air quality. This will refine neighborhood-scale ecological planning and allow for the development of better strategies for different urban scenarios, aimed at pollution reduction and dust stagnation for various PM types. Additionally, utilizing Doppler LiDAR to measure the vertical profile of pollutants will enable more accurate temporal and spatial analyses [42,43], and measurements should be conducted in high-density urban boundary layer environments [44]. Future research should explore a broader range of scenarios and simulations, thus ensuring that the results can be generalized to a variety of conditions.

4.2. Factors Influencing the Vertical Distribution of PM in Street Canyons

Numerous factors influence the vertical distribution of PM in street canyons [20]. Research on the vertical distribution of PM and corresponding meteorological factors has clarified the environmental conditions that promote aerosol formation and the drivers behind fluctuations in PM concentrations. The primary determinants of the vertical PM (near-surface PM) distribution within street canyons are the meteorological conditions, which affect the dry deposition rate of PM within the street canyon.
Among the meteorological factors, airflow velocity and the dominant wind direction are the determining factors in all vertical direction models, as they directly affect the friction velocity, which has a strong influence on the vertical distribution of PM [45,46]. However, the impacts of meteorological factors on PM in the presence of calm wind or breeze conditions have been frequently ignored in previous research. Our study was conducted under stable weather conditions; namely, calm/light air circulation conditions (with a daily average wind speed between 0 and 1.5 m/s, as determined by the Beaufort scale and the Commission for Climatology (CCI)). Under these wind conditions, the effect of the relative humidity on the PM distribution becomes more pronounced, while lower temperatures at lower height positions also promote the formation of organic aerosols. The correlation between temperature and PM concentration is evident: as the temperature rises, the atmospheric stability increases, leading to reduced mixing and a greater decrease in PM concentration. This results in a negative correlation between the temperature and PM levels. Additionally, turbulent exchanges and the stability of the atmospheric boundary layer are also closely related to meteorological conditions, such as the temperature and relative humidity [5,47,48]. Solar and surface radiation generate air exchanges that lead to daily variations in temperature; at the same time, turbulence is transferred up and down, leading to daily PM variations in the near-ground field [49].
Some previous studies have focused on the physical impact of street trees on PM in the vertical dimension, including interception, deposition, and attenuation processes [5,48]. Previous research has shown that street trees with canopy density less than 35% would not significantly obstruct the upward dispersion of PM; instead, they may retain some particles through deposition. [50,51]. In our study, despite the presence of street trees on both sides of the street canyon, the street tree canopy density was relatively sparse (approximately 32%). A distinct gradient of decreasing PM concentration with increasing height was observed, providing no evidence of concentration aggregation caused by the tree canopy. We hypothesis that the vertical dispersion of PM (near-surface PM) is not impeded at any level, including beneath the canopy (at 6 m), within the mid-canopy (at 9 m), and at the canopy top (at 12 m). Therefore, such canopies (32% canopy density or less) do not impede vertical or horizontal PM dispersion and can be effectively planted to contribute to the overall reduction in PM concentrations in urban environments. Future experiments will test this hypothesis to provide meaningful and practical insights. For dense canopies, while some particles near the tree surface move upward and reach the canopy’s top, a majority are hindered rather than filtered by the tree’s structure. Enhanced air mixing reduces local air pollution levels, and dilution through cleaner air from higher locations plays a vital role [52]. An investigation conducted in Oakland revealed that leaves blocked the upward transport of pollutants, increasing the amount of pollutants stored in the canopy space and reducing the downward infiltration of clean air from high altitudes [53]. Hence, it is essential to restrict dense, tall, and canopy-forming urban arborvitae vegetation in street canyons [51,54]. Meanwhile, street trees also plays a crucial role in the deposition of atmospheric PM in the vertical dimension, mainly through dry deposition onto leaf, stem, or branch surfaces, thus intercepting upward-dispersing PM [48,55]. The dry deposition rates of trees depend on factors such as canopy density, leaf area index (LAI), and other vegetation characteristics [38,49,50]. Elevated background PM levels can intensify deposition effects [48,56].
PM deposition rates are also closely related to the particle size. The dry deposition of coarser particulates (aerodynamic diameter dp ≥ 10 µm) is mainly gravitational, while smaller particles (0.1 µm < dp < 1 µm) are more affected by Brownian motion and inertial collisions. Reductions in the particle number concentrations (PNCs) at street level in the horizontal direction were attributed to dilution and dry deposition, while vertical reductions within the street canyon were linked to mass exchange between the street canyon and the air flow above [26]. Vertical distribution experiments within Hong Kong street canyons revealed an exponential relationship between height and the TSP and PM10 concentrations. Furthermore, the rate of decrease in TSP, PM10, and PM2.5 concentrations reduced as the distance from the ground increased, following the sequence of particulate sizes [57]. Localized air turbulence within street canyons may contribute to the uniform distribution of pollutants at different heights [49,58]. This indicates effective mixing (possibly due to enhanced turbulence from traffic), and PM emissions stemming from processes like combustion, tire, and brake wear, and re-suspension are primarily concentrated near the street surface [36,52,59]. The monitoring of a German street canyon revealed that the maximum difference in PM2.5 between the vertical levels reached 12%, with concentrations decreasing at the top of the street canyon due to enhanced turbulence and mixing, while near-surface PM decreased slightly due to vehicle-generated turbulence, which enhanced turbulent mixing [29].

5. Conclusions

To improve strategies for mitigating air pollution in densely populated urban areas, it is crucial to investigate the vertical distribution of airborne particulate matter (PM) and the dominant influencing factors. For this study, field experiments were conducted to analyze the vertical distribution patterns of particles of six different sizes (in terms of dp; PM1, PM2.5, PM4, PM7, PM10, and total suspended particulates (TSPs)) at five different tree related heights within a street-facing building, including at street level near vehicular emission sources (0.3 m), pedestrian breathing height (1.5 m), beneath the canopy (6 m), mid-canopy (9 m), and the top of the canopy (12 m). The results indicate that for every 1% increase in vertical height, the PM2.5 concentration decreased by about 5.44%, the PM10 concentration decreased by 132.1%, and the TSP concentration decreased by 180.6%. There was a consistent downward trend in the PM concentrations across the various particle sizes as the height increased, demonstrating a negative linear correlation between the particle concentrations and vertical height within the street canyon. Furthermore, the larger particles exhibited more pronounced variations with height, and robust negative correlations were particularly observed in the cases of TSP (correlation coefficient of −0.95) and PM10 (−0.84). Affected by solar radiation and tree shading in the microclimate environment, as the height increased from 0.3 to 12 m, the atmospheric temperature gradually rose while the relative humidity declined, leading to a sharp decrease in the PM concentrations. Our findings are considered useful for informing building designers for the development of effective strategies, such as optimal vent placement, to mitigate the intrusion of outdoor air pollution—specifically, PM2.5—into indoor environments. Moreover, this research offers new insights for residents residing in street-facing buildings and individuals with respiratory diseases (e.g., pneumoconiosis or asthma), aiding them in selecting the residential floor that minimizes health risks associated with respirable PM exposure.

Author Contributions

Conceptualization, X.C.; methodology, X.C.; software, B.M.; formal analysis, B.M.; resources, Z.Z.; writing—original draft, X.W.; writing—review and editing, X.W.; supervision, C.P.; project administration, Z.Z.; funding acquisition, C.P. All authors have read and agreed to the published version of the manuscript.

Funding

This study was financially supported by the China Scholarship Council (CSC) and the Natural Sciences and Engineering Research Council of Canada (NSERC).

Data Availability Statement

Data available upon request from the authors.

Acknowledgments

The financial support mentioned in the Funding part is gratefully acknowledged.

Conflicts of Interest

The authors declare that they have no known competing financial interests or personal relationships that could have appeared to influence the work reported in this paper.

References

  1. Yassin, M.F.; Ohba, M. Experimental study of the impact of structural geometry and wind direction on vehicle emissions in urban environment. Transp. Res. D Trans. Environ. 2012, 17, 161–168. [Google Scholar] [CrossRef]
  2. Miao, Y.; Li, J.; Miao, S.; Che, H.; Wang, Y.; Zhang, X.; Zhu, R.; Liu, S. Interaction Between Planetary Boundary Layer and PM2.5 Pollution in Megacities in China: A Review. Curr. Pollut. Rep. 2019, 5, 261–271. [Google Scholar] [CrossRef]
  3. Tan, Y.; Wang, H.; Zhu, B.; Zhao, T.; Shi, S.; Liu, A.; Liu, D.; Pan, C.; Cao, L. The interaction between black carbon and planetary boundary layer in the Yangtze River Delta from 2015 to 2020: Why O3 didn’t decline so significantly as PM2.5. Environ. Res. 2022, 214, 114095. [Google Scholar] [CrossRef] [PubMed]
  4. Morakinyo, T.E.; Lam, Y.F. Study of traffic-related pollutant removal from street canyon with trees: Dispersion and deposition perspective. Environ. Sci. Pollut. Res. Int. 2016, 23, 21652–21668. [Google Scholar] [CrossRef] [PubMed]
  5. Buccolieri, R.; Carlo, O.S.; Rivas, E.; Santiago, J.L.; Salizzoni, P.; Siddiqui, M.S. Obstacles influence on existing urban canyon ventilation and air pollutant concentration: A review of potential measures. Build. Environ. 2022, 214, 108905. [Google Scholar] [CrossRef]
  6. Wu, C.-D.; MacNaughton, P.; Melly, S.; Lane, K.; Adamkiewicz, G.; Durant, J.L.; Brugge, D.; Spengler, J.D. Mapping the vertical distribution of population and particulate air pollution in a near-highway urban neighborhood: Implications for exposure assessment. J. Expo. Sci. Environ. Epidemiol. 2014, 24, 297–304. [Google Scholar] [CrossRef] [PubMed]
  7. Li, C.; Liu, M.; Hu, Y.; Wang, H.; Xiong, Z.; Wu, W.; Liu, C.; Zhang, C.; Du, Y. Investigating the vertical distribution patterns of urban air pollution based on unmanned aerial vehicle gradient monitoring. Sustain. Cities Soc. 2022, 86, 104144. [Google Scholar] [CrossRef]
  8. Kalaiarasan, M.; Balasubramanian, R.; Cheong, K.W.D.; Tham, K.W. Traffic-generated airborne particles in naturally ventilated multi-storey residential buildings of Singapore: Vertical distribution and potential health risks. Build. Environ. 2009, 44, 1493–1500. [Google Scholar] [CrossRef]
  9. Pateraki, S.; Manousakas, M.; Bairachtari, K.; Kantarelou, V.; Eleftheriadis, K.; Vasilakos, C.; Assimakopoulos, V.D.; Maggos, T. The traffic signature on the vertical PM profile: Environmental and health risks within an urban roadside environment. Sci. Total Environ. 2019, 646, 448–459. [Google Scholar] [CrossRef]
  10. Mak, H.W.L.; Ng, D.C.Y. Spatial and Socio-Classification of Traffic Pollutant Emissions and Associated Mortality Rates in High-Density Hong Kong via Improved Data Analytic Approaches. Int. J. Environ. Res. Public Health 2021, 18, 6532. [Google Scholar] [CrossRef]
  11. Hofman, J.; Stokkaer, I.; Snauwaert, L.; Samson, R. Spatial distribution assessment of particulate matter in an urban street canyon using biomagnetic leaf monitoring of tree crown deposited particles. Environ. Pollut. 2013, 183, 123–132. [Google Scholar] [CrossRef]
  12. Wang, Y.; Flageul, C.; Maison, A.; Carissimo, B.; Sartelet, K. Impact of trees on gas concentrations and condensables in a 2-D street canyon using CFD coupled to chemistry modeling. Environ. Pollut. 2023, 323, 121210. [Google Scholar] [CrossRef]
  13. Zoumakis, N.M. A Note on Average Vertical Profiles of Vehicular Pollutant Concentrations in Urban Street Canyons. Atmos. Environ. 1995, 29, 3719–3725. [Google Scholar] [CrossRef]
  14. Vardoulakis, S.; Fisher, B.E.A.; Pericleous, K.; Gonzalez-Flesca, N. Modelling air quality in street canyons: A review. Atmos. Environ. 2003, 37, 155–182. [Google Scholar] [CrossRef]
  15. Chen, D.; Liao, H.; Yang, Y.; Chen, L.; Zhao, D.; Ding, D. Simulated impacts of vertical distributions of black carbon aerosol on meteorology and PM2.5 concentrations in Beijing during severe haze events. Atmos. Chem. Phys. 2022, 22, 1825–1844. [Google Scholar] [CrossRef]
  16. Vakeva, M.; Hameri, K.; Kulmala, M.; Lahdes, R.; Ruuskanen, J.; Laitinen, T. Street level versus rooftop concentrations of submicron aerosol particles and gaseous pollutants in an urban street canyon. Atmos. Environ. 1999, 33, 1385–1397. [Google Scholar] [CrossRef]
  17. Miao, C.; He, X.; Xu, S.; Chen, W. Vertical distribution of air pollutants in an urban street canyon during winter air pollution episodes in Shenyang, China. Build. Environ. 2023, 245, 110853. [Google Scholar] [CrossRef]
  18. Wang, X.; Zhou, Z.; Xiang, Y.; Peng, C.; Peng, C. Effects of street plants on atmospheric particulate dispersion in urban streets: A review. Environ. Rev. 2024, 32, 114–130. [Google Scholar] [CrossRef]
  19. Pommier, M. Estimations of NOx emissions, NO2 lifetime and their temporal variation over three British urbanised regions in 2019 using Tropomi NO2 observations. Environ. Sci. Atmos. 2023, 3, 408–421. [Google Scholar] [CrossRef]
  20. Dubey, R.; Patra, A.K.; Nazneen. Vertical profile of particulate matter: A review of techniques and methods. Air Qual. Atmos. Hlth. 2022, 15, 979–1010. [Google Scholar] [CrossRef]
  21. Wu, Y.; Hao, J.M.; Fu, L.X.; Wang, Z.S.; Tang, U. Vertical and horizontal profiles of airborne particulate matter near major roads in Macao, China. Atmos. Environ. 2002, 36, 4907–4918. [Google Scholar] [CrossRef]
  22. Micallef, A.; Colls, J.J. Variation in airborne particulate matter concentration over the first three metres from ground in a street canyon: Implications for human exposure. Atmos. Environ. 1998, 32, 3795–3799. [Google Scholar] [CrossRef]
  23. Park, S.K.; Kim, S.D.; Lee, H. Dispersion characteristics of vehicle emission in an urban street canyon. Sci. Total Environ. 2004, 323, 263–271. [Google Scholar] [CrossRef]
  24. Chen, M.L.; Mao, I.F. Spatial variations of airborne particles in metropolitan Taipei. Sci. Total Environ. 1998, 209, 225–231. [Google Scholar] [CrossRef]
  25. Bullin, J.A.; Bower, S.C.; Hinz, M.; Moe, R.D. Aerosols near urban street intersections. J. Air Pollut. Control. Assoc. 1985, 35, 355–358. [Google Scholar] [CrossRef]
  26. Kumar, P.; Fennell, P.; Langley, D.; Britter, R. Pseudo-simultaneous measurements for the vertical variation of coarse, fine and ultrafine particles in an urban street canyon. Atmos. Environ. 2008, 42, 4304–4319. [Google Scholar] [CrossRef]
  27. Kumar, P.; Zavala-Reyes, J.C.; Tomson, M.; Kalaiarasan, G. Understanding the effects of roadside hedges on the horizontal and vertical distributions of air pollutants in street canyons. Environ. Int. 2022, 158, 106883. [Google Scholar] [CrossRef] [PubMed]
  28. Quang, T.N.; He, C.; Morawska, L.; Knibbs, L.D.; Falk, M. Vertical particle concentration profiles around urban office buildings. Atmos. Chem. Phys. 2012, 12, 5017–5030. [Google Scholar] [CrossRef]
  29. Weber, S.; Kuttler, W.; Weber, K. Flow characteristics and particle mass and number concentration variability within a busy urban street canyon. Atmos. Environ. 2006, 40, 7565–7578. [Google Scholar] [CrossRef]
  30. Lu, D.-N.; He, H.-D.; Wang, Z.; Zhao, H.-M.; Peng, Z.-R. Impact of urban viaducts on the vertical distribution of fine particles in street canyons. Atmos. Pollut. Res. 2023, 14, 101726. [Google Scholar] [CrossRef]
  31. Miao, C.; Yu, S.; Zhang, Y.; Hu, Y.; He, X.; Chen, W. Assessing outdoor air quality vertically in an urban street canyon and its response to microclimatic factors. J. Environ. Sci. 2023, 124, 923–932. [Google Scholar] [CrossRef] [PubMed]
  32. Luo, H.; Zhou, W.; Jiskani, I.M.; Wang, Z. Analyzing Characteristics of Particulate Matter Pollution in Open-Pit Coal Mines: Implications for Green Mining. Energies 2021, 14, 2680. [Google Scholar] [CrossRef]
  33. Hernandez, G.; Berry, T.A.; Wallis, S.L.; Poyner, D. Temperature and humidity effects on particulate matter concentrations in a sub-tropical climate during winter. In Proceedings of the International Conference of the Chemical, Biological & Environmental Engineering (ICECB 2017), Queensland, Australia, 20–22 November 2017; Volume 102, pp. 41–49. [Google Scholar] [CrossRef]
  34. Longley, I.D.; Gallagher, M.W.; Dorsey, J.R.; Flynn, M. A case-study of fine particle concentrations and fluxes measured in a busy street canyon in Manchester, UK. Atmos. Environ. 2004, 38, 3595–3603. [Google Scholar] [CrossRef]
  35. Zhu, L.; Ranasinghe, D.; Chamecki, M.; Brown, M.J.; Paulson, S.E. Clean air in cities: Impact of the layout of buildings in urban areas on pedestrian exposure to ultrafine particles from traffic. Atmos. Environ. 2021, 252, 118267. [Google Scholar] [CrossRef]
  36. Jarvi, L.; Kurppa, M.; Kuuluvainen, H.; Ronkko, T.; Karttunen, S.; Balling, A.; Timonen, H.; Niemi, J.V.; Pirjola, L. Determinants of spatial variability of air pollutant concentrations in a street canyon network measured using a mobile laboratory and a drone. Sci. Total Environ. 2023, 856, 158974. [Google Scholar] [CrossRef] [PubMed]
  37. Horvath, H.; Kreiner, I.; Norek, C.; Preining, O. Diesel Emissions in Vienna. Atmos. Environ. 1988, 22, 1255–1269. [Google Scholar] [CrossRef]
  38. Wu, Z.; Wang, C.; Xu, J. Air-borne anions and particulate matter in six urban green spaces during the summer. J. Tsinghua Univ. Sci. Technol. 2007, 47, 2153–2157. [Google Scholar]
  39. Kumar, P.; Garmory, A.; Ketzel, M.; Berkowicz, R.; Britter, R. Comparative study of measured and modelled number concentrations of nanoparticles in an urban street canyon. Atmos. Environ. 2009, 43, 949–958. [Google Scholar] [CrossRef]
  40. Goel, A.; Kumar, P. Vertical and horizontal variability in airborne nanoparticles and their exposure around signalised traffic intersections. Environ. Pollut. 2016, 214, 54–69. [Google Scholar] [CrossRef]
  41. Zhang, Y.W.; Gu, Z.L.; Lee, S.C.; Fu, T.M.; Ho, K.F. Numerical Simulation and In Situ Investigation of Fine Particle Dispersion in an Actual Deep Street Canyon in Hong Kong. Indoor. Built. Environ. 2011, 20, 206–216. [Google Scholar] [CrossRef]
  42. Liu, Z.; Barlow, J.F.; Chan, P.-W.; Fung, J.C.H.; Li, Y.; Ren, C.; Mak, H.W.L.; Ng, E. A Review of Progress and Applications of Pulsed Doppler Wind LiDARs. Remote Sens. 2019, 11, 2522. [Google Scholar] [CrossRef]
  43. Chan, P.W.; Lam, H.Y.; Hon, K.K.; Huang, T.; Yim, S.H.L. Observations of vertical velocity from a Doppler LiDAR in the urban area of Hong Kong. Weather 2023, 78, 228–235. [Google Scholar] [CrossRef]
  44. Yang, Y.; Fan, S.; Wang, L.; Gao, Z.; Zhang, Y.; Zou, H.; Miao, S.; Li, Y.; Huang, M.; Yim, S.H.L.; et al. Diurnal Evolution of the Wintertime Boundary Layer in Urban Beijing, China: Insights from Doppler Lidar and a 325-m Meteorological Tower. Remote Sens. 2020, 12, 3935. [Google Scholar] [CrossRef]
  45. Mammarella, I.; Rannik, U.; Aalto, P.; Keronen, P.; Vesala, T.; Kulmala, M. Long-term aerosol particle flux observations. Part II: Particle size statistics and deposition velocities. Atmos. Environ. 2011, 45, 3794–3805. [Google Scholar] [CrossRef]
  46. Connan, O.; Maro, D.; Hebert, D.; Roupsard, P.; Goujon, R.; Letellier, B.; Le Cavelier, S. Wet and dry deposition of particles associated metals (Cd, Pb, Zn, Ni, Hg) in a rural wetland site, Marais Vernier, France. Atmos. Environ. 2013, 67, 394–403. [Google Scholar] [CrossRef]
  47. Han, D.H.; Shen, H.L.; Duan, W.B.; Chen, L.X. A review on particulate matter removal capacity by urban forests at different scales. Urban For. Urban Green. 2020, 48, 10. [Google Scholar] [CrossRef]
  48. Diener, A.; Mudu, P. How can vegetation protect us from air pollution? A critical review on green spaces’ mitigation abilities for air-borne particles from a public health perspective—With implications for urban planning. Sci. Total Environ. 2021, 796, 148605. [Google Scholar] [CrossRef] [PubMed]
  49. Marucci, D.; Carpentieri, M. Effect of local and upwind stratification on flow and dispersion inside and above a bi-dimensional street canyon. Build. Environ. 2019, 156, 74–88. [Google Scholar] [CrossRef]
  50. Jin, S.; Guo, J.; Wheeler, S.; Kan, L.; Che, S. Evaluation of impacts of trees on PM2.5 dispersion in urban streets. Atmos. Environ. 2014, 99, 277–287. [Google Scholar] [CrossRef]
  51. Wang, X.; Teng, M.; Huang, C.; Zhou, Z.; Chen, X.; Xiang, Y. Canopy density effects on particulate matter attenuation coefficients in street canyons during summer in the Wuhan metropolitan area. Atmos. Environ. 2020, 240, 117739. [Google Scholar] [CrossRef]
  52. Zuo, L.; Zhou, T.; Xu, C.; Chen, S.; Chen, Y.; Liu, S. Research on PM10 diffusion and distribution of moving vehicle in street canyon based on dynamic mesh. J. Transp. Eng. 2022, 10, 100151. [Google Scholar] [CrossRef]
  53. Salmond, J.A.; Williams, D.E.; Laing, G.; Kingham, S.; Dirks, K.; Longley, I.; Henshaw, G.S. The influence of vegetation on the horizontal and vertical distribution of pollutants in a street canyon. Sci. Total Environ. 2013, 443, 287–298. [Google Scholar] [CrossRef]
  54. Gromke, C.; Blocken, B. Influence of avenue-trees on air quality at the urban neighborhood scale. Part II: Traffic pollutant concentrations at pedestrian level. Environ. Pollut. 2015, 196, 176–184. [Google Scholar] [CrossRef]
  55. Litschke, T.; Kuttler, W. On the reduction of urban particle concentration by vegetation—A review. Meteorol. Z. 2008, 17, 229–240. [Google Scholar] [CrossRef]
  56. Luo, X.; Bing, H.; Luo, Z.; Wang, Y.; Jin, L. Impacts of atmospheric particulate matter pollution on environmental biogeochemistry of trace metals in soil-plant system: A review. Environ. Pollut. 2019, 255, 113138. [Google Scholar] [CrossRef]
  57. Chan, L.Y.; Kwok, W.S. Vertical dispersion of suspended particulates in urban area of Hong Kong. Atmos. Environ. 2000, 34, 4403–4412. [Google Scholar] [CrossRef]
  58. De Nicola, F.; Murena, F.; Costagliola, M.A.; Alfani, A.; Baldantoni, D.; Prati, M.V.; Sessa, L.; Spagnuolo, V.; Giordano, S. A multi-approach monitoring of particulate matter, metals and PAHs in an urban street canyon. Environ. Sci. Pollut. Res. 2013, 20, 4969–4979. [Google Scholar] [CrossRef]
  59. Jiang, L.; Bessagnet, B.; Meleux, F.; Couvidat, F.; Tognet, F. Improvement of the vertical mixing in chemistry transport modeling based on a 1.5-order turbulence kinetic energy-based eddy diffusivity closure scheme. Atmos. Res. 2022, 279, 106394. [Google Scholar] [CrossRef]
Figure 1. Section diagram and sampling points in vertical experiment conducted in street canyon.
Forests 15 01319 g001
Figure 2. Regression analysis between the vertical height and PM concentrations of six particulate matter sizes: (a) PM1, (b) PM2.5, (c) PM4, (d) PM7, (e) PM10, and (f) TSP. The blue line indicates the linear model fit, and the gray zone is the 95% confidence interval of the linear model. R2 represents the coefficient of determination. The regression equations for the six PM sizes are shown at the top of each figure. Note: The * in the formula represents the calculation of multiplication; p < 0.05 ** represents significant difference.
Forests 15 01319 g002
Figure 3. Correlation matrix between atmospheric PM concentrations and impact factors in street canyons. Ellipses and darker dots indicate larger correlation coefficients. Height—vertical height of measuring point (m); Tem—Temperature (°C); RH—relative humidity (%).
Forests 15 01319 g003
Disclaimer/Publisher’s Note: The statements, opinions and data contained in all publications are solely those of the individual author(s) and contributor(s) and not of MDPI and/or the editor(s). MDPI and/or the editor(s) disclaim responsibility for any injury to people or property resulting from any ideas, methods, instructions or products referred to in the content.

