Article

Effect of Planting Ground Treatments Using Artificial Rainfall Slope Simulating Degraded Forestland on Drought Stress Susceptibility of Pinus densiflora

1
Department of Crops and Forestry, Korea National University of Agriculture and Fisheries, Jeonju 54874, Republic of Korea
2
Department of Foresty, Jeonbuk National University, Jeonju 54896, Republic of Korea
3
Division of Forest Ecology, National Institute of Forest Science, Seoul 55365, Republic of Korea
*
Author to whom correspondence should be addressed.
These authors contributed equally to this work.
Forests 2024, 15(8), 1323; https://doi.org/10.3390/f15081323
Submission received: 2 July 2024 / Revised: 22 July 2024 / Accepted: 23 July 2024 / Published: 30 July 2024
(This article belongs to the Section Forest Ecology and Management)

Abstract

:
Trees in degraded forest areas are generally exposed to water stress due to harsh environmental conditions, threatening their survival. This study simulated the environmental conditions of a degraded forest area by constructing an artificial rainfall slope and observing the physiological responses of Pinus densiflora to control, mulching, and waterbag treatments. P. densiflora exhibited distinct isohydric plant characteristics of reducing net photosynthetic rate and stomatal transpiration rate through regulating stomatal conductance in response to decreased soil moisture, particularly in the control and waterbag treatments. Additionally, the trees increased photochemical quenching, such as Y(NPQ), to dissipate excess energy as heat and minimize damage to the photosynthetic apparatus. However, these adaptive mechanisms have temporal limitations, necessitating appropriate measures. Under extreme drought stress (DS45), mulching treatment showed 4.5 times and 2.2 times higher in PIabs and SFIabs than in the control, and after the recovery period (R30), waterbag and mulching treatment showed similar levels, while PIabs and SFIabs in the control were only 45% and 75% of those in the mulching and waterbag treatments, respectively. Specifically, mulching extended the physiological mechanisms supporting survival by more than a week, making it the most effective method for enhancing the planting ground in degraded forest areas. Although the waterbag treatment was less effective than mulching treatment, it still significantly contributed to forming better growth conditions compared to the control. These findings highlight the potential for mulching and waterbag treatments to enhance forest restoration efforts, suggesting future research and application could lead to more resilient reforested areas capable of withstanding climate change-induced drought conditions.

1. Introduction

Forests play a crucial role in maintaining biodiversity by providing habitats for a variety of species. They also perform essential public functions that support stable human living, such as absorbing greenhouse gases, purifying the air, preventing soil erosion and landslides, and protecting water resources [1]. However, despite the importance of forests, rapid industrialization, population concentration, and increased demand for tourism and recreational facilities have led to a surge in large-scale constructions, such as roads, golf courses, and ski resorts, which cause forest degradation. In the Republic of Korea, where more than 60% of the land is forested, it is particularly challenging to completely restrict mountainous areas [2,3,4,5]. Consequently, various approaches have been attempted to address the inevitable increase in forest degradation due to such developments from both ecological and disaster prevention perspectives [6,7,8].
The restoration process of degraded forest areas is preceded by analyzing the causes of degradation and conducting preliminary environmental assessments to determine restoration methods. In addition, this typically includes the introduction of vegetation through the planting of seeds or seedlings, the installation of reinforcements to prevent erosion, post-restoration monitoring, and supplementary construction [9]. Factors to consider when deciding on a restoration method for degraded forest areas include disaster risk, ecological connectivity, and economic feasibility. Particularly, restoration sites located in valleys are characterized by severe soil erosion and downstream runoff due to rainfall, coupled with the challenge of achieving soil stabilization through tree roots. This increases the risk of floods and soil erosion, posing threats to human life and property [5,10]. In this context, directly planting seedlings as a restoration method for degraded forest areas can shorten the restoration period, prevent soil loss through the net effect of roots, and improve landscape connectivity and biodiversity. However, the unique environmental conditions of degraded areas often make it difficult to enhance the actual survival rate of the trees [3,7,11]. Generally, restoration sites located in valleys, except for some downstream areas composed of deposited soil, have shallow soil depth and low organic matter content, leading to significantly reduced soil moisture retention as the residence time of water introduced by rainfall is short. Furthermore, these regions are immediately exposed to weather factors like dehydration, gusty winds, and fluctuating temperatures that endanger typical tree growth [5]. The increasing occurrence of abnormal weather patterns due to climate change exacerbates these problems. In this context, directly planting seedlings as a restoration method for degraded forest areas can shorten the restoration period, prevent soil loss through the net effect of roots, and improve landscape connectivity and biodiversity. However, the unique environmental conditions of degraded areas often make it difficult to enhance the actual survival rate of the trees [3,7,11]. Generally, restoration sites located in valleys, except for some downstream areas composed of deposited soil, have shallow soil depth and low organic matter content, leading to significantly reduced soil moisture retention as the residence time of water introduced by rainfall is short. Furthermore, these regions are immediately exposed to weather factors like dehydration, gusty winds, and fluctuating temperatures that endanger typical tree growth [5]. The increasing occurrence of abnormal weather patterns due to climate change exacerbates these problems.
When restoring degraded areas by planting seedlings, it is essential to propose scientifically efficient and economical methods for supplementing the planting ground and selecting tree species with high environmental resistance. Pinus densiflora, the most common species in Korean forests, is capable of withstanding harsh and drought conditions. As a pioneer species, it has the potential to be naturally succeeded by deciduous broad-leaved forests in the future [12].
Mulching with coir nets is commonly used to prevent seed and soil loss during the revegetation of slopes around roads [13]. Recently developed waterbags, made of permeable bags filled with highly moisture-retentive vermiculite, are designed to retain water that would otherwise quickly be lost below the soil surface. These waterbags gradually release moisture as the soil dries, improving the survival rate of planted seedlings over the long term by enhancing soil moisture conditions [14]. They are designed to retain water lost quickly below the soil surface and gradually release moisture as the soil dries, thereby improving the survival rate of planted seedlings in the long term by enhancing soil moisture conditions.
This study aims to investigate the impact of mulching and waterbag supplementation on mitigating drought stress in Pinus densiflora. By creating an artificial rainfall slope that simulates the conditions of a degraded area in a controlled environment, the study seeks to provide basic data on effective planting ground establishment methods for successful restoration of degraded forest areas with harsh environmental conditions, such as valleys. The artificial rainfall slope was designed to closely mimic the natural conditions of degraded forest areas, with specific parameters such as soil composition, soil hardness, and soil moisture content matched to those observed in the model area, ensuring that the experimental setup closely reflects real-world conditions.

2. Materials and Methods

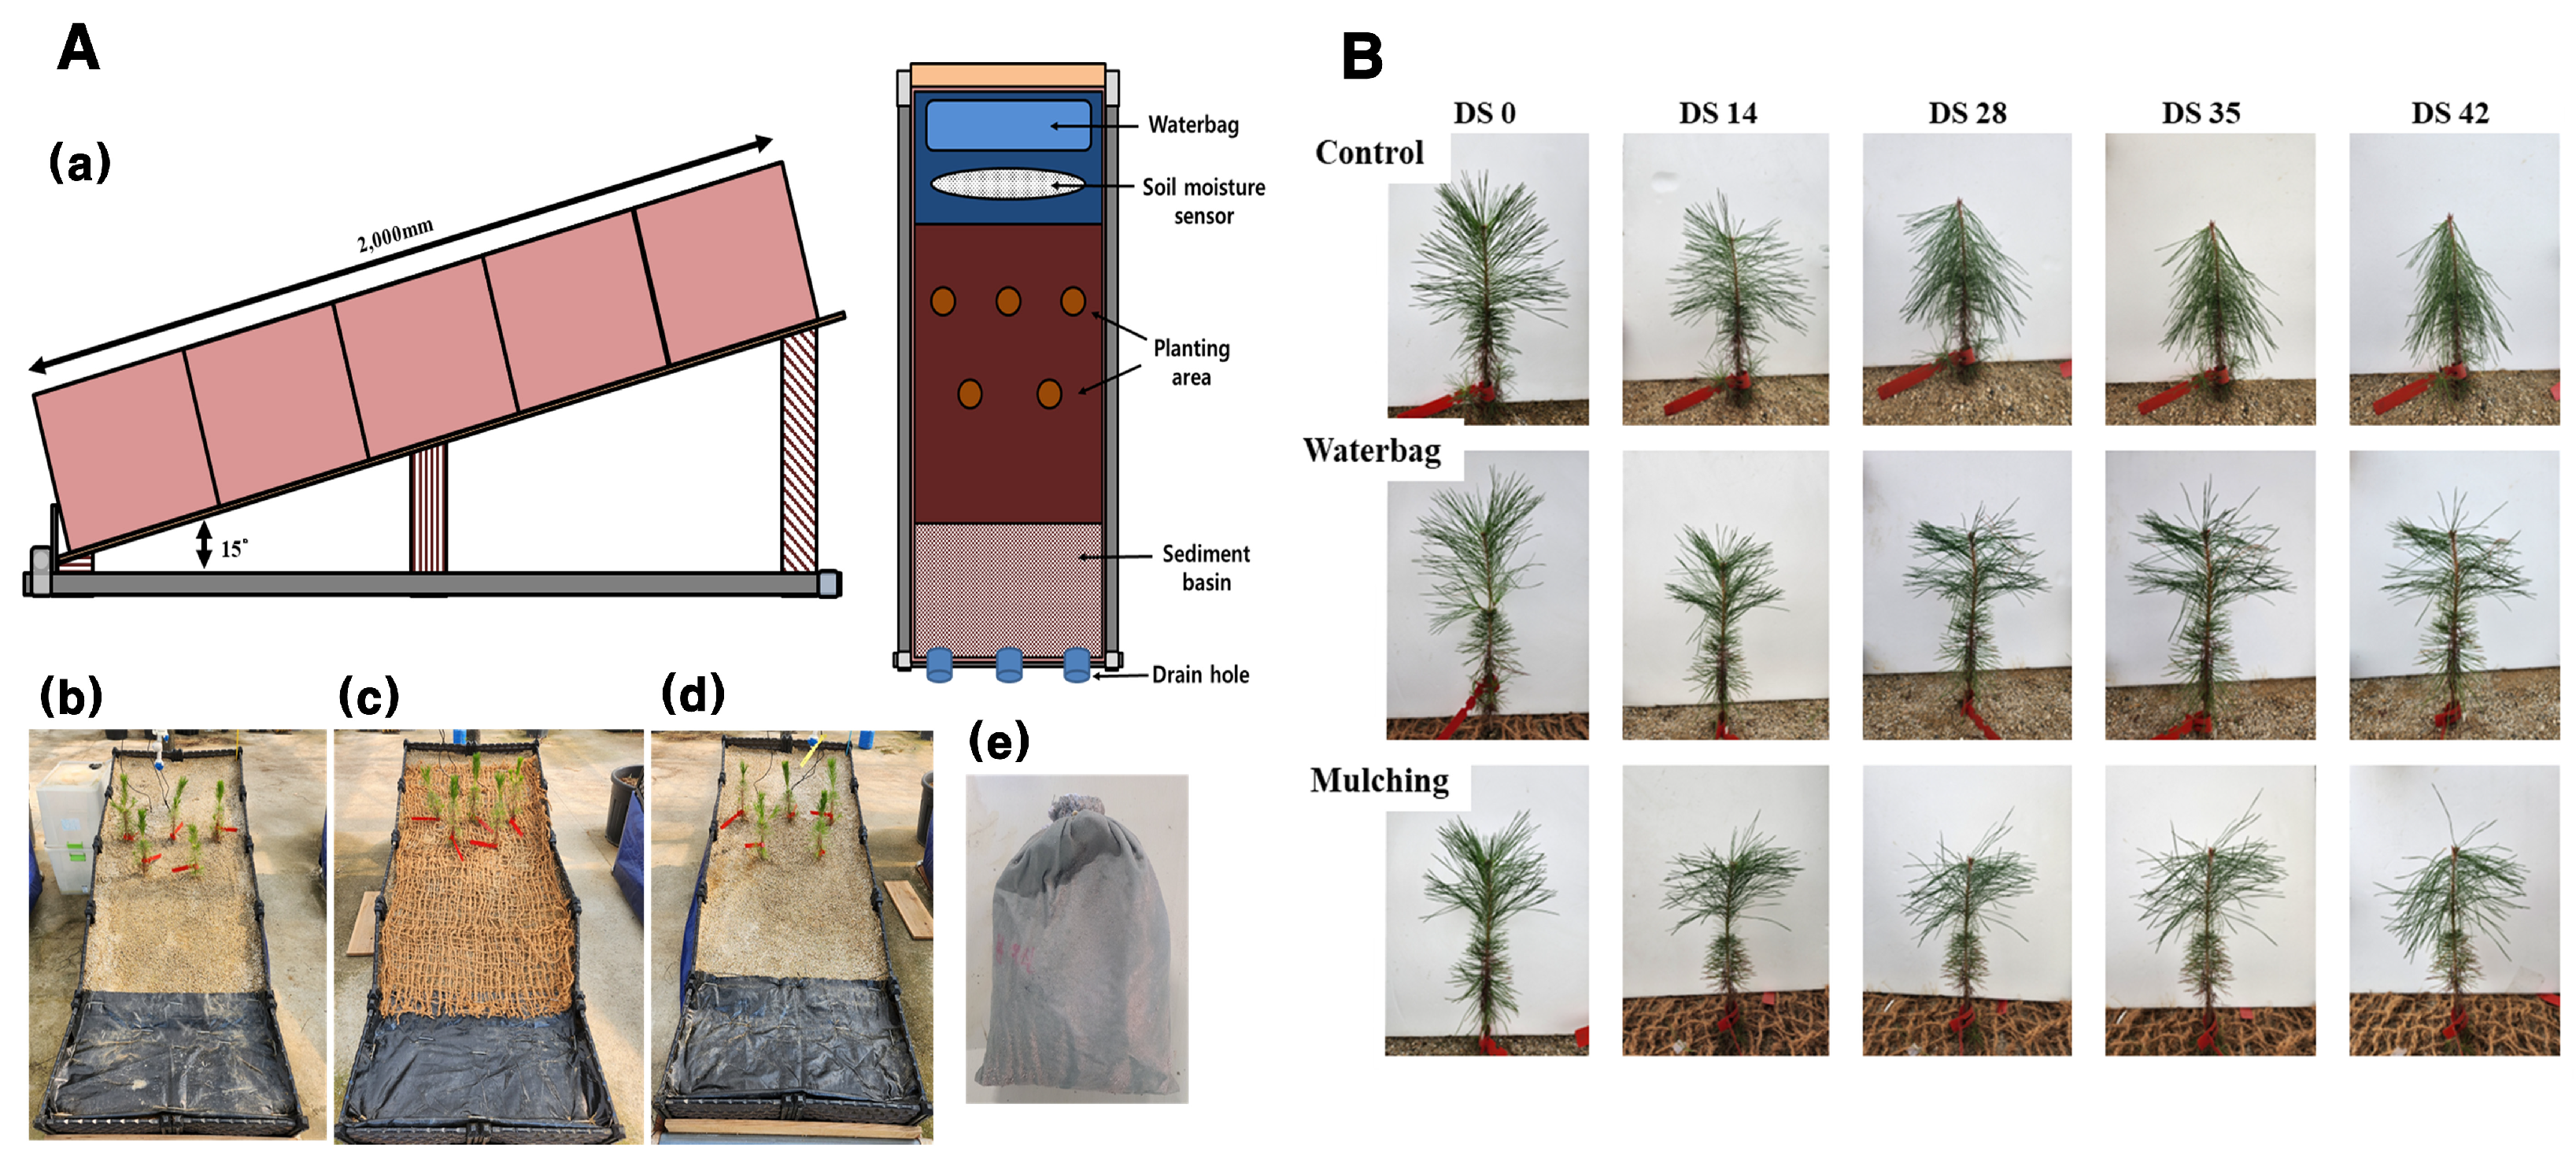
2.1. Artificial Rainfall Testing Plot for Simulating Forest Degradation

From April to May 2023, an artificial rainfall slope simulating forest degradation sites was established in a greenhouse at the Korea National Agricultural and Fisheries University. This slope was created using a variable module form with adjustable height to mimic the physical soil properties such as slope, soil texture, and soil hardness of the forest degradation modeled area as closely as possible. The modeled area for the artificial rainfall slope is a degraded forest area located in Jeongseon, Gangwon State, at an altitude of 600–700 m. This area was artificially filled in the valley for the construction of the Pyeongchang Winter Olympic alpine slopes. The region has a slope of about 11–15°, soil hardness of 19.7–23.7 mm, and soil texture characterized by 58% sand, 29% silt, and 13% clay, indicating sandy soil properties [5].
For the artificial rainfall slopes, nine plots were constructed, each with dimensions of 0.8 m in width, 2.0 m in length, and 0.4 m in height. The slopes were mounted using stands made from plywood, wooden pillars, and steel pipes, simulating a gradient of 14–16°. To minimize interference between the plots and ensure smooth experimentation, a pathway of approximately 0.6 m was created between each plot. The soil for the planting ground was a uniform mixture of river sand, weathered granite soil, and silica sand in a ratio of 5:3:2 (v:v:v), similar to the soil texture and moisture content of the modeled area. This mixture was finalized after a preliminary experiment monitoring soil moisture content for about two weeks, adjusting the volume ratios of weathered granite soil, river sand, and silica sand. Before adding soil, a corrugated structure (5 cm in height) was installed at the bottom of the vegetation beds to prevent soil erosion. Sprinklers were installed 1 m above the surface, with two per slope. To stabilize the soil and increase soil hardness, the soil was evenly watered for about four weeks and compacted physically to ensure even moisture penetration. As a result, the final soil hardness before planting seedlings was 14.0 ± 0.8 mm, mimicking the characteristics of the modeled area.
On 23 May 2023, three treatment groups—control, waterbag, and mulching—were randomly assigned and replicated three times. The waterbags, provided by the National Institute of Forest Science, consisted of 300 g of vermiculite in permeable non-woven fabric bags, with three waterbags placed at the top of each slope. The mulching used commercially available coir nets to cover the entire soil surface, minimizing exposure. Sedimentation zones were created at the bottom of each slope, measuring 0.8 m in width, 0.4 m in length, and 5 cm in depth.
The artificial rainfall system was designed to ensure even water distribution from the top to the bottom of the slopes. Rainfall was provided once a week at a rate of 29.69 ± 10.70 mm per hour until early July for initial establishment and stabilization of vegetation, and then stopped during the drought stress experiment in August. Additionally, to simulate subsurface water infiltration, a trench (0.6 m wide, 10 cm deep) was dug at the top of each slope, with 5 L of water added per treatment without direct surface contact.
Soil moisture content was monitored using soil moisture sensors (Water Scout SM100-6460-20, Spectrum Technologies, Inc. Aurora, IL, USA), with one sensor installed per slope and replicated three times per treatment. The sensors were placed horizontally between the waterbags and vegetation in the waterbag treatment and in corresponding locations in other treatments. Data loggers (WatchDog 1000 series Micro stations, Spectrum Technologies, Inc. USA) were installed 2 m high to avoid interference from watering, recording soil moisture changes every 5 min during the experiment.
The seedlings used in the experiment were 1–0 pine seedlings provided by the National Institute of Forest Science. On 7 June 2023, five pine seedlings were planted per slope, totaling 45 seedlings (15 per treatment) (Figure 1). Initial stabilization was encouraged for about two months post-planting, with the drought stress experiment conducted from 1 August to 14 September 2023. Newly emerged shoots from this year were used for the experiment, and drought stress was induced by withholding water after the final watering on 31 July 2023.
After the completion of the overall drought stress experiment, a 30-day recovery period (R30) was implemented. During this period, watering cycles, methods, and amounts were maintained the same as before the stress experiment to promote tree recovery. Environmental conditions within the greenhouse were not artificially adjusted, ensuring that ambient temperature, relative humidity, and light conditions remained similar to natural state conditions.

2.2. Growth Characteristics and Leaf Water Saturation Deficit

To compare growth characteristics under drought stress, the diameter at root-collar (DRC) was measured using a caliper at 1 cm above the ground for all seedlings. To minimize errors due to irregular root-collar shapes, measurements were taken twice per seedling at right angles (+) and averaged.
Water saturation deficits (WSD) were investigated with nine replicates. Around 10 a.m., leaves were excised, and their fresh weight (FW) was immediately measured using an electrical balance (CPA224S, Sartorius, Inc. Goettinge, Germany). Then, the leaves were placed in a dark environment at room temperature (20–25 °C) for over 24 h to absorb water until they reached their maximum turgid weight (TW). After measuring the turgid weight, the leaves were dried at 80 °C for 48 h to determine the dry weight (DW). The water saturation deficit was calculated using the formula WSD = (TW − DW)/(FW − DW) [15,16].

2.3. Photosynthetic and Stomatal Response

Photosynthetic and stomatal responses to drought stress were measured using a portable photosynthesis system (Li-6800, Li-Cor Inc., Lincoln, NE, USA). The PPFD (photosynthetic photon flux density) was set to 1200 µmol·m−2·s−1 using the attached LED light source. Measurements included maximum photosynthetic rate (Amax), stomatal transpiration rate (E), and stomatal conductance (gs). Leaf area was calculated using the Winseedle (ver. 2020a) program immediately after measurement. Instantaneous transpiration efficiency (ITE) was calculated from these data [17,18]. The CO2 response curve (A-Ci) for mesophyll CO2 concentration was used to calculate the maximum carboxylation rate (Vcmax) and the maximum electron transport rate (Jmax) [19]. The common conditions for measurements were an airflow into the chamber of 600 μmol·s−1 and a temperature of 25 ± 1 °C.
Experiments were conducted weekly from August 1 to September 4, 2023, with nine repetitions per treatment. Photosynthetic experiments continued as long as possible, with different end points for each treatment based on plant health.

2.4. Chlorophyll a Fluorescence Response

Chlorophyll a fluorescence responses were analyzed using OKJIP curves and imaging fluorescence analysis. OKJIP analysis was conducted weekly during drought stress on 27 leaves per treatment and again 30 days after re-watering (R30). A plant efficiency analyzer (Hansatech Instrument Ltd., King’s Lynn, UK) was used for measurements after 30 min of dark adaptation, with chlorophyll fluorescence measured at 50 µs (O step), 300 µs (K step), 2 ms (J step), 30 ms (I step), and 500 ms (P step). Biophysical parameters were calculated from OKJIP analysis [16,20]. Imaging fluorescence analysis was conducted weekly from day 1 (DS0) to day 42 (DS42) of drought stress, except for day 45 due to equipment failure. IMAGING-PAM (IMAG-K7 by Walz GmbH, Effeltrich, Germany) was used, with dark adaptation for 30 min before measurement. The ImagingWin v2.41 software was used to analyze Y(II), Y(NO), and Y(NPQ) from defined areas of interest (AOI) on the leaves [21,22]. The parameters related to chlorophyll fluorescence are described in Table 1.

2.5. Leaf Pigment Content

Chlorophyll and carotenoid content were measured on days 1 (DS1), 21 (DS21), 45 (DS45) of drought stress, and 30 days after re-watering (R30), with 15 repetitions per treatment. Leaf pigments were extracted by placing 0.1 g of leaf tissue in 10 mL of dimethyl sulfoxide (DMSO) solution in 20 mL glass vials and incubating at 65 °C for 6 h [23]. Absorbance at 663 nm, 645 nm, and 470 nm was measured using a UV/VIS spectrophotometer (HP 8453, Hewlett Packard, Wilmington, DE, USA) to calculate chlorophyll a, b, a + b, and carotenoid content [16].

2.6. Data Analysis

Statistical analysis was performed using SPSS Statistics program 19.0 (SPSS Inc., Chicago, IL, USA). Two-way ANOVA was used to examine the effects and interactions of drought treatment duration and planting ground treatment method on chlorophyll and carotenoid content and chlorophyll fluorescence indicators. One-way ANOVA was used to compare mean differences among groups over different drought treatment periods. Levene’s test was used to check for homogeneity of variances, and post hoc tests were conducted using Tukey’s HSD at the 5% significance level.

3. Results

3.1. Soil Moisture Content

Figure 2 shows the changes in soil moisture content on an indoor artificial rainfall-modeled slope according to different vegetation-based treatments. Throughout the time of the periodic rainfall treatment, mulching treatment resulted in a greater immediate increase in soil moisture due to rainfall compared to other treatments, and the decrease afterward was not significant, resulting in a higher overall soil moisture content. In the case of the waterbag treatment, the initial increase in soil moisture content due to rainfall was similar to the control group, but the decrease afterward was more gradual compared to the control. This trend continued during the drought stress experiment, with a similar pattern observed in the initial decrease in soil moisture. After the rainfall treatment on July 31 (DS0), the order of higher soil moisture content was mulching treatment > waterbag treatment = control, followed by a rapid decrease in soil moisture content in all treatments until August 11 (DS11) (phase I). During phase I, soil moisture content decreased by 39.9%, 43.3%, and 47.0% for the control, waterbag treatment, and mulching treatment, respectively, compared to DS0. At DS11, the order of higher soil moisture content was mulching treatment > waterbag treatment > control, with the waterbag showing a relatively gradual decrease compared to the other treatments. From August 12 (DS12) to September 14 (DS45), the decrease in soil moisture content was much more gradual in all treatments compared to phase I (phase II). Particularly after August 16 (DS16), the soil moisture content was in the order of mulching treatment = waterbag treatment > control (Figure 2).

3.2. Diameter at Root-Collar and Leaf Water Saturation Deficit

The water saturation deficit (WSD) showed a gradual increase with drought in all treatments, with significant differences between treatments observed from DS42 (Figure 3A). The WSD at DS42 was 32.8 ± 7.2% for the control, 26.9 ± 6.5% for the waterbag treatment, and 26.5 ± 5.7% for mulching treatment. Compared to DS35, this represented a rapid increase of 66.3%, 45.3%, and 45.8%, respectively. The control showed a statistically significant higher level compared to the waterbag and mulching treatments by about 18.0% and 19.4%, respectively (p < 0.05). Regarding the changes in diameter at root-collar (DRC) due to drought stress (Figure 3B), mulching treatment showed about 39% higher relative growth in DRC compared to the control and waterbag treatments, but the variability between individuals was large, resulting in no statistical significance (p > 0.05).

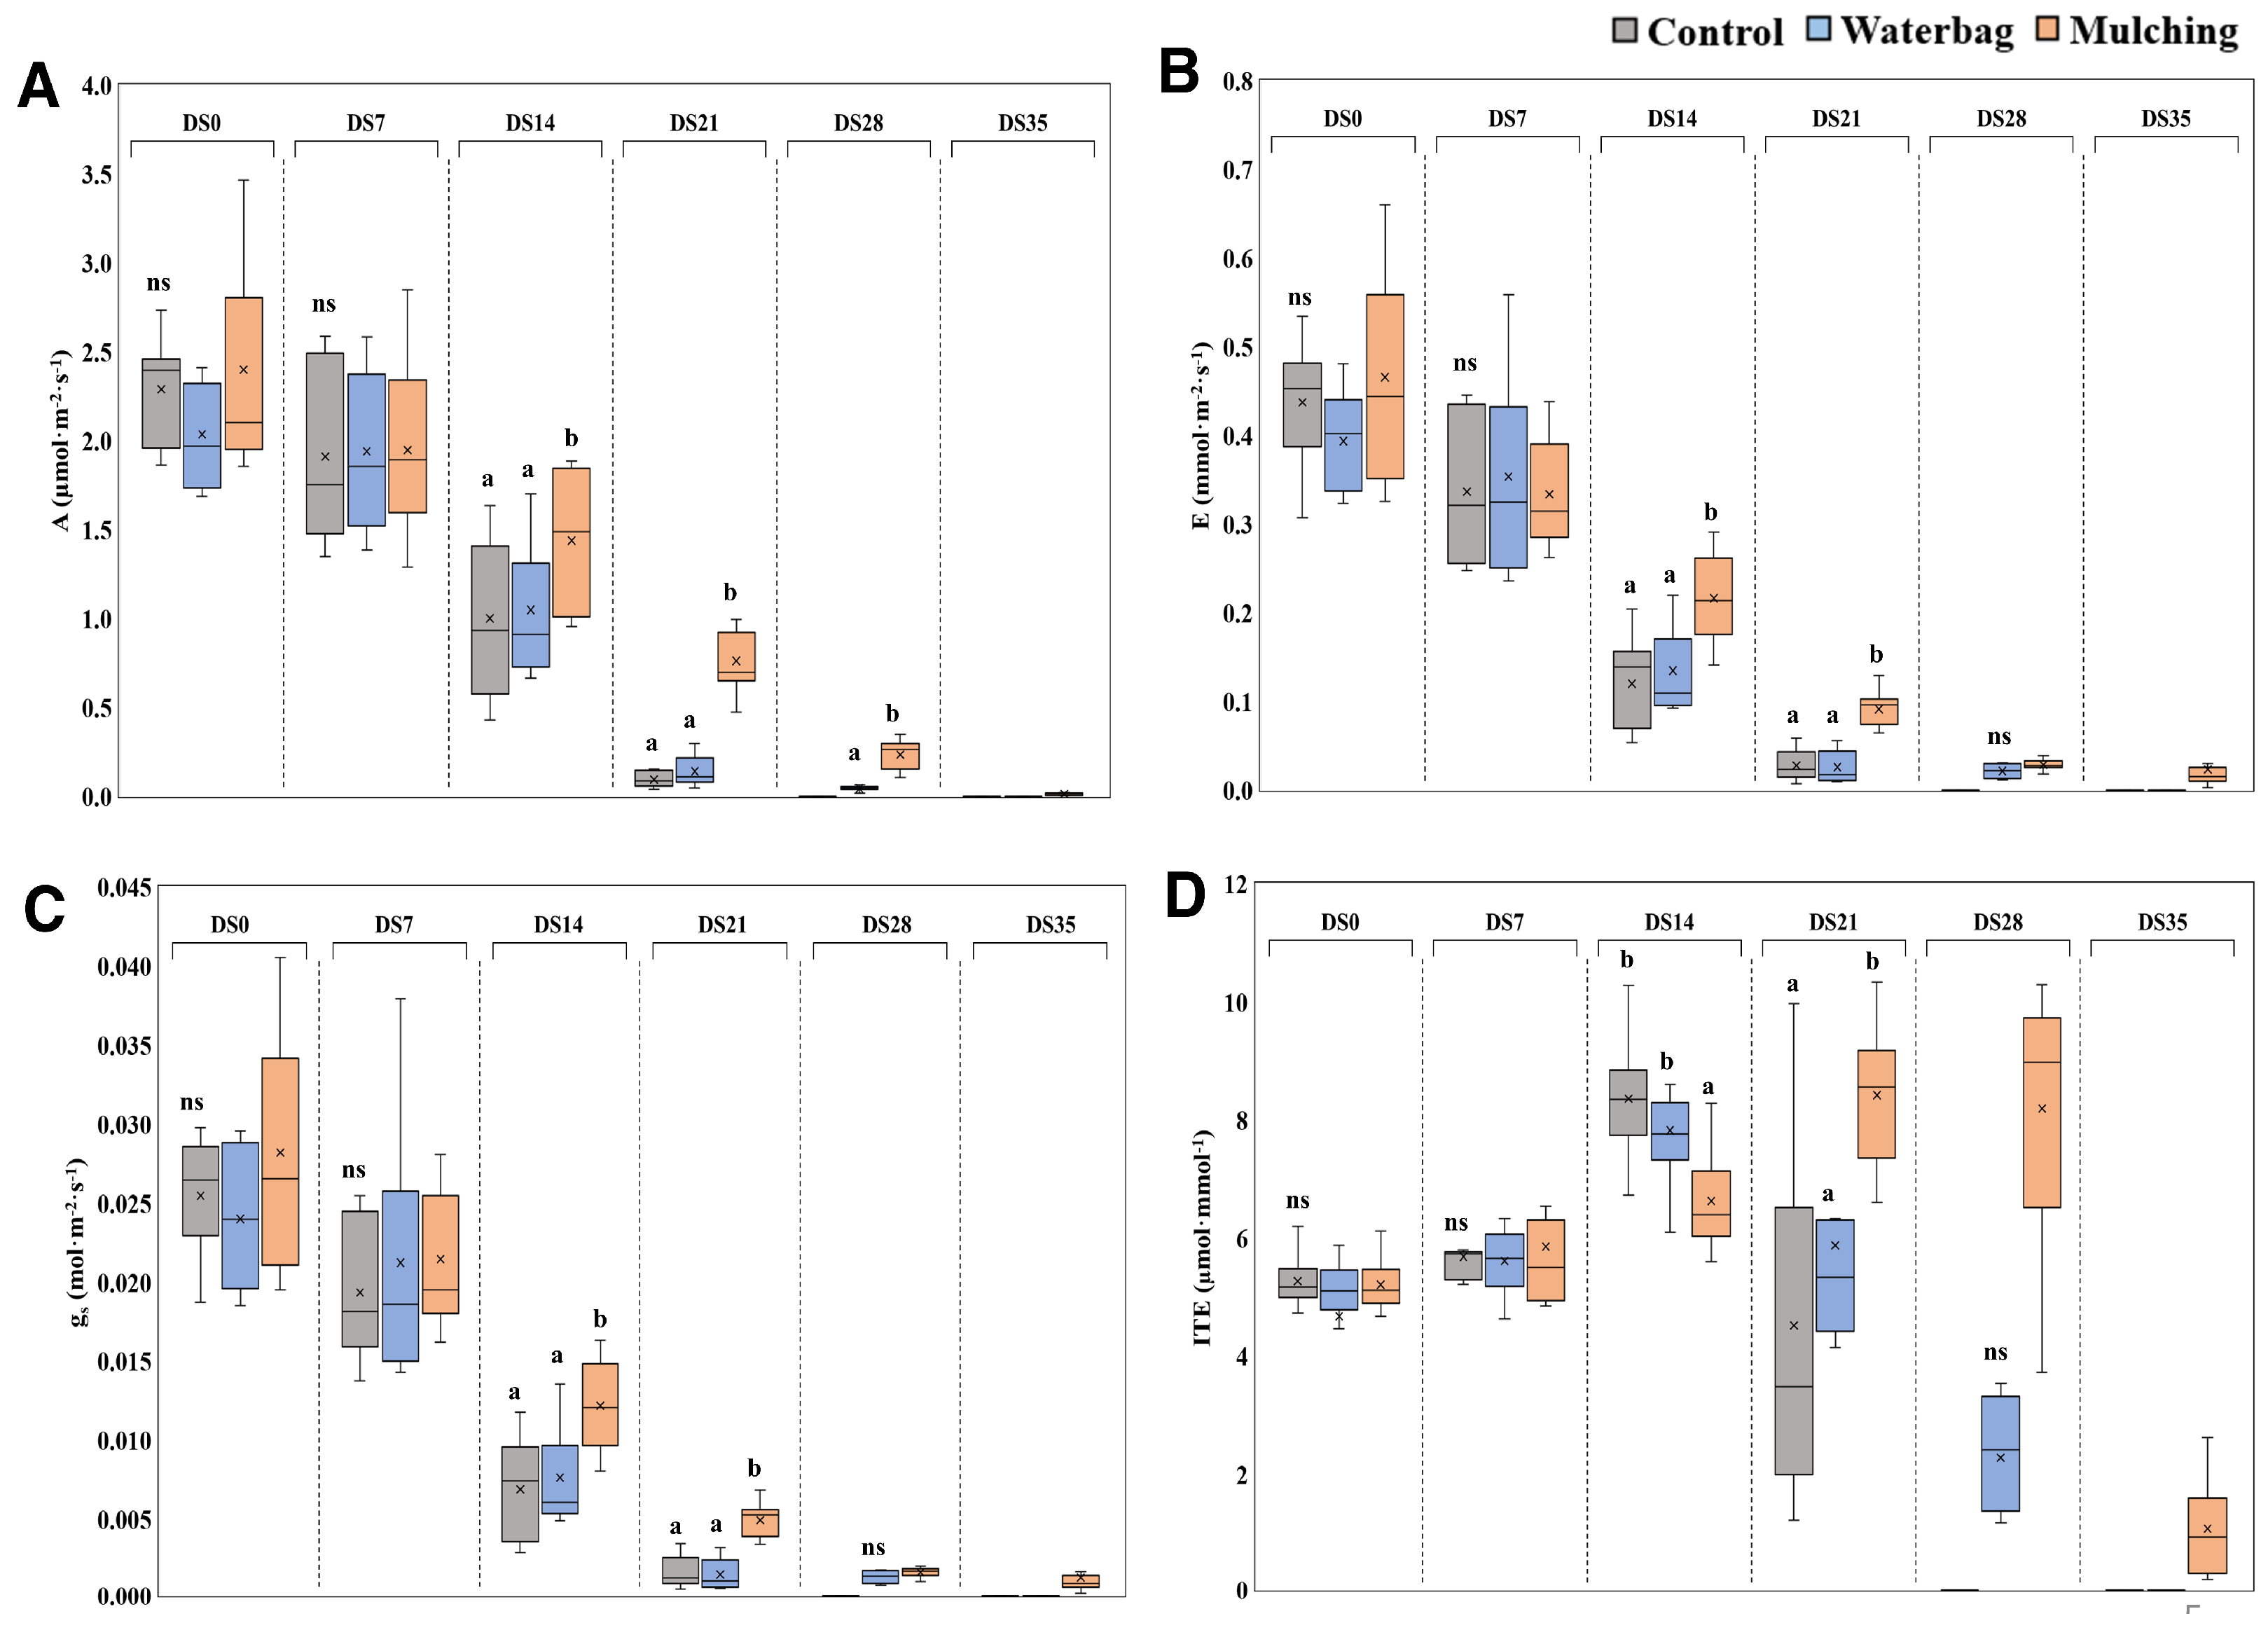
3.3. Photosynthesis and Stomatal Responses

As the drought treatment period prolonged, the net photosynthetic rate (A), stomatal conductance (gs), and stomatal transpiration rate (E) showed a gradual decrease in all treatments. Overall, mulching treatment maintained the highest net photosynthetic rate across all periods. From DS14, significant differences between treatments were observed, corresponding to the early phase II, where soil moisture decrease was gradual. At this point, the net photosynthetic rate of mulching treatment was 43% higher than the control and 37% higher than the waterbag treatment. By DS21, mulching treatment maintained a net photosynthetic rate of 0.76 ± 0.16 µmol·m2·s1, while the control and waterbag treatment showed very low rates, approximately 12.4% and 18.3% of mulching treatment, respectively. This trend was also observed in stomatal conductance and stomatal transpiration rate. At DS28, almost all individuals in the control showed no measurable photosynthetic or stomatal response, whereas mulching treatment still performed photosynthesis and stomatal functions at low levels. Finally, none of the treatments performed photosynthesis at DS35 (Figure 4). The instantaneous transpiration efficiency (ITE) showed a temporary increase in the control and waterbag treatments at DS14, followed by a marked decrease, whereas mulching treatment maintained relatively high ITE until DS28. However, at this point, the variability among individuals was large, showing no statistical significance (p < 0.05).
The maximum carboxylation rate (Vcmax) and electron transport rate (Jmax) showed no significant differences between treatments until early phase II (DS14) (p > 0.05), and after DS21, the control and waterbag treatments were not measurable (nd). However, the mulching treatment maintained similar levels to DS14, even at DS21 (Table 2).

3.4. Leaf Pigment Content

Observing changes in chlorophyll and carotenoid content, all treatments showed almost no difference in total chlorophyll content until DS21, but by DS45 under extreme drought stress, there was a slight decrease to about 83%–87% of DS21 levels. This trend was the same for chlorophyll a and chlorophyll b. In the case of carotenoid content, mulching treatment showed a slight decrease by DS45, but other treatments showed no significant change compared to DS0. The ratio of chlorophyll content to carotenoid content (T chl/car) showed a similar decreasing trend to chlorophyll content in all treatments. The control had the highest chlorophyll and carotenoid content across all periods, but T chl/car showed no significant difference between treatments. Comparing the chlorophyll and carotenoid content at the recovery period (R30) 30 days after re-watering with DS45, mulching treatment showed the most increase, with total chlorophyll content increasing by 22% and carotenoid content by 32%, followed by the waterbag treatment with 11% and 21% increase, respectively. However, the control showed almost no change or a slight decrease in chlorophyll b and total chlorophyll content. The T chl/car showed a continuous decrease across all treatments even after the recovery period (Table 3).

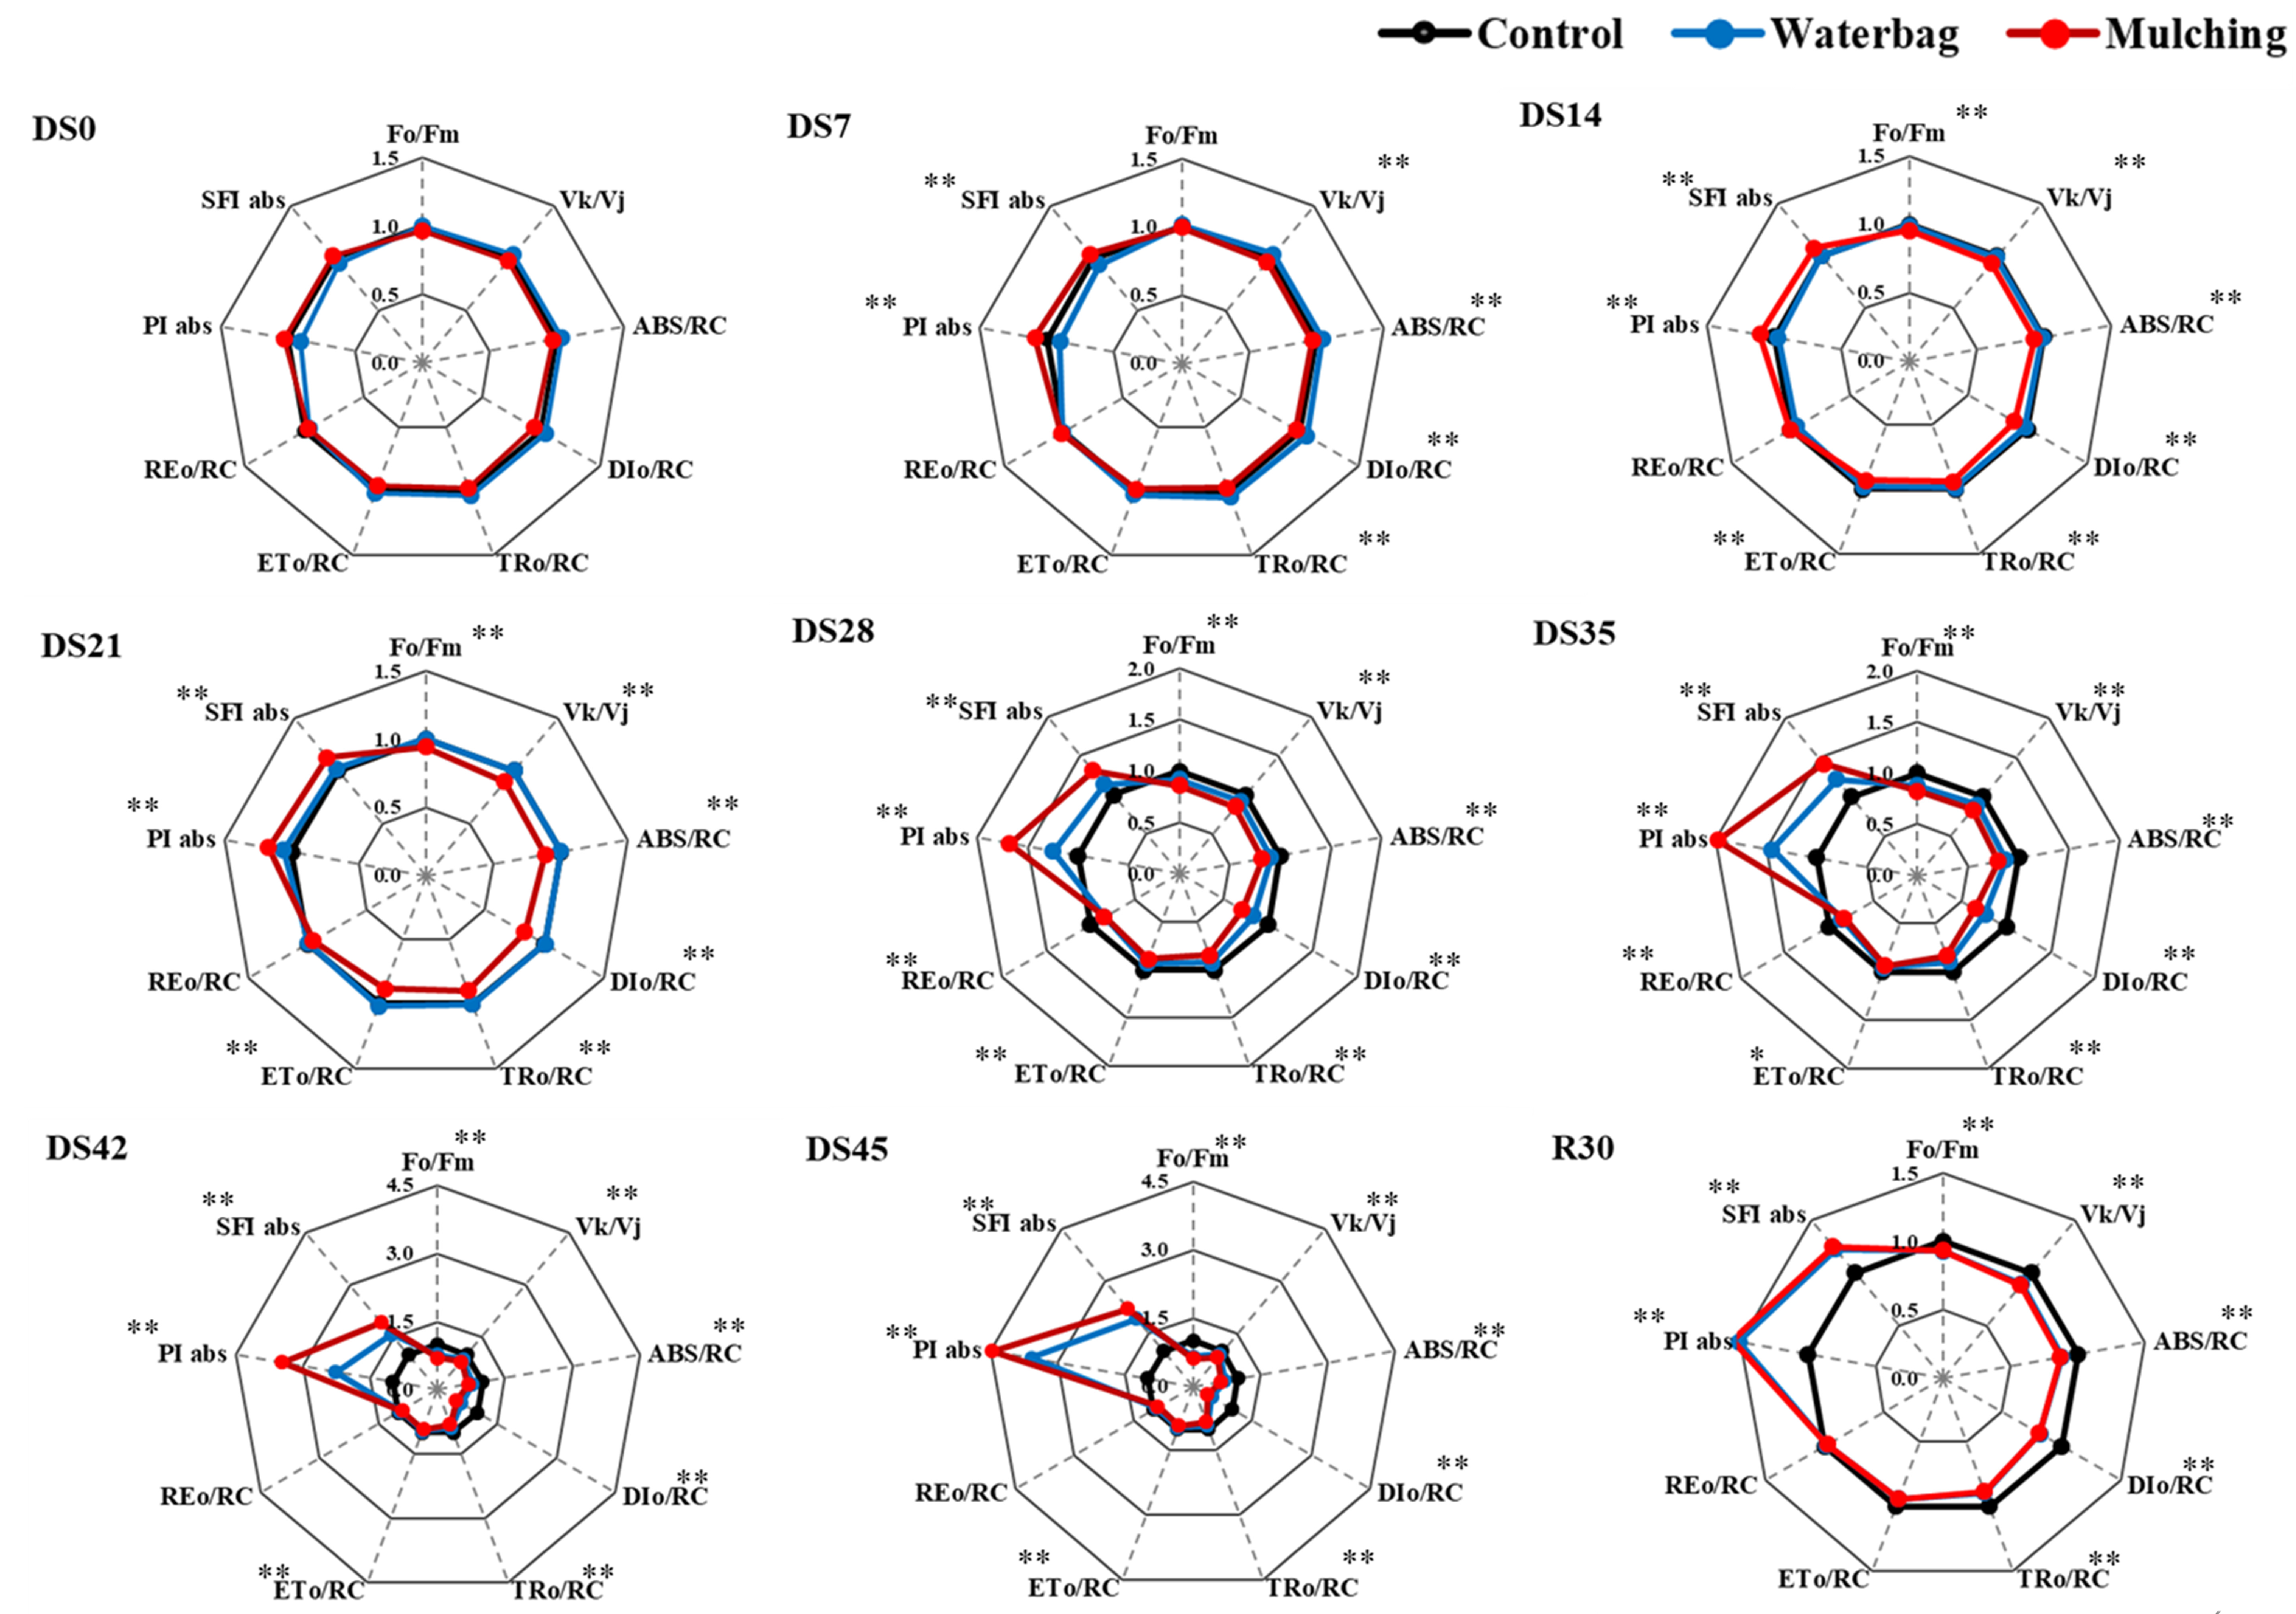
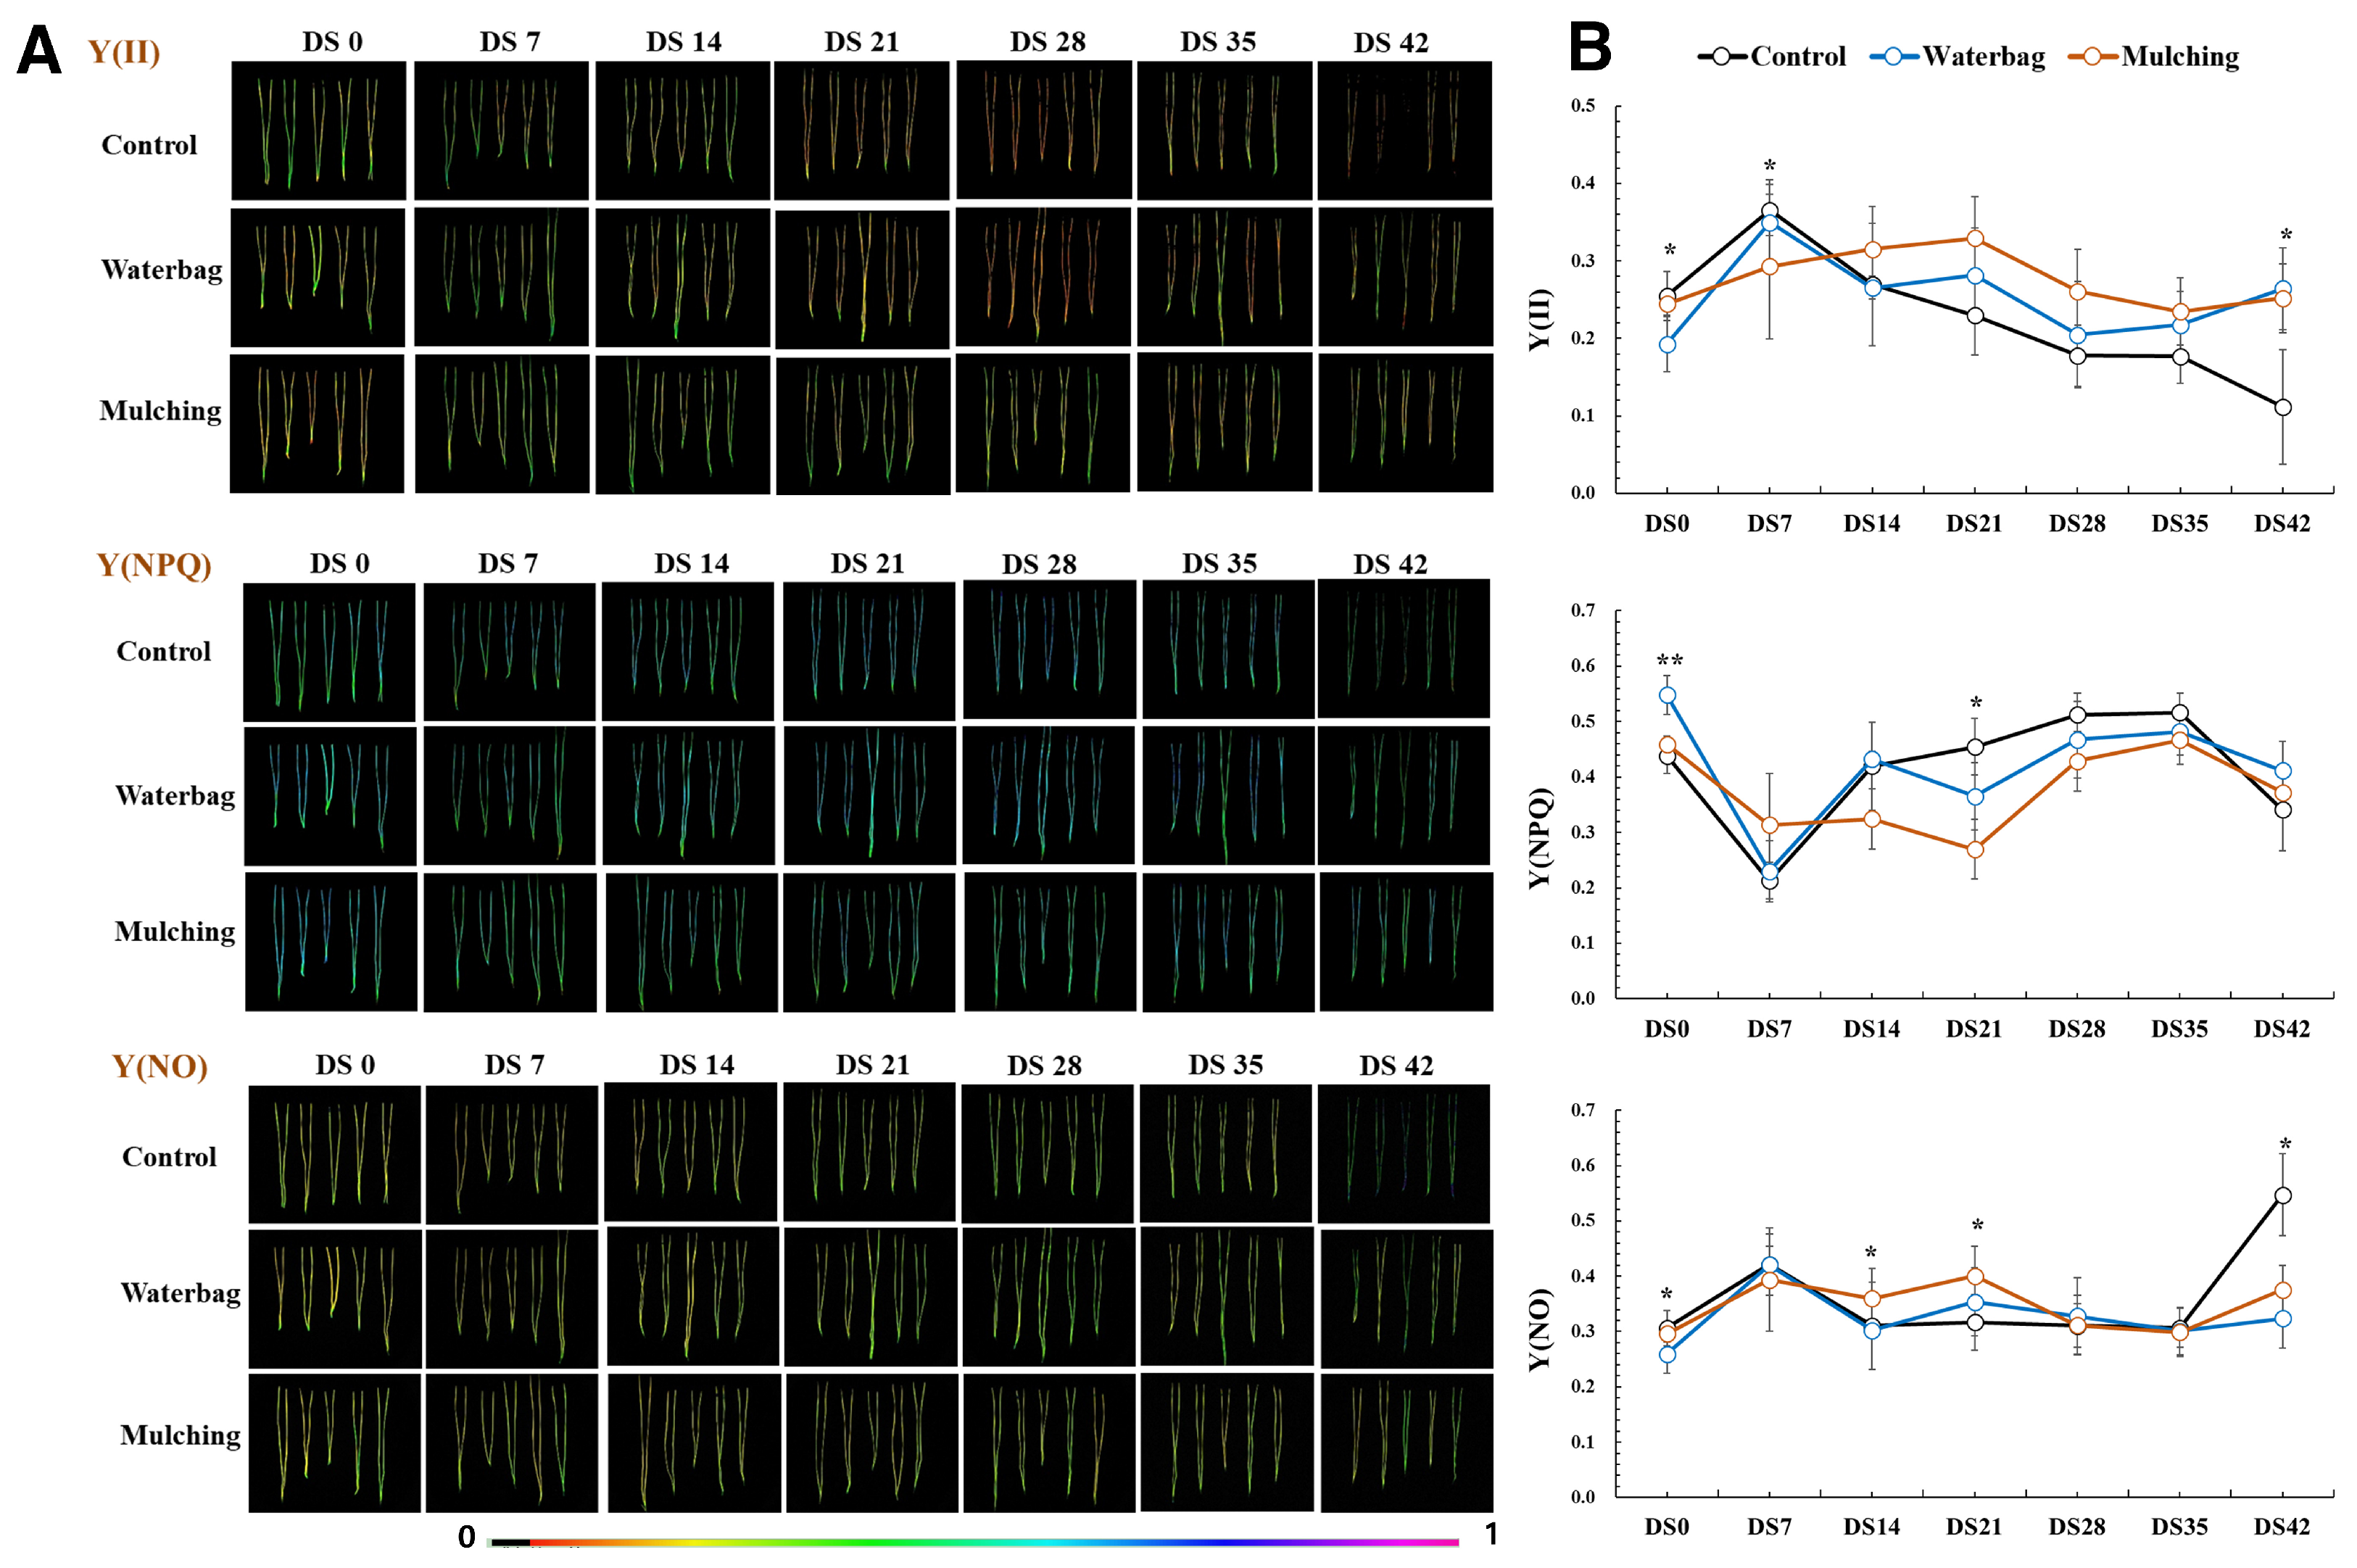
3.5. Chlorophyll Fluorescence and Imaging Fluorescence Responses

Detailed chlorophyll fluorescence indicators derived from the OKJIP curve analysis during the drought stress period are shown in Figure 5. The Fo/Fm is the ratio of initial fluorescence (Fo) to maximum fluorescence (Fm), and VK/VJ represents subtle fluorescence changes sensitive to drought or high temperature. ABS/RC, DIo/RC, TRo/RC, ETo/RC, and REo/RC are energy fluxes per reaction center of photosystem II, while PIabs and SFIabs represent energy conservation efficiency and the structure and function of the photosynthetic apparatus, respectively. These indicators are used as vitality indices for the photosynthetic apparatus under various environmental stresses [20,24].
Most indicators showed no significant differences between treatments until DS14, but from DS21, mulching treatment showed lower Fo/Fm, VK/VJ, ABS/RC, DIo/RC, TRo/RC, ETo/RC, and REo/RC compared to other treatments, while PIabs and SFIabs showed higher trends. This trend continued with mulching treatment, waterbag treatment, and control, in that order. Among all fluorescence indicators, PIabs and SFIabs showed the most significant differences between treatments, indicating their high sensitivity to drought stress. This means that PIabs and SFIabs are highly responsive to changes in environmental changes, such as soil moisture, and can effectively reflect the level of drought stress experienced by the plants.
At DS28, mulching treatment’s PIabs and SFIabs were 67.7% and 31.3% higher, respectively, than the control, while the waterbag treatment was at intermediate levels between mulching treatment and the control, with 25.1% and 13.7% higher levels than the control, respectively. Under extreme drought stress at DS45, mulching treatment’s ABS/RC and DIo/RC were 62.1% and 37.4% lower, respectively, than the control, while PIabs and SFIabs were 4.5 times and 2.2 times higher, respectively. After the 30-day recovery period with re-watering, the waterbag and mulching treatments showed similar levels, but compared to the control, other treatments maintained higher ABS/RC, DIo/RC, TRo/RC, and ETo/RC levels, while PIabs and SFIabs were only 45% and 75% of those in mulching and the waterbag treatments, respectively.
Chlorophyll fluorescence imaging and quantum yield observed during the drought stress period are shown in Figure 6. Y(II) represents the effective quantum yield, Y(NPQ) represents non-photochemical quenching, and Y(NO) represents non-regulated non-photochemical quenching. These indicators satisfy the relationship Y(II) + Y(NPQ) + Y(NO) = 1. Particularly, Y(NO) is known to have a value of about 0.2 in healthy green leaves, the same as Fo/Fm, and an increase in Y(NO) is considered damage to the photosynthetic apparatus due to stress [25]. As drought stress intensified, significant changes in fluorescence images between treatments were not observed until DS35, but by DS42, relatively clear images were observed in mulching treatment. Comparing the extracted fluorescence indicators, DS7 showed temporarily higher Y(II), Y(NO), and lower Y(NPQ) in the control and waterbag treatment. Afterward, Y(II) in the control gradually decreased, Y(NPQ) increased slightly until DS35, and then decreased at DS42, with a rapid increase in Y(NO). In the waterbag treatment, Y(II) gradually decreased or remained stagnant, but unlike the control, there was no rapid decrease in Y(II) or increase in Y(NO) at DS42. In mulching treatment, Y(II) gradually increased until DS21; Y(NPQ) remained the lowest among treatments, and at DS42, mulching treatment showed higher Y(II) and lower Y(NO) compared to the control.

4. Discussion

4.1. Soil Moisture Content

The changes in soil moisture content under drought stress can generally be divided into two phases: Phase I (DS0-DS11), where soil moisture content decreases sharply, and phase II (DS12-DS45), where the decrease is more gradual. Phase I is characterized by a rapid decline in soil moisture due to the active absorption of free water by gravity and plants, while phase II represents a stage where the depletion of capillary water held by surface tension between soil pores makes it difficult for plants to absorb water. This pattern of soil moisture decrease has also been reported in artificial forests. For example, in a Pinus sylvestris forest, a study with artificially induced drought conditions showed that soil moisture content in the upper 20 cm of sandy loam soil reached a threshold at around 12%, after which there was no significant decrease [26]. Considering the degraded site simulated in this study has sandy soil with steep slopes, a similar soil moisture decrease pattern can be observed.
Among the treatments, mulching consistently demonstrated the highest soil moisture retention capacity throughout the study period. This is likely due to the coir net material used in mulching, which provides thermal insulation, prevents surface evaporation, and retains incoming moisture, preventing its downward leakage [5]. Mulching reduces soil surface exposure to the atmosphere, thereby decreasing evaporation, acts as an insulator to moderate soil temperature fluctuations, suppresses weeds that compete with seedlings for water, and prevents soil erosion. In contrast, the waterbag treatment initially showed no significant difference from the control during phase I, but during phase II, it gradually released retained moisture, maintaining a higher soil moisture content compared to the control. This trend continued even after re-watering; with regular watering, mulching treatment maintained the highest soil moisture content, while the waterbag treatment and control had relatively lower and similar soil moisture levels (Figure 2). However, the waterbag treatment was less effective than mulching in terms of overall soil moisture retention, likely due to its inability to address other critical factors such as temperature regulation and weed suppression.
The wider ecological benefits of using mulching and waterbag treatments in degraded forests include improved soil moisture retention, reduced erosion, enhanced establishment and growth of tree seedlings, and potentially accelerated ecosystem recovery. While mulching offers a more comprehensive solution by creating a stable and conducive environment for plant growth, the waterbag treatment remains a viable option, particularly in situations where mulching is impractical. Future research should focus on field experiments in various degraded forest sites, include a broader range of tree species, and investigate long-term impacts on soil health and ecosystem dynamics to provide a more holistic approach to forest restoration.

4.2. Water Saturation Deficit and Root Collar Growth

Water saturation deficit (WSD) is highly correlated with leaf water potential and is a good indicator of leaf water status, showing a significant increase under water stress caused by drought [15,16,27]. Compared to significant increases in WSD observed in species such as Prunus yedoensis [16] and Dendropanax morbifera [27] after 14 days of drought, Pinus densiflora showed a notable increase in WSD, exceeding 20%, only after DS42, indicating species-specific differences in the WSD response to drought. This difference can be attributed to different drought stress response strategies among species. Generally, plants are classified as isohydric or anisohydric based on their drought response strategies. Isohydric plants, like Pinus species, are known for dehydration avoidance, while anisohydric plants are more tolerant of dehydration [28,29].
From DS42 onwards, the control showed the highest internal water loss (p < 0.05), experiencing the most significant leaf water deficit under drought stress, whereas mulching and waterbag treatments delayed dehydration avoidance, helping to maintain leaf water status longer. For Jatropha curcas [30] and Prunus yedoensis [16], diameter at root collar decreased under drought stress due to insufficient recovery of internal water consumed by metabolic activities. Although no decrease in diameter at root collar was observed in Pinus densiflora, lower growth was noted in the waterbag treatment and control, indicating that limited water supply can lead to reduced xylem growth.

4.3. Photosynthesis and Stomatal Response

Isohydric plants, like Pinus species, exhibit high stomatal sensitivity, regulating stomatal conductance to maintain leaf turgor and reduce water loss under drought stress [28,31,32]. In Pinus densiflora, a rapid decrease in stomatal conductance occurred after DS14, limiting CO2 uptake, reducing net photosynthesis rate, and transpiration, particularly in the control and waterbag treatments [28,31,33,34]. This response is likely influenced by the significant reduction in available water during phase II.
In contrast, mulching treatment maintained relatively higher stomatal conductance even after DS14 (p < 0.05), delaying the reduction in photosynthesis due to drought stress (Figure 4). Instantaneous transpiration efficiency (ITE), which indicates the efficient regulation of water needed for photosynthesis and metabolic processes [16,35], showed a sharp increase in the control until DS14 to maintain minimal photosynthetic rates (p < 0.05), followed by a clear decrease. Mulching treatment steadily increased ITE until DS28, showing an extended drought response to maintain photosynthesis and metabolic activity, whereas the waterbag treatment showed trends similar to the control but overall better ITE regulation (Figure 4).
Maximum carboxylation rate (Vcmax) and maximum electron transport rate (Jmax), indicators of photosynthetic capacity through Rubisco activity and RuBP regeneration rate, respectively [16,36,37], decreased significantly under drought stress in Prunus yedoensis [16], particularly after 14 days without water. However, in Pinus densiflora, no significant decrease in Vcmax and Jmax was observed (p > 0.05), and differences between treatments were not significant (p > 0.05). However, measurements for Vcmax and Jmax were not possible in the control and waterbag treatment after DS21 and in mulching treatment after DS28, likely due to immediate stomatal closure limiting external CO2 uptake, affecting the A-Ci response curve calculation by not increasing intercellular CO2 concentration (Ci) within mesophyll cells. This indicates that the reduction in net photosynthesis rate under drought in Pinus densiflora is due more to restricted CO2 uptake than a decrease in photosynthetic capacity itself, suggesting that photosynthetic capacity can fully recover with water re-supply, especially in mulching treatment, which can delay this flexible recovery function for over a week.
To conclude, Pinus densiflora exhibited responses aimed at efficiently maintaining photosynthetic capacity and metabolic activity over the long term by regulating stomata to prevent internal water loss under drought stress. Among treatments, mulching treatment showed the longest maintenance of these functions, followed by the waterbag treatment, and then the control, with mulching treatment delaying photosynthesis reduction due to drought by about a week compared to other treatments.

4.4. Leaf Pigment Content

Chlorophyll and carotenoids, known to be correlated with leaf nitrogen content and photosynthetic capacity [38], have been reported to decrease under water stress in many species due to damage to chloroplast membranes or accelerated leaf senescence [39,40]. In this experiment, Pinus densiflora showed no significant changes until DS21 (p > 0.05), but chlorophyll a, b, and total chlorophyll content decreased slightly under severe drought stress, with a significant increase in leaf water saturation deficit by DS45. Among treatments, the control, experiencing the greatest increase in leaf water saturation deficit, showed the highest chlorophyll and carotenoid content, likely due to the reduction in fresh weight caused by decreased leaf water. After a 30-day recovery period with re-watering, chlorophyll and carotenoid content increased again in the waterbag and mulching treatments, while the control showed stagnation, indicating that both treatments positively contribute to chlorophyll regeneration in Pinus densiflora.

4.5. Chlorophyll Fluorescence and Imaging Fluorescence Response

Chlorophyll fluorescence provides extensive information on the physiological state of plants and is a commonly used technique to detect invisible changes in the function and structure of the photosynthetic apparatus under specific environmental conditions [16,41,42]. During phase I, where soil moisture content sharply decreased due to gravitational outflow and root absorption, there were minimal differences among treatments. However, during phase II, when the decrease in soil moisture content stabilized, significant differences in chlorophyll fluorescence indices were observed.
Generally, when plants experience stress, initial fluorescence (Fo) increases and maximum fluorescence (Fm) decreases. The increase in Fo is a result of the separation of the light-harvesting antenna (LHC) from the core complex of photosystem II (PSII), and the increase in the Fo/Fm ratio is understood as a mechanism to prevent damage to the photosynthetic apparatus [27,41]. The VK/VJ ratio indicates the limitation of the electron donor function of PSII due to the inactivation of the oxygen-evolving complex (OEC) [43]. Sustained inactivation of OEC can lead to the accumulation of oxidative stress substances like H2O2, which can damage the structural connectivity of the photosynthetic apparatus and interfere with cellular metabolism, potentially causing cell necrosis [42,44]. The higher VK/VJ in the control under drought stress indicates that the efficiency of PSII and photosystem I (PSI), as well as the energy connectivity between them and the damage from oxidative stress, are more vulnerable compared to mulching and waterbag treatments.
Additionally, energy flux per reaction center (RC), indicated by ABS/RC, DIo/RC, TRo/RC, ETo/RC, and REo/RC, showed a relatively higher tendency in the control compared to mulching and waterbag treatments. Particularly, the increase in the inactive state of the RC (ABS/RC) led to excessive energy being accumulated in the RC, with the most pronounced dissipation of this excitation energy as heat (DIo/RC). Both Fo/Fm and DIo/RC protect the photosynthetic apparatus by dissipating excitation energy as heat, but the former occurs in the antenna of PSII and the latter in the RC of PSII [24].
In many species, the inactivation of the RC and OEC under drought stress and the decrease in the quantum yield of electron transport are common responses [16]. However, the energy captured by P680 in PSII used for charge separation (TRo/RC) and the energy transferred through the electron transport chain to the terminal electron acceptor of PSI (REo/RC) showed relatively smaller differences compared to ABS/RC and DIo/RC. This indicates that the fluorescence yield among treatments is most affected by the size and dissipation of energy accumulated in the PSII reaction center. This suggests that mulching and waterbag treatments can reduce oxidative stress on the reaction center and dissipate heat to prevent damage to the photosynthetic apparatus, thereby enhancing long-term drought stress resistance (DIo/RC, Fo/Fm).
The energy conservation efficiency (PIabs), which reflects the capture of excitation energy and electron movement between electron transport chains, and the molecular structure and function of the photosynthetic apparatus (SFIabs), were highest in the order of mulching treatment > waterbag treatment > control under drought stress and response mechanisms [45,46]. During the recovery period with re-watering (R30), mulching and waterbag treatments showed nearly similar levels, while the control showed delayed recovery, indicating severe damage from accumulated stress.
The effective quantum yield Y(II), which expresses the results of all functional cooperation, significantly influences crop productivity under drought stress by affecting the net photosynthesis rate and Y(II) performance [21,22]. A gradual decrease in Y(II) was observed in the control from DS7 onwards, whereas mulching treatment showed higher trends from DS14 and waterbag treatment from DS21, indicating that higher yields were maintained under long-term drought stress.
Y(NPQ), the quantum yield of non-photochemical quenching, represents the function of protecting the photosynthetic apparatus by dissipating excessive excitation energy under various stresses like drought. Conversely, an increase in the quantum yield of non-regulated energy dissipation Y(NO) indicates a failure of the protective mechanism by preventing the accumulation of a transthylakoid proton gradient for the xanthophyll cycle, causing damage [22,37,41,47].
Overall, the control showed an active mechanism to prevent excessive energy accumulation through down-regulation of PSII from DS14, while mulching treatment exhibited this response from around DS28, suggesting that mulching helps delay drought stress. The waterbag treatment showed trends similar to the control until DS14 but exhibited intermediate levels between mulching treatment and control thereafter, indicating better performance under long-term stress compared to the control. The sharp increase in Y(NO) observed in the control at DS42 indicates a significant loss of the protective mechanism, leading to reduced photochemical efficiency and function of PSII, and suggesting negative impacts on structural damage recovery during re-watering.

4.6. Practical Application in Real Forest Sites

The findings from this study provide practical insights for forest managers and restoration practitioners aiming to mitigate drought stress in degraded forest areas. Mulching, which has been demonstrated to be highly effective in retaining soil moisture and supporting physiological functions in Pinus densiflora, can be applied as a cost-effective and efficient method in real forest settings. By reducing evaporation, stabilizing soil temperature, and suppressing competing weeds, mulching creates a favorable microenvironment for seedlings, promoting higher survival and growth rates. This method can be particularly beneficial in areas with sandy soils and steep slopes, where soil erosion and moisture loss are significant challenges.
Waterbag treatments, while not as comprehensive as mulching, still offer a viable solution for enhancing soil moisture retention, especially in conditions where mulching may be impractical or less effective. The gradual release of water from waterbags can support seedling establishment during critical drought periods, although additional measures for temperature regulation and weed suppression may be necessary to optimize their benefits.
Implementing these treatments in diverse and natural settings will require careful consideration of site-specific conditions, including soil type, slope, and local climate. Forest managers should also evaluate the cost-effectiveness and logistical feasibility of large-scale applications, ensuring that the chosen method aligns with long-term restoration goals. Integrating these treatments with other restoration techniques, such as soil amendments and microbial inoculation, could further enhance their effectiveness and contribute to the success rates of reforestation efforts and the overall health and resilience of restored forest ecosystems.

4.7. Future Research Directions

Despite the valuable insights gained from this study, several limitations must be acknowledged. The experiment was conducted in a controlled environment using an artificial rainfall slope, which may not perfectly replicate the complex and variable conditions of a naturally degraded forest area. The uniformity of soil composition and controlled watering conditions do not account for the heterogeneous and often unpredictable environmental factors present in the field. Additionally, the study focused solely on Pinus densiflora seedlings; thus, the findings may not be directly applicable to other tree species with different physiological and ecological requirements. Furthermore, the study did not consider the long-term impacts of mulching and waterbag treatments on soil health and ecosystem dynamics, which are crucial for sustainable forest restoration.
Future research should aim to address these limitations by conducting field experiments in various degraded forest sites with diverse soil types and environmental conditions. Studies should also include a broader range of tree species to evaluate the generalizability of the findings. Long-term monitoring of the restored areas is essential to understanding the sustained effects of mulching and waterbag treatments on tree survival, growth, and ecosystem health. Additionally, exploring the integration of these treatments with other restoration techniques, such as soil amendments and microbial inoculation, could provide a more holistic approach to forest restoration. Investigating the cost-effectiveness and practical implementation strategies of these treatments on a large scale will also be critical for their adoption in real-world forest management practices.
While this study offers valuable insights into the effectiveness of mulching and waterbag treatments for P. densiflora in simulated degraded forest conditions, further research is needed to validate these findings in diverse and natural settings. Expanding the scope to include various tree species and incorporating detailed soil analyses will provide a more comprehensive understanding of these treatments’ long-term impacts and ecological viability. Future studies should also explore the broader ecological implications and potential for large-scale application, enhancing adaptive mechanisms, and improving forest restoration strategies.

5. Conclusions

The vegetation-based conditions simulating deforested areas showed immediate water runoff even with rainfall and moisture influx from the upper layer, resulting in very low water retention in the soil pores. The period of rapid soil moisture decreases due to drought (phase I, DS0-DS11) and the period of gradual decreases due to the depletion of capillary water (phase II, after DS11) could be clearly distinguished.
In phase II, when the available soil moisture became extremely low, P. densiflora exhibited distinct responses as an isohydric plant to cope with drought stress. They quickly closed their stomata to maintain leaf turgor pressure and reduce water loss to the atmosphere, maintaining a low leaf water deficit until DS35. They also increased instantaneous transpiration efficiency to sustain metabolic activities for an extended period. Although the net photosynthesis sharply decreased due to restricted CO2 uptake from stomatal closure, the photosynthetic capacity did not initially decline significantly, and chlorophyll content only reduced by less than 20%. Furthermore, the inactivation state of the chlorophyll a reaction center increased, leading to a decrease in PSII energy conservation efficiency and effective quantum yield. However, to counteract this, the plants increased photochemical quenching, dissipating the excitation energy as heat to minimize damage to the photosynthetic apparatus.
These responses occurred first in the control group, which also showed the slowest recovery even after 30 days of stable water supply. The waterbag treatment initially showed a similar reduction in photosynthetic response to the control but gradually released retained water during the prolonged drought in phase II, leading to soil moisture and physiological responses similar to the mulching treatment. Mulching prevented surface evaporation of soil moisture and retained water below the surface, maintaining the highest soil moisture content among all treatments. Physiological responses to drought were delayed by about a week, and both mulching and waterbag treatments showed higher increases in photosynthetic function indices and chlorophyll regeneration during the 30-day recovery period compared to the control, indicating superior resilience in physiological recovery.
In conclusion, mulching was the most effective method for aiding long-term soil moisture retention and extending the physiological response mechanisms of seedlings for survival by more than a week compared to the control, thereby complementing the planting ground in deforested areas. Although the waterbag treatment was less effective than mulching, it still significantly contributed to forming better growth conditions compared to the control.

Author Contributions

Conceptualization, K.L.; methodology, K.L. and M.K.; validation, Y.S. and N.K.; formal analysis, K.L. and Y.S.; investigation, Y.S., M.K., W.C. and H.J.; resources, N.K.; data curation, Y.S., W.C. and H.J.; writing—original draft preparation, K.L.; writing—review and editing, N.K.; visualization, M.K., W.C. and H.J.; supervision, K.L. and N.K.; project administration, N.K.; funding acquisition, N.K. All authors have read and agreed to the published version of the manuscript.

Funding

This research was funded by the National Institute of Forest Science (NIFoS), Management Number: 22-00-51.

Data Availability Statement

Data will not available due to privacy issue.

Acknowledgments

The authors would like to express our sincere gratitude to the National Institute of Forest Science (NIFoS) for supporting this research.

Conflicts of Interest

The authors declare no conflicts of interests.

References

  1. Kim, D.; Han, H.; Chung, J. Optimal Forest Management for Improving Economic and Public Functions in MT. Gari Leading Forest Management Zone. J. Korean Soc. For. Sci. 2021, 110, 665–677. [Google Scholar] [CrossRef]
  2. Yu, J.; Choi, W.; Lee, S.; Choi, J. Forest Degradation and Spatial Distribution of Forest Land Development. J. Korean Soc. Environ. Restor. Technol. 2016, 19, 101–110. [Google Scholar] [CrossRef]
  3. Kang, H.M.; Choi, S.H.; Kim, D.H.; Song, J.T. A Study on the Restoration Effects of Vegetation Restoration Types. Korean J. Environ. Ecol. 2017, 31, 174–187. [Google Scholar] [CrossRef]
  4. Jung, T.J.; Kim, Y.G.; Kim, Y.J.; Jung, M.H.; Park, K.H.; Shin, C.K.; Park, S.; Kim, Y.S. A Change of Vegetation at the Ecological Restoration Area of Simwon Valley in Jirisan National Park. Korean J. Environ. Ecol. 2021, 35, 294–304. [Google Scholar] [CrossRef]
  5. Lee, K.; Song, Y.; Koo, H.; Kim, H.; Kweon, H.; Koo, N. Evaluation of Soil Loss Tolerance and Tree Growth Features Based on Planting Ground Methods in the Alpine Center, Degraded Forestland in the Republic of Korea. Forests 2023, 14, 200. [Google Scholar] [CrossRef]
  6. Nam, S.J.; Yeo, H.J.; Choi, J.Y.; Kim, N. Development of Revegetation Method Using Forest Topsoils for Ecological Restoration of the Slopes (I). J. Korean Soc. Environ. Restor. Technol. 2004, 7, 110–119. [Google Scholar]
  7. Cha, D.S.; Oh, J.H.; Ji, B.Y.; Cho, K.H.; Lee, H.J. Development of the Soil Bioengineering Techniques for Restoring of Degraded Forest Area (V)–Pull–out Resistance Characteristics of Shrubs’ roots. J. Forest Environ. Sci. 2008, 24, 111–118. [Google Scholar]
  8. Kim, M.; Choi, Y.; Lee, S.; Kim, H.; Kim, S.; Kim, Y. Polyacrylamide, Its Beneficial Application of Soil Erosion Control from Sloped Agricultural Fields. J. Korean Soc. Agric. Eng. 2015, 57, 123–128. [Google Scholar] [CrossRef]
  9. Jeong, S.J.; Oh, K.K.; Oh, J.G. A study on Restoration Measures of Vegetation for Devastated Ridge Line Area in National Park, Korea. Korean J. Environ. Ecol. 2001, 15, 69–78. [Google Scholar]
  10. Jang, S.J.; Lee, Y.T.; Lee, K.Y.; Kim, K.N.; Lee, J.H.; Chun, K.W. A Study of Disaster Prevention and Characteristics of Landslides Triggered by the 2019 Typhoon Mitag in Samcheok. J. Korean Soc. Hazard Mitig. 2020, 20, 221–227. [Google Scholar] [CrossRef]
  11. Chazdon, R.L. Beyond Deforestation: Restoring Forests and Ecosystem Services on Degraded Lands. Science 2008, 320, 1458–1460. [Google Scholar] [CrossRef] [PubMed]
  12. Lee, S.D.; Lee, K.J.; Choi, J.W. Management Plan to Consider Ecological Characteristic of Pinus densiflora Community in Seoul. Korean J. Environ. Ecol. 2009, 23, 258–271. [Google Scholar]
  13. Lee, D.H.; Rhee, D.S.; Kim, M. Determination of Permissible Shear Stresses on Vegetation Mats by Soil Loss Evaluation. J. Korea Acad. Ind. Coop. Soc. 2013, 14, 5956–5963. [Google Scholar] [CrossRef]
  14. Baik, J.; Chiang, M.H. Effects of Different Soil on the Growth of Salicornia herbacea. J. Bio-Environ. Control 2011, 20, 216–220. [Google Scholar]
  15. Mannan, M.A.; Tithi, M.A.; Islam, M.R.; Al Mamun, M.A.; Mia, S.; Rahman, M.Z.; Awad, M.F.; ElSayed, A.I.; Mansour, E.; Hossain, M.S. Soil and Foliar Applications of Zinc Sulfate and Iron Sulfate Alleviate the Destructive Impacts of Drought Stress in Wheat. Cereal Res. Commun. 2022, 50, 1279–1289. [Google Scholar] [CrossRef]
  16. Lee, K.C.; Kweon, H.; Sung, J.W.; Kim, Y.S.; Song, Y.G.; Cha, S.; Koo, N. Physiological Response Analysis for the Diagnosis of Drought and Waterlogging Damage in Prunus Yedoensis. For. Sci. Technol. 2022, 18, 14–25. [Google Scholar] [CrossRef]
  17. Zheng, W.P.; Wang, P.; Zhang, H.X.; Zhou, D. Photosynthetic Characteristics of the Cotyledon and First True Leaf of Castor (Ricinus communis L.). Aust. J. Crop Sci. 2011, 5, 702–708. [Google Scholar]
  18. Xia, J.B.; Zhang, G.C.; Wang, R.R.; Zhang, S.Y. Effect of Soil Water Availability on Photosynthesis in Ziziphus Jujuba var. spinosus in a Sand Habitat Formed from Seashells: Comparison of Four Models. Photosynthetica 2014, 52, 253–261. [Google Scholar] [CrossRef]
  19. Sharkey, T.D.; Bernacchi, C.J.; Farquhar, G.D.; Singsaas, E.L. Fitting Photosynthetic Carbon Dioxide Response Curves for C3 Leaves. Plant Cell Environ. 2007, 30, 1035–1040. [Google Scholar] [CrossRef]
  20. Strasser, R.J.; Srivastava, A.; Tsimilli–Michael, M. The fluorescence transient as a tool to characterize and screen photosynthetic samples. In Probing Photosynthesis: Mechanism, Regulation, and Adaptation; Yunus, M., Pathre, U., Mohanty, P., Eds.; Taylor and Francis: London, UK; New York, NY, USA, 2000; pp. 445–483. [Google Scholar]
  21. de Sousa, C.A.F.; de Paiva, D.S.; Casari, R.A.D.C.N.; de Oliveira, N.G.; Molinari, H.B.C.; Kobayashi, A.K.; Magalhães, P.C.; Gomide, R.L.; Souza, M.T. A Procedure for Maize Genotypes Discrimination to Drought by Chlorophyll Fluorescence Imaging Rapid Light Curves. Plant Methods 2017, 13, 61. [Google Scholar] [CrossRef]
  22. Wang, W.; Wang, C.; Pan, D.; Zhang, Y.; Luo, B.; Ji, J. Effects of Drought Stress on Photosynthesis and Chlorophyll Fluorescence Images of Soybean (Glycine max) seedlings. Int. J. Agric. Biol. Eng. 2018, 11, 196–201. [Google Scholar] [CrossRef]
  23. Hiscox, J.D.; Israelstam, G.F.A. Method for the Extraction of Chlorophyll from Leaf Tissue Without Maceration. Can. J. Bot. 1979, 57, 1332–1334. [Google Scholar] [CrossRef]
  24. Kalaji, H.M.; Jajoo, A.; Oukarroum, A.; Brestic, M.; Zivcak, M.; Samborska, I.A.; Cetner, M.D.; Łukasik, I.; Goltsev, V.; Ladle, R.J. Chlorophyll A Fluorescence as a Tool to Monitor Physiological Status of Plants Under Abiotic Stress Conditions. Acta Physiol. Plant. 2016, 38, 102. [Google Scholar] [CrossRef]
  25. Klughammer, C.; Schreiber, U. Complementary PS II Quantum Yields Calculated from Simple Fluorescence Parameters Measured by PAM Fluorometry and the Saturation Pulse Method. PAM Appl. Notes 2008, 1, 201–247. [Google Scholar]
  26. Irvine, J.; Perks, M.P.; Magnani, F.; Grace, J. The response of Pinus sylvestris to drought: Stomatal control of transpiration and hydraulic conductance. Tree Physiol. 1998, 18, 393–402. [Google Scholar] [CrossRef] [PubMed]
  27. Lee, K. Photosynthetic responses and growth performances affected by organic compost level in seedling of Synurus deltoides(aiton) nakai. J. Agric. Life Sci. 2017, 51, 65–78. [Google Scholar] [CrossRef]
  28. Tardieu, F.; Simonneau, T. Variability among species of stomatal control under fluctuating soil water status and evaporative demand: Modelling isohydric and anisohydric behaviours. J. Exp. Bot. 1998, 49, 419–432. [Google Scholar] [CrossRef]
  29. Meinzer, F.C.; Woodruff, D.R.; Marias, D.E.; McCulloh, K.A.; Sevanto, S. Dynamics of Leaf Water Relations Components in Co-occurring Iso-and Anisohydric Conifer Species. Plant Cell Environ. 2014, 37, 2577–2586. [Google Scholar] [CrossRef]
  30. de Santana, T.A.; da Silva, L.D.; de Oliveira, P.S.; Benjamin, C.S.; Ramos, E.P.; de Souza, J.O.; Gomes, F.P. Leaf Gas Exchange and Biomass Partitioning in Jatropha curcas L. Young Plants Subjected to Flooding and Drought Stresses. Aust. J. Crop Sci. 2017, 11, 792–798. [Google Scholar] [CrossRef]
  31. Matyssek, R.; Kozovits, A.R.; Wieser, G.; Augustaitiene, I.; Augustaitis, A. Biological Reactions of Forests to Climate Change and Air Pollution. Eur. J. For. Res. 2014, 133, 671–673. [Google Scholar] [CrossRef]
  32. Balekoglu, S.; Caliskan, S.; Dirik, H.; Rosner, S. Response to Drought Stress Differs Among Pinus pinea Provenances. For. Ecol. Manag. 2023, 531, 120779. [Google Scholar] [CrossRef]
  33. Collatz, G.J.; Ball, J.T.; Grivet, C.; Berry, J.A. Physiological and Environmental Regulation of Stomatal Conductance, Photosynthesis and Transpiration: A Model that Includes a Laminar Boundary Layer. Agric. For. Meteorol. 1991, 54, 107–136. [Google Scholar] [CrossRef]
  34. Jo, H.; Chang, H.; An, J.; Cho, M.S.; Son, Y. Species Specific Physiological Responses of Pinus densiflora and Larix kaempferi Seedlings to Open–field Experimental Warming and Precipitation Manipulation. For. Sci. Technol. 2019, 15, 44–50. [Google Scholar] [CrossRef]
  35. Espadafor, M.; Orgaz, F.; Testi, L.; Lorite, I.J.; González–Dugo, V.; Fereres, E. Responses of Transpiration and Transpiration Efficiency of Almond Trees to Moderate Water Deficits. Sci. Hortic. 2017, 225, 6–14. [Google Scholar] [CrossRef]
  36. Hopkins, W.G.; Hüner, N.P.A. Introduction to Plant Physiology, 4th ed.; John Wiley & Sons: Hoboken, NJ, USA, 2008; pp. 223–230. [Google Scholar]
  37. Song, Y.; Kim, C.W.; Kweon, H.; Yoon, K.K.; Shim, Y.J.; Lee, U.; Lee, K.C. Effects of Drought Stress on the Growth and Physiological Characteristics of Grafted Ziziphus jujuba var. inermis under RCP 6.0 Climate Change Scenarios. Hortic. Sci. Technol. 2023, 41, 11–26. [Google Scholar] [CrossRef]
  38. Hikosaka, K.; Terashima, I. A Model of the Acclimation of Photosynthesis in the Leaves of C3 Plants to Sun and Shade with Respect to Nitrogen Use. Plant Cell Environ. 1995, 18, 605–618. [Google Scholar] [CrossRef]
  39. Saraswathi, S.G.; Paliwal, K. Drought Induced Changes in Growth, Leaf Gas Exchange and Biomass Production in Albizia lebbeck and Cassia siamea Seedlings. J. Environ. Biol. 2011, 32, 173–178. [Google Scholar] [PubMed]
  40. Lee, K.C.; Kim, S.H.; Park, W.G.; Kim, Y.S. Effects of Drought Stress on Photosynthetic Capacity and Photosystem II Activity in Oplopanax elatus. Korean J. Med. Crop Sci. 2014, 22, 38–45. [Google Scholar] [CrossRef]
  41. Kramer, D.M.; Johnson, G.; Kiirats, O.; Edwards, G.E. New Fluorescence Parameters for the Determination of QA Redox State and Excitation Energy Fluxes. Photosynth. Res. 2004, 79, 209–218. [Google Scholar] [CrossRef]
  42. Liu, F.; Zhang, M.; Hu, J.; Pan, M.; Shen, L.; Ye, J.; Tan, J. Early Diagnosis of Pine Wilt Disease in Pinus thunbergii Based on Chlorophyll Fluorescence Parameters. Forests 2023, 14, 154. [Google Scholar] [CrossRef]
  43. Faseela, P.; Sinisha, A.K.; Brestič, M.; Puthur, J.T. Chlorophyll a Fluorescence Parameters as Indicators of a Particular Abiotic Stress in Rice. Photosynthetica 2020, 58, 293–300. [Google Scholar] [CrossRef]
  44. Antunović Dunić, J.; Mlinarić, S.; Pavlović, I.; Lepeduš, H.; Salopek-Sondi, B. Comparative Analysis of Primary Photosynthetic Reactions Assessed by OJIP Kinetics in Three Brassica Crops after Drought and Recovery. Appl. Sci. 2023, 13, 3078. [Google Scholar] [CrossRef]
  45. Faria–Silva, L.; Gallon, C.Z.; Filgueiras, P.R.; Silva, D.M. Irrigation Improves Plant Vitality in Specific Stages of Mango Tree Development According to Photosynthetic Efficiency. Photosynthetica 2019, 57, 820–829. [Google Scholar] [CrossRef]
  46. Khatri, K.; Rathore, M.S. Photosystem Photochemistry, Prompt and Delayed Fluorescence, Photosynthetic Responses and Electron Flow in Tobacco Under Drought and Salt Stress. Photosynthetica 2019, 57, 61–74. [Google Scholar] [CrossRef]
  47. Murchie, E.H.; Lawson, T. Chlorophyll Fluorescence Analysis: A Guide to Good Practice and Understanding Some New Applications. J. Exp. Bot. 2013, 64, 3983–3998. [Google Scholar] [CrossRef]
Figure 1. (A) Artificial rainfall slope ((a) plot design; (b) control; (c) mulching treatment; (d) waterbag treatment and (e) image of a waterbag). (B) Growth characteristics from DS0 to DS42.
Forests 15 01323 g001
Figure 2. Soil moisture contents of P. densiflora under three different planting ground treatments throughout the experimental periods.
Forests 15 01323 g002
Figure 3. Changes in (A) water saturation deficits and (B) root collar growth of P. densiflora under three different planting ground treatments. Each value is expressed as the box plot. Means with difference letters are significantly different by Tukey’s HSD test (p < 0.05). ns: non-significance.
Forests 15 01323 g003
Figure 4. Changes in (A) net photosynthesis rate, (B) stomatal transpiration rate, (C) stomatal conductance and (D) instantaneous transpiration efficiency of P. densiflora under three different planting ground treatments. Each value is expressed as the box plot. Means with difference letters are significantly different by Tukey’s HSD test (p < 0.05). ns: non-significance.
Forests 15 01323 g004
Figure 5. Spider plot of several chlorophyll fluorescence parameters of P. densiflora under three different planting ground treatments in different periods; The data are shown as a percentage of control and the parameters are described in Table 1. The asterisks indicate significant differences by Tukey’s HSD test ( p < 0.001 **).
Forests 15 01323 g005
Figure 6. (A) Image of chlorophyll a fluorescence and (B) several chlorophyll fluorescence parameters of P. densiflora under three different planting groundwork treatments in different periods. The data are shown as a percentage of control and the parameters are described in Table 1. The asterisks indicate significant differences by Tukey’s HSD test (p < 0.05 * and p < 0.001 **).
Forests 15 01323 g006
Table 1. Summary of chlorophyll a fluorescence parameters.
ParametersDescription
Fo/FmA parameter related to changes in heat dissipation in the PS II antenna
VK/VJRatio of variable fluorescence in time 0.3 ms to variable fluorescence in time 2 ms as an indicator of the PS II donor side limitation
ABS/RCAbsorption flux per reaction center
TRo/RCTrapping of electrons per reaction center
ETo/RCElectron flux per reaction center beyond QA
DIo/RCEnergy dissipation flux per reaction center
REo/RCElectron transport flux until PS I acceptors per reaction center
PIabsPerformance index on absorption basis.
SFIabsThe structure function index on absorption basis.
Y(II)PS II actual photochemical quantum yield
Y(NPQ)Quantum yield of regulated energy dissipation in PS II
Y(NO)Quantum yield of non-regulated energy dissipation in PS II
Table 2. Changes in maximum carboxylation rate (Vcmax) and maximum electron transport rate (Jmax) of P. densiflora under three different planting ground treatments.
TreatmentVcmax (µmol·m−2·s−1)Jmax (µmol·m−2·s−1)
DS0DS7DS14DS21DS0DS7DS14DS21
Control8.61 ns6.62 ns7.25 nsnd20.66 ns16.41 ns15.30 nsnd
Waterbag8.436.818.00nd20.6516.9415.29nd
Mulching8.946.998.368.3122.6517.4219.3217.33
ns is non-significance (p < 0.05) by Tukey’s HSD test and nd is non-detected.
Table 3. Changes in chlorophyll (Chl) and carotenoid (Car) contents of P. densiflora under three different planting ground treatments.
DATTreatmentChl (mg·g−1)Car
(mg·g−1)
T Chl/Car
aba + b
DS0Control9.68 ns2.83 b12.52 b1.98 b6.40 ns
Waterbag8.511.87 a10.38 a1.68 a6.21
Mulching9.502.53 b12.03 b1.95 b6.18
DS21Control10.19 b2.75 b12.94 b2.12 b6.14 ns
Waterbag8.30 a2.27 a10.57 a1.70 a6.25
Mulching9.44 ab2.62 ab12.06 ab1.92 ab6.28
DS45Control8.81 ns2.47 b11.28 ns2.08 ns5.43 a
Waterbag7.282.00 a9.281.725.39 a
Mulching7.892.14 ab10.031.785.65 b
R30Control8.85 ns2.29 ns11.14 ns2.18 ns5.1 ns
Waterbag8.331.9410.272.074.94
Mulching9.972.2812.252.355.21
SourceF-valuep-valueF-valuep-valueF-valuep-valueF-valuep-valueF-valuep-value
DAT (D)5.40 <0.001 4.03 <0.008 4.79 <0.003 8.20 <0.001 44.96<0.001
Treatment (T)9.21 <0.001 14.05 <0.001 11.17 <0.001 9.60 <0.001 0.780.461
T × D1.10 0.36 1.02 0.42 0.88 0.51 1.20 0.31 0.590.74
Means with difference letters are significantly different by Tukey’s HSD test (p < 0.05). ns: non-significance.
Disclaimer/Publisher’s Note: The statements, opinions and data contained in all publications are solely those of the individual author(s) and contributor(s) and not of MDPI and/or the editor(s). MDPI and/or the editor(s) disclaim responsibility for any injury to people or property resulting from any ideas, methods, instructions or products referred to in the content.

