Article

Bioluminescence Inhibition Bioassay for Estimation of Snow Cover in Urbanised Areas within Boreal Forests of Krasnoyarsk City

by
Anastasia A. Rimashevskaya
1,*,
Elena Y. Muchkina
1,
Oleg S. Sutormin
1,2,
Dmitry E. Chuyashenko
1,
Arsen R. Gareev
1,
Svetlana A. Tikhnenko
3,
Nadezhda V. Rimatskaya
4 and
Valentina A. Kratasyuk
1,3
1
School of Fundamental Biology and Biotechnology, Siberian Federal University, Krasnoyarsk 660041, Russia
2
Department of Chemistry, Institute of Nature and Technical Sciences, Surgut State University, Surgut 628412, Russia
3
Photobiology Laboratory, Institute of Biophysics, Federal Research Center ‘Krasnoyarsk Science Center, Siberian Branch of the Russian Academy of Sciences’, Krasnoyarsk 660036, Russia
4
Department of Education Quality Management, Surgut State University, Surgut 628412, Russia
*
Author to whom correspondence should be addressed.
Forests 2024, 15(8), 1325; https://doi.org/10.3390/f15081325
Submission received: 23 May 2024 / Revised: 25 July 2024 / Accepted: 26 July 2024 / Published: 30 July 2024

Abstract

:
It has been proposed that the level of air pollution in a city should be estimated based on the accumulation of pollutants in the snow cover of urban forests. This study presents a bioluminescence method for estimating the extent of snow cover pollution in the urbanised areas of boreal forests in Krasnoyarsk city. A bioluminescent assay involving NAD(P)H:FMN oxidoreductase (Red) and luciferase with luminous bacteria (BLuc) was employed to measure the concentrations of six heavy metals (As, Cd, Zn, Co, Hg, and Pb) in the snow cover. The tested snow samples demonstrated a correlation between the reduced activity of the enzyme system and variations in Cd concentration. Furthermore, the research indicated that the period of unfavourable meteorological conditions in Krasnoyarsk city resulted in a notable decline in the activity of the BLuc–Red enzyme system, which may be associated with elevated air pollution levels. This study underscores the potential of the bioluminescence method for monitoring environmental pollution in urban forested areas.

1. Introduction

Forest ecosystems are of significant environmental importance. In natural biogeocenoses, vegetation fulfils a number of vital biospheric functions, and plants play an instrumental role in the formation of urban ecological conditions. A number of major urban centres are situated within the boreal forest zone. Typical urban air pollution is distributed across the entire urban area. The forest canopy retains a certain amount of pollutants, which then enter the snow cover and soil surface.
One example of an urban area situated within a larger forest is the Krasnoyarsk urban agglomeration. The city of Krasnoyarsk is situated within three distinct natural zones, encompassing both mountain taiga and forest–steppe and steppe regions. The formation of surface air pollution is a consequence of the emission of pollutants [1,2,3,4].
Urban forests, as an integral component of the urban landscape, play a pivotal role in the mitigation of the consequences of air pollution. Consequently, they must be considered in environmental policy [5].
The condition of forests in both natural and urban environments is subject to ongoing investigation, with the specific focus dependent on the prevailing climate and the impact of human activity [6,7,8]. During the summer months, airborne pollutants are deposited within the tree canopy and soil [9,10]. Conversely, during the winter season, these pollutants are accumulated within the canopy of coniferous trees and the snow cover. In the presence of frost, atmospheric pollutants accumulate in the snow cover, which subsequently melts at temperatures above zero. This melting water either percolates into the soil or enters various water bodies in the form of floodwater. Snow can be employed as an indicator of atmospheric pollution, given that it is theorised to combine atmospheric pollutants, including ions (sulphates, nitrates, etc.) and heavy metals, due to the smaller size of snowflakes in comparison to raindrops [11,12]. A significant body of research has been dedicated to the estimation of concentrations of toxic elements in snow, or, more commonly, to the analysis of the temporal dynamics of snow pollution by heavy metals in industrial and urban areas, as well as the impact on human health. For instance, there have been reports on the analysis of the content of microelements in snow in three Japanese cities with varying degrees of industrial activity (ranging from low to high) [13]. Additionally, studies have been conducted on the sources of snow pollution in Poland, Austria, China, and other countries [14,15,16].
In the context of environmental monitoring of urban areas, chemical analysis, bioassays, and bioindicators are employed as analytical techniques. In order to obtain reliable estimates, a considerable number of parameters must be measured, including concentrations of heavy and trace metals, microelements, volatile organic compounds, and so forth [17,18]. The dispersion of volatile particles results in the pollution of the atmosphere and the precipitation of these particles on the surfaces of vegetation and soils in urban and forest ecosystems.
Based on the data obtained through the aforementioned methods at a specific time point, a series of observations are formed and patterns in environmental contamination are revealed, contingent on seasonal and climatic variations [19,20,21,22]. The construction of databases in this manner enables the creation of models and forecasts of regional environmental conditions. The disadvantages of this approach include the necessity to analyse large quantities of data, which can be time-consuming due to the complex and laborious nature of the analytical techniques employed. Furthermore, the lag between the occurrence of pollution events and the subsequent acquisition of data on the associated pollution levels in a specific area can be considerable. It is therefore evident that there is a pressing need to obtain prompt warning information about urban pollution.
Nevertheless, there are integrated analytical techniques that enable the rapid acquisition of pollution data within a time frame of 5 to 60 min. Such methods include enzyme bioassay, which has been successfully employed for the rapid monitoring of water and soil [23,24,25]. The assay is based on changes in the luminescence intensity of the bi-enzyme system. The presence of water samples was analysed using the NAD(P)H:FMN oxidoreductase + luciferase (BLuc–Red) system.
It is noteworthy that, in the majority of cases, chemical analysis is employed as the primary method for the analysis of snow cover, as opposed to bioassays [26,27]. It is widely acknowledged that the presence of industrial enterprises in an urban environment results in the emission of toxic substances, including metals and volatile organic compounds. The combustion of fuel and industrial activity results in the emission of significant quantities of heavy and trace metals into the atmosphere, originating from the combustion of fuel.
The presence of metals, organic pollutants, and oil products in the form of trace elements absorbed by solid particles is frequently observed in forests situated in the vicinity of sources of air pollution, including urban areas, as well as in the proximity of industrial (including mining) and agricultural enterprises [28,29,30,31].
The objective of this research is to investigate the potential of utilising an integral bioluminescence enzyme assay for the expeditious estimation of snow pollution in recreational forests and urban areas. The principal benefit of enzyme bioassays is the rapidity of the results, which makes it advisable to compare the outcomes of chemical and biological monitoring of the urban environment in order to ascertain whether the enzyme bioluminescence bioassay can provide a reliable reflection of pollution levels.

2. Materials and Methods

2.1. Sampling and Characteristics of the Area under Study

Krasnoyarsk is one of the most populous cities in the Russian Federation, with a population exceeding one million. The city is situated in a boreal forest zone, at the centre of Siberia, on both banks of the Yenisei River. It is located at the junction of the West Siberian Plain, Central Siberian Plateau, and Sayan Mountains, within a basin formed by the northern branches of these mountain ranges. The climate is characterised by extreme continental conditions, though these tend to be moderated by the presence of extensive water bodies and the river Yenisei, which remains unfrozen throughout the winter months. Additionally, the city’s location within a forested and mountainous region contributes to a more temperate climate.
As is the case in numerous other major cities worldwide, Krasnoyarsk exhibits a well-developed urban environmental complex. The city is characterised by a high level of traffic congestion, coupled with a number of significant sources of pollution. These include the heating and energy sector, with its thermal power plants, and industry, particularly metallurgy, machine building and chemical enterprises. The contribution of cars to the total amount of emissions and the high level of pollution is also on the rise [32].
The enterprises that are identified as the primary sources of atmospheric pollution are the Krasnoyarsk Aluminium Smelter, the Krasnoyarsk Cement Plant, three thermal power plants [33], and numerous coal-fired heating stations of varying sizes. During the summer months, the city of Krasnoyarsk is subject to the effects of forest fires, which result in the emission of aerosol particles (soot) into the atmosphere.
The research object was selected on the basis of its suitability for the investigation of atmospheric deposition in the context of unfavourable meteorological conditions. The snow cover in urban forests and parks was chosen for sampling, as these locations accumulate substances deposited from the air during such periods. The snow sample from a forest outside the city was used as a control. The concentration of six heavy metals (arsenic, cadmium, zinc, cobalt, mercury, and lead) was determined in all the snow samples.
The snow samples were collected from five locations within the Krasnoyarsk agglomeration, both prior to and following the onset of unfavourable meteorological conditions. The snow samples were collected over a 19-day period between 10 February 2023 and 20 February 2023. On 10 February, Krasnoyarsk was subjected to the inaugural occurrence of an adverse weather regime. The period of 10 consecutive days during which the adverse weather conditions persisted without interruption commenced on 20 February.
Samples were obtained from three distinct zones (see Figure 1). The urban forest (Zone 1) is distinguished by the presence of forest vegetation in proximity to residential buildings. The sampling sites in zones 2 and 3 are situated in the central region of Krasnoyarsk.
The samples were collected using a plastic sampler from an area of approximately 2 m2 of the upper layer of fresh snow, extending down to the depth of the soil cover. This method was conducted in accordance with the protocols described in the literature [34]. Each snow sample was placed in a plastic container and transported to the laboratory. Prior to analysis, the collected snow samples were stored in a refrigerator at a temperature of 2–4 °C, according to standard methodology [34]. The meltwater was filtered using a paper filter with a pore size of 0.45 µm.

2.2. Estimation of Integral Toxicity

The bioluminescence inhibition bioassay is a method used to determine the integral toxicity of snow. It is based on measuring the activity of the BLuc–Red system in the presence of snow samples. It has been previously established that the activity of the BLuc–Red system depends on the chemical composition of a sample being analysed [35].
The impact of aqueous extracts from snow on the activity of the soluble BLuc–Red enzyme system was determined using a reaction mixture comprising the following components: the solution comprised 300 µL of 0.05 M potassium phosphate buffer (pH 6.9), 5 µL of the enzyme solution (BLuc–Red), 50 µL of a 0.0025% (v/v) solution of myristic aldehyde C14, 100 µL of a 0.4 mM NADH solution, 50 µL of distilled water (control) or of the solution under study, and 10 µL of a 0.5 mM FMN solution. The flask containing the BLuc–Red solution (Laboratory of Nanobiotechnology and Bioluminescence, Institute of Biophysics SB RAS, Krasnoyarsk) comprised 0.4 mg/mL of luciferase derived from a recombinant strain of Escherichia coli and 0.18 activity units of NAD(P)H:FMN oxidoreductase from Vibrio fischeri. The enzyme solutions were prepared in a 0.05 M potassium phosphate buffer (pH 6.9).
To conduct a comprehensive profile analysis of the snow samples, the reaction mixture was transferred to a cuvette within a luminometer (GloMax 20/20n Luminometer, Promega, Madison, WI, USA) for the purpose of measuring the luminescence intensity. The residual luminescence was calculated using the formula (I/I0) × 100%. To ascertain the effect of the snow sample under examination, the following scale was employed: an I/I0 ratio exceeding 80% indicated that the sample was deemed to have no impact, a ratio between 50% and 80% suggested that the sample was estimated to have a certain impact, and a ratio below 50% indicated that the impact of the sample was believed to be significant.

2.3. Heavy Metal Analysis

The concentration of six heavy metals (arsenic, cadmium, zinc, cobalt, mercury, and lead) was determined in all the snow samples. The weight concentration of the heavy metals was determined by atomic emission spectrometry with inductively coupled plasma [36]. To estimate the weight concentration, a spectrometer (Agilent 5110 ICP-OES, George Town, Malaysia) was employed, which covers the spectrum range from 168 to 758 nm. The samples were loaded into the spectrometer’s spray chamber using a roller pump, where they were subsequently exposed to argon. The resulting aerosol was introduced into a burner, where atomic ionisation occurred. The analytical signals were recorded using the standard software for spectrometers.

2.4. Data Processing

The data are presented as mean (M) ± standard deviation (s). Correlation and regression analyses were conducted using the Statistica v10 software (StatSoft Inc., Tulsa, OK, USA). All measurements were conducted in triplicate. The results were deemed statistically significant at the p < 0.05 level.

3. Results and Discussion

The potential of the rapid bioluminescence enzyme bioassay, which rapidly and reliably estimates environmental pollution, was evaluated by comparing its results with those of the pollution of snow cover in forested areas of Krasnoyarsk city with metals (arsenic, cadmium, zinc, cobalt, mercury, and lead). Snow samples were collected at the outset and over the course (after 10 days) of the so-called ‘black sky’ regime in Krasnoyarsk. During this period, atmospheric pollutants were subject to intense accumulation within the city due to the weakening of winds [37].

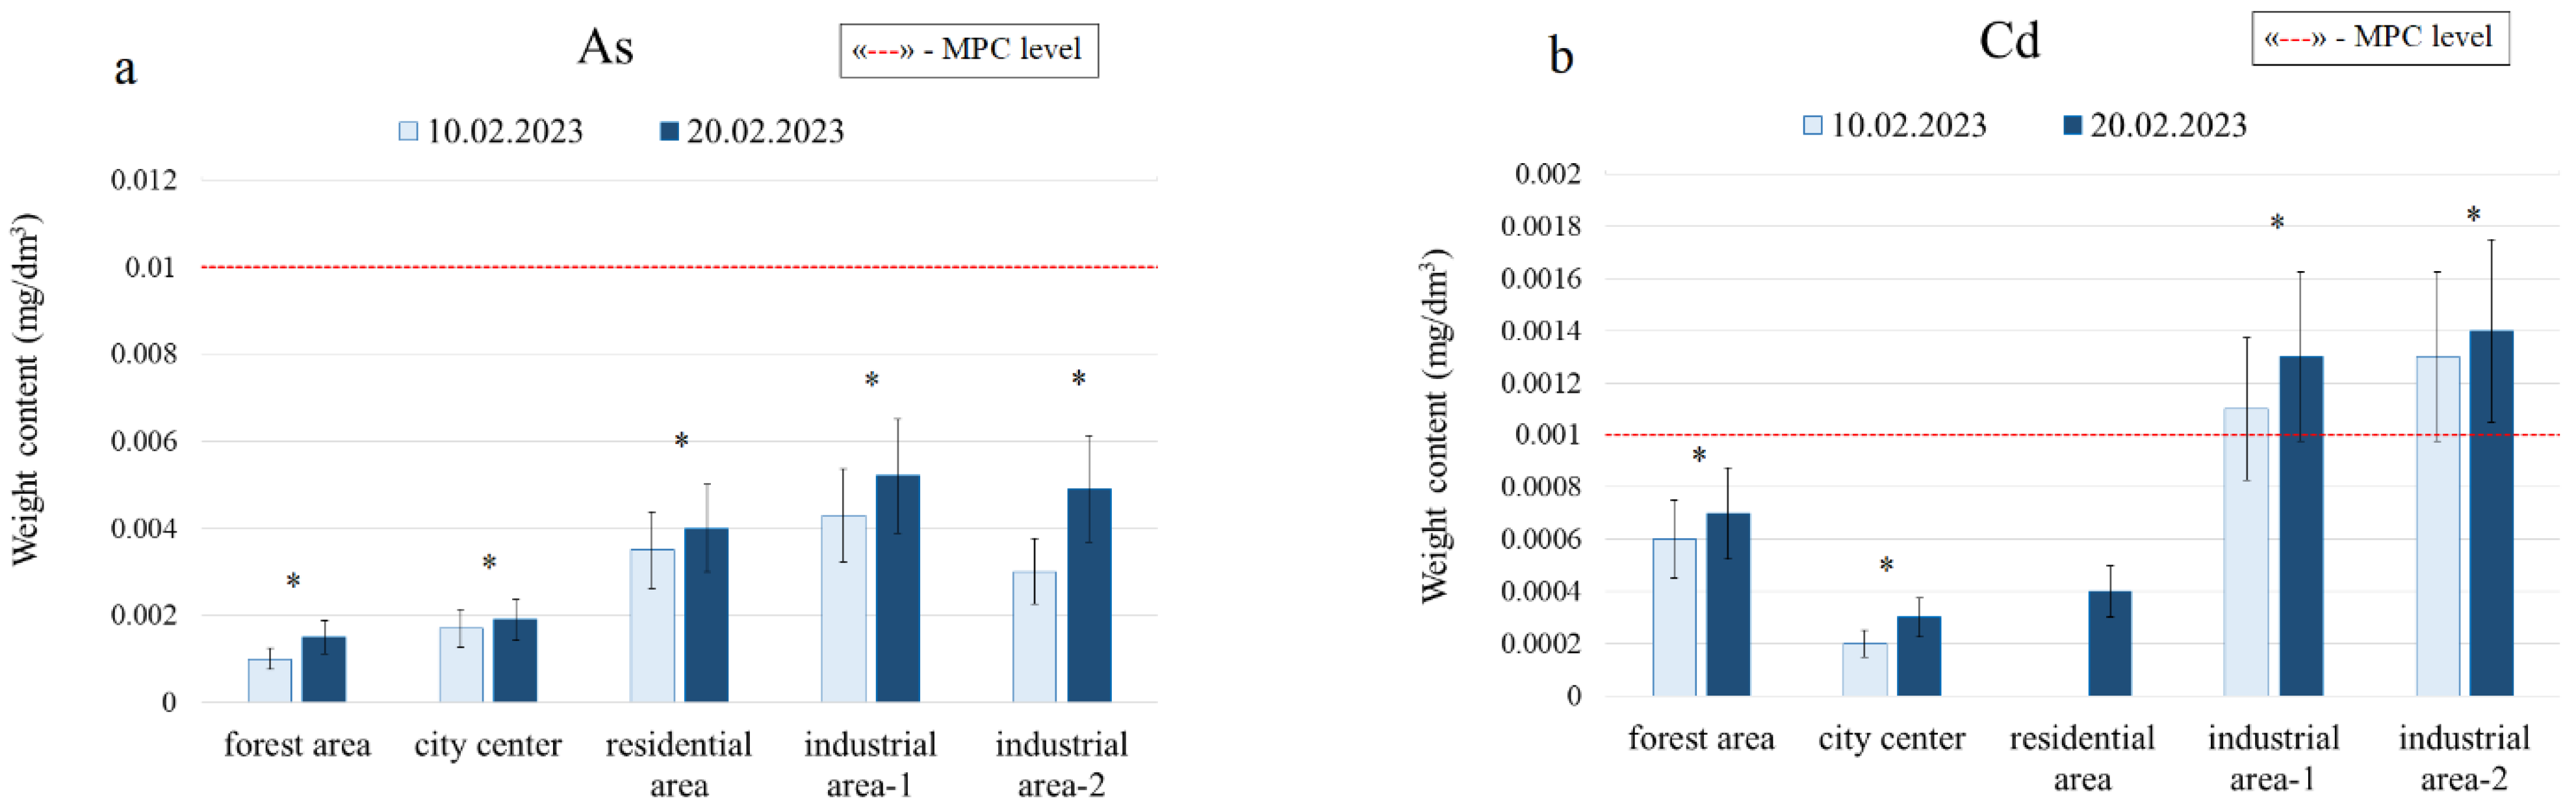
3.1. Assessment of Snow Pollution by Chemical Method

The degree of pollution of the selected research objects was assessed based on the intensity of snow pollution with metals in accordance with the maximum permissible concentrations (MPCs) of pollutants (approved by the law of the Russian Federation). The results of the analysis of the content of heavy metals in the snow cover of the five areas are presented in Figure 2.
The following classification system was used to categorise the degree of pollution: (a) pure—areas without heavy metals in the snow cover; (b) weakly polluted—areas with the content of heavy metals lower than the maximum permissible concentrations (MPCs) for two or more metals; (c) moderately polluted—areas with the content of heavy metals exceeding the MPCs by no more than two times for two or more metals; and (d) highly polluted—areas with the content of heavy metals exceeding the MPCs by more than two times for two or more metals. The findings of our study indicate that no areas exhibited absolutely pure snow cover.
In the urban forest zone (Zone 1), the MPC for zinc (Zn) is exceeded, while the content of other metals is below the maximum permissible concentration. This area is classified as exhibiting minimal contamination. In the city centre and residential area, the MPCs for elements such as Zn and Hg are exceeded by a maximum of twofold. The aforementioned areas, situated within the urban zone, are classified as moderately polluted. The industrial areas are characterised by the MPCs for Zn, Cd, Pb, and Hg being significantly exceeded, thus indicating that they are highly polluted.
Arsenic content in the snow cover exhibited an increase over time. The initial sampling revealed arsenic (As) concentrations of 0.0010 mg/dm3 in the urban forest, 0.0015 mg/dm3 in the urban zone, and 0.002–0.003 mg/dm3 in the industrial area. Following a 10-day period of the so-called ‘black sky’ regime, the accumulation of As had reached approximately twice the initial concentration, reaching 0.002 mg/dm3 in the urban forest, 0.002 mg/dm3 in the urban zone and central urban area, and 0.005 mg/dm3 in the industrial area. It is notable that the As content in all samples remained below the MPC throughout the observation period.
The cadmium (Cd) content in the forest area, city centre, and residential area, which were referred to as zones, did not exceed the MPC, whereas the samples from the industrial area demonstrated evidence of environmental contamination with this metal. It is noteworthy that within a 10-day period, a slight accumulation of Cd was observed in the urban forest, urban zone, and city centre, with concentrations reaching 0.008 mg/dm3 in the industrial area. The initial samples from the forest environment exhibited a Cd content of 0.003 mg/dm3, while the urban environment displayed a concentration of 0.001 mg/dm3 and the industrial zone exhibited a concentration of 0.006–0.007 mg/dm3. Additionally, trace amounts of the element were observed in the city centre.
In all the areas under study, the MPC for Zn was exceeded. Furthermore, the Zn content in the industrial zone (industrial area-1 and industrial area-2) was significantly higher than in samples 1–3 (0.15–0.20 mg/dm3 versus 0.001 mg/dm3).
Cobalt (Co) was present in the forest area, city centre, and residential area in trace amounts, and in the industrial zone (industrial area-1) it was present at a concentration of 0.002–0.006 mg/dm3 without any observable changes for a period of 10 days.
Mercury (Hg) was observed in trace amounts in the forest area and city centre, with a concentration of 0.002 mg/dm3 in the urban zone (city centre) and 0.001–0.004 mg/dm3 in the industrial area. After a 10-day period, the level of Hg pollution remained largely unchanged.
The initial lead (Pd) concentration was identical across all locations, including the urban forest, city centre, urban environment (0.005–0.010 mg/dm3), and industrial zone (0.015–0.035 mg/dm3). After a 10-day period, the concentration of Pd in samples 1–4 remained unaltered, whereas in the industrial zone (industrial area-2) it decreased to 0.015 mg/dm3 in comparison to the initial sample.
In order to ascertain the relationship between the metal concentrations, a correlation analysis was conducted (see Table 1).
A significant correlation was observed between Cd, Zn, and Pb at a level of significance below 0.05 (Table 1), indicating that these metal pollutants have a common source. The contamination of these areas with these metals was found to be associated wit.h emissions from nearby thermal power plants, as well as with transportation activity. Previous studies have demonstrated that elevated levels of Pb and Zn in snow can be attributed to truck and car braking, tyre wear, and vehicle exhaust emissions [35]. Furthermore, a number of studies indicate that industrial emissions, such as those from smelters, are also significant sources of Pb and Zn in snow cover [36,37,38,39].
The results demonstrate that the presence of all six metals (As, Cd, Hg, Co, Pb, and Zn) in the snow cover is associated with industrial emissions from thermal power plants, domestic heating, and industrial activities related to road transport.

3.2. Estimation of Snow Pollution by the Bioluminescence Enzyme Bioassay

The assessment of snow pollution was conducted at all the study zones using the bioluminescence enzyme bioassay with the soluble BLuc–Red enzyme system (Figure 3).
The degree of impact of the analysed snow sample on the BLuc–Red enzyme system was evaluated using the I/I0 value. A value of I/I0 greater than 80% was taken to indicate a minimum level of pollution, while a value between 50% and 80% indicated an average degree of pollution. A value of I/I0 less than 50% was taken to indicate a high level of pollution. The application of these criteria permitted the division of the sites under study into three groups: (a) samples with minor pollution, characterised by a residual luminescence intensity exceeding 80%; (b) moderately polluted samples, exhibiting a residual luminescence intensity between 50% and 80%; and (c) highly polluted samples, defined by a residual luminescence intensity below 50%.
The utilisation of a soluble form of the BLuc–Red enzyme system to ascertain the extent of snow pollution indicated that the urban forest zone (forest area) was initially assessed as a relatively unpolluted area, with an observable increase in pollution occurring after 10 days. The city centre sample was initially estimated to be moderately polluted, but this assessment was revised after 10 days to indicate that it was highly polluted. The residential area sample was initially classified as a clean area; however, after 10 days it was already determined to be moderately polluted. The industrial area was found to exhibit severe snow pollution.
The utilisation of the soluble BLuc–Red enzyme system has demonstrated that the intensity of residual luminescence within the urban zone and central area at the inception of the investigated period exhibited a range of 72% to 97% (forest area), while in the industrial area, the range was 49% to 62% (industrial area-1). The highest level of luminescence intensity was observed in the forest zone, with a value of 98% (Zone 1). By the conclusion of the investigation, the residual glow intensity ranged from 40% to 75% in the urban and central areas and from 32% to 49% (industrial area-2) in the industrial zone. The residual intensity value for the forest zone was found to be 78% (forest area).
The results of the bioluminescence enzymatic bioassay demonstrated a reduction in the intensity of residual luminescence over the course of the investigation period, which is indicative of the accumulation of pollutants. These findings corroborate the hypothesis that pollutants accumulate during periods of unfavourable meteorological conditions.
In order to ascertain the relationship between snow pollution with metals and the indicators of the bioluminescence inhibition bioassay, a correlation analysis was conducted (Table 2).
The results of the analysis using the soluble system showed a negative correlation with the concentration of Cd (R = −0.77). The results demonstrate a slight correlation between the concentrations of As, Hg, Co, Pb, and Zn and the residual luminescence values of the enzymatic system. Nevertheless, despite the elevated levels of total metal content observed in the snow samples, the aforementioned correlation values could not be attained in the present study due to the low solubility of a number of metals in water [36]. It is recommended that this fact be taken into account when performing bioanalyses of snow cover. Furthermore, it is recommended that solvents other than water be used to obtain extracts for the enzymatic testing of heavy metal-contaminated snow cover, as well as additional chemical analysis for other toxicants [35]. It can therefore be concluded that the residual values of the bioluminescence bioassay are dependent not only on the contaminant content of the snow samples, but also on the individual characteristics of the toxicants present in the samples under test.
Nevertheless, the bioluminescence enzymatic bioanalysis demonstrates the contamination of the snow cover in the studied areas, confirming the highest contamination in the industrial zone, as indicated by the content of six heavy metals. The lowest accumulation of toxicants was observed in the forest area, indicating contamination of the studied areas, as determined by both chemical and enzymatic methods of analysis.

4. Conclusions

This study demonstrates the efficacy of a bioluminescence method for assessing snow cover pollution in urban forests in Krasnoyarsk city. The influence of snow samples collected in Krasnoyarsk city was measured using the bioluminescence assay with NAD(P)H:FMN oxidoreductase and luciferase in conjunction with luminous bacteria and chemical methods. The concentrations of heavy metals, including As, Cd, Zn, Co, Hg, and Pb, were also defined. The findings demonstrate a significant correlation between the decreased activity of the BLuc–Red enzyme system and the presence of Cd in the snow samples. Furthermore, periods of unfavourable meteorological conditions were found to correspond with a notable reduction in BLuc–Red enzyme activity, indicating an increase in air pollution levels. This innovative approach not only provides a reliable indicator of environmental pollution but also highlights the potential for broader application in monitoring urban forest ecosystems. Future research should focus on refining this methodology and exploring its applicability across different urban environments to enhance our understanding and management of air pollution.

Author Contributions

Conceptualization, V.A.K. and S.A.T.; formal analysis, O.S.S.; investigation, S.A.T., A.A.R., D.E.C., A.R.G. and N.V.R.; methodology, V.A.K., S.A.T. and E.Y.M.; project administration, V.A.K.; supervision, V.A.K.; visualization, A.A.R., D.E.C. and A.R.G.; writing—original draft preparation, E.Y.M. and A.A.R.; writing—review and editing, S.A.T., V.A.K., O.S.S. and E.Y.M.; funding acquisition, O.S.S. and V.A.K. All authors have read and agreed to the published version of the manuscript.

Funding

This research was funded by the Russian Science Foundation, grant number 24-14-20030, https://rscf.ru/en/project/24-14-20030/, for work related to the collection of samples and subsequent chemical analysis and by the State Assignment of the Ministry of Science and Higher Education of the Russian Federation (Project No. 1021051402831-2-1.6) in the field of statistical analysis and interpretation of the data.

Data Availability Statement

Data are contained within the article.

Acknowledgments

The authors are grateful to Natalya V. Mikhailenko from the Department of Foreign Languages, Federal Research Center ‘Krasnoyarsk Science Center, Siberian Branch of the Russian Academy of Sciences’, for participation in editing this paper.

Conflicts of Interest

The authors declare no conflicts of interest.

References

  1. Thangavel, P.; Park, D.; Lee, Y.-C. Recent Insights into Particulate Matter (PM2.5)—Mediated Toxicity in Humans: An Overview. Int. J. Environ. Res. Public Health 2022, 19, 7511. [Google Scholar] [CrossRef] [PubMed]
  2. Romanov, A.A.; Gusev, B.A.; Leonenko, E.V.; Tamarovskaya, A.N.; Vasiliev, A.S.; Zaytcev, N.E.; Philippov, I.K. Graz Lagrangian Model (GRAL) for Pollutants Tracking and Estimating Sources Partial Contributions to Atmospheric Pollution in Highly Urbanized Areas. Atmosphere 2020, 11, 1375. [Google Scholar] [CrossRef]
  3. Mikhailyuta, S.V.; Kucherenko, A.V.; Lezhenin, A.A. Problems of assessing the structure of emissions in the system of industrial enterprises—motor vehicles. Ecol. Ind. Russ. 2017, 21, 54–58. [Google Scholar] [CrossRef]
  4. Xia, D.; Nie, H.; Sun, L.; Wang, J.; Chow, K.-C.; Chan, K.-L.; Wang, D. Urbanization Effects on Surface Wind in the Guangdo—Hong Kong—Macao Greater Bay Area Using a Fan-Sector Method. Int. J. Environ. Res. Public Health 2022, 19, 3194. [Google Scholar] [CrossRef] [PubMed]
  5. Sawidis, T.; Breuste, J.; Mitrovic, M.; Pavlovic, P.; Tsigaridas, K. Trees as Bioindicator of Heavy Metal Pollution in Three European Cities. Environ. Pollut. 2011, 159, 3560–3570. [Google Scholar] [CrossRef] [PubMed]
  6. Achikolova, Y.S.; Ageev, A.A.; Astapenko, S.A.; Golovina, A.N. Features of the radial growth of Siberian pine under the changing climate of the Khamar-Daban mountain range. For. Inf. 2023, 37–54. [Google Scholar] [CrossRef]
  7. Mazey, N.G.; Prokushkin, A.S.; Kupriyanov, D.A.; Novenko, E.Y. Influence of Fires on the Dynamics of Forest Ecosystems of Central Evenkia in the Last 3500 Years; Series 5. Geography; Bulletin of Moscow University: Moscow, Russia, 2021. [Google Scholar]
  8. INION RAN; Zhilina, I. Warming in the Arctic: Opportunities and Risks. Espr 2021, 66–87. [Google Scholar] [CrossRef]
  9. Nagajyoti, P.C.; Lee, K.D.; Sreekanth, T.V.M. Heavy Metals, Occurrence and Toxicity for Plants: A Review. Env. Chem. Lett. 2010, 8, 199–216. [Google Scholar] [CrossRef]
  10. Nakazato, R.K.; Lourenço, I.S.; Esposito, M.P.; Lima, M.E.L.; Ferreira, M.L.; de O.A. Campos, R.; Rinaldi, M.C.S.; Domingos, M. Trace Metals at the Tree-Litter-Soil-Interface in Brazilian Atlantic Forest Plots Surrounded by Sources of Air Pollution. Environ. Pollut. 2021, 268, 115797. [Google Scholar] [CrossRef]
  11. Usui, K.; Kikuchi, R.; Nakatsu, S.; Imayoshi, T.; Kumagai, K.; Tago, H.; Satoh, T.; Ishii, Y.; Kada, W. Characterization of Hourly-Collected Airborne Particulate Matters from an Automated Sampling Unit of the Atmospheric Environmental Regional Observation System by in-Air Micro-PIXE Analysis. Nucl. Instrum. Methods Phys. Res. Sect. B Beam Interact. Mater. At. 2023, 544, 165106. [Google Scholar] [CrossRef]
  12. Sakai, H.; Sasaki, T.; Saito, K. Heavy Metal Concentrations in Urban Snow as an Indicator of Air Pollution. Sci. Total Environ. 1988, 77, 163–174. [Google Scholar] [CrossRef] [PubMed]
  13. Yamamoto, Y.; Oka, K.; Tokoro, S.; Nishii, N.; Kikuchi, Y.; Nishimoto, J.; Imai, S. Investigation of the Concentration Ratios of Anthropogenic Metal Elements in Fresh Snow at Mountain Area as a Tracer for the Discrimination between Short—and Long—Range Transport Contributions. Anal. Sci. 2023, 39, 679–687. [Google Scholar] [CrossRef] [PubMed]
  14. Siudek, P.; Frankowski, M.; Siepak, J. Trace Element Distribution in the Snow Cover from an Urban Area in Central Poland. Env. Monit Assess. 2015, 187, 225. [Google Scholar] [CrossRef] [PubMed]
  15. Engelhard, C.; De Toffol, S.; Lek, I.; Rauch, W.; Dallinger, R. Environmental Impacts of Urban Snow Management—The Alpine Case Study of Innsbruck. Sci. Total Environ. 2007, 382, 286–294. [Google Scholar] [CrossRef] [PubMed]
  16. Li, X.; Jiang, F.; Wang, S.; Turdi, M.; Zhang, Z. Spatial Distribution and Potential Sources of Trace Metals in Insoluble Particles of Snow from Urumqi, China. Env. Monit Assess. 2015, 187, 4144. [Google Scholar] [CrossRef] [PubMed]
  17. Nakashima, Y.; Mitsuhata, Y.; Nishiwaki, J.; Kawabe, Y.; Utsuzawa, S.; Jinguuji, M. Non-Destructive Analysis of Oil-Contaminated Soil Core Samples by X-Ray Computed Tomography and Low-Field Nuclear Magnetic Resonance Relaxometry: A Case Study. Water Air Soil Pollut. 2011, 214, 681–698. [Google Scholar] [CrossRef] [PubMed]
  18. Świsłowski, P.; Vergel, K.; Zinicovscaia, I.; Rajfur, M.; Wacławek, M. Mosses as a biomonitor to identify elements released into the air as a result of car workshop activities. Ecol. Indic. 2022, 138, 108849. [Google Scholar] [CrossRef]
  19. Ferreira, M.L.; Ribeiro, A.P.; Rakauskas, F.; Bollamann, H.A.; Theophilo, C.Y.S.; Moreira, E.G.; Aranha, S.; Santos, C.J.; Giannico, V.; Elia, M.; et al. Spatiotemporal Monitoring of Subtropical Urban Forests in Mitigating Air Pollution: Policy Implications for Nature-Based Solutions. Ecol. Indic. 2024, 158, 111386. [Google Scholar] [CrossRef]
  20. Tsamos, P.; Kolias, P.; Lambropoulou, D.; Noli, F. Distribution and Temporal Variability of Uranium and Toxic Metal(loid)s in Snow and Rainwater from an Oil Industry and Urban Area in Thessaloniki-Greece. Sci. Total Environ. 2022, 838, 155604. [Google Scholar] [CrossRef] [PubMed]
  21. Novenko, E.; Rudenko, O.; Mazei, N.; Kupriyanov, D.; Andreev, R.; Shatunov, A.; Kusilman, M.; Prokushkin, A.; Olchev, A. Effects of Climate Change and Fire on the Middle and Late Holocene Forest History in Yenisei Siberia. Forests 2023, 14, 2321. [Google Scholar] [CrossRef]
  22. Slinkina, O.A.; Mikhaylov, P.V.; Sultson, S.M.; Demidko, D.A.; Khizhniak, N.P.; Tatarintsev, A.I. Mapping Tree Mortality Caused by Siberian Silkmoth Outbreak Using Sentinel-2 Remote Sensing Data. Forests 2023, 14, 2436. [Google Scholar] [CrossRef]
  23. Esimbekova, E.N.; Kondik, A.M.; Kratasyuk, V.A. Bioluminescent Enzymatic Rapid Assay of Water Integral Toxicity. Env. Monit Assess. 2013, 185, 5909–5916. [Google Scholar] [CrossRef] [PubMed]
  24. Baigina, E.M.; Rimatskaya, N.V.; Stepanova, L.V.; Kratasyuk, V.A. Analysis of the Possibility of Using Bioluminescent Enzymatic Biotests to Assess Soil Pollution (Using the Example of Soils in Krasnoyarsk); News of Irkutsk State University: Irkutsk, Russia, 2017; pp. 21–30. [Google Scholar]
  25. Hassan, S.H.A.; Van Ginkel, S.W.; Hussein, M.A.M.; Abskharon, R.; Oh, S.-E. Toxicity Assessment Using Different Bioassays and Microbial Biosensors. Environ. Int. 2016, 92–93, 106–118. [Google Scholar] [CrossRef]
  26. Esimbekova, E.N.; Torgashina, I.G.; Kalyabina, V.P.; Kratasyuk, V.A. Enzymatic Biotesting: Scientific Basis and Application. Sib. J. Ecol. 2021, 28, 364–382. [Google Scholar] [CrossRef]
  27. Yesimbekova, E.N.; Rimatskaya, N.V.; Sukovataya, I.E.; Kratasyuk, V.A. Bioluminescent express method for determining the integral toxicity of water and air pollution. Bull. OSU 2013, 10, 122–127. [Google Scholar]
  28. Antonenko, O.V.; Bezrukikh, V.A.; Avdeeva, E.V.; Nazarova, E.I.; Kislenko, A.M. Features of landscapes of Krasnoyarsk as a geological and geomorphological basis for urban planning. Conifers Boreal Zone 2017, 211, 15–20. [Google Scholar]
  29. Chen, J.; Hoek, G. Long-Term Exposure to PM and All-Cause and Cause-Specific Mortality: A Systematic Review and Meta-Analysis. Environ. Int. 2020, 143, 105974. [Google Scholar] [CrossRef] [PubMed]
  30. Gubanova, D.P.; Belikov, I.B.; Elansky, N.F.; Skorokhod, A.I.; Chubarova, N.E. Variability of the surface concentration of PM2.5 aerosols in Moscow according to observations at the Meteorological Observatory of Moscow State University. Atmos. Opt. Ocean. 2017, 31, 1033–1042. [Google Scholar]
  31. Vinogradova, A.A.; Gubanova, D.P.; Iordanskii, M.A.; Skorokhod, A.I. The Influence of Meteorological Conditions and Long-Range Air Mass Transport on the Winter near-Surface Aerosol Composition in Moscow. Opt. Atmos. Okeana 2022, 35, 436–446. [Google Scholar] [CrossRef]
  32. Badmaeva, S.E.; Muchkina, E.Y.; Podluzhnaya, A.S.; Badmaeva, Y.V. Heavy Metals in the Soil Cover and Woody Plants of an Urbanized Area; Krasnoyarsk State Agrarian University: Krasnoyarsk, Russia, 2021; p. 166. [Google Scholar]
  33. Yanchenko, N.I. Practice of sampling snow cover for chemical analysis. Izvestiya 2020, 331, 94–104. [Google Scholar] [CrossRef]
  34. Kitaykina, M.N.; Tkachev, B.P. Methods of sampling and analysis of snow samples in the city of Khanty-Mansiysk. North. Reg. Sci. Educ. Cult. 2015, 2, 32. [Google Scholar]
  35. Kolosova, E.M.; Sutormin, O.S.; Stepanova, L.V.; Shpedt, A.A.; Rimatskaya, N.V.; Sukovataya, I.E.; Kratasyuk, V.A. Bioluminescent enzyme inhibition-based assay for the prediction of toxicity of pollutants in urban soils. Environ. Technol. Innov. 2021, 24, 101842. [Google Scholar] [CrossRef]
  36. Ozersky, A.Y. On The Application of The Method of Atomic Emission Spectrometry with Inductively Coupled Plasma in Hydrochemical Research; Institute of the Earth’s Crust SB RAS: Irkutsk, Russia, 2021. [Google Scholar]
  37. Taseyko, O.V.; Mikhailuta, S.V.; Pitt, A.; Lezhenin, A.A.; Zakharov, Y.V. Air pollution dispersion in urban street canyons. Atmos. Environ. 2009, 43, 245–252. [Google Scholar] [CrossRef]
  38. Nesterkov, A.V. Surface Pollution of Meadow Plants during the Period of Reduction of Atmospheric Emissions from a Copper Smelter. Russ. Ecol. J. 2019, 50, 408–412. [Google Scholar] [CrossRef]
  39. Ioannidou, E.; Papagiannis, S.; Manousakas, M.I.; Vestenius, M.; Eleftheriadis, K.; Paatero, J.; Papadopoulou, L.; Ioannidou, A. Airborne 210Pb, Si, Zn and Pb as Tracers for Atmospheric Pollution in Helsinki Metropolitan Area. Appl. Radiat. Isot. 2024, 206, 111252. [Google Scholar] [CrossRef]
Figure 1. The schematic map of the sampling sites located in the city of Krasnoyarsk: 1—urban forest (forest vegetation with residential buildings—Zone 1); 2–3—urban area (parks in the central part of Krasnoyarsk—Zone 2); 4–5—industrial area (metallurgy enterprises, heat energy sector, plants of construction materials—Zone 3).
Forests 15 01325 g001
Figure 2. The content of heavy metals in the snow cover in Krasnoyarsk: (a)—arsenic, (b)—cadmium, (c)—zinc, (d)—cobalt, (e)—mercury, and (f)—lead. An asterisk (*) marks the significance of differences (p) relative to the value of the 5 analyzed snow samples.
Forests 15 01325 g002aForests 15 01325 g002b
Figure 3. The results of the bioluminescence bioassay for the snow cover in Krasnoyarsk using the soluble BLuc–Red enzyme system. An asterisk (*) marks the significance of differences (p) relative to the value of the 5 analyzed snow samples.
Forests 15 01325 g003
Table 1. The results of the correlation analysis for the metal concentrations.
MetalAs Cd Hg Co Pb Zn
As 1
Cd 0.5441311
Hg 0.5091010.3214931
Co 0.6144990.394454−0.2252861
Pb 0.2374840.693219 *0.1027260.5021781
Zn 0.3808580.766295 *−0.0816570.5835260.744234 *1
* The correlation is significant at the level of 0.05.
Table 2. The results of the correlation analysis of metal concentrations and the bioluminescence inhibition bioassay.
Metal Concentration, mg/dm3Soluble Form of BLuc–Red Enzyme System
As −0.060
Cd −0.774 *
Hg −0.042
Co −0.119
Pb −0.421
Zn −0.505
* The correlation is significant at the level of 0.05.
Disclaimer/Publisher’s Note: The statements, opinions and data contained in all publications are solely those of the individual author(s) and contributor(s) and not of MDPI and/or the editor(s). MDPI and/or the editor(s) disclaim responsibility for any injury to people or property resulting from any ideas, methods, instructions or products referred to in the content.

