Article

Responses of Soil Organic Carbon Fractions and Stability to Forest Conversion in the Nanling Nature Reserve, China

Guangdong Provincial Key Laboratory of Silviculture, Protection and Utilization, Guangdong Academy of Forestry, Guangzhou 510520, China
*
Author to whom correspondence should be addressed.
Forests 2024, 15(8), 1330; https://doi.org/10.3390/f15081330
Submission received: 28 May 2024 / Revised: 24 June 2024 / Accepted: 15 July 2024 / Published: 31 July 2024
(This article belongs to the Topic Forest Carbon Sequestration and Climate Change Mitigation)

Abstract

:
Studying the impact of typical vegetation types in forest conversion zones on soil organic carbon (SOC) structure and stability is crucial for developing terrestrial ecosystem carbon sequestration strategies. In this study, we selected three typical forest stands in the Nanling National Nature Reserve: a primary evergreen broad-leaved forest (BL), a secondary mixed coniferous and broad-leaved forest (ML), and a Chinese fir plantation (CL). Soil samples were collected to examine the SOC fractions and carbon pool management index (CPMI) in three forest stands. The influence of soil property factors on SOC fractions was also analyzed. The results showed that the transformation process from a BL to an ML or a CL changed the structure and stability of organic carbon by reducing the labile SOC fractions and increasing the recalcitrant carbon fraction in the soil. The higher lability index (LI) and CPMI of soils in the BL indicated better carbon accumulation and activity, making this treatment more advantageous for management strategies aimed at promoting natural forest renewal and ecological restoration. Correlation and RDA analysis revealed that the availability of soil P was a key factor limiting the variation in organic C fractions in the acidic soils of tropical forests in South China.

1. Introduction

China has the largest area and widest distribution of evergreen broad-leaved forests, but most of China’s native broad-leaved forests have degraded due to human activities. When evergreen monsoon forests are destroyed, mixed coniferous and broad-leaved forests or coniferous forests often appear and occupy iconic areas in southern China, seriously threatening the development of the regional ecological environment [1]. To date, due to large-scale planting and intensive timber harvesting [2], large areas of primary broad-leaved forests in subtropical China have been cleared and degraded into secondary forests [2] or transformed into forests of Chinese fir (Cunninghamia lanceolata) or Pinus massoniana [3,4]. The profound impact of forest conversion on ecosystem processes, structure, and function can alter soil nutrient concentrations, carbon storage, soil quality, and vegetation structure [5].
Forests are the mainstays of terrestrial ecosystems, with complex hierarchical structures and the largest carbon pools on land [6]. The carbon storage of the soil carbon pool is greater than the sum of atmospheric and vegetation carbon storage [7], and slight changes can have a significant impact on ecosystem functions such as soil carbon sequestration, climate regulation [8], and nutrient cycling [9], altering the global carbon balance. However, there is currently no consensus on the impact of forest conversion on soil organic carbon (SOC) sequestration in forest ecosystems. Some existing research indicates that changes in tree species caused by forest conversion can lead to an increase or decrease in SOC pools [10,11]. However, Rytter (2016) [12] and Chen et al. (2017) [13] reported that the impact of changes in forest stands on SOC is not significant. Therefore, it is necessary to study the relationships between soil carbon dynamics and vegetation types after forest restoration in forest conversion zones and evaluate the impact of forest conversion on SOC structure and stability to formulate effective forest protection measures and terrestrial ecosystem carbon sequestration strategies.
The change in the soil total organic C (SOC) content is relatively slow and cannot quickly and sensitively indicate variations in the soil C pool in the short term, while active organic C provides an efficient and direct supply of plant nutrients and can be easily decomposed and utilized by soil microorganisms [14]. Accurately evaluating the quantity and proportion of active and recalcitrant C pools can increase the sensitivity and speed of characterizing the response of soil C pools to human interference and changes in environmental conditions, which reflects soil properties, carbon pool quality, etc. [15]. Fractions such as readily oxidizable carbon (OXC), microbial biomass carbon (MBC), particulate organic carbon, dissolved organic carbon, water-soluble organic carbon (WOC), and light fraction organic carbon are often used to characterize soil active organic carbon. Among them, readily oxidizable carbon can be easily decomposed and utilized by microorganisms in the soil [16], with fast turnover, and it can characterize the stability and activity of soil organic carbon. Although the content of microbial biomass carbon is relatively low, it has high sensitivity to changes in the microenvironment [17], which can reflect the quantity and activity of soil microorganisms. The main sources of water-soluble organic carbon are litter and substances secreted by plant roots, products of microbial metabolism, and hydrolysis products of soil organic matter, which can directly provide organic carbon sources for soil microorganisms and be a sensitive indicator of soil environmental changes [18]. In this study, we chose these three carbon fractions to comprehensively measure the soil organic carbon active carbon pool. All three carbon fractions adopted in this study are tightly related to soil microorganism activities which are sensitive to the changes in active organic C. Many studies have investigated the dynamics of total SOC and labile SOC fractions (microbial biomass C, readily oxidizable carbon, dissolved organic carbon, and water-soluble organic carbon), as well as their relationships with different forest types in different regions [19,20], and found that the SOC and labile organic C fractions in soils at different stages of successional forest have different results due to differences in forest sources (primary and secondary forests) and forest types (broad-leaved and coniferous forests) [21,22,23]. Active organic carbon, although highly sensitive, has certain limitations when indicating forest long-term conversion, so it is also necessary to measure the recalcitrant carbon (RC) fraction to indicate long-term changes. The recalcitrant carbon fraction in soil is difficult to decompose and utilize for microorganisms, and has a long turnover time, making it an important indicator for measuring the accumulation and stability of soil carbon pools [24]. Previous studies have shown that with the increase in forest restoration and succession time, the composition of vegetation communities becomes richer, the stability of communities is improved, and it is more conducive to the accumulation of soil recalcitrant carbon, and the soil carbon pool becomes more stable [25,26]. Due to differences in the formation mechanisms and maintenance pathways of organic carbon fractions, the impact of litter quality, management practices, and climate change on them varies [27,28,29], and the stability patterns also differ [30,31]. Although there are significant differences in residence time or decomposition rate, few researchers have studied the response of SOC fractions and stability to forest conversion and subsequent forest recovery, which hinders our understanding of SOC dynamics.
The carbon pool management index (CPMI), which was developed based on soil labile organic C and total SOC, has become a sensitive indicator reflecting the dynamic rate of soil carbon change in terrestrial ecosystems [32]; this index can be affected by climate change, land use transformation, and human activities and responds relatively quickly to environmental changes, making it a useful parameter for soil quality assessment [33]. Previously, most studies using the CPMI focused on evaluating the contribution of land-management practices to soil fertility [34,35], while there has been relatively little research on how forest conversion affects the soil CPMI. This reality hinders us from evaluating and predicting the response of soil C pools and sequestration methods to forest changes on a relatively large scale.
In this context, we chose the Nanling National Nature Reserve in Guangdong Province, China, which has unique ecological location advantages, as the research area. As the birthplace of modern temperate and subtropical plants in East Asia and an important gene pool of China’s strategic biological resources, a large area of primary broad-leaved forests has been transformed into secondary coniferous broad-leaved mixed forests and Chinese fir plantations due to wood harvesting and succession [36]. The specific objectives of this study were to (1) evaluate the differences in organic carbon fractions (including concentrations and proportions) among different typical forest stands, (2) study the changes in the LI and CPMI during the transformation process from primary evergreen broad-leaved forests to coniferous broad-leaved mixed forests or Chinese fir plantations, and (3) identify the main limiting factors driving the accumulation of SOC fractions. We predicted that (1) there would be significant differences in the organic C fractions of different typical forest stands under forest conversion and (2) carbon pool management indices such as the higher lability index (LI), the carbon pool index (CPI), and CPMI would significantly decrease during the transformation from primary evergreen broad-leaved forests (BL) to Chinese fir plantations (CL) and mixed coniferous and broad-leaved forests (ML). Therefore, we collected soil samples from the study area for testing to examine the effects of three typical forest stands on soil total SOC, labile C fraction (LAC), nonlabile carbon fraction (NLAC), and CPMI.

2. Materials and Methods

2.1. Study Area Description and Sample Collection

This study was conducted in the Nanling National Nature Reserve, Guangdong Province, China (112°30′—113°04′ E, 24°37′—24°57′ N), which covers an area of 58,368.4 hm2 and has a typical subtropical monsoon climate. The average annual precipitation was 2108.4 mm, with an average temperature of 26.2 °C in the hottest month (July) and 7.1 °C in the coldest month (January) during the study period. In October 2023, soil samples were collected from nine sample plots (40 × 60 m2) of primary broad-leaved forests (BLs), secondary coniferous broad-leaved mixed forests (MLs), and Chinese fir plantations (C. lanceolata) (CLs) in the mountainous areas of Xiaohuangshan, Baimakeng, and the Babaoshan Management and Protection Station in the Reserve, which are rarely disturbed by human beings (Table 1). The distance between the three typical forest stands is more than 1000 m, with the farthest two forest stands being 7.23 km apart. The selected plots within each typical forest stand are at least 300 m apart (Figure 1). The soil types at the sampling sites are mainly red and yellow soils of mountainous areas, with parent rocks mainly composed of granite, limestone, metamorphic rocks, etc. The soil layer is relatively thick and rich in organic matter. The soil texture formed by mixing red clay and quartz sand particles is relatively loose. Three plots were designated for each of the three typical forest stands. Four soil core samples (5 cm diameter) were obtained from the surface (0–20 cm, after litter removal) of each plot. During transportation to the laboratory, the soil samples were stored in ice boxes. Altogether, 12 duplicate data points were collected for each typical forest stand. All the samples were passed through a 2 mm sieve to remove roots and stones. The soil samples designated for analyzing microbial biomass carbon (MBC) and enzyme activity were stored at −20 °C for less than 2 weeks.

2.2. Analysis of Soil Organic Carbon and Fractions

The total SOC content in the soil was measured using potassium dichromate oxidation and external heating methods [37].
The OXC content was measured using the potassium permanganate oxidation method: Pass the soil sample through a 0.25 mm sieve and use the amount of soil sample containing 15 mg of carbon as the weight of the sample. Then transfer the sample to a 50 mL centrifuge tube, add 25 mL of potassium permanganate solution with a concentration of 333 mmol·L−1 to the centrifuge tube, shake for 1 h, and centrifuge at 2000 rpm for 5 min. Dilute the supernatant with deionized water in a ratio of 1:250. Transfer 1 mL of supernatant to a 250 mL volumetric flask, add deionized water to 250 mL, and measure the diluted sample at 565 nm using a spectrophotometer [38,39].
The WOC content was measured using the distilled water extraction method: Weigh 40.0 g of soil sample passing through a 2 mm sieve, add 120 mL of distilled water, and shake for 1 h on a reciprocating shaker. After shaking, centrifuge at 2000 r/min for 7 min. The supernatant of the soil after centrifugation is filtered through a 0.45 um membrane to obtain the filtrate. Take a portion of the filtrate and measure the carbon content on the elemental liquid TOC analyzer, which is known as water-soluble organic carbon [40].
The RC content was measured using the acid hydrolysis method: Weigh 2.0 g of soil sample passing through a 2 mm sieve into a digestion tube. Then add 6 mol/L HCL and simmer at 115 °C for 16 h. After cooling, wash the sample with distilled water until neutral, and then dry it at 55 °C. Grind the sample and pass it through a 180 μm sieve. Measure the organic carbon using potassium dichromate oxidation and external heating methods as recalcitrant carbon [41].
The MBC content was measured using the chloroform fumigation K2SO4 extraction method: Weigh 20 g of fresh soil and place them into six beakers. Half of them are extracted with 50 mL of 0.5 mol/L potassium sulfate (shake for 0.5 h), and the extraction solution should be immediately processed for measurement. The others were fumigated for 24 h and then extracted after removing chloroform gas. Accurately aspirate 5 mL of the extraction solution into a test tube, add 5 mL of 0.009 mol/L potassium dichromate solution, add a small amount of zeolite, and boil in an oil bath at 160–170 °C for 10 min. After cooling, transfer samples to a triangular flask, add two drops of ortho quinoline indicator and titrate with 0.02 mol/L ferrous sulfate solution [40].
The microbial biomass nitrogen (MBN) content was first measured by the chloroform fumigation K2SO4 extraction method and then oxidized by the potassium persulfate oxidation method for colorimetric measurement.

2.3. Analysis of Soil Properties

The soil water content (SWC) was calculated as the difference in sample weight before and after being oven-dried at 105 °C for at least 48 h until a constant weight was reached. The soil pH was measured using a PB-10 pH meter (Sartorius, Gottingen, Germany) with a soil-to-water ratio of 1:2.5. The total N (TN) content was measured using a flow injection autoanalyzer (FIA, Lachat Instruments, Milwaukee, Brookfield, WI, USA). The total P (TP) content was measured following H2SO4-HClO4 digestion using the molybdenum antimony colorimetric method [42]. The TN and TP contents were measured using 0.005–0.015 g of dry soil. The available P (AP) concentration was determined by extraction with sulfuric acid and hydrochloric acid [37]. Exchangeable base cations (K+, Ca2+, and Mg2+) in the soil were extracted with 1 mol L−1 ammonium acetate solution (1:5 soil solution ratio), adjusted to pH 7.0 and then measured by an ICP-Optima 2000 (PerkinElmer Inc., Waltham, MA, USA) [43].

2.4. Analysis of Enzyme Activity

The potential activities of C-acquiring enzymes (β-1,4-glucosidase [BG]), N-acquiring enzymes (β-1,4-N-acetaminophen glucosidase [NAG]), and P-acquiring enzymes (acid phospho-monoesterase [APM]) were measured following the protocol described by Nannipieri et al. (2018) [44]. Briefly, BG, NAG, and APM activities were measured by adding the substrates 4-nitrophenyl-β-D-glucopyranoside, p-nitrophenyl-N-acetyl-β-D-glucosaminidine, and p-nitrophenyl-phosphate tetrahydrate, respectively, which bind to the chromogen p-nitrophenol [45]. Then, the samples were incubated at 37 °C for 1 h (BG and NAG) or 0.5 h (APM).

2.5. Determination of Soil C Stocks and CPMI

In this study, the SOC density was calculated based on the following equations [46]:
SOCD = SOC × BD × H × (1 − M) × 10−2
where SOCD is the organic carbon density of surface soil (t/hm2), SOC is the total SOC concentration (g/kg), BD is the soil bulk density (g/cm3), H is the thickness (20 cm), and M is the fraction (%) of soil/sediment > 2 mm.
CPMI represents a sensitive method for monitoring the soil C dynamics of specific land use types relative to control soil and calculates C dynamics for each treatment (forest stands) using control sample values [38]. Since bare land soil of natural succession (NBL) is not affected by any treatment, we used NBL soil as a reference soil to determine the impact of different forest stands on the variations in SOC and LAC. According to previous studies [46,47], the CPMI values of soils with different forest stands are calculated as follows:
C P I = S O C / S O C r
L B O C = S O C k / S O C S O C k
L I = L B O C s / L B O C r
C P M I = C P I × L I × 100
where CPI represents the carbon pool index; S O C represents the total SOC concentration (g/kg); S O C r represents the total SOC concentration of the reference soil sample (g/kg); L B O C represents the lability of C; S O C k represents the OXC content (g/kg); LI represents the lability index; L B O C s and L B O C r represent L B O C   in the sample soil and the reference soil, respectively; and C P M I represents the carbon pool management index.

2.6. Data Analysis

One-way analysis of variance (ANOVA) was used to examine the differences in SOC and its fractions (OXC, WOC, RC, and MBC) among the different forest stands (p < 0.05), and the least significant difference (LSD) method was used for multiple comparisons. Pearson’s correlation coefficient was calculated to analyze the correlations between soil properties such as soil pH, TN, TP, the C/N ratio, and enzymatic activities versus SOC fractions. All calculations and analyses were performed and graphs were generated using Excel 2016 (Microsoft Corporation, Redmond, WA, USA) and SPSS 19.0 (IBM, Armonk, NY, USA) software. Principal component analysis (PCA) was conducted for the SOC fractions based on the content of the fractions in the soil samples. Relationships between soil property factors (such as soil pH, TN, TP, C/N ratio, and enzymatic activities) and the SOC fractions were analyzed using redundancy analysis (RDA). Before RDA, we conducted forward selection of the environmental variables that were significantly correlated with variations in the SOC fractions using the Monte Carlo permutation test (p < 0.05). The PCA and RDA were performed using Canoco software 5.0 (Microcomputer Power, Ithaca, NY, USA).

3. Results

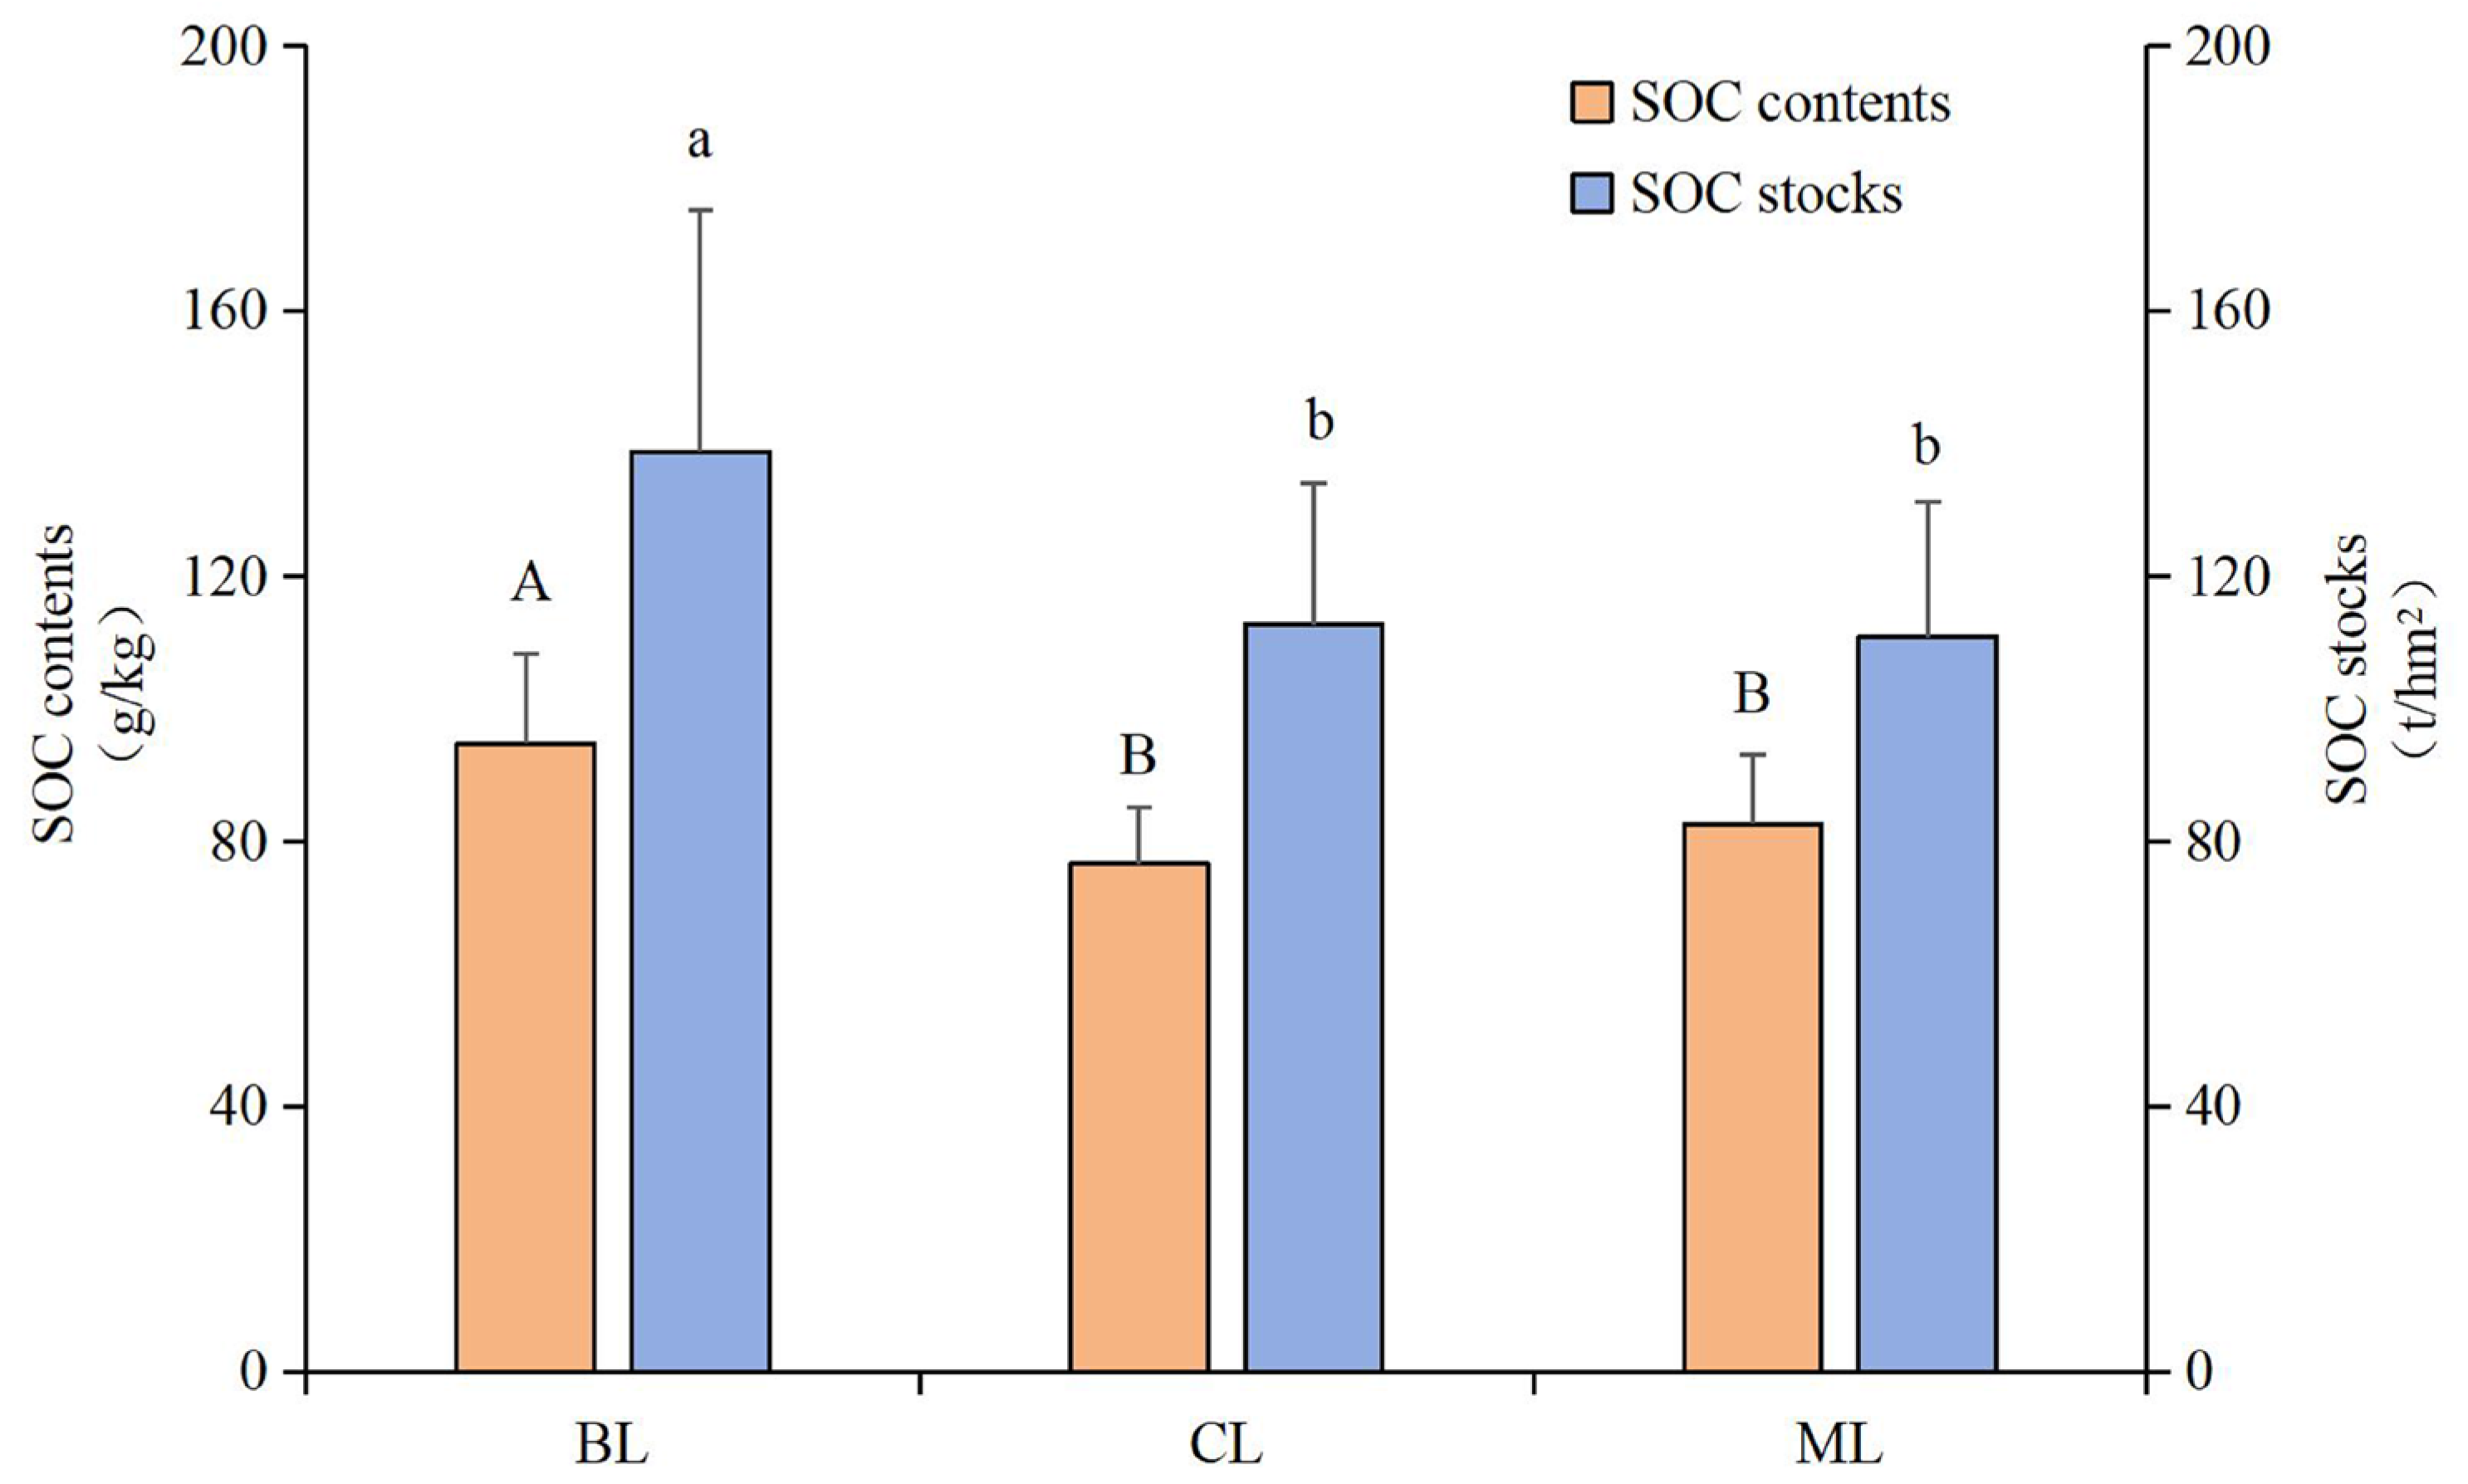
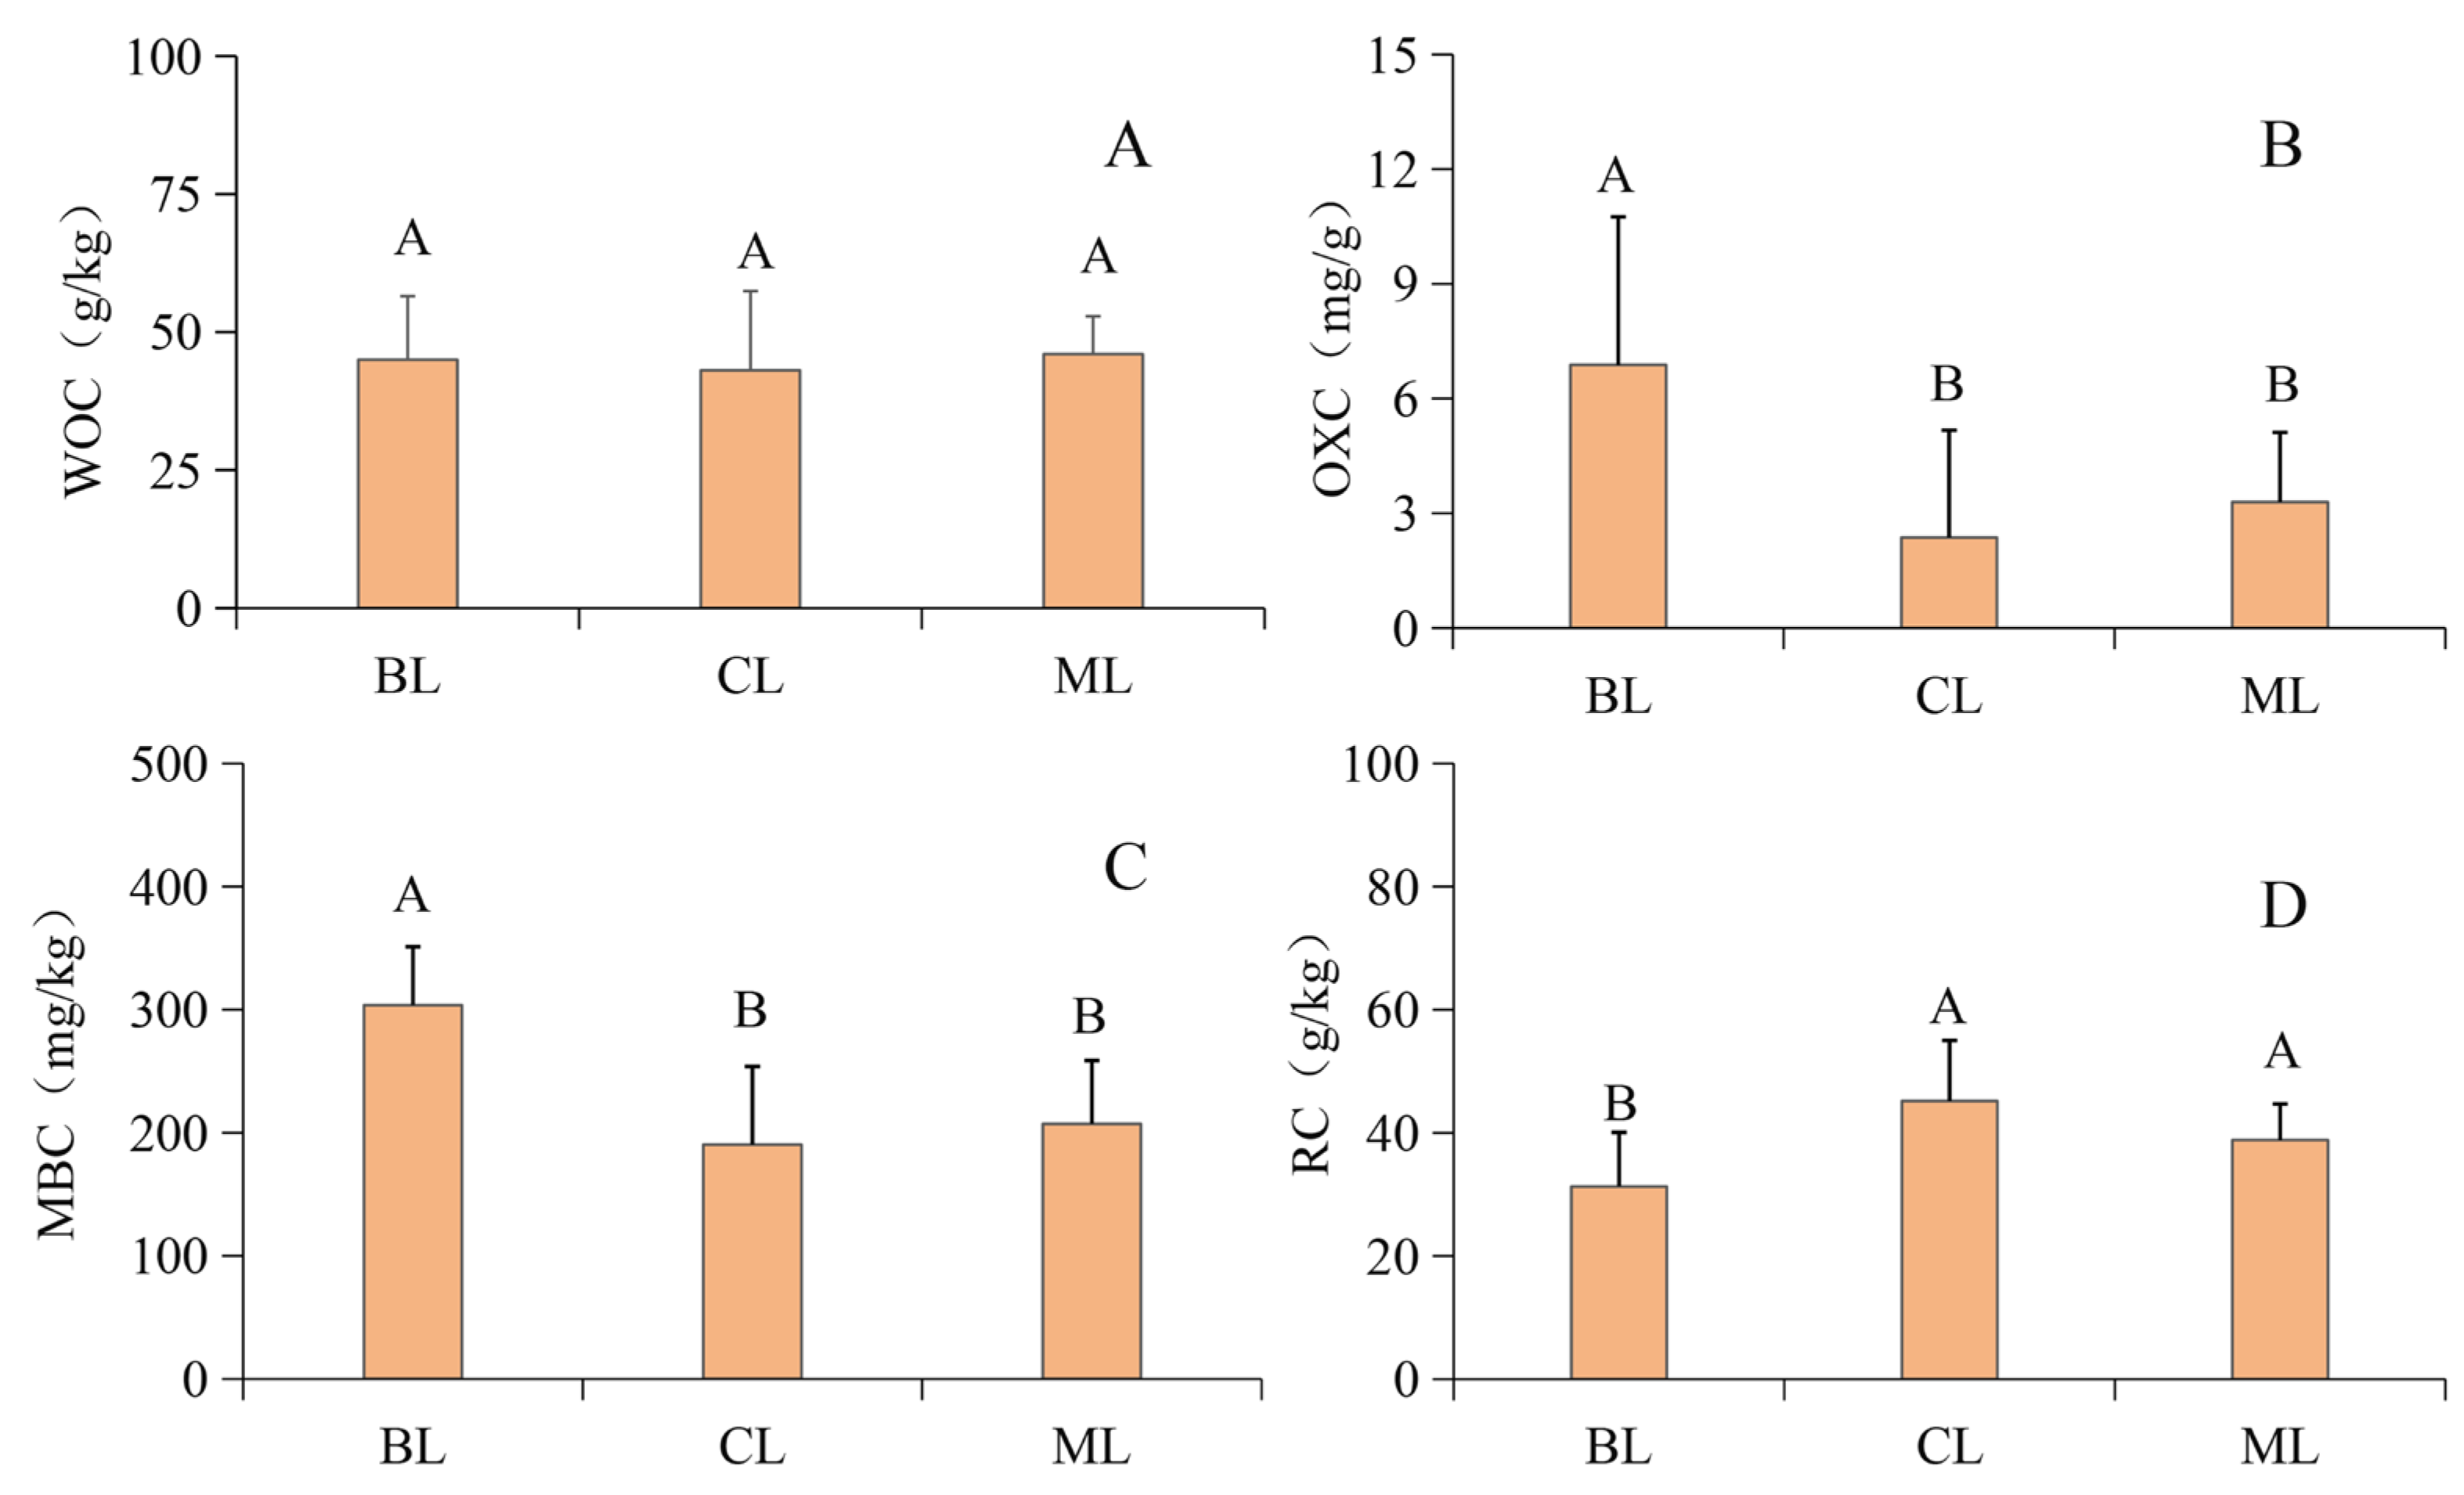
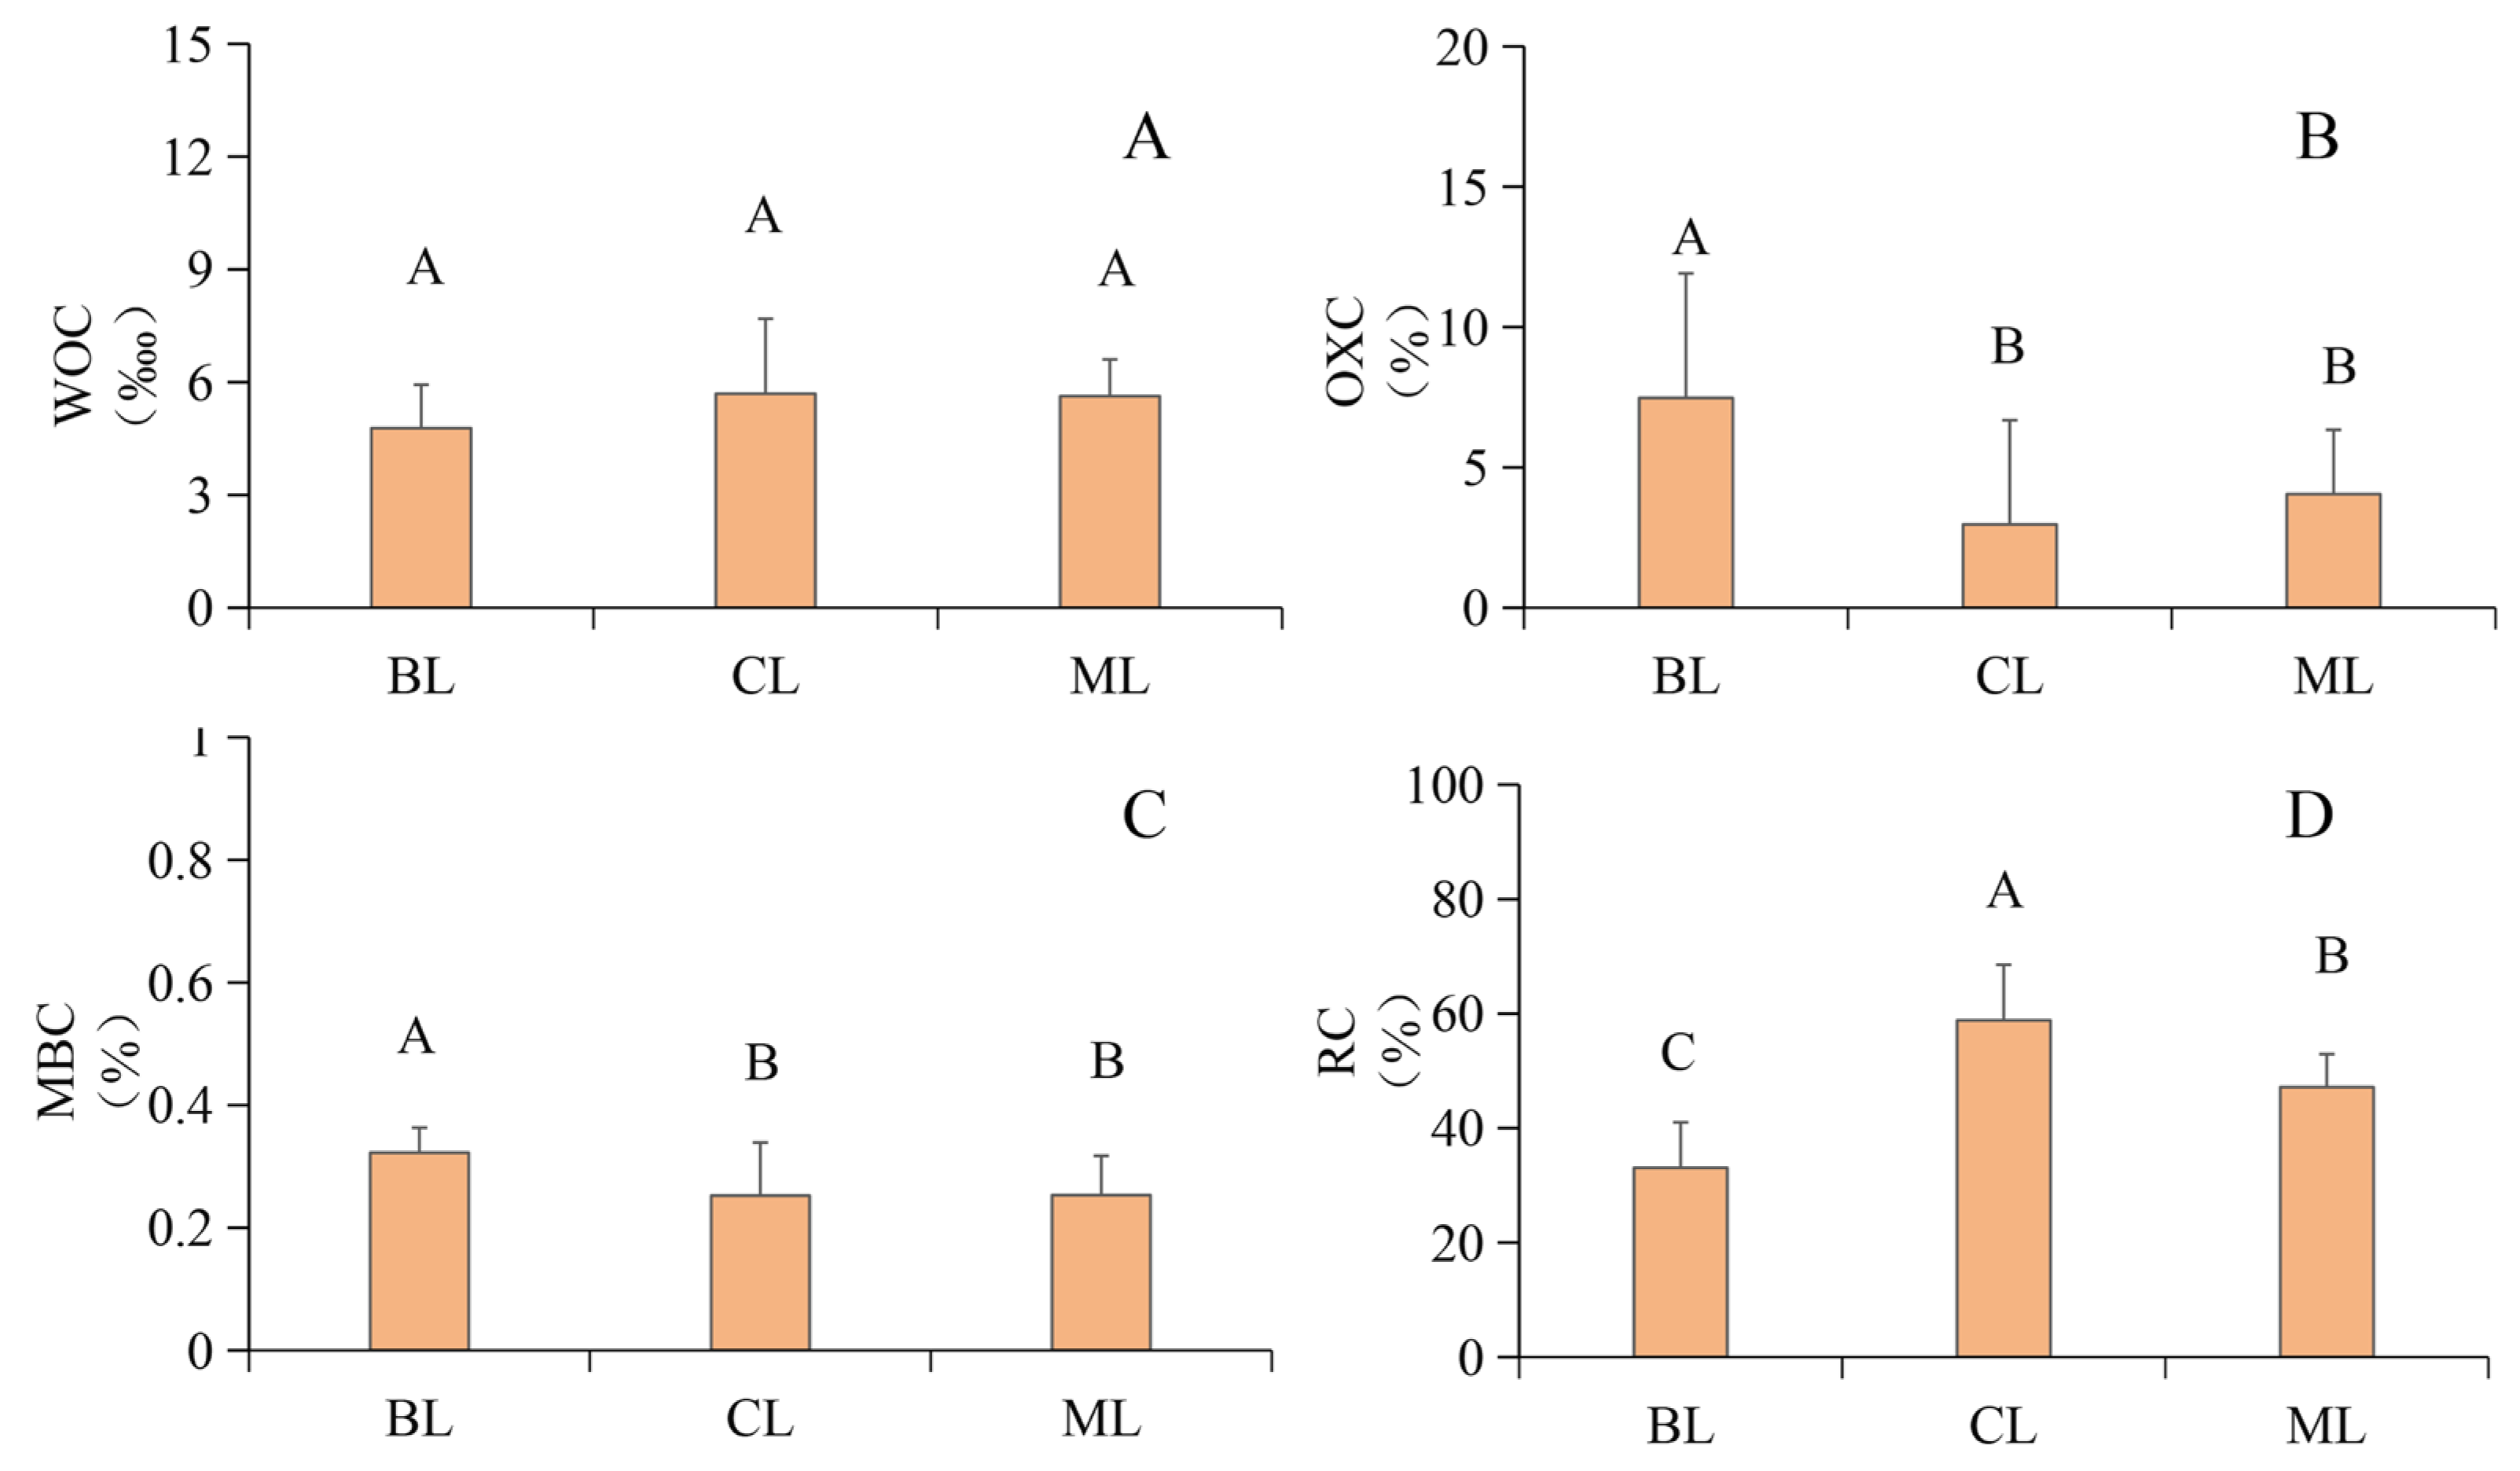
3.1. Soil SOC and Fractions

As shown in Figure 1, the variations in the contents and proportions of the different organic C fractions in the different forest stands were not consistent. One-way ANOVA revealed significant differences in the SOC, OXC, RC, and MBC contents among the different forest stands, while the WOC content did not significantly differ among the different forest stands (Table 2). Compared to the SOC content and storage of BL, those of the CL significantly decreased by 19.11% and 18.82%, respectively, while those of the ML significantly decreased by 12.81% and 20.16%, respectively (Figure 2). Compared with those in the BL treatment, the soil OXC contents in the CL and ML treatments significantly decreased by 65.63% and 52.15%, respectively, while the MBC content significantly increased by 37.31% and 31.75%, respectively (Figure 3B,C). The proportion of soil OXC in the SOC significantly decreased by 60.26% and 45.82%, while the proportion of soil MBC in the SOC significantly decreased by 21.68% and 21.45% in CL and ML, respectively (Figure 4B,C). Compared with that in the BL treatment, the RC content in the CL and ML treatments significantly increased by 44.38% and 24.12%, respectively, and the proportion of RC in the SOC treatment significantly increased by 77.97% and 42.69%, respectively (Figure 3D).

3.2. Carbon Pool Management Indices

One-way ANOVA revealed significant differences in the carbon pool management indices (LBOC, LI, CPI, and CPMI) among the different forest stands (Table 3). Compared with those in the BL, the soil LI in the CL and ML treatments significantly decreased by 78.53% and 66.52%, respectively; the CPI in the CL and ML significantly decreased by 19.11% and 12.81%, respectively; and the CPMI in the CL and ML significantly decreased by 82.29% and 70.93%, respectively (Table 3).

3.3. Soil Properties

Compared with that of the CL, the soil pH of the BL and ML significantly decreased by 6.62% and 4.51%, respectively (p < 0.01) (Table 4). The differences in the AP, TN, and MBN contents among the three typical forest stands were not significant. Compared with that in the CL, the soil TP in the BL and ML significantly decreased by 21.68% and 19.28%, respectively (p < 0.05). The difference in the soil C/N ratio among the three typical forest stands was not significant, but the C/P ratio of the BL significantly increased by 62.08% compared to that of the CL (p < 0.01). The soil Ca2+ content in the BL was significantly lower than that in the CL and ML (p < 0.01). There were significant differences in the activity of the three soil enzymes among the different forest stands. Compared with those in the BL, the soil APM activities in the CL and ML significantly decreased by 51.54% and 32.30%, respectively (p < 0.01), and the soil β-1,4-glucosidase (BG) activity significantly decreased by 21.52% and 14.23%, respectively (p < 0.05). The soil NAG activity significantly decreased by 34.14% and 9.22%, respectively (p < 0.01) (Table 4).

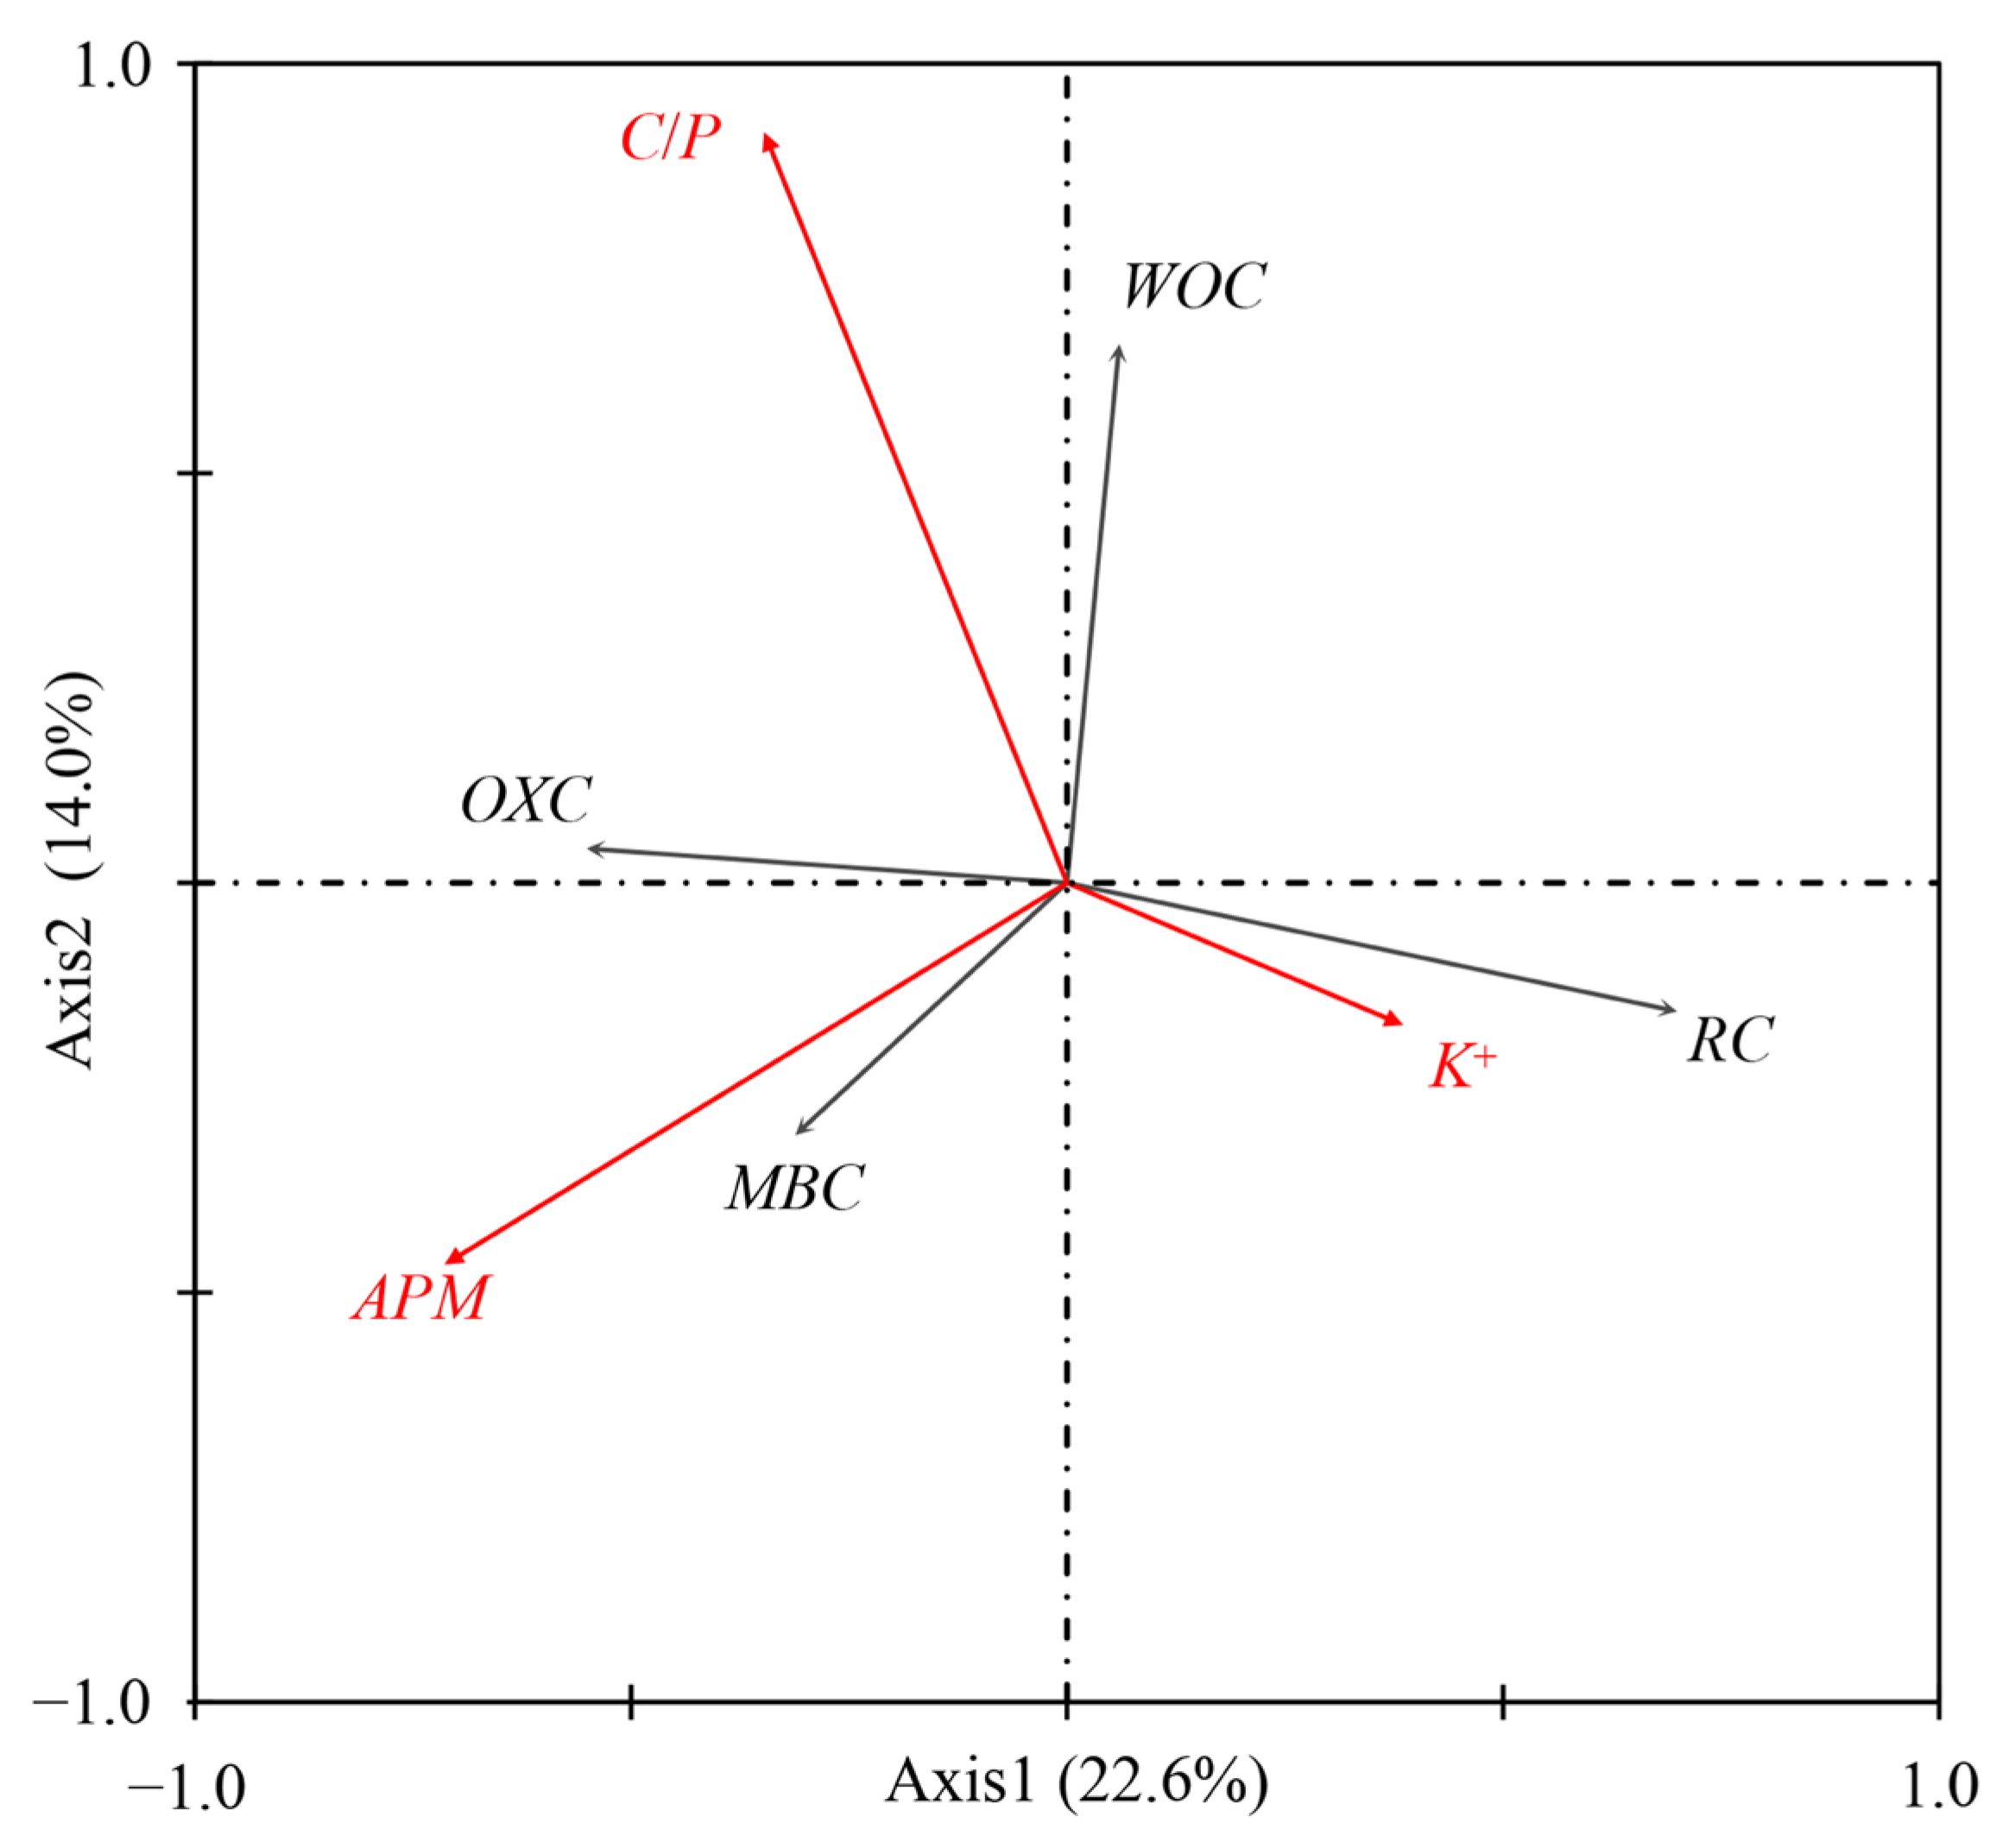
3.4. Correlation Analysis

The correlation analysis results showed that the SOC content was strongly significantly positively correlated with the soil C/N ratio and C/P ratio (p < 0.01) and extremely significantly negatively correlated with the soil Ca2+ content (p < 0.01) (Table 5). The content of soil WOC was significantly negatively correlated with the soil MBN, TN, and Mg2+ contents (p < 0.05), extremely significantly negatively correlated with TP (p < 0.01), and significantly positively correlated with the C/N ratio (p < 0.05). The content of soil OXC was extremely significantly negatively correlated with soil pH (p < 0.01), significantly positively correlated with the C/P ratio (p < 0.05), and extremely significantly positively correlated with soil APM and BG (p < 0.01). The soil MBC content was extremely significantly negatively correlated with the soil pH (p < 0.01), significantly negatively correlated with the soil Ca2+ (p < 0.05), and extremely significantly positively correlated with the soil APM and C/P ratio (p < 0.01). The soil RC content was significantly positively correlated with the MBN content (p < 0.05) and significantly negatively correlated with the soil AP content (p < 0.05) (Table 5).
The distributions of the SOC structure differed among the three typical forest stands based on the PCA of the SOC fraction data (Figure 5). The first principal component (PC1) explained 73.6%, and the second (PC2) explained 12.6% of the total variance (Figure 4). Before RDA, forward selection of 13 environmental factors was conducted using the Monte Carlo permutation test (p < 0.05). The results showed that the soil C/P ratio (p = 0.002), soil APM content (p = 0.002), and soil K+ content (p = 0.032) primarily influenced the SOC fractions (Figure 6). A total of 16.2%, 15.2%, and 5.5% of the variation in the SOC fractions could be explained by these three factors, respectively. The soil C/P ratio showed positive associations predominantly with the soil WOC and negative associations with the soil RC. The soil APM activity showed positive associations predominantly with the soil MBC. The soil K+ concentration showed positive associations predominantly with the soil RC content and negative associations with the soil OXC content (Figure 6).

4. Discussion

4.1. Variations in SOC Concentrations and Stocks

As one of the world’s major carbon sinks, SOC plays an important role in improving climate change by influencing soil nutrient status and forming soil structures, thereby balancing ecosystem functions [48,49]. The SOC pool typically receives carbon input from plant litter and underground root exudates and removes carbon losses caused by soil respiration, including autotrophic and heterotrophic processes and leaching, to achieve equilibrium [49,50]. Due to the accumulation and distribution of litter and fine plant roots on the surface of the soil, the surface soil has a relatively high total SOC content, and various microbial activities and geochemical processes are highly active [51,52]. The depth of the soil samples collected in this study ranged from 0–20 cm. The results of this study revealed significant differences in SOC concentration and storage among the different forest stands, with primary evergreen broad-leaved forest (BL) showing a significantly higher SOC concentration than Chinese fir plantation (CL) and secondary mixed coniferous and broad-leaved forest (ML) (Figure 2). Similarly, Liang et al. (2021) [22] and Pang et al. (2019) [53] reported similar results, and these differences may be attributed to the different inputs of surface residues (litter, humus, etc.) from different forest types to soil carbon. Compared with coniferous forest species communities, broad-leaved tree species communities have greater litter biomass and soil surface coverage, resulting in higher SOC concentrations; Chinese fir plantations are mainly composed of coniferous tree species, with low soil litter coverage and biomass, which may result in SOC loss due to soil erosion; mixed coniferous and broad-leaved forests have a certain proportion of coniferous tree species, with relatively less litter coverage than broad-leaved forests [53]. In addition, coniferous species have a higher C/N ratio in their litter, resulting in a slower decomposition rate compared to broad-leaved species, thereby enhancing the retention of C in the litter layer and reducing the amount of decayed litter entering the soil [22,53]. These differences collectively explain the order in which soil total SOC content and storage were arranged in different forest stands.

4.2. Variations in Soil LAC and NLAC Concentrations and Proportions

Although the proportion of labile SOC (LAC) fractions in SOC is relatively small, these fractions play an important role due to its easy mineralization and ability to be decomposed and utilized by microorganisms [54,55,56]. Analyzing the relative quantity of labile organic carbon pools in different ecosystems and exploring their distribution in the soils of different forest types can help researchers better understand the dynamic changes in SOC pools. Previous studies have shown that different types of ecosystems can significantly affect the stability of SOC and convert LAC into nonlabile SOC (NLAC) fractions [57]. Ahirwal et al. (2022) [58] also reported that land use and cover change significantly altered the stability and stock of SOC in natural forests. Among the six dominant forests, Quercus forests had a greater slow and stable carbon pool. The transformation between these organic carbon fractions can indicate changes in the storage and structure of SOC pools [59]. This study revealed significant differences in LAC among the different forest types (Table 2). Compared to those in the CL and ML, the concentrations and proportions of the 2 labile SOC fractions in the soil in the BL were greater (Figure 3 and Figure 4).
MBC, the most labile carbon fraction in the organic carbon pool, directly participates in soil carbon and nitrogen cycling in small quantities, reflecting the important production and consumer functions of microorganisms in ecosystems [60]. MBC changes in soil can express the impact of forest surface community conditions on soil biochemical characteristics [61]. Similar to the results of other studies, our study revealed that the MBC concentration in the BL was significantly greater than that in the CL and ML (Figure 3C). Overall, the concentration of available organic carbon in forest soils with more broad-leaved tree species was greater than that in coniferous forests [47,53]. Moreover, the proportion of MBC in the SOC of the BL was also greater than that in the CL and ML, indicating that the broad-leaved tree species represented by the BL might have accumulated more easily decomposable organic carbon compounds in the soil. In this study, the content and percentage of readily oxidizable carbon fractions in BL soil were the highest, indicating strong instability and activity, making it susceptible to efficient decomposition and utilization by microorganisms in the soil [62]. The higher yield, chemical properties (C/N), and decomposition rate of broad-leaved forest litter are beneficial for maintaining a higher OXC content [18], which is particularly beneficial for bacterial activity that tends to decompose simple carbon sources of litter [54,63,64], resulting in higher MBC fraction. In acidic soils in southern China, although the difference in AP among the three typical forest soils was not significant, the significantly higher APM of BL indicated that broad-leaved forest soil microorganisms have a significant advantage in phosphorus decomposition and utilization (Table 4), and the environment is more favorable for microorganisms. Higher microbial activity and metabolic function further enhance their mineralization of organic substrates, driving dynamic changes in unstable organic carbon pools [65,66]. The proportion of MBC relative to SOC can be used to measure the microbial carbon conversion efficiency and decomposition loss of the total carbon pool [67]. In our study, the proportion of MBC was less than 1%, which was lower than the results of other studies where MBC accounted for approximately 1–5% of the SOC content (Figure 4C) [68]. On the one hand, the sampling time was at the end of the growing season (October), and compared to those in the summer, when the temperature and humidity were suitable for soil microbial activity and reproduction, the metabolic rate and microbial biomass carbon accumulation were lower [69,70,71,72]. On the other hand, the research area was located in a typical acid rain area in southern China, with strong soil acidity (pH below 4.5) (Table 4). A lower pH inhibits microbial activity and function and has a significant impact on easily available organic carbon fractions [73,74]. The significant correlation between LAC and soil pH also indicated this (Table 5).
The OXC content is susceptible to climate conditions, surface vegetation, and soil properties, with rapid transition cycles [75]. Our research revealed significant differences in soil OXC among different forest stands; the content and proportion of OXC in the SOC of the BL were greater than those in the CL and ML (Figure 3 and Figure 4B). The soil of the primary evergreen broad-leaved forest representing broad-leaved tree species had a greater proportion and content of soil OXC, indicating that the SOC pool of the broad-leaved forest was more unstable than that of the coniferous forest, which was consistent with the research results of Yuan et al. (2022) [21] and Liang et al. (2021) [22]. The main reason for this difference was the differences in litter species and decomposition caused by the different tree species. Broad-leaved forests have higher yields, chemical qualities (C/N), and decomposition rates of litter [21], which is conducive to maintaining a greater OXC content. However, the higher C/N ratio and lower decomposition rate of litter in coniferous forests delayed the buffering of cations (such as Ca2+ and Mg2+) and increased the accumulation of organic acids [76], hindering bacterial activity [77,78], while the latter preferred to decompose simple broad-leaved tree litter carbon sources [54]. This is also illustrated by the significantly lower MBC observed in coniferous forests (Figure 3C). Previous studies have shown that the proportion of OXC in the SOC ranges from 5–30% [38], and the greater the proportion of soil OXC in the SOC is, the more active the SOC pool will be [79]. In our study, the proportion of OXC in the SOC ranged from 0.14% to 18.12% (Figure 3B), which was lower than that previously reported by Rudrappa et al. (2006) [80] and Yang et al. (2012) [47]. The reason for this observation is similar to that for the soil MBC fraction, as a lower soil pH results in a stronger oxidizing environment, inhibiting the accumulation of OXC.
In our study, the RC fraction also significantly differed among the different forest stands, and the proportion of RC in the SOC of the CL was the highest among all the forest types (Figure 3D). This may be due to the difference in the quality of SOC input between the litter of broad-leaved species and that of coniferous tree species. The litter of coniferous tree species represented by the CL contains relatively high levels of recalcitrant substances, including compounds such as lignin, acid, and tannins [53,81].
In addition, the WOC fraction in the soil carbon pool is involved in many soil biochemical processes that can indicate carbon availability in the soil microenvironment [55,56]. However, in this study, unlike the MBC and OXC fractions, the WOC fraction did not differ significantly among the different forest stands (Figure 3A). This may be due to climatic environmental conditions and soil characteristics. The WOC is mainly composed of different types of low molecular mass organic matter dissolved in soil solution and high molecular weight organic matter suspended in soil solution as colloids and is very sensitive. Different soil temperatures and moisture conditions can change its adsorption capacity on soil minerals and humus macromolecules, affecting the release and retention of WOC in soil [62]. In this study, the complex soil mineral characteristics and temperature and moisture conditions of three different typical forest stands may be the main factors leading to no significant differences in WOC fraction [56,80,81,82].

4.3. Variations in Soil CPMI

As an indicator reflecting the impact of different forest management measures on the dynamic changes in SOC, the CPMI can more comprehensively and sensitively identify changes in soil LAC than can direct indicators such as total SOC concentration or storage [35], providing indications of various practical measures affecting the potential of SOC stock and sequestration. The higher the CPMI is, the greater the accumulation of organic carbon [83,84], indicating that the system is being repaired, enhanced, and maintained [34]. In this study, the soil lability of C (LBOC) varied significantly among the different forest stands, decreasing in the order of BL > ML > CL (Table 3). The BL provides stronger physical protection for SOM by creating less oxidative environmental conditions and maintaining a greater percentage of soil LAC [32]. Similar to the findings of Wang’s (2005) [23] study, we found that the LI value of the soil in the BL treatment was significantly greater than that in the ML and CL treatments, indicating that the organic C pool in the soil in the BL was very active and converted rapidly [53]. Among the three different forest stands, the CPI and CPMI had significant differences and were arranged in the order of BL > ML > CL (Table 3), which indicates that the BL soil could store more SOC and LAC and had advantages in promoting natural forest renewal and ecological restoration management strategies.

4.4. Relationships between Soil C Fractions and Soil Properties

Correlation analysis revealed that the soil nutrient properties and stoichiometric ratio significantly affected the different SOC fractions (Table 5). The SOC of the soil in the study area was strongly correlated with both the C/N and C/P ratios (Table 5). Many studies have shown that the C/N and C/P ratios can affect the decomposition of organic matter and the absorption and utilization of soil nitrogen and phosphorus by microorganisms, affecting the metabolic function of microorganisms and driving dynamic changes in the SOC pool [65,66]. The readily oxidizable carbon (OXC) and microbial biomass carbon (MBC) content in the soil was significantly correlated with the soil pH (Table 5), indicating that pH was the main driving factor for the dynamic changes in labile C pools. Variations in pH can alter the soil microenvironment, significantly affecting microbial activity, function, and community composition [56,66] and altering substrate decomposition patterns, thus significantly impacting easily available and labile organic carbon pools [73,74]. In this study, there was a significant correlation between soil AP and the RC fraction (Table 5), as well as between the C/P ratio and APM activity with the contents of labile SOC fractions (OXC and MBC), indicating that the availability of soil phosphorus could limit the variations in organic C fractions. As the main nutrient for the growth and development of plants and microorganisms in forest ecosystems, phosphorus is generally scarce in the acidic soils of tropical forests in South China [85,86,87]. Acidified soil can stimulate the binding of soil active iron, active aluminum, and organic matter with phosphorus, producing iron and aluminum minerals that reduce the availability of soil phosphorus and affect the mineralization process of microbial organic substrates [88]. RDA showed that three indicators, namely, the soil C/P ratio, APM, and K+ content, significantly contributed to the overall distribution characteristics of the SOC fractions (Figure 6). These three main factors explained 36.9% of the variation in the SOC fraction contents. The significant contributions of the soil C/P ratio and APM activity to the SOC fraction contents further indicated that phosphorus availability could limit microbial function and the decomposition environment of organic carbon. Soil potassium can regulate the physiological functions of microorganisms; affect their growth and metabolic processes; maintain plant growth, enzyme synthesis and photosynthesis; control root growth; and regulate plant cell stomatal movement [89]. In our study, the soil K+ content had a significant impact on the changes in the organic C fractions, which has been less reported in other studies [10,53]. This may be due to the inhibitory effect of acidic soil in the study area on the activity of K-solubilizing bacteria, which affects the effectiveness of potassium and limits the utilization of soil potassium by plants and microorganisms [90].

5. Conclusions

Our research clearly indicated that different forest types under forest conversion significantly affected the concentration and storage of soil total SOC. The results of this study are basically consistent with the predictions we made. The transformation process from a BL to an ML or a CL changed the structure and stability of organic carbon by reducing the labile SOC fractions (MBC and OXC) and increasing the RC fraction in the soil. The soil in the BL had greater LI and CPMI values, indicating that compared with those in the ML and CL, the soil in the BL had greater carbon accumulation and activity, could store more labile organic carbon, and had more advantages in terms of the management strategy for promoting natural forest renewal and ecological restoration. Correlation analysis revealed that the soil LAC was significantly associated with soil pH and AP, and RDA revealed that the significant changes in SOC fractions were mainly driven by the soil C/P ratio and the APM and K+ contents. The availability of soil phosphorus in acidic soils of subtropical forest systems in South China is a key factor limiting variations in organic C fractions.

Supplementary Materials

The following supporting information can be downloaded at: https://www.mdpi.com/article/10.3390/f15081330/s1, raw data.

Author Contributions

Y.L. conceived and designed the study. F.H. and Y.H. revised and perfected the design of the experiments. Y.L., F.H., Y.H. and M.L. performed the experiments. Y.L. wrote the paper. M.L. and W.L. reviewed and edited the manuscript. All authors have read and agreed to the published version of the manuscript.

Funding

This study was funded by the “Guangzhou Science and Technology Project (SL2022A04J00991)”, “Guangdong Basic and Applied Basic Research Foundation (2023A1515110445)”, “Science and Technology Program from Forestry Administration of Guangdong Province” (2023KYXM09), and “Forestry Science and Technology Innovation Platform Operation Subsidy Project of China” (2022132250, 2023132061).

Data Availability Statement

The original contributions presented in the study are included in the Supplementary Materials, further inquiries can be directed to the corresponding author.

Conflicts of Interest

The authors declare no conflicts of interest.

Abbreviations

BL: primary evergreen broad-leaved forest; ML: secondary mixed coniferous and broad-leaved forest; CL: Chinese fir plantation; LAC: labile C fraction; NLAC: nonlabile carbon fraction; SOC: soil total organic carbon; MBC: microbial biomass carbon; OXC: readily oxidizable carbon; WOC: water-soluble organic carbon; RC: the recalcitrant carbon; CPMI: carbon pool management index; LI: lability index; CPI: carbon pool index; LBOC: lability of C; MBN: microbial biomass nitrogen; SWC: soil water content; TN: total N; TP: total P; AP: available P; BG: β-1,4-glucosidase; NAG: β-1,4-N-acetaminophen glucosidase; APM: acid phospho-monoesterase; PCA: principal component analysis; RDA: redundancy analysis.

References

  1. Peng, S.; Wang, B. Forest succession of Dinghushan, Guangdong, China. Chin. J. Bot. 1995, 7, 75–80. [Google Scholar]
  2. Fan, H.; Wu, J.; Liu, W.; Yuan, Y.; Hu, L.; Cai, Q. Linkages of plant and soil C: N: P stoichiometry and their relationships to forest growth in subtropical plantations. Plant Soil 2015, 392, 127–138. [Google Scholar] [CrossRef]
  3. Gong, C.; Wang, S.; Zeng, Z.; Ding, S.; Chen, J.; Long, K. Carbon storage and its distribution pattern of evergreen broad-leaved forests at different succession stages in mid-subtropical China. Chin. J. Ecol. 2011, 30, 1935–1941. [Google Scholar]
  4. Yarwood, S.A.; Högberg, M.N. Soil bacteria and archaea change rapidly in the first century of Fennoscandian boreal forest development. Soil Biol. Biochem. 2017, 114, 160–167. [Google Scholar] [CrossRef]
  5. Hu, Y.F.; Shu, X.Y.; He, J.; Zhang, Y.L.; Xiao, H.H.; Tang, X.Y.; Gu, Y.F.; Lan, T.; Xia, J.G.; Ling, J.; et al. Storage of C, N, and P affected by afforestation with Salix cupularis in an alpine semiarid desert ecosystem. Land Degrad. Dev. 2018, 29, 188–198. [Google Scholar] [CrossRef]
  6. Chu, X.; Zhan, J.; Li, Z.; Zhang, F.; Qi, W. Assessment on forest carbon sequestration in the Three-North Shelterbelt Program region, China. J. Clean. Prod. 2019, 215, 382–389. [Google Scholar] [CrossRef]
  7. Liao, C.; Tian, Q.; Wang, D.; Qu, L.; Wu, Y.; Liu, F. Effects of labile carbon addition on organic carbon mineralization and microbial growth strategies in subtropical forest soils. Chin. J. Appl. Ecol. 2016, 27, 2848–2854. [Google Scholar]
  8. Plaza-Bonilla, D.; Álvaro-Fuentes, J.; Cantero-Martínez, C. Identifying soil organic carbon fractions sensitive to agricultural management practices. Soil Tillage Res. 2014, 139, 19–22. [Google Scholar] [CrossRef]
  9. Duru, M.; Therond, O.; Martin, G.; Martin-Clouaire, R.; Magne, M.A.; Justes, E.; Journet, E.; Aubertot, J.; Savary, S.; Bergez, J.; et al. How to implement biodiversity-based agriculture to enhance ecosystem services: A review. Agron. Sustain. Dev. 2015, 35, 1259–1281. [Google Scholar] [CrossRef]
  10. Dong, X.; Zhao, K.; Wang, J.; Gui, H.; Xiao, Y.; Chen, Z.; Miao, Y.; Han, S. Effects of forest types on soil carbon content in aggregate faction under climate transition zone. Front. Environ. Sci. 2023, 10, 1052175. [Google Scholar] [CrossRef]
  11. Gao, F.; Cui, X.; Sang, Y.; Song, J. Changes in soil organic carbon and total nitrogen as affected by primary forest conversion. For. Ecol. Manag. 2020, 463, 118013. [Google Scholar] [CrossRef]
  12. Rytter, R.M. Afforestation of former agricultural land with Salicaceae species–initial effects on soil organic carbon, mineral nutrients, C: N and pH. For. Ecol. Manag. 2016, 363, 21–30. [Google Scholar] [CrossRef]
  13. Chen, Y.; Yu, S.; Liu, S.; Wang, X.; Zhang, Y.; Liu, T.; Zhou, L.; Zhang, W.; Fu, S. Reforestation makes a minor contribution to soil carbon accumulation in the short term: Evidence from four subtropical plantations. For. Ecol. Manag. 2017, 384, 400–405. [Google Scholar] [CrossRef]
  14. Haynes, R.J. Labile organic matter as an indicator of organic matter quality in arable and pastoral soils in New Zealand. Soil Biol. Biochem. 2000, 32, 211–219. [Google Scholar] [CrossRef]
  15. Manu, V.; Whitbread, A.; Blair, N.; Blair, G. Carbon status and structural stability of soils from differing land use systems in the Kingdom of Tonga. Soil Use Manag. 2014, 30, 517–523. [Google Scholar] [CrossRef]
  16. Yang, X.; Meng, J.; Lan, Y.; Chen, W.; Yang, T.; Yuan, J.; Liu, S.; Han, J. Effects of maize stover and its biochar on soil CO2 emissions and labile organic carbon fractions in Northeast China. Agric. Ecosyst. Environ. 2017, 240, 24–31. [Google Scholar] [CrossRef]
  17. Lepcha, N.T.; Devi, N.B. Effect of land use, season, and soil depth on soil microbial biomass carbon of Eastern Himalayas. Ecol. Process. 2020, 9, 1–14. [Google Scholar] [CrossRef]
  18. Karavanova, E.I.; Zolovkina, D.F. The effect of litter composition on the characteristics of their water-soluble organic matter. Mosc. Univ. Soil Sci. Bull. 2020, 75, 67–73. [Google Scholar] [CrossRef]
  19. Li, Y.; Chen, J.; Cui, J.; Zhao, X.; Zhang, T. Nutrient resorption in Caragana microphylla along a chronosequence of plantations: Implications for desertified land restoration in North China. Ecol. Eng. 2013, 53, 299–305. [Google Scholar] [CrossRef]
  20. Liu, S.; Zhang, W.; Wang, K.; Pan, F.; Yang, S.; Shu, S. Factors controlling accumulation of soil organic carbon along vegetation succession in a typical karst region in Southwest China. Sci. Total Environ. 2015, 521, 52–58. [Google Scholar] [CrossRef]
  21. Yuan, Z.; Jin, X.; Xiao, W.; Wang, L.; Sun, Y.; Guan, Q.; Meshack, A.O. Comparing soil organic carbon stock and fractions under natural secondary forest and Pinus massoniana plantation in subtropical China. Catena 2022, 212, 106092. [Google Scholar] [CrossRef]
  22. Liang, Q.; Wang, C.; Zhang, K.; Shi, S.; Guo, J.; Gao, F.; Liu, J.; Wang, J.; Liu, Y. The influence of tree species on soil organic carbon stability under three temperate forests in the Baihua Mountain Reserve, China. Glob. Ecol. Conserv. 2021, 26, e01454. [Google Scholar] [CrossRef]
  23. Wang, Q.K.; Wang, S.L.; Den, S.J. Comparative study on active soil organic matter in Chinese fir plantation and native broad-leaved forest in subtropical China. J. For. Res. 2005, 16, 23–26. [Google Scholar]
  24. Datta, A.; Basak, N.; Chaudhari, S.K.; Sharma, D.K. Soil properties and organic carbon distribution under different land uses in reclaimed sodic soils of North-West India. Geoderma Reg. 2015, 4, 134–146. [Google Scholar] [CrossRef]
  25. Chen, X.M.; Yan, J.H.; Lin, M.Z.; Zhu, G.W.; Wu, J.P.; Zhang, D.Q. Variations in the fractions and stabilization of soil organic carbon with forest succession in Southern China. Adv. Earth Sci. 2016, 31, 86–93. [Google Scholar]
  26. Zhang, X.Y.; Chen, X.M.; Wei, H.; Lin, M.Z. Effect of urbanization on soil organic carbon fractions and carbon pool management index in remnant evergreen broad-leaved forests of the PearRiver Delta. J. Soil Water Conserv. 2017, 31, 184–190. [Google Scholar]
  27. Eclesia, R.P.; Jobbagy, E.G.; Jackson, R.B.; Biganzoli, F.; Piñeiro, G. Shifts in soil organic carbon for plantation and pasture establishment in native forests and grasslands of South America. Glob. Chang. Biol. 2012, 18, 3237–3251. [Google Scholar] [CrossRef]
  28. Wang, F.; Zhu, W.; Chen, H. Changes of soil C stocks and stability after 70-year afforestation in the Northeast USA. Plant Soil 2016, 401, 319–329. [Google Scholar] [CrossRef]
  29. Lugato, E.; Lavallee, J.M.; Haddix, M.L.; Panagos, P.; Cotrufo, M.F. Different climate sensitivity of particulate and mineral-associated soil organic matter. Nat. Geosci. 2021, 14, 295–300. [Google Scholar] [CrossRef]
  30. Feyissa, A.; Raza, S.T.; Cheng, X. Soil carbon stabilization and potential stabilizing mechanisms along elevational gradients in alpine forest and grassland ecosystems of Southwest China. Catena 2023, 229, 107210. [Google Scholar] [CrossRef]
  31. Luo, X.; Zhang, R.; Zhang, L.; Frew, A.; Yu, H.; Hou, E.; Wen, D. Mechanisms of soil organic carbon stabilization and its response to conversion of primary natural broadleaf forests to secondary forests and plantation forests. Catena 2024, 240, 108021. [Google Scholar] [CrossRef]
  32. Sainepo, B.M.; Gachene, C.K.; Karuma, A. Assessment of soil organic carbon fractions and carbon management index under different land use types in Olesharo Catchment, Narok County, Kenya. Carbon Balance Manag. 2018, 13, 4. [Google Scholar] [CrossRef] [PubMed]
  33. Diekow, J.; Mielniczuk, J.; Knicker, H.; Bayer, C.; Dick, D.P.; Kögel-Knabner, I. Soil C and N stocks as affected by cropping systems and nitrogen fertilisation in a southern Brazil Acrisol managed under no-tillage for 17 years. Soil Tillage Res. 2005, 81, 87–95. [Google Scholar] [CrossRef]
  34. Chaudhary, S.; Dheri, G.S.; Brar, B.S. Long-term effects of NPK fertilizers and organic manures on carbon stabilization and management index under rice-wheat cropping system. Soil Tillage Res. 2017, 166, 59–66. [Google Scholar] [CrossRef]
  35. Huang, B.; Zhang, L.; Cao, Y.; Yang, Y.; Wang, P.; Li, Z.; Lin, Y. Effects of land-use type on soil organic carbon and carbon pool management index through arbuscular mycorrhizal fungi pathways. Glob. Ecol. Conserv. 2023, 43, e02432. [Google Scholar] [CrossRef]
  36. Liao, J.; Zhao, D. Forestry landscape patterns changes and dynamic simulation of Nanling National Nature Reserve, Guangdong. Sci. Geogr. Sin. 2014, 34, 1099–1107. [Google Scholar]
  37. Bao, S. Soil and Agricultural Chemistry Analysis, 3rd ed.; China Agriculture Press: Beijing, China, 2000. [Google Scholar]
  38. Blair, G.J.; Lefroy, R.D.; Lisle, L. Soil carbon fractions based on their degree of oxidation, and the development of a carbon management index for agricultural systems. Aust. J. Agric. Res. 1995, 46, 1459–1466. [Google Scholar] [CrossRef]
  39. Sun, X.; Niu, J.; Zhao, G. Effects of previous crop stubbles and nitrogen applied amount on summer maize yield and soil organic carbon pool at a semiarid loess site of China. Agric. Res. Arid Areas 2018, 36, 19–27. [Google Scholar]
  40. McGill, W.B.; Cannon, K.R.; Robertson, J.A.; Cook, F.D. Dynamics of soil microbial biomass and water-soluble organic C in Breton L after 50 years of cropping to two rotations. Can. J. Soil Sci. 1986, 66, 1–19. [Google Scholar] [CrossRef]
  41. Xiang, H.; Wen, D.; Zhang, L.; Li, J. Altitudinal changes in active and recalcitrant soil carbon pools of forests in the Dinghu Mountains. Acta Ecol. Sin. 2015, 35, 6089–6099. [Google Scholar]
  42. Lu, R. Analysis of Soil Nutrients, 3rd ed.; China Agriculture Press: Beijing, China, 2019. [Google Scholar]
  43. Qiu, Q.; Wu, J.; Liang, G.; Liu, J.; Chu, G.; Zhou, G.; Zhang, D. Effects of simulated acid rain on soil and soil solution chemistry in a monsoon evergreen broad-leaved forest in southern China. Environ. Monit. Assess. 2015, 187, 272. [Google Scholar] [CrossRef] [PubMed]
  44. Nannipieri, P.; Trasar-Cepeda, C.; Dick, R.P. Soil enzyme activity: A brief history and biochemistry as a basis for appropriate interpretations and meta-analysis. Biol. Fertil. Soils 2018, 54, 11–19. [Google Scholar] [CrossRef]
  45. Tabatabai, M.A.; Bremner, J.M. Use of p-nitrophenyl phosphate for assay of soil phosphatase activity. Soil Biol. Biochem. 1969, 1, 301–307. [Google Scholar] [CrossRef]
  46. Zhang, H.; Wu, P.B.; Fan, M.M.; Zheng, S.Y.; Wu, J.T.; Yang, X.H.; Zhang, M.; Yin, A.J.; Gao, C. Dynamics and driving factors of the organic carbon fractions in agricultural land reclaimed from coastal wetlands in eastern China. Ecol. Indic. 2018, 89, 639–647. [Google Scholar] [CrossRef]
  47. Yang, X.; Ren, W.; Sun, B.; Zhang, S. Effects of contrasting soil management regimes on total and labile soil organic carbon fractions in a loess soil in China. Geoderma 2012, 177, 49–56. [Google Scholar] [CrossRef]
  48. Qaswar, M.; Huang, J.; Ahmed, W.; Li, D.; Liu, S.; Zhang, L.; Cai, A.; Liu, L.; Xu, Y.; Gao, J.; et al. Yield sustainability, soil organic carbon sequestration and nutrients balance under long-term combined application of manure and inorganic fertilizers in acidic paddy soil. Soil Tillage Res. 2020, 198, 104569. [Google Scholar] [CrossRef]
  49. Benbi, D.K.; Brar, K.; Toor, A.S.; Singh, P. Total and labile pools of soil organic carbon in cultivated and undisturbed soils in northern India. Geoderma 2015, 237, 149–158. [Google Scholar] [CrossRef]
  50. Prescott, C.E.; Vesterdal, L. Decomposition and transformations along the continuum from litter to soil organic matter in forest soils. For. Ecol. Manag. 2021, 498, 119522. [Google Scholar] [CrossRef]
  51. Sun, T.; Wang, Y.; Hui, D.; Jing, X.; Feng, W. Soil properties rather than climate and ecosystem type control the vertical variations of soil organic carbon, microbial carbon, and microbial quotient. Soil Biol. Biochem. 2020, 148, 107905. [Google Scholar] [CrossRef]
  52. Huang, Y.Z.; Wang, S.Q.; Ye, S.M. Effects of Cunninghamia lanceolata stand types on the changes of aggregate-related organic carbon and nutrients in surface soil. J. Appl. Ecol. 2020, 31, 2857–2865. [Google Scholar]
  53. Pang, D.; Cui, M.; Liu, Y.; Wang, G.; Cao, J.; Wang, X.; Dan, X.; Zhou, J. Responses of soil labile organic carbon fractions and stocks to different vegetation restoration strategies in degraded karst ecosystems of southwest China. Ecol. Eng. 2019, 138, 391–402. [Google Scholar] [CrossRef]
  54. Zhang, Y.; Zou, J.; Meng, D.; Dang, S.; Zhou, J.; Osborne, B.; Ren, Y.; Liang, T.; Yu, K. Effect of soil microorganisms and labile C availability on soil respiration in response to litter inputs in forest ecosystems: A meta-analysis. Ecol. Evol. 2020, 10, 13602–13612. [Google Scholar] [CrossRef] [PubMed]
  55. Chen, Q.; Niu, B.; Hu, Y.; Luo, T.; Zhang, G. Warming and increased precipitation indirectly affect the composition and turnover of labile-fraction soil organic matter by directly affecting vegetation and microorganisms. Sci. Total Environ. 2020, 714, 136787. [Google Scholar] [CrossRef] [PubMed]
  56. Xu, C.Y.; Du, C.; Jian, J.S.; Hou, L.; Wang, Z.K.; Wang, Q.; Geng, Z.C. The interplay of labile organic carbon, enzyme activities and microbial communities of two forest soils across seasons. Sci. Rep. 2021, 11, 5002. [Google Scholar] [CrossRef] [PubMed]
  57. Six, J.; Feller, C.; Denef, K.; Ogle, S.M.; Moraes, S.C.J.; Albrecht, A. Soil organic matter, biota and aggregation in temperate and tropical soils—Effects of no-tillage. Agronomie 2002, 22, 755–775. [Google Scholar] [CrossRef]
  58. Ahirwal, J.; Gogoi, A.; Sahoo, U.K. Stability of soil organic carbon pools affected by land use and land cover changes in forests of eastern Himalayan region, India. Catena 2022, 215, 106308. [Google Scholar] [CrossRef]
  59. Yang, F.; Zhong, Y.; Han, G.; Li, X.; Luo, L.; Cai, X.; Long, X.; Li, T.; Huang, L. Effect of different vegetation restoration on soil organic carbon dynamics and fractions in the Rainy Zone of Western China. J. Environ. Manag. 2023, 331, 117296. [Google Scholar] [CrossRef] [PubMed]
  60. Jia, X.; Zhong, Y.; Liu, J.; Zhu, G.; Shangguan, Z.; Yan, W. Effects of nitrogen enrichment on soil microbial characteristics: From biomass to enzyme activities. Geoderma 2020, 366, 114256. [Google Scholar] [CrossRef]
  61. Powlson, D.S.; Prookes, P.C.; Christensen, B.T. Measurement of soil microbial biomass provides an early indication of changes in total soil organic matter due to straw incorporation. Soil Biol. Biochem. 1987, 19, 159–164. [Google Scholar] [CrossRef]
  62. Kaiser, K.; Kaupenjohann, M.; Zech, W. Sorption of dissolved organic carbon in soils: Effects of soil sample storage, soil-to-solution ratio, and temperature. Geoderma 2001, 99, 317–328. [Google Scholar] [CrossRef]
  63. Tian, Y.; Haibara, K.; Toda, H.; Ding, F.; Liu, Y.; Choi, D. Microbial biomass and activity along a natural pH gradient in forest soils in a karst region of the upper Yangtze River, China. J. For. Res. 2008, 13, 205–214. [Google Scholar] [CrossRef]
  64. Silva-Sánchez, A.; Soares, M.; Rousk, J. Testing the dependence of microbial growth and carbon use efficiency on nitrogen availability, pH, and organic matter quality. Soil Biol. Biochem. 2019, 134, 25–35. [Google Scholar] [CrossRef]
  65. Hessen, D.O.; Ågren, G.I.; Anderson, T.R.; Elser, J.J.; De Ruiter, P.C. Carbon sequestration in ecosystems: The role of stoichiometry. Ecology 2004, 85, 1179–1192. [Google Scholar] [CrossRef]
  66. Knorr, M.; Frey, S.D.; Curtis, P.S. Nitrogen additions and litter decomposition: A meta-analysis. Ecology 2005, 86, 3252–3257. [Google Scholar] [CrossRef]
  67. Jenkinson, D.S.; Ladd, J.N. Microbial biomass in soil: Measurement and turnover. Soil Biochem. 1981, 5, 415–471. [Google Scholar]
  68. Sparling, G.P. Ratio of microbial biomass carbon to soil organic carbon as a sensitive indicator of changes in soil organic matter. Soil Res. 1992, 30, 195–207. [Google Scholar] [CrossRef]
  69. Li, D.J.; Wen, L.; Zhang, W.; Yang, L.Q.; Xiao, K.C.; Chen, H.; Wang, K.L. Afforestation effects on soil organic carbon and nitrogen pools modulated by lithology. For. Ecol. Manag. 2017, 400, 85–92. [Google Scholar] [CrossRef]
  70. Li, Z.Q.; Zhao, B.Z.; Hao, X.Y.; Zhang, J.B. Effects of residue incorporation and plant growth on soil labile organic carbon and microbial function and community composition under two soil moisture levels. Environ. Sci. Pollut. Res. 2017, 24, 18849–18859. [Google Scholar] [CrossRef]
  71. Li, M.; Zhang, A.; Wu, H.; Liu, H.; Lv, J. Predicting potential release of dissolved organic matter from biochars derived from agricultural residues using fluorescence and ultraviolet absorbance. J. Hazard. Mater. 2017, 334, 86–92. [Google Scholar] [CrossRef]
  72. Sruthi, S.N.; Ramasamy, E.V. Enrichment of soil organic carbon by native earthworms in a patch of tropical soil, Kerala, India: First report. Sci. Rep. 2018, 8, 5784. [Google Scholar] [CrossRef]
  73. Ramírez, P.B.; Fuentes-Alburquenque, S.; Díez, B.; Vargas, I.; Bonilla, C.A. Soil microbial community responses to labile organic carbon fractions in relation to soil type and land use along a climate gradient. Soil Biol. Biochem. 2020, 141, 107692. [Google Scholar] [CrossRef]
  74. Tian, Q.; Jiang, Y.; Tang, Y.; Wu, Y.; Tang, Z.; Liu, F. Soil pH and organic carbon properties drive soil bacterial communities in surface and deep layers along an elevational gradient. Front. Microbiol. 2021, 12, 646124. [Google Scholar] [CrossRef] [PubMed]
  75. Badagliacca, G.; Romeo, M.; Lo Presti, E.; Gelsomino, A.; Monti, M. Factors governing total and permanganate oxidizable C pools in agricultural soils from southern Italy. Agriculture 2020, 10, 99. [Google Scholar] [CrossRef]
  76. Mueller, K.E.; Eissenstat, D.M.; Hobbie, S.E.; Oleksyn, J.; Jagodzinski, A.M.; Reich, P.B.; Chadwick, O.A.; Chorover, J. Tree species effects on coupled cycles of carbon, nitrogen, and acidity in mineral soils at a common garden experiment. Biogeochemistry 2012, 111, 601–614. [Google Scholar] [CrossRef]
  77. Li, Z.W.; Nie, X.D.; Chen, X.L.; Lu, Y.M.; Jiang, W.G.; Zeng, G.M. The effects of land use and landscape position on labile organic carbon and carbon management index in red soil hilly region, southern China. J. Mt. Sci. 2015, 12, 626–636. [Google Scholar] [CrossRef]
  78. Rudrappa, L.; Purakayastha, T.J.; Singh, D.; Bhadraray, S. Long-term manuring and fertilization effects on soil organic carbon pools in a Typic Haplustept of semi-arid sub-tropical India. Soil Tillage Res. 2006, 88, 180–192. [Google Scholar] [CrossRef]
  79. Huang, Z.; Xu, X.; Zhang, H.; Cai, B.; Li, L. Advances in effects of root input on forest soil carbon pool and carbon cycle. J. Nanjing For. Univ. (Nat. Sci. Ed.) 2022, 46, 25–32. [Google Scholar]
  80. Bowering, K.L.; Edwards, K.A.; Wiersma, Y.F.; Billings, S.A.; Warren, J.; Skinner, A.; Ziegler, S.E. Dissolved organic carbon mobilization across a climate transect of mesic boreal forests is explained by air temperature and snowpack duration. Ecosystems 2023, 26, 55–71. [Google Scholar] [CrossRef]
  81. Bhattacharyya, R.; Das, T.K.; Sudhishri, S.; Dudwal, B.; Sharma, A.R.; Bhatia, A.; Singh, G. Conservation agriculture effects on soil organic carbon accumulation and crop productivity under a rice–wheat cropping system in the western Indo-Gangetic Plains. Eur. J. Agron. 2015, 70, 11–21. [Google Scholar] [CrossRef]
  82. Wang, Z.; Ren, J.; Xu, C.; Geng, Z.; Du, X.; Li, Y. Characteristics of water extractable organic carbon fractions in the soil profiles of Picea asperata and Betula albosinensis forests. J. Soils Sediments 2021, 21, 3580–3589. [Google Scholar] [CrossRef]
  83. Dai, W.; Gao, H.; Sha, Z.; Penttinen, P.; Fang, K.; Wang, J.; Cao, L. Changes in soil organic carbon fractions in response to wheat straw incorporation in a subtropical paddy field in China. J. Plant Nutr. Soil Sci. 2021, 184, 198–207. [Google Scholar] [CrossRef]
  84. Zhang, G.; Zhao, J.; Song, X.; Liu, H.; Zhang, R.; Ji, Y.; Yang, D. Effects of fertilization on soil organic carbon and carbon pool management index. J. Plant Nutr. Fertil. 2012, 18, 359–365. [Google Scholar]
  85. Li, Y.; Wang, Y.; Zhang, W. Impact of simulated acid rain on the composition of soil microbial communities and soil respiration in typical subtropical forests in Southwest China. Ecotoxicol. Environ. Saf. 2021, 215, 112152. [Google Scholar] [CrossRef] [PubMed]
  86. Amarh, F.; Voegborlo, R.B.; Essuman, E.K.; Agorku, E.S.; Tettey, C.O.; Kortei, N.K. Effects of soil depth and characteristics on phosphorus adsorption isotherms of different land utilization types: Phosphorus adsorption isotherms of soil. Soil Tillage Res. 2021, 213, 105139. [Google Scholar] [CrossRef]
  87. Li, L. Distribution Pattern and Influencing Factors of Total Phosphorus in Natural Forests and Plantation Forests in China. Ph.D. Thesis, Nanjing University of Information Science & Technology, Nanjing, China, 2023. [Google Scholar]
  88. Zhang, H.; Shi, L.; Lu, H.; Shao, Y.; Liu, S.; Fu, S. Drought promotes soil phosphorus transformation and reduces phosphorus bioavailability in a temperate forest. Sci. Total Environ. 2020, 732, 139295. [Google Scholar] [CrossRef]
  89. Read, J.J.; Reddy, K.R.; Jenkins, J.N. Yield and fiber quality of upland cotton as influenced by nitrogen and potassium nutrition. Eur. J. Agron. 2006, 24, 282–290. [Google Scholar] [CrossRef]
  90. Uroz, S.; Calvaruso, C.; Turpault, M.P.; Frey-Klett, P. Mineral weathering by bacteria: Ecology, actors and mechanisms. Trends Microbiol. 2009, 17, 378–387. [Google Scholar] [CrossRef]
Figure 1. The location of sampling sites in the Nanling Nature Reserve.
Forests 15 01330 g001
Figure 2. Variations in soil total organic C (SOC) content and storage in different forest stands. SOC indicates the soil total organic carbon content, and SOS indicates the soil total organic carbon storage. Vertical bars represent standard errors (n = 12). Different uppercase and lowercase letters indicate significant differences between different forest stands in SOC contents and stocks, respectively (p < 0.05).
Forests 15 01330 g002
Figure 3. Variations in soil water-soluble organic carbon content (WOC-(A)), readily oxidizable carbon content (OXC-(B)), microbial biomass carbon content (MBC-(C)), and recalcitrant carbon content (RC-(D)) in different forest stands. Vertical bars represent standard errors (n = 12). Different letters indicate significant differences between different forest stands (p < 0.05).
Forests 15 01330 g003
Figure 4. Variations in the soil WOC proportion (A), OXC proportion (B), MBC proportion (C), and RC proportion (D) in the different forest stands. Vertical bars represent standard errors (n = 12). Different letters indicate significant differences between different forest stands (p < 0.05).
Forests 15 01330 g004
Figure 5. Principal component analysis (PCA) of SOC fractions in different forest stands.
Forests 15 01330 g005
Figure 6. Redundancy analysis of the SOC fractions and environmental factors. Only the environmental factors that were significantly related to the SOC fractions are shown. The red and black lines represent the environmental factors and organic carbon fraction signatures, respectively.
Forests 15 01330 g006
Table 1. Basic characteristics of the forest stands.
Site Factor Forest Stand CharacteristicsMajor Tree Species
Altitude/mSlope
/(°)
AspectForest TypesOriginCoordinatesCanopy DensityStand Density
/Trees·hm−2
Mean Diameter at Breast Height
/cm
Mean Tree Height
/m
126532Southwestbroad-leaved forestsNatural113°1′57.73″ E, 24°53′24.53″ N0.8861495.635.88Rhododendron ovatum (12.8%), Pentaphylax euryoides (12.1%), Rhododendron moulmainense (5.9%), Castanopsis eyrei (5.4%), Schima superba (2.5%), etc.
105831Northwestconiferous broad-leaved mixed forestsSecondary113°1′6.01″ E, 24°52′59.88″ N0.8774084.625.10Litsea elongata (8.5%), Adinandra bockiana var. Acutifolia (6.1%), Rhododendron moulmainense (8.1%), Cunninghamia lanceolata (15.5%), etc.
86930SouthwestChinese fir plantationsPlantation113°2′56.99″ E, 24°52′59.88″ N0.8267396.145.08Cunninghamia lanceolata (72.6%), Eurya acuminatissima (11.7%)
Table 2. One-way ANOVA of the effect of forest stands (FS) on total soil organic C (SOC), water soluble organic carbon (WOC), oxidizable C (OXC), microbial biomass C (MBC), and recalcitrant carbon (RC) (n = 12). SS: sum of squares; MS: mean of squares.
VariableSourceSSdfMSF-Ratiop
SOC contentFS2044.0821022.047.77<0.01
Error4338.5433131.47
SOC storageFS5873.5522936.773.680.04
Error26,336.1533798.07
WOC contentFS53.12226.560.190.83
Error4628.2433140.25
OXC contentFS136.46268.237.17<0.01
Error314.13339.52
MBC contentFS89,690.54244,845.2713.81<0.001
Error107,153.37333247.07
RC contentFS1160.102580.057.67<0.01
Error2495.663375.63
WOC proportionFS6.2523.131.370.27
Error75.31332.28
OXC proportionFS129.16264.584.590.02
Error464.263314.07
MBC proportionFS3999.0821999.5428.86<0.001
Error2286.173369.28
IOC proportionFS0.0420.024.000.03
Error0.16330.01
FS indicates a forest stand (BL, CL, and ML).
Table 3. Lability of C (LBOC), lability index (LI), carbon pool index (CPI), and carbon pool management index (CPMI) of different forest stands. The data are presented as the means ± standard errors.
VariablesBroad-Leaved Evergreen Forest
(BL)
Artificial Chinese Fir Forest
(CL)
Mixed Coniferous and
Broad-Leaved Forest
(ML)
LBOC0.25
±0.18 a
0.05
±0.07 b
0.08
±0.05 b
LI7.91
±5.70 a
1.70
±2.07 b
2.65
±1.60 b
CPI1.48
±0.21 a
1.20
±0.13 b
1.29
±0.16 ab
CPMI1161.80
±932.91 a
205.76
±247.39 b
337.74
±202.35 b
Values followed by different letters are significantly different between different forest stands (p < 0.05).
Table 4. Soil properties of different forest stands. The data are presented as the means ± standard errors.
VariablesBroad-Leaved Evergreen Forest
(BL)
Artificial Chinese Fir Forest
(CL)
Mixed Coniferous and
Broad-Leaved Forest
(ML)
pH4.17 ± 0.24 b4.47 ± 0.14 a4.27 ± 0.14 b
microbial biomass nitrogen (MBN)
(mg/kg)
42.55 ± 17.86 a59.41 ± 18.15 a49.91 ± 13.75 a
acid phospho-monoesterase (APM)
(μmol·g−1 dry·soil h−1)
17.90 ± 8.18 a8.67 ± 1.79 b12.11 ± 2.33 b
β-1,4-glucosidase (BG)
(μmol·g−1 dry·soil h−1)
0.49 ± 0.10 a0.38 ± 0.09 b0.42 ± 0.08 ab
β-1,4-N-acetaminophen glucosidase (NAG)
(μmol·g−1 dry·soil h−1)
0.24 ± 0.04 a0.16 ± 0.05 b0.21 ± 0.02 a
available P (AP)
(mg/kg)
0.80 ± 0.20 a0.71 ± 0.19 a0.76 ± 0.13 a
total N (TN)
(g/kg)
3.45 ± 1.33 a3.08 ± 0.59 a3.58 ± 0.59 a
total P (TP)
(g/kg)
0.11 ± 0.03 b0.13 ± 0.03 a0.11 ± 0.02 b
C/N31.69 ± 12.02 a25.86 ± 6.15 a24.13 ± 6.68 a
C/P978.24 ± 316.28 a603.56 ± 143.24 b790.98 ± 179.23 ab
K+
(mg/kg)
61.02 ± 15.91 a70.99 ± 12.26 a74.01 ± 9.71 a
Ca2+
(mg/kg)
18.40 ± 8.42 b47.22 ± 24.85 a33.72 ± 10.73 a
Mg2+
(mg/kg)
16.09 ± 5.37 a15.31 ± 2.89 a13.74 ± 2.36 a
Values followed by different letters are significantly different between different forest stands (p < 0.05).
Table 5. Correlations between soil properties, enzyme activities, exchangeable cations, and stoichiometric ratios and SOC fraction contents.
VariablesSOCWOCOXCRCMBC
rp Valuerp Valuerp Valuerp Valuerp Value
pH−0.320.06−0.030.84−0.446 **<0.010.300.07−0.45 **<0.01
MBN0.030.87−0.41 *<0.05−0.150.380.34 *<0.05−0.060.74
APM0.270.11−0.150.400.488 **<0.01−0.290.090.46 **<0.01
BG0.300.07−0.270.120.438 **<0.01−0.100.580.330.05
NAG0.330.05−0.150.380.310.07−0.230.180.230.18
AP0.000.990.190.260.280.10−0.37 *<0.050.110.53
TN−0.010.96−0.35 *<0.050.190.260.080.640.130.46
TP−0.160.35−0.51 **<0.001−0.270.110.300.08−0.220.19
C/N0.51 **<0.010.36 *0.0290.060.73−0.020.930.240.16
C/P0.63 **<0.010.320.060.355 *<0.05−0.130.470.46 **<0.01
K+−0.050.76−0.220.21−0.110.510.290.09−0.200.23
Ca2+−0.49 **<0.01−0.010.97−0.290.090.050.78−0.33 *<0.05
Mg2+0.160.36−0.38 *<0.050.170.340.010.970.190.26
Dark-colored markers represent highly significant correlations. Light-colored markers represent significant correlations. * p < 0.05. ** p < 0.01.
Disclaimer/Publisher’s Note: The statements, opinions and data contained in all publications are solely those of the individual author(s) and contributor(s) and not of MDPI and/or the editor(s). MDPI and/or the editor(s) disclaim responsibility for any injury to people or property resulting from any ideas, methods, instructions or products referred to in the content.

