Article

Natural Factors Rather Than Anthropogenic Factors Control the Greenness Pattern of the Stable Tropical Forests on Hainan Island during 2000–2019

1
School of Ecology, Hainan University, Haikou 570228, China
2
Center for Eco-Environmental Restoration Engineering of Hainan Province, Haikou 570228, China
3
Key Laboratory of Agro-Forestry Environmental Processes and Ecological Regulation of Hainan Province, Haikou 570228, China
*
Author to whom correspondence should be addressed.
Forests 2024, 15(8), 1334; https://doi.org/10.3390/f15081334
Submission received: 20 June 2024 / Revised: 13 July 2024 / Accepted: 29 July 2024 / Published: 1 August 2024
(This article belongs to the Special Issue Forest and Climate Change Adaptation)

Abstract

:
Vegetation, being a core component of ecosystems, is known to be influenced by natural and anthropogenic factors. This study used the annual mean Normalized Difference Vegetation Index (NDVI) as the vegetation greenness indicator. The variation in NDVI on Hainan Island was analyzed using the Theil–Sen median trend analysis and Mann–Kendall test during 2000–2019. The influence of natural and anthropogenic factors on the driving mechanism of the spatial pattern of NDVI was explored by the Multiscale Weighted Regression (MGWR) model. Additionally, we employed the Boosted Regression Tree (BRT) model to explore their contribution to NDVI. Then, the MGWR model was utilized to predict future greenness patterns based on precipitation and temperature data from different Shared Socioeconomic Pathway (SSP) scenarios for the period 2021–2100. The results showed that: (1) the NDVI of Hainan Island forests significantly increased from 2000 to 2019, with an average increase rate of 0.0026/year. (2) the R2 of the MGWR model was 0.93, which is more effective than the OLS model (R2 = 0.42) in explaining the spatial relationship. The spatial regression coefficients of the NDVI with temperature ranged from −10.05 to 0.8 (p < 0.05). Similarly, the coefficients of Gross Domestic Product (GDP) with the NDVI varied between −5.98 and 3.28 (p < 0.05); (3) The natural factors played the most dominant role in influencing vegetation activities as a result of the relative contributions of 83.2% of forest NDVI changes (16.8% contributed by anthropogenic activities). (4) under SSP119, SSP245, and SSP585 from 2021 to 2100, the NDVI is projected to have an overall decreasing pattern under all scenarios. This study reveals the trend of greenness change and the spatial relationship with natural and anthropogenic factors, which can guide the medium and long-term dynamic monitoring and evaluation of tropical forests on Hainan Island.

1. Introduction

The dynamics of forest greenness is an important indicator for material cycles and energy flows in terrestrial ecosystems [1,2]. The drivers of vegetation greening/browning can be categorized into either natural factors or human activities [3]. Climate change significantly impacts regional vegetation dynamics, and extreme weather events greatly affect vegetation greenness [4]. The trend in vegetation greenness is particularly important for monitoring ecosystems and modeling the feedback mechanisms of vegetation to climate change [5]. When describing the vegetation status, the Normalized Difference Vegetation Index (NDVI) is an effective indicator for illustrating the spatiotemporal dynamics of vegetation and its response to global change [6,7]. Compared with other vegetation indices, NDVI values are constrained to the range of −1 to 1, which prevents the inconvenience of dealing with excessively large or small data. The magnitude of the NDVI is usually employed to characterize vegetation status [8,9], and trend analysis of the NDVI can be used to assess the long-term status of vegetation greenness. Time series NDVI acquired through remote sensing exhibit a seasonal signal of vegetation growth, but traditional linear methods cannot accurately analyze the spatial pattern of NDVI trends [10,11]. Currently, non-parametric statistical trend analysis methods and trend testing methods such as Theil–Sen median trend analysis and Mann–Kendall test were employed for NDVI change analysis [12,13]. These methods do not require linearization of the trend and are not affected by missing values or outliers [14]. The spatiotemporal evolution trends of the NDVI can be accurately identified, and the drivers of vegetation change can be understood using these methods.
The response of greenness patterns to natural and anthropogenic factors exhibits significant regional differences [15,16,17]. The impact of anthropogenic activities on greenness pattern changes is multifaceted and complex [18,19]. These effects are difficult to quantify because of a lack of temporal gradient data that reflect the intensification of human activities [20,21]. Tropical forests cover 10% of the global land surface [22,23], and their diverse species and complex structure significantly influence nutrient cycling, climate regulation, and global carbon balance [24,25,26,27,28]. Previous studies have focused on connecting NDVI with natural factors, ignoring the bias caused by different spatial locations and uncertainty in climate data, which may affect our ability to accurately grasp the link between natural factors (climate change) and the NDVI [29,30]. Additionally, anthropogenic activities such as social development and urban expansion inevitably impact native grassland and forest ecosystems [31,32]. In this paper, we utilized land use data from Hainan Island over the last 20 years to identify and extract stable forested areas, encompassing all forested lands during this period. Moreover, it is essential to account for spatial autocorrelations and spatial non-stationary relationships with natural factors and anthropogenic factors, exploring the drivers for the spatiotemporal pattern of forest NDVI.
Existing studies on the driving mechanisms of greenness pattern variation tend to overlook the non-stationary effects in the temporal dimension, which raises the question of how to represent better the spatiotemporal response of NDVI trends to their driving factors [33,34,35]. Given the temporal and spatial changes, there exists a general spatiotemporal heterogeneity in NDVI changes and changes in interaction effects [36]. The Geographically Weighted Regression (GWR) method, rooted in the first law of geography, accounts for the heterogeneous or non-stationary nature of spatial relationships [37]. It is widely employed to explore the primary drivers of regional NDVI trends [38,39]. GWR intuitively captures non-stationary geographic relationships and can adjust spatial estimation parameters for various independent variables compared with ordinary least squares (OLS) regression [40,41]. While GWR applies the same optimal bandwidth for each explanatory variable, different variables operate at varying scales. Multiscale Geographically Weighted Regression (MGWR) models address this by adapting optimal bandwidths for each variable, enhancing model performance, highlighting the importance of explanatory variables [42], and better reflecting the spatial non-stationarity and scale effect of driving factors [41]. This study employs nonlinear trend analysis and MGWR to assess the spatial trend changes in forest NDVI amidst the spatial heterogeneity of natural factors on Hainan Island, offering insights applicable to global tropical forest studies. Therefore, exploring the spatial–temporal greenness pattern dynamics and their relationships with natural and anthropogenic factors on Hainan Island is essential for better understanding the mechanisms driving greenness pattern changes and can provide more detailed scientific support for environmental sustainability and agricultural production management.
Natural and anthropogenic factors are expected to alter patterns of vegetation drastically [43,44]. However, the dominant controlling factors and degree of nonlinear influence are not yet clear, particularly in tropical forests [45]. Boosted Regression Tree (BRT) is a machine learning algorithm that utilizes multiple regression tree boosting techniques [46]. It is considered to be an effective method for identifying the importance of drivers [47]. This study utilized trend analysis, combined with modeling techniques such as MGWR in conjunction with BRT, to identify and quantify the contributions, nonlinear response thresholds as well as the spatial heterogeneity of natural and anthropogenic factors to NDVI on Hainan Island from 2000 to 2019. The objectives of this study were to (1) use trend analysis to reveal the spatiotemporal variation trend in the greenness pattern during 2000–2019; (2) analyze the spatial heterogeneity in the dominant drivers that affect the greenness pattern using MGWR; (3) identify the main controlling factors that influence greenness pattern and nonlinear responses of the greenness pattern to the main natural and anthropogenic factors based on BRT; (4) predict the spatial and temporal heterogeneity in greenness patterns under different Shared Socioeconomic Pathway (SSP) scenarios.

2. Materials and Methods

2.1. Study Area

Hainan Island is the largest tropical region in China (between 18°10′~20°10′ N and 108°37′~111°03′ E) (Figure 1). It is located on the northern edge of the tropics with a tropical island monsoon climate, characterized by a dry season from November to April and a rainy season from May to October [48]. The annual average temperature ranges from 22.5 to 25.6 °C, and the annual average precipitation ranges from 900 to 2500 mm. The island’s terrain is low along the coast and rises towards the center, forming a domed mountainous terrain with a gradient structure resembling a ring-shaped stratified landform. The vegetation on Hainan Island primarily consists of forests, tropical rainforests, seasonal rainforests, and montane rainforests found in the central and eastern regions. Deciduous monsoon rainforests are prevalent in the western regions, while semi-evergreen monsoon rainforests dominate the northern areas. Mangrove forests line the coastline, and other regions host abundant tropical economic forests such as rubber plantations [49].

2.2. Data Sources and Pre-Processing

2.2.1. Dataset

NASA MOD13A3 NDVI data, with a spatial resolution of 1 km, were utilized in this study (https://search.earthdata.nasa.gov/search (accessed on 21 May 2023)) [50]. We compared three types of NDVI datasets: Moderate Resolution Imaging Spectroradiometer (MODIS), Satellite Pour l’Observation de la Terre (SPOT), and Global Inventory Modeling and Mapping Studies (GIMMS). These datasets showed similar general temporal trends, though some variations were observed in the outliers. Regression analysis revealed a strong correlation between MODIS NDVI and SPOT NDVI (R2 = 0.75, p < 0.01) (Figure 2). The correlation between MODIS NDVI and GIMMS NDVI was lower at R2 = 0.37 (p < 0.01). Previous studies have indicated that GIMMS NDVI values tend to be higher compared with other datasets [51]. MODIS NDVI serves as a widely adopted medium-resolution remote sensing monitoring product. Data preprocessing involved using the MODIS Reprojection Tool for batch mosaic, projection, band extraction, and format conversion. To mitigate the influence of bare soil, water bodies, and sparse vegetation, areas with NDVI values below 0.1 were excluded from annual NDVI calculations using the Maximum Value Composite (MVC) method [52]. The explanatory variables considered for NDVI analysis included temperature (TEM), precipitation (PRE), Gross Domestic Product (GDP), population (POP), photosynthetically active radiation (PAR), and soil moisture (SM) (Table 1).
Monthly precipitation and average temperature data from 2021 to 2100 were provided by the Tibetan Plateau Science Data Center (https://data.tpdc.ac.cn/ (accessed on 1 July 2024)) with a 1 km spatial resolution. They were used to predict the spatial distribution of NDVI under future climate scenarios. These data are derived from the global >100 km climate model datasets released by the sixth phase of the Coupled Model Intercomparison Project (CMIP6) and the global high-resolution climate datasets released by WorldClim. They were downscaled in China using the delta spatial downscaling scheme. These data utilize the latest SSP scenarios (SSP119, SSP245, SSP585) from the IPCC. This study used the EC-Earth3 data for SSP119, SSP245, and SSP585 scenarios. Monthly precipitation and average temperature data were first used to obtain annual precipitation and average temperature data, which were then synthesized into annual averages for 2021–2100. These averages served as inputs for the MGWR predictive model.

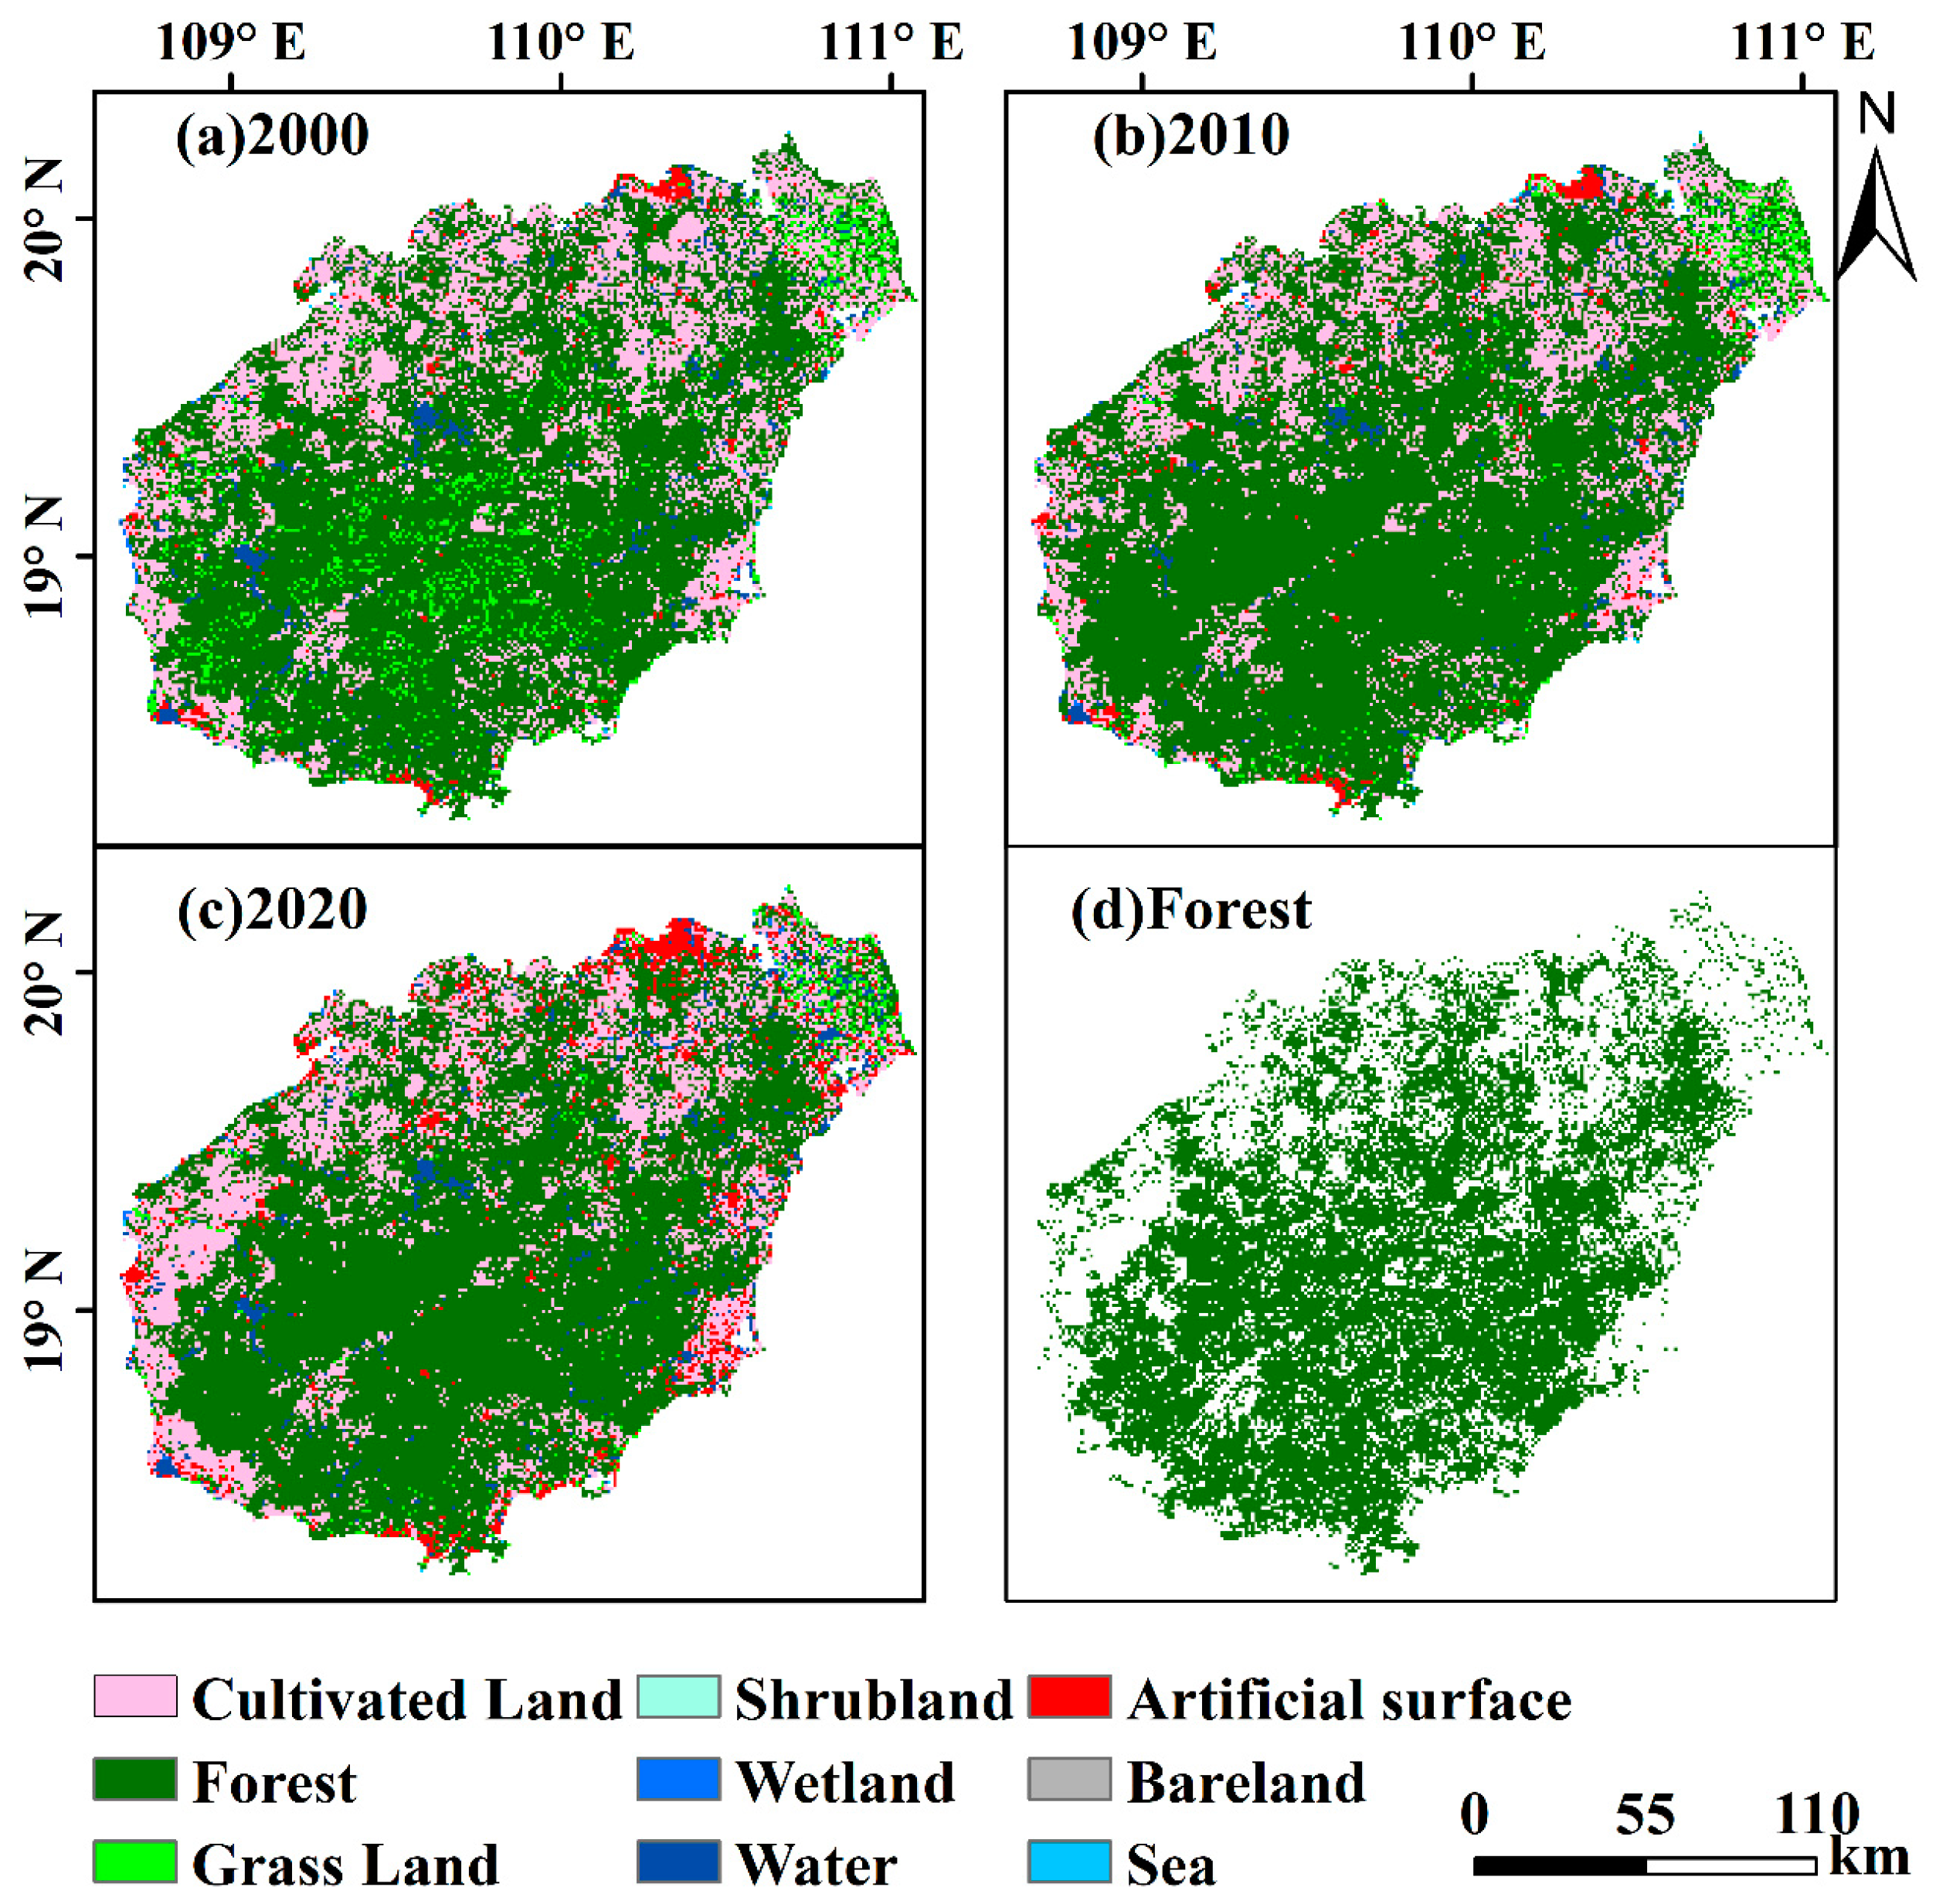
2.2.2. Land Use Data

The land use dataset used in this study was obtained from GlobalLand30, a worldwide land cover dataset with a 30-meter spatial resolution created in China (http://www.globallandcover.com (accessed on 8 May 2021)). The total accuracy of GlobeLand30 is greater than 83%. Following the extraction of Hainan Island’s land use data, forested land was identified as the predominant land cover type. The total area of forested land on Hainan Island has shown fluctuations over the past 20 years, initially expanding and subsequently declining, reaching its peak in 2010.

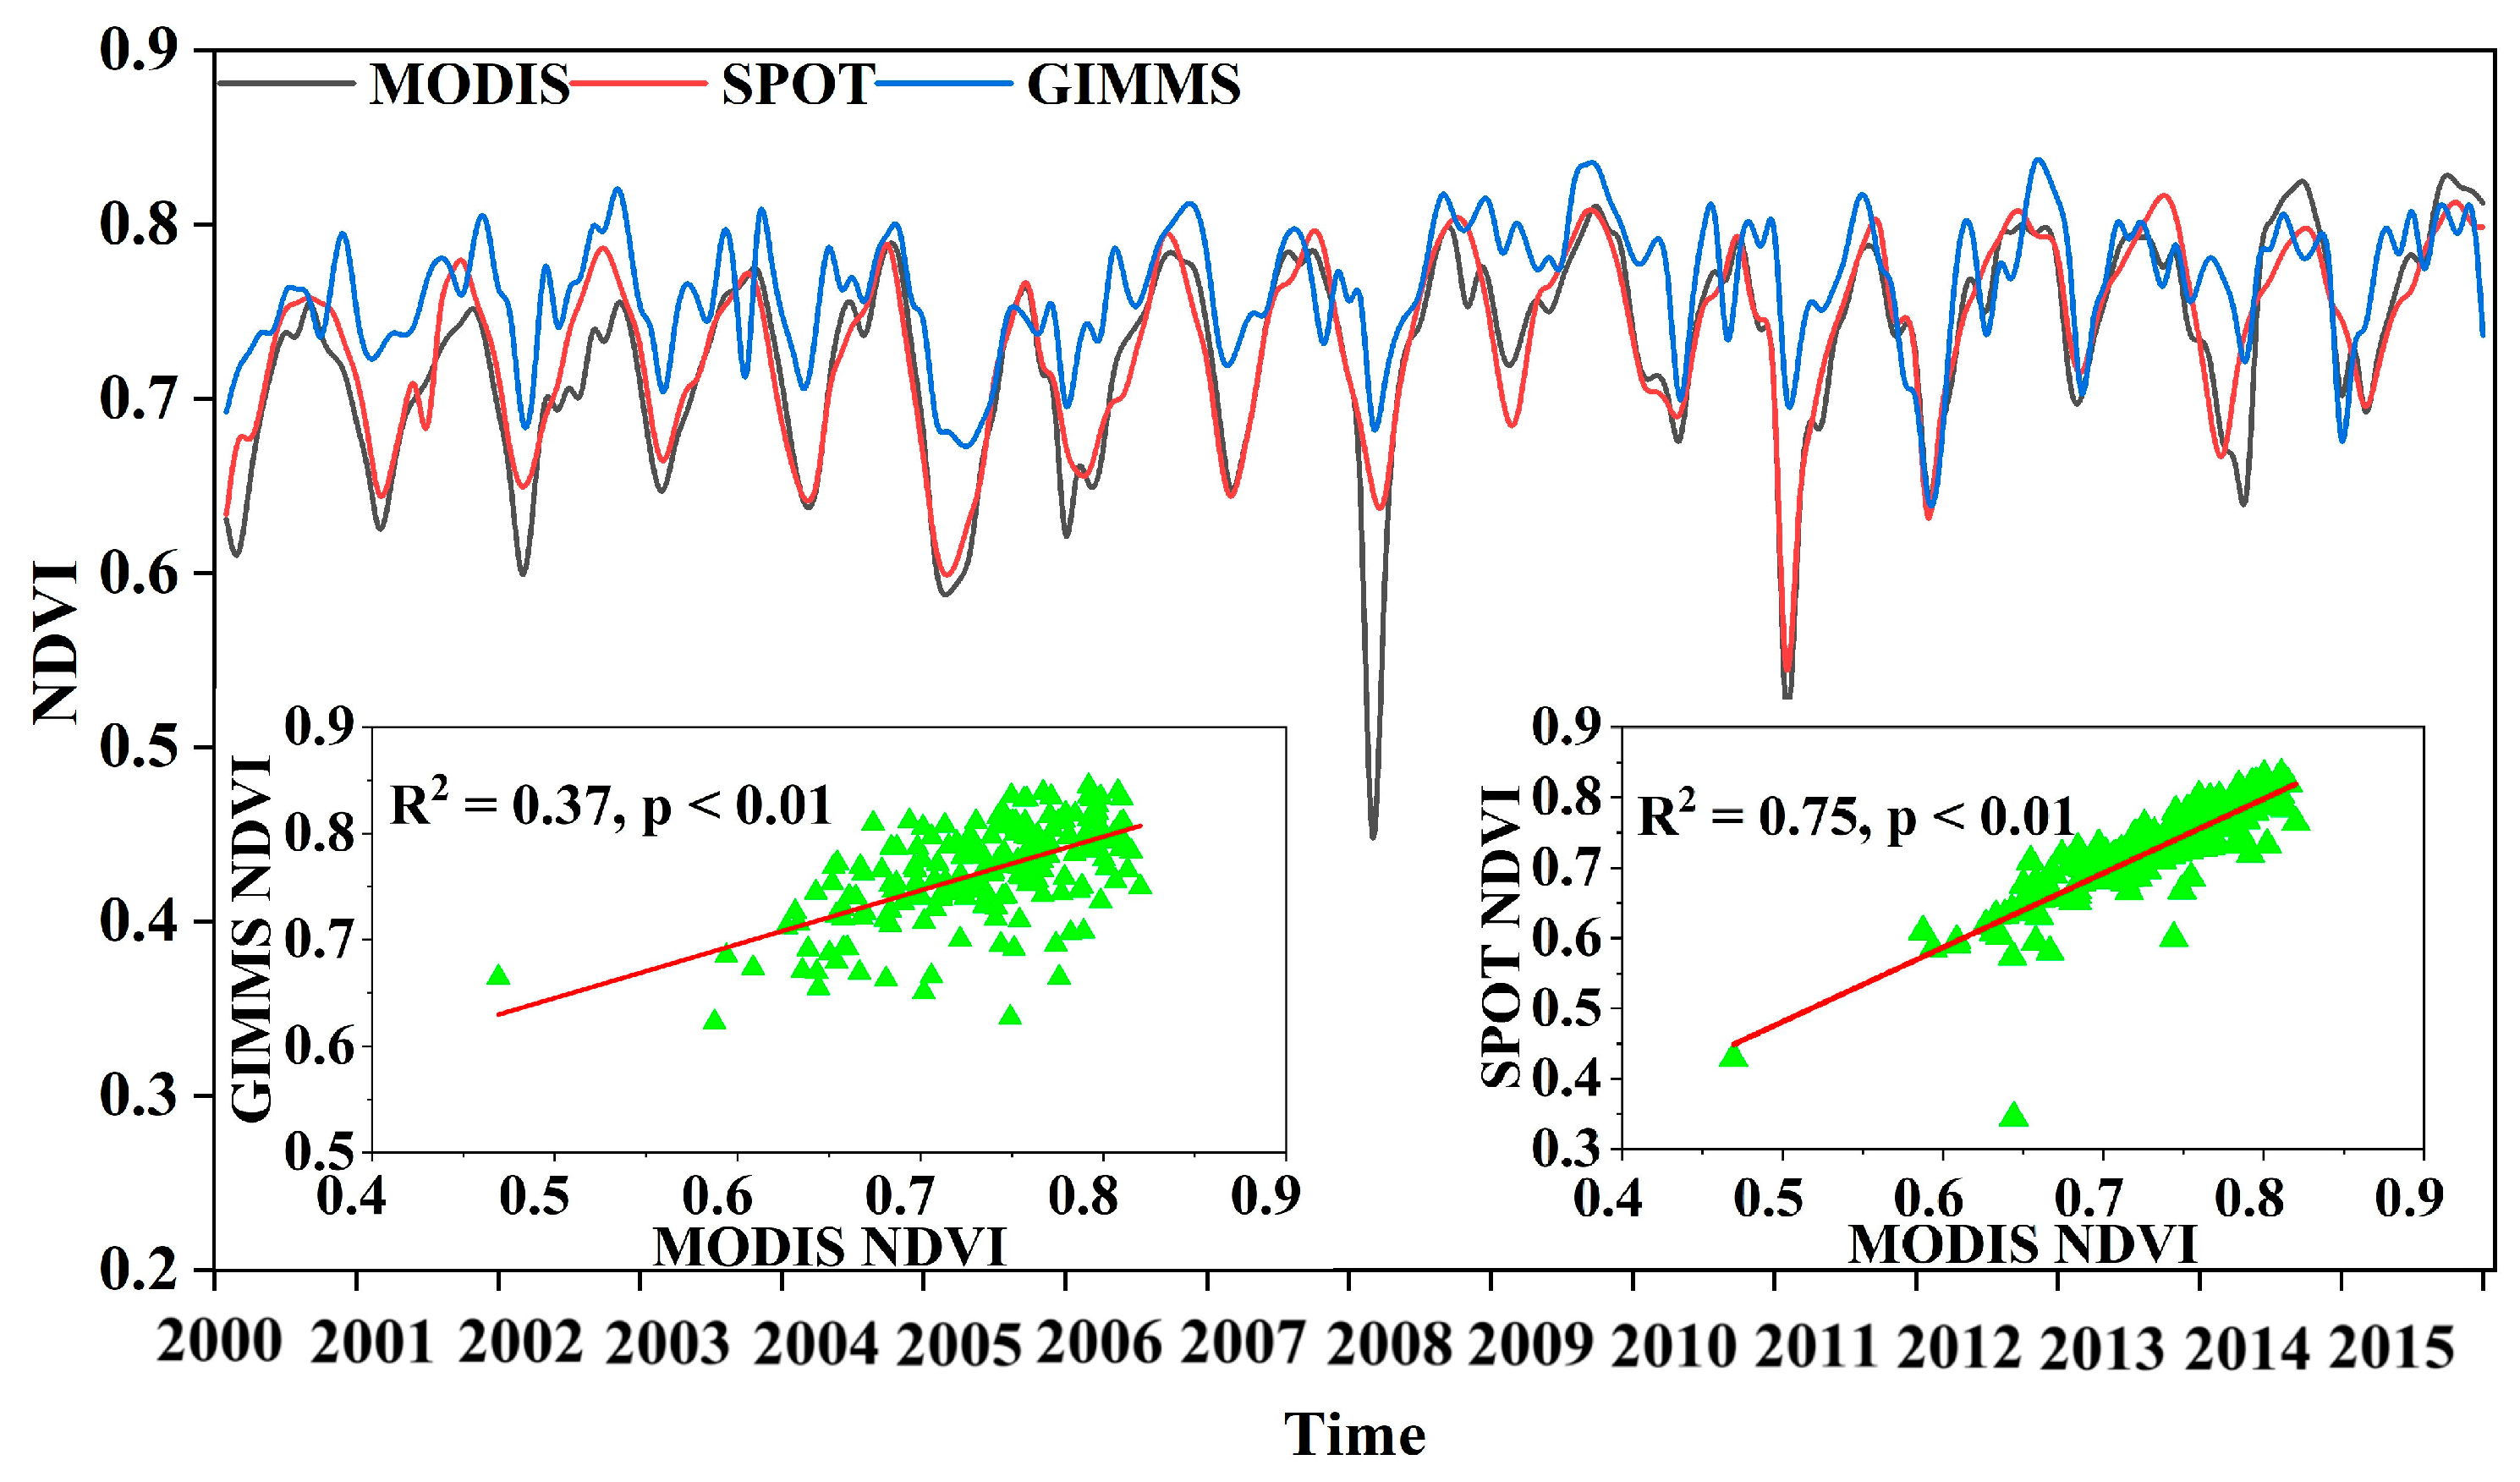
2.2.3. Extraction of Forest NDVI

To obtain stable forested areas on Hainan Island for the last 20 years, forest extraction was performed for the years 2000, 2010, and 2020 (Figure 3d). To ensure the NDVI values included forested land during 2000–2019, only pixels classified as forest in all three years (2000, 2010, and 2020) were included to ensure consistent NDVI values from 2000 to 2019. Following extraction, the forest area accounted for 56.53% of the total land area. Compared with 2000, Hainan Island’s Forest coverage decreased by 7.05% in 2010 and by 1.23% in 2020. Monthly forest NDVI data for Hainan Island from 2000 to 2019 were derived based on the identified stable forested areas and MODIS NDVI data.

2.3. Methodology

2.3.1. Mann–Kendall Test and Theil–Sen Median Trend Analysis

The Mann–Kendall test and Theil–Sen median trend analysis were employed in this study to examine the trend of forest NDVI on Hainan Island over the past 20 years. The Theil–Sen median trend analysis and Mann–Kendall test were used to analyze forest NDVI on a grid-by-grid basis. The MK test, a nonparametric statistical test for time series data, assesses both the trend and detects abrupt changes in the time series [53]. The Theil–Sen Median trend analysis is a robust non-parametric method for trend calculation, which is less affected by outliers and extreme values and is commonly used for long-term time series data trend analysis [54].

2.3.2. Moran’s I

For NDVI at a given pixel, there may be spatial interaction and diffusion with neighboring pixels. Various methods exist to test spatial autocorrelation, with the Moran index (Moran’s I) being one of the most commonly used. Moran’s I quantifies spatial correlation, where values closer to 1 indicate a stronger positive spatial correlation between variables. A value of 0 suggests no spatial correlation. In this study, the global Moran’s index was used to measure the spatial autocorrelation of vegetation changes.

2.3.3. MGWR Model

The MGWR model was employed to analyze the drivers of forest NDVI variation and to predict the greenness pattern under future scenarios on Hainan Island. MGWR extends GWR by integrating it into a generalized additive model, which provides standard errors for local parameter estimates [48]. This model allows the relationship between the response and explanatory variables to vary spatially and across different scales, thereby adjusting for overfitting inherent in uniform bandwidths and accommodating non-linear relationships. The model expression is as follows [55,56]:
y i = β b w 0 u i , v i + k = 1 m β b w k u i , v i x i k + ε i
where y i is the multi-year mean of NDVI, x i k is the value of the independent variable, which in this study are the multi-year mean values of natural factors and anthropogenic factors, u i , v i is the coordinate of regression point i , and m is the number of sample points. β b w 0 u i , v i is the constant term, β b w k u i , v i is the regression coefficient of point i , and ε i is the random error.

2.3.4. BRT Model

The Boosted Regression Tree (BRT) method was employed to assess the relative influence of different factors on NDVI changes on Hainan Island. The algorithm constructs a large ensemble of small regression trees through recursive binary partitioning of the predictor variable dataset, which is subsequently modeled using linear regression [46]. The GBM package in R facilitated the BRT analysis to determine the relative contribution of key climatic and anthropogenic factors to NDVI. In this study, annual mean NDVI data served as the response variable, while annual mean values of PAR, PRE, TEM, SM, GDP, and POP over the same period were used as explanatory variables. Seventy percent of the spatial raster points were randomly selected as the training set for augmented regression tree modeling, with the remaining thirty percent allocated for testing. The learning rate was set at 0.05, tree complexity at 5, and bag fraction at 0.5.

3. Results

3.1. Spatiotemporal Pattern of NDVI

3.1.1. Temporal Pattern of NDVI

In this study, Theil–Sen median trend analysis and the Mann–Kendall test were combined to reveal the NDVI change trends from 2000 to 2019, with a linear fit R² of 0.8223. The multi-year average NDVI value for Hainan Island forests was 0.8261, fluctuating between −0.0283 and 0.0222. The NDVI of forests on Hainan Island over the last 20 years exhibited a significant increasing trend with a rate of 0.0026 per year (p < 0.01) (Figure 4). Based on the Mann–Kendall test results, 2010 was identified as the mutation year for NDVI. The R² values for 2000–2009 and 2010–2019 were 0.5717 and 0.4601, respectively, both lower than the R² value of 0.8223 for the entire 2000–2019 period. Specifically, during the periods of 2000–2009 and 2010–2019, the NDVI of Hainan Island forests showed notable increases, with rates of 0.0034 per year (p < 0.01) and 0.0017 per year (p < 0.05), respectively.

3.1.2. Spatial Trends of NDVI in Forests on Hainan Island

Spatially, the NDVI of forests on Hainan Island ranged from 0.3 to 1.0 during 2000–2019. In the central and western mountainous regions of the island, high NDVI values predominated, typically exceeding 0.7 and covering 95.59% of the total forested area. Conversely, low NDVI values were predominantly found in the coastal forests, where values were below 0.7 (Figure 5a). In contrast, the spatial pattern of temperature exhibited the opposite trend, with average temperatures higher along the coast of Hainan Island compared with the central mountainous areas (Figure 5b). The multi-year average precipitation indicated that Hainan Island received annual precipitation exceeding 1000 mm, with a high precipitation region in the northeast and lower precipitation in the southwest (Figure 5c).
The changes in forest NDVI on Hainan Island from 2000 to 2019 were heterogeneous. As indicated in Table 2, approximately 64.42% of the areas exhibited a significant increase, about 33.78% showed no significant change, and only 1.8% of locations experienced a discernible downward trend. Geographically, the NDVI of Hainan Island depicted substantial increases over the past 20 years (Figure 6a), predominantly observed in the central and western areas, contrasting with minimal changes in the south, east, and northeast regions where the NDVI trends remained largely unchanged. Specifically, the southern region near Sanya and the area north of Haikou exhibited the most pronounced decline in the Theil–Sen median trend analysis of NDVI.

3.2. Spatial Heterogeneity of NDVI

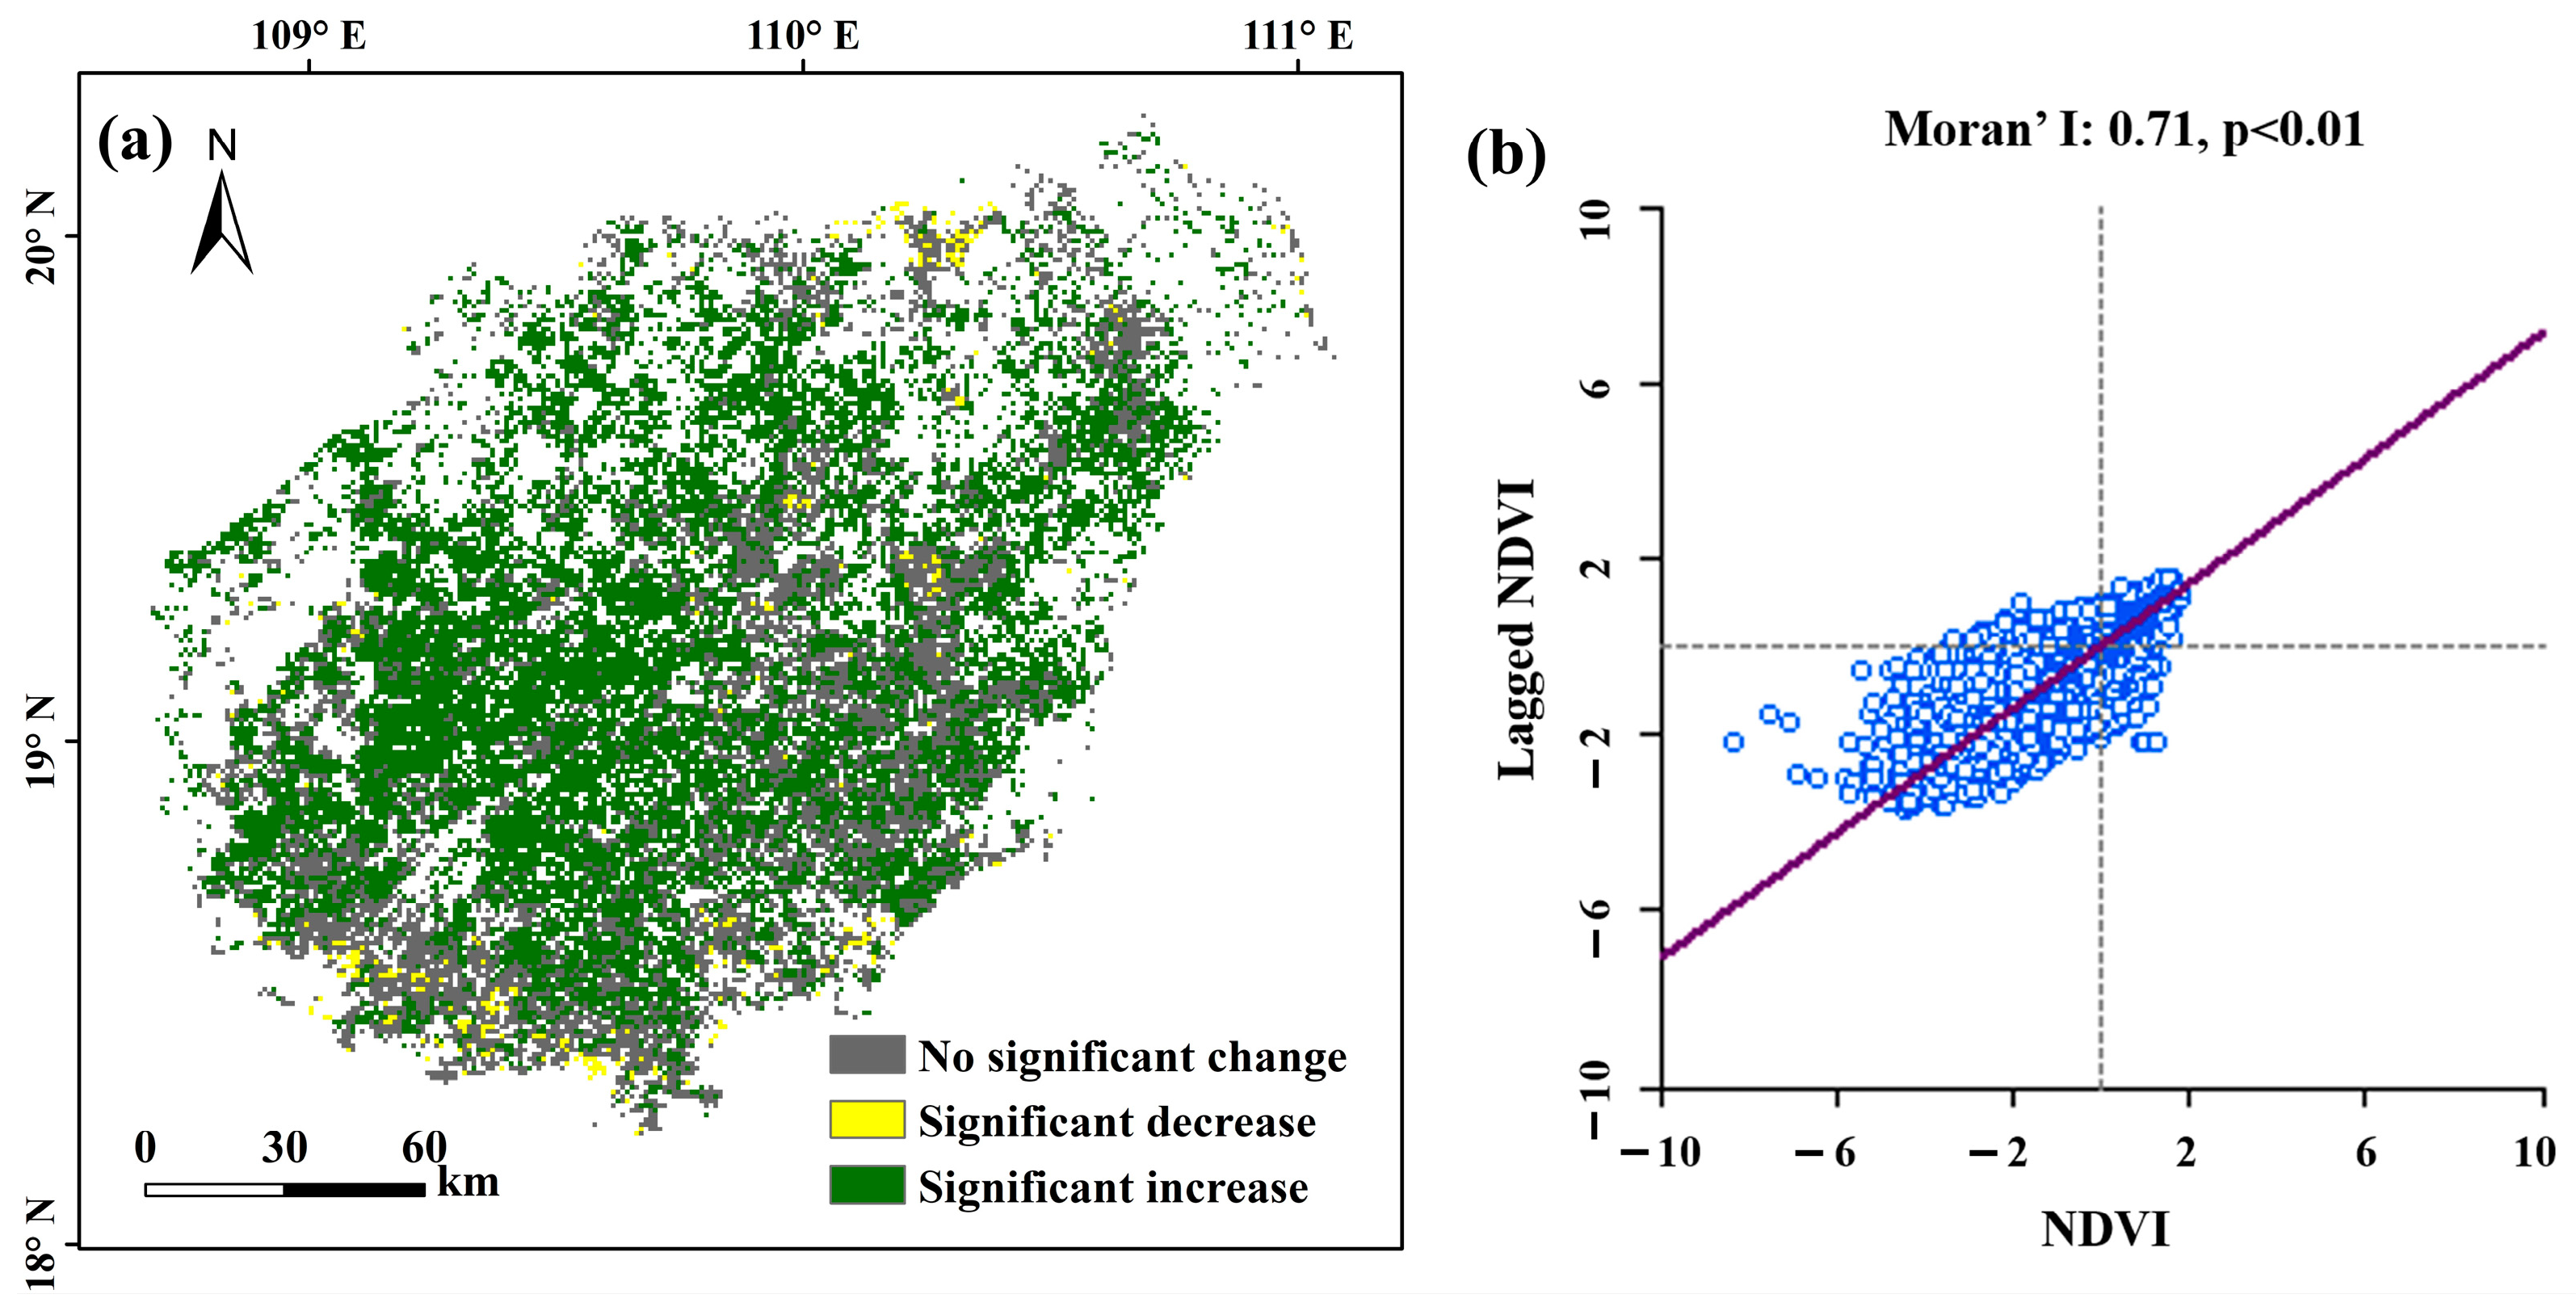
3.2.1. Spatial Autocorrelation Test of NDVI

Spatial autocorrelation analysis of forest NDVI on Hainan Island was conducted using Moran’s Index, as depicted in Figure 6b (Moran’s I = 0.71, p < 0.01), indicating a statistically significant positive spatial correlation of NDVI. The changes in NDVI were predominantly observed in the first and third quadrants, suggesting a high-high or low-low spatial aggregation pattern, where areas with similar NDVI values exhibited clustered spatial distributions.

3.2.2. Comparative Analysis of the OLS, GWR and MGWR Models

The average NDVI from 2000 to 2019 was used as a predictor variable, where the mean NDVI for May–October of each year represents the dry season, and the mean NDVI for the rest of the months represents the rainy season. Correlations between NDVI and climatic and socio-economic variables were explored using the OLS, GWR, and MGWR models. One prerequisite for applying the GWR and MGWR models is the existence of spatial autocorrelation among variables, while another is the inadequacy of the global OLS model in explaining spatial heterogeneity among the variables. The spatial correlation of NDVI was assessed using Moran’s Index, as shown in Figure 6b. According to the global regression model calculation results under the OLS regression, GWR model, and MGWR model (Table 3), the R2 result was primarily used to measure the model’s ability to explain the variability in these data, and the closer the R2 was to 1, the stronger the model’s explanatory power was. Better data simulation is achieved by the model with a lower Akaike Information Criterion score (AICc). According to the model comparison results, the MGWR model had the lowest AICc value of 9286.789, followed by the GWR model and the OLS model. The largest R2 was 0.929 for the MGWR, representing an increase of 25.38% compared with GWR. In conclusion, in terms of fitting efficacy, the MGWR model performed better than the GWR and OLS models (Figure 7).

3.2.3. Spatial Impacts of NDVI on Natural and Anthropogenic Factors

NDVI was affected by natural and anthropogenic factors, and the MGWR model could explain the local effect of NDVI with TEM, POP, SM, PRE, PAR, and GDP. The NDVI in forested areas of Hainan Island was dominated by natural factors (Figure 8a), with TEM having the greatest influence, affecting approximately 85.9% (Figure 8b) of the area. Anthropogenic factors dominated less than 5% of the area. Additionally, the negative impact of each factor on NDVI is greater than the positive impact (Figure 8c). TEM, in particular, has a negative effect of 94.53%, followed by PRE with a negative effect of approximately 80.29%. Conversely, PAR had the largest positive effect, contributing about 44.7%. The influence of natural and anthropogenic factors on NDVI exhibited significant spatial heterogeneity (Figure 9). Natural factors exhibit a gradual decrease in influence from the central mountainous area to the surrounding regions. Specifically, the influence ranges for TEM, PRE, SM, and PAR were −10.05 to 0.80, −8.02 to 3.59, −5.48 to 6.29, and -7.88 to 4.26, respectively. Notably, the negative impacts of TEM and PRE are much greater than their positive impacts. In contrast, anthropogenic factors display a different distribution pattern, with higher influence observed in the surrounding areas and lower influence in the central mountainous area. The influence values of POP and GDP range from −3.18 to 2.71 and −5.98 to 3.82, respectively.

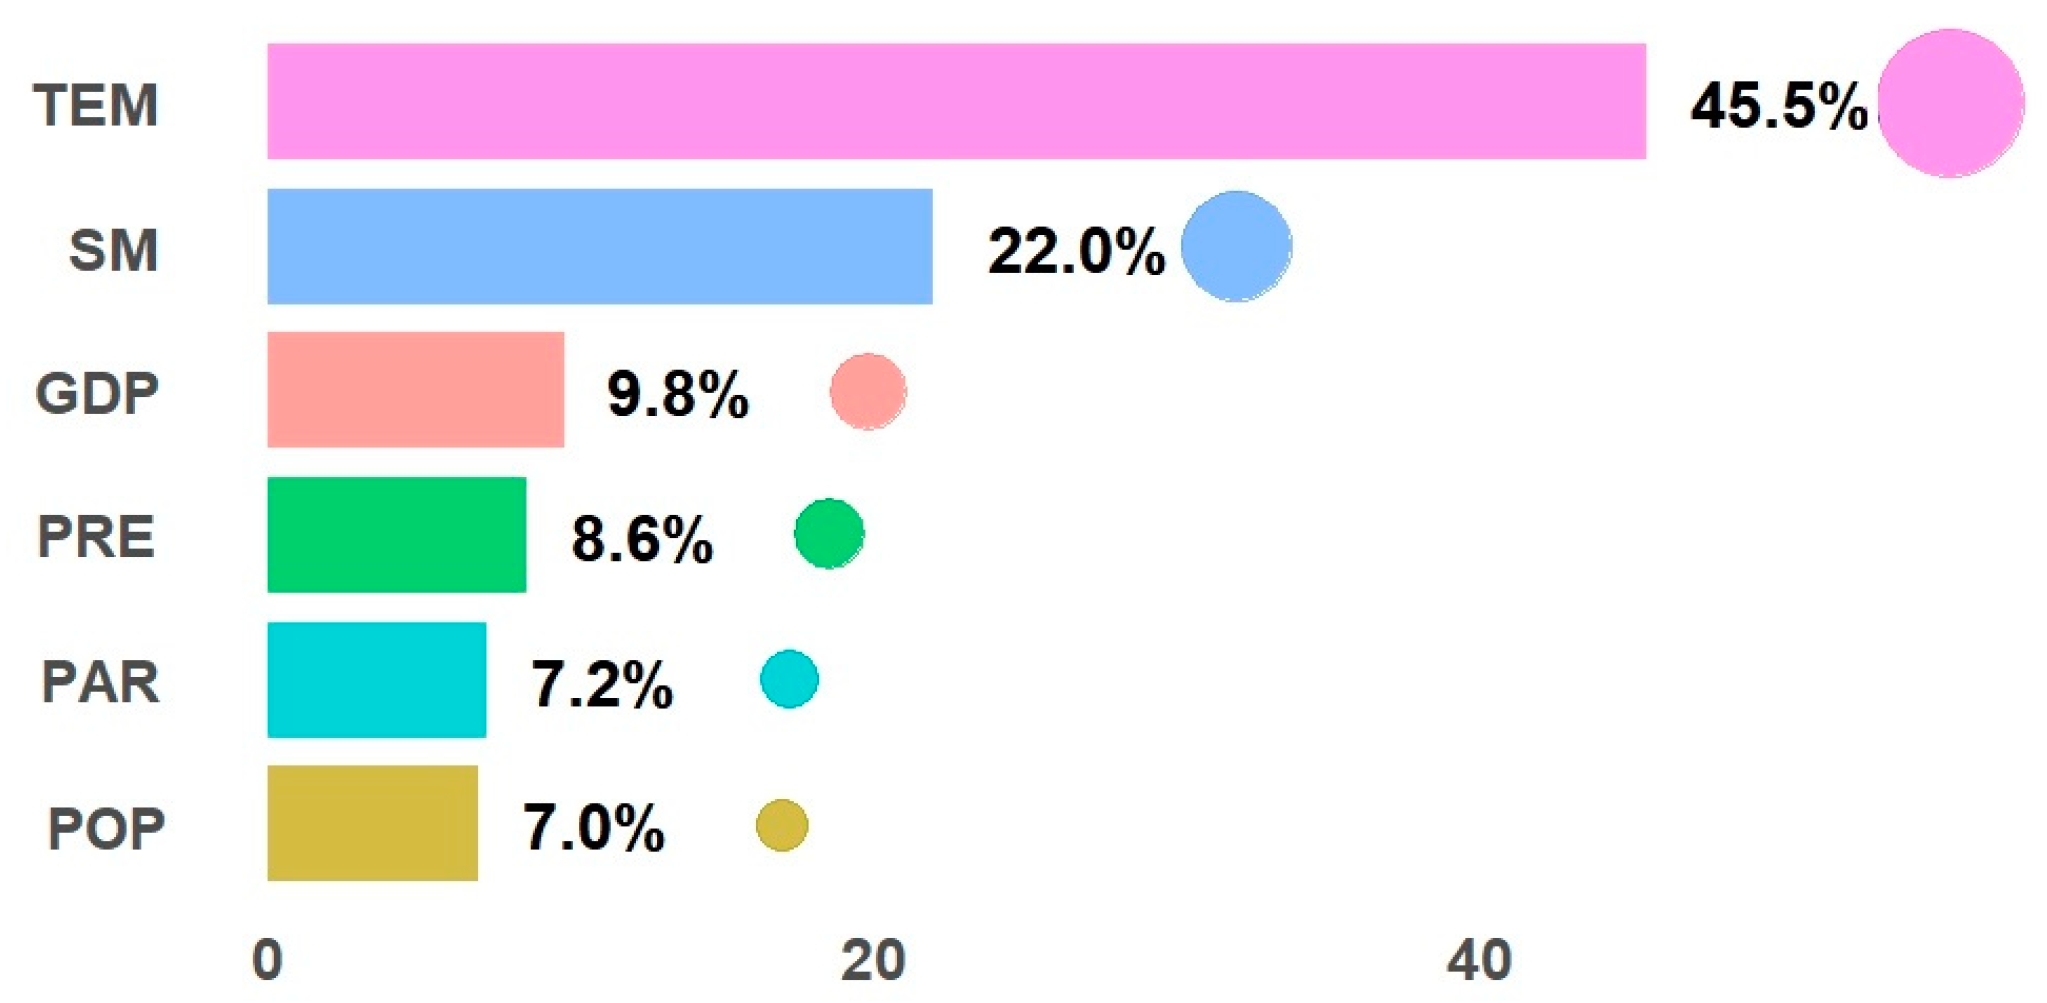
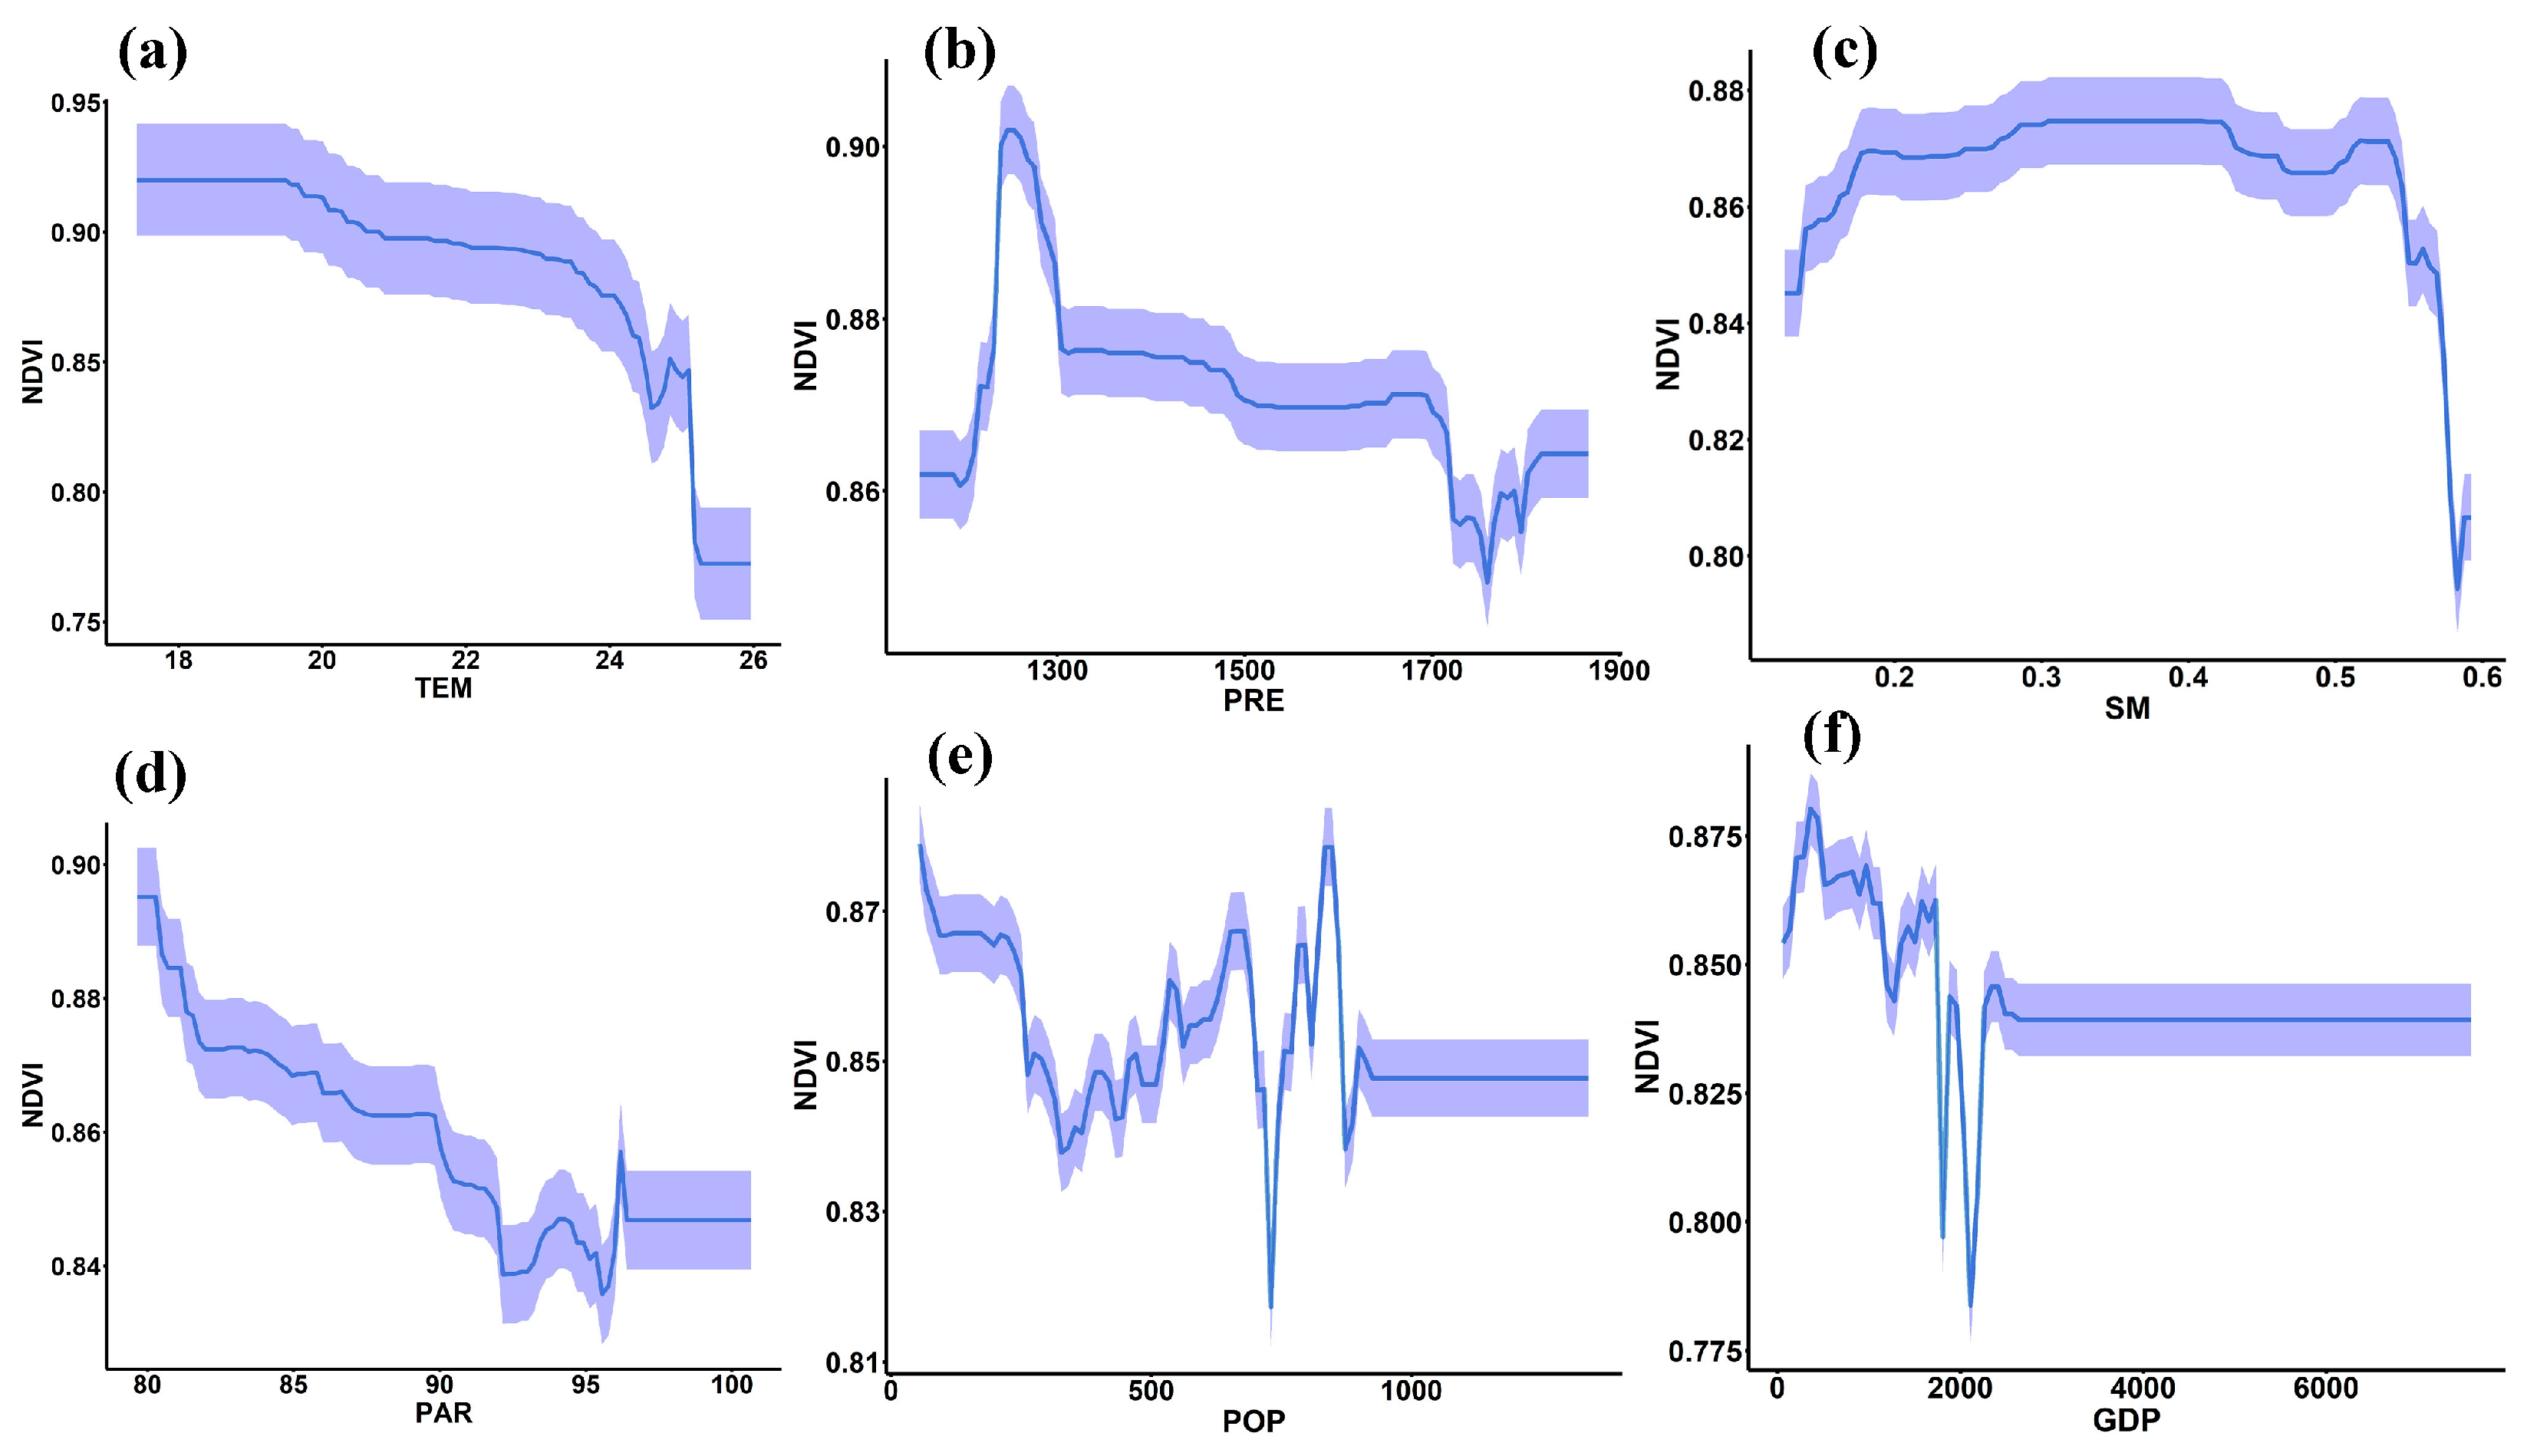
3.3. Nonlinear Response of Greenness Pattern to Driving Factors and Thresholds

The BRT model employed the nonlinear response of vegetation greening to natural and anthropogenic variables. The total annual TEM (45.50%), SM (21.95%), and GDP (9.78%) were identified as the three most important driving factors affecting vegetation greening (Figure 10). Nonlinear dependency plots generated by the BRT model illustrated the nonlinear relationships between vegetation greenness and the selected variables (Figure 11). Overall, there was a negative correlation between changes in vegetation greenness and the explanation factors, indicating that as these factors increase, NDVI values decrease. Temperatures below 20 °C and above 24.5 °C had minimal impact on NDVI. NDVI values decreased between 20 °C and 24.5 °C due to rising temperatures. Precipitation significantly increased NDVI when below 1300 mm; however, NDVI growth was suppressed with precipitation above 1300 mm. Soil moisture above 0.55 mm had a notable negative effect on NDVI. NDVI exhibited a decreasing trend as PAR increased, plateauing once PAR reached 96 μ m o l · m 1 s 1 . Population size significantly influenced NDVI up to 1000 people per km²; beyond this threshold, the population density did not affect NDVI. NDVI was unaffected by further increases in GDP per capita beyond 2000 yuan/km2.

3.4. Projected NDVI under Three SSP-RCP Scenarios

The predicted spatial distribution of NDVI values provided valuable insights into how vegetation growth may be affected under different future climate scenarios (Figure 12). NDVI shows a declining pattern under all scenarios (SSP119, SSP245 and SSP585). Under the sustainable scenario (SSP119), climate-induced changes in vegetation growth were negligible on average (<1%). The NDVI value under SSP245 also showed a slight decrease (1.31%) during the 2021–2100 period. Scenarios with much higher CO2 emissions and warming rates (SSP585) exhibit a greater decrease in NDVI (13.64%). Additionally, under the SSP119, SSP245, and SSP585 scenarios, the proportions of areas with a decrease in NDVI were 55.8%, 58.6%, and 87.8%, respectively. Furthermore, we analyzed the distribution of NDVI changes by dividing the changes under future climate scenarios into six intervals. In the interval where NDVI decreases by more than 0.13, the proportions for SSP119, SSP245, and SSP585 are 4.5%, 9.6%, and 43.6%, respectively. Conversely, in the interval where NDVI increases by more than 0.12, the proportions for SSP119, SSP245, and SSP585 are 3.7%, 9.4%, and 3.0%, respectively. For the spatiotemporal distribution of NDVI changes, the spatial distribution patterns of NDVI under the SSP119 and SSP245 climate scenarios show no significant differences. Compared with the sustainable development scenario (SSP119), the NDVI decreases slightly in the central mountainous region and increases in the northern region under the moderate stress scenario (SSP245). When comparing the high-stress scenario (SSP585) with SSP119, the NDVI shows a significant decrease in all forested areas except the central mountainous region.

4. Discussion

4.1. Dynamics of Greenness Pattern in the Forests of Hainan Island

The trend in NDVI of forest vegetation provides valuable insights for future regional ecological development. Analyzing the NDVI trend of tropical forests on Hainan Island from 2000 to 2019 reveals an overall increase (Figure 4). Research by Guo et al. (2021) and Luo et al. (2021) indicates that most forested areas maintained NDVI values above 0.7, indicating robust vegetation [49,57]. The rate of NDVI change was notably higher in the first decade compared with the subsequent decade, possibly influenced by the forestry policies implemented on Hainan Island. Since 2000, several provincial-level nature reserves have been established, coinciding with Hainan Island’s designation as an international tourism hub in 2010. Increased human activities have been identified as significant factors influencing forest NDVI [49], which consequently led to the NDVI mutation in 2010. The central region of Hainan Island features dense coverage of tropical rainforest, tropical monsoon forest, and mixed evergreen-deciduous broad-leaved forest, as per its geographical distribution. The establishment of the Rainforest National Park has helped maintain the continuity and integrity of these vegetation types, resulting in consistently high NDVI values in this central area [58,59]. Conversely, forest NDVI in the coastal areas of Hainan Island tends to be lower because of the diverse land use types (Figure 5a), particularly extensive arable land and fragmented forested areas [60,61], which collectively diminish the functionality of the forest ecosystem.

4.2. Response of Greenness Pattern to Natural Factors

At present, many studies have discovered climate changes directly determine the physiological activities of vegetation growth [62]. Vegetation greening trends were obvious in China, but the major natural drivers of vegetation development varied by region [63,64,65]. The interpretative ability of MGWR is superior to GWR, and it can reflect the impact scales of various variables. It is effective to study the driving relationships between NDVI and various influencing factors [66]. The spatial heterogeneity and diverse influence factors result in significant variations in their contributions to NDVI [41,63]. Currently, the MGWR model is widely used to explore the spatial heterogeneity of vegetation and ecological environment quality responses to influencing factors [42,67,68,69]. However, most studies either use MGWR alone [70], combine it with Geodetector to analyze the explanatory strength of driving factors on the spatial variation in ecological environment quality [71] or integrate it with Structural Equation Modeling (SEM) to analyze vegetation responses to climate and human activities [72]. There is a lack of studies combining MGWR with the BRT model to evaluate the relative contributions of multiple factors. In this study, the results of the MGWR and BRT model revealed significant regional heterogeneity in the relationship between NDVI and TEM, PRE, SM, PAR, GDP, and POP on Hainan Island’s forests. Overall, natural factors exerted a greater regional influence on NDVI in Hainan’s forests compared with anthropogenic factors (Figure 8, Figure 9 and Figure 10). This is consistent with previous studies, which have shown that the dynamics of vegetation targets are strongly influenced by climatic factors and the limitations of anthropogenic activities [65,66]. This is primarily attributed to our focus on stable forest NDVI over the past two decades, which helped mitigate forest loss and degradation due to human activities to some extent. Numerous studies have demonstrated the significant role of natural factors in influencing vegetation NDVI [73,74,75]. The impacts of temperature and precipitation on NDVI varied markedly across different regions (Figure 9a,b). In humid and semi-humid areas, the temperature played the dominant role, which enhanced vegetation growth [76,77]. In all words, the greenness pattern was a reflection of the synergy effect of various drivers. In the vicinity of Hainan Island, natural factors exerted a notable influence on NDVI. This observation may stem from relatively low forest density around the island, resulting in lower NDVI values and insufficient ecosystem stability, thereby making it highly susceptible to climatic influences. The average correlation coefficient between NDVI and temperature was found to be higher than that between NDVI and precipitation, suggesting that tropical forests exhibit a more pronounced sensitivity to temperature variations (Figure 10). Temperature is identified as the primary driver of vegetation changes, and the vegetation response to temperature varies spatially across the island, while water stress on Hainan Island has no significant effect [57]. In contrast, precipitation demonstrated a relatively weaker influence on NDVI in tropical forests on Hainan Island. This differs from findings in the Amazon tropics, where tropical forests exhibit greater sensitivity to moisture constraints [78]. Drought events in these regions can lead to tree mortality and a shift from carbon sink to carbon source dynamics in tropical forests [79].

4.3. The Implications of Anthropogenic Factors for Greenness Pattern

Furthermore, we identified significant negative effects of GDP and population on NDVI, particularly along the coastline of Hainan Island (Figure 9f). This is consistent with the findings of Luo et al. (2021) [49]. The main mechanism to explain this is that the expansion of urban areas, cropland, grassland, and forested areas, which were previously used for agricultural purposes, but when they have been requisitioned for infrastructure development, such as road construction, can lead to a significant decline in NDVI values [80]. The coastline, being a hub of urban development and economic activity, has played a pivotal role in China’s socio-economic landscape over the last three decades [81]. Moreover, economic development on Hainan Island has been unevenly distributed, with coastal areas exhibiting higher development levels compared with the central region [82]. The extensive highway and high-speed rail networks along the island have fragmented forest continuity, potentially contributing to the observed negative effects of anthropogenic factors on NDVI in the surrounding forests of Hainan Island. Additionally, the regional economic development on Hainan Island is significantly imbalanced, with the highest growth levels in the northern region, followed by the southern and eastern regions, and the lowest in the western region [49]. With rapid economic development, continuous population growth, and accelerated industrialization, the growth of urbanization and transportation has significantly impacted the greenness pattern.
In conclusion, the response of tropical forests on Hainan Island to precipitation differs from that of the Amazon region, likely due to Hainan’s unique geographical location and distinct climatic patterns. Hainan Island experiences a tropical island monsoon climate with abundant precipitation, resulting in relatively weak water stress for vegetation [57]. In addition to climate conditions, non-climatic factors such as human activities significantly influence vegetation dynamics. However, this study’s focus on the stable forested areas of Hainan Island over the past two decades minimizes the impact of large-scale human planting or logging. Furthermore, the NDVI and climatic variables derived from the MGWR model’s spatial regression parameters may indirectly represent the influence of human activities and their geographical variations.

5. Conclusions

This study analyzes the impact and contribution of natural and anthropogenic factors on vegetation greenness patterns on Hainan Island from 2000 to 2019 using the MGWR and BRT models. Additionally, it predicts the greenness pattern under different climate scenarios (SSP119, SSP245, and SSP585). During the last two decades, the NDVI of Hainan Island forests showed a significantly increased trend with an increasing rate of 0.0026/year (p < 0.01). The central part of Hainan Island, which makes up 64.42% of the entire forest area, saw this increasing pattern. The Moran’s I for NDVI was 0.71 (p < 0.01), indicating a significant positive spatial correlation of NDVI. The R2 of the MGWR model was 0.929, which described the spatial heterogeneity of NDVI in relation to climate anthropogenic factors more accurately. In general, the negative impacts of all driving factors on NDVI are greater than the positive impacts. The regional effect of anthropogenic factors on NDVI on Hainan forests was less than that of natural factors. This might be because we had extracted the stable forest NDVI in the last two decades, which avoided the loss and degradation of forests due to factors such as human activities to some extent. We found that GDP and population had significant negative effects on NDVI due to the economic development of cities along the coastline and the fragmentation of forests by highway and high-speed rail networks. The effects of natural factors on forest NDVI varied in different regions, with the lower elevation areas around Hainan Island having the most significant influence on NDVI. The NDVI of forests around Hainan Island was significantly more affected by temperature than precipitation. From 2000 to 2019, this study provided information on the regional and temporal variation in forest NDVI on Hainan Island, as well as its spatial relationships with air temperature and precipitation. It also provided an explanation of how variations in forest NDVI relate to climate. Under different future climate scenarios (SSP119, SSP245, SSP585), vegetation greenness is expected to decline to varying degrees, with most of the decline occurring in coastal areas. Further research is needed in the future to determine the influence mechanisms of different forest types and different factors.

Author Contributions

Conceptualization, R.Y. and B.Z.; Methodology, B.Z.; Software, B.Z.; Validation, R.Y.; Formal analysis, B.Z.; Investigation, B.Z.; Resources, R.Y.; Visualization, B.Z.; Supervision, R.Y.; Project administration, R.Y.; Funding acquisition, R.Y. All authors have read and agreed to the published version of the manuscript.

Funding

This work was supported by the High-level Talent Foundation of Natural Science Fund Projects of Hainan Province (Project No.321RC472), the Open Research Fund of the Key Laboratory of Earth Observation of Hainan Province (Project No. 2020LDE002), Hainan Research Institute, Aerospace Information Research Institute, Chinese Academy of Sciences, the National Natural Science Foundation of China (Project No. 42261022), Nanhai New Star Projects (Project No. NHXXRCXM202303), and Natural Resources Comprehensive Survey Command Center Science and Technology Innovation Fund (Project No. KC20230018), and Sanya Science and Technology Special Fund (Project No. 2022KJCX04).

Data Availability Statement

Data and the code would be available on request.

Conflicts of Interest

The authors declare no conflict of interest.

References

  1. Cai, Y.; Zhang, F.; Duan, P.; Yung Jim, C.; Weng Chan, N.; Shi, J.; Liu, C.; Wang, J.; Bahtebay, J.; Ma, X. Vegetation Cover Changes in China Induced by Ecological Restoration-Protection Projects and Land-Use Changes from 2000 to 2020. CATENA 2022, 217, 106530. [Google Scholar] [CrossRef]
  2. Xu, B.; Mao, X.; Li, X.; Wei, X.; Zhang, Z.; Tang, W.; Yu, H.; Wu, Y. Anthropogenic Activities Dominated the Spatial and Temporal Changes of Normalized Difference Vegetation Index (NDVI) in the Hehuang Valley in the Northeastern Qinghai Province between 2000 and 2020. Front. Environ. Sci. 2024, 12, 1384032. [Google Scholar] [CrossRef]
  3. Wang, H.; Zhan, J.; Wang, C.; Liu, W.; Yang, Z.; Liu, H.; Bai, C. Greening or Browning? The Macro Variation and Drivers of Different Vegetation Types on the Qinghai-Tibetan Plateau from 2000 to 2021. Front. Plant. Sci. 2022, 13, 1045290. [Google Scholar] [CrossRef] [PubMed]
  4. Chen, C.; Park, T.; Wang, X.; Piao, S.; Xu, B.; Chaturvedi, R.K.; Fuchs, R.; Brovkin, V.; Ciais, P.; Fensholt, R.; et al. China and India Lead in Greening of the World through Land-Use Management. Nat. Sustain. 2019, 2, 122–129. [Google Scholar] [CrossRef] [PubMed]
  5. Liu, Y.; Li, Z.; Chen, Y.; Mindje Kayumba, P.; Wang, X.; Liu, C.; Long, Y.; Sun, F. Biophysical Impacts of Vegetation Dynamics Largely Contribute to Climate Mitigation in High Mountain Asia. Agric. For. Meteorol. 2022, 327, 109233. [Google Scholar] [CrossRef]
  6. Yang, Z.; Gong, J.; Wang, S.; Jin, T.; Wang, Y. Shifts Bidirectional Dependency between Vegetation Greening and Soil Moisture over the Past Four Decades in China. Sci. Total Environ. 2023, 897, 166388. [Google Scholar] [CrossRef] [PubMed]
  7. Higgins, S.I.; Conradi, T.; Muhoko, E. Shifts in Vegetation Activity of Terrestrial Ecosystems Attributable to Climate Trends. Nat. Geosci. 2023, 16, 147–153. [Google Scholar] [CrossRef]
  8. Gao, J.; Jiao, K.; Wu, S.; Ma, D.; Zhao, D.; Yin, Y.; Dai, E. Past and Future Effects of Climate Change on Spatially Heterogeneous Vegetation Activity in China. Earths Future 2017, 5, 679–692. [Google Scholar] [CrossRef]
  9. Zhang, J.; Guan, Q.; Zhang, Z.; Shao, W.; Zhang, E.; Kang, T.; Xiao, X.; Liu, H.; Luo, H. Characteristics of Spatial and Temporal Dynamics of Vegetation and Its Response to Climate Extremes in Ecologically Fragile and Climate Change Sensitive Areas—A Case Study of Hexi Region. CATENA 2024, 239, 107910. [Google Scholar] [CrossRef]
  10. Hawinkel, P.; Swinnen, E.; Lhermitte, S.; Verbist, B.; Van Orshoven, J.; Muys, B. A Time Series Processing Tool to Extract Climate-Driven Interannual Vegetation Dynamics Using Ensemble Empirical Mode Decomposition (EEMD). Remote Sens. Environ. 2015, 169, 375–389. [Google Scholar] [CrossRef]
  11. Yang, L.; Guan, Q.; Lin, J.; Tian, J.; Tan, Z.; Li, H. Evolution of NDVI Secular Trends and Responses to Climate Change: A Perspective from Nonlinearity and Nonstationarity Characteristics. Remote Sens. Environ. 2021, 254, 112247. [Google Scholar] [CrossRef]
  12. Bhuyan, M.; Singh, B.; Vid, S.; Jeganathan, C. Analysing the Spatio-Temporal Patterns of Vegetation Dynamics and Their Responses to Climatic Parameters in Meghalaya from 2001 to 2020. Environ. Monit. Assess. 2022, 195, 94. [Google Scholar] [CrossRef] [PubMed]
  13. Meng, N.; Wang, N.; Cheng, H.; Liu, X.; Niu, Z. Impacts of Climate Change and Anthropogenic Activities on the Normalized Difference Vegetation Index of Desertified Areas in Northern China. J. Geogr. Sci. 2023, 33, 483–507. [Google Scholar] [CrossRef]
  14. Mann, H.B. Nonparametric Tests Against Trend. Econometrica 1945, 13, 245–259. [Google Scholar] [CrossRef]
  15. Zhao, Z.; Li, T.; Zhang, Y.; Lü, D.; Wang, C.; Lü, Y.; Wu, X. Spatiotemporal Patterns and Driving Factors of Ecological Vulnerability on the Qinghai-Tibet Plateau Based on the Google Earth Engine. Remote Sens. 2022, 14, 5279. [Google Scholar] [CrossRef]
  16. Wang, L.; Hu, F.; Miao, Y.; Zhang, C.; Zhang, L.; Luo, M. Changes in Vegetation Dynamics and Relations with Extreme Climate on Multiple Time Scales in Guangxi, China. Remote Sens. 2022, 14, 2013. [Google Scholar] [CrossRef]
  17. Wang, Y.; Chen, X.; Gao, M.; Dong, J. The Use of Random Forest to Identify Climate and Human Interference on Vegetation Coverage Changes in Southwest China. Ecol. Indic. 2022, 144, 109463. [Google Scholar] [CrossRef]
  18. Liao, Z.; Wang, X.; Zhang, Y.; Qing, H.; Li, C.; Liu, Q.; Cai, J.; Wei, C. An Integrated Simulation Framework for NDVI Pattern Variations with Dual Society-Nature Drives: A Case Study in Baiyangdian Wetland, North China. Ecol. Indic. 2024, 158, 111584. [Google Scholar] [CrossRef]
  19. Xu, Y.; Dai, Q.-Y.; Lu, Y.-G.; Zhao, C.; Huang, W.-T.; Xu, M.; Feng, Y.-X. Identification of Ecologically Sensitive Zones Affected by Climate Change and Anthropogenic Activities in Southwest China through a NDVI-Based Spatial-Temporal Model. Ecol. Indic. 2024, 158, 111482. [Google Scholar] [CrossRef]
  20. Bao, T.; Li, J.; Chang, I.-S.; Jin, E.; Wu, J.; Burenjargal; Bao, Y. The Influence of Ecological Engineering Projects on Dust Events: A Case Study in the Northern China. Environ. Impact Assess. Rev. 2022, 96, 106847. [Google Scholar] [CrossRef]
  21. Yang, K.; Sun, W.; Luo, Y.; Zhao, L. Impact of Urban Expansion on Vegetation: The Case of China (2000–2018). J. Environ. Manag. 2021, 291, 112598. [Google Scholar] [CrossRef] [PubMed]
  22. Pillay, R.; Venter, M.; Aragon-Osejo, J.; González-del-Pliego, P.; Hansen, A.J.; Watson, J.E.; Venter, O. Tropical Forests Are Home to over Half of the World’s Vertebrate Species. Front. Ecol. Environ. 2022, 20, 10–15. [Google Scholar] [CrossRef] [PubMed]
  23. Corlett, R.T. The Impacts of Droughts in Tropical Forests. Trends Plant Sci. 2016, 21, 584–593. [Google Scholar] [CrossRef] [PubMed]
  24. Valjarević, A.; Milanović, M.; Gultepe, I.; Filipović, D.; Lukić, T. Updated Trewartha Climate Classification with Four Climate Change Scenarios. Geogr. J. 2022, 188, 506–517. [Google Scholar] [CrossRef]
  25. Gould, W.A.; Álvarez-Berríos, N.L.; Parrotta, J.A.; McGinley, K. Chapter 10—Climate Change and Tropical Forests. In Future Forests; McNulty, S.G., Ed.; Elsevier: Amsterdam, The Netherlands, 2024; pp. 203–219. ISBN 978-0-323-90430-8. [Google Scholar]
  26. Ismaeel, A.; Tai, A.P.K.; Santos, E.G.; Maraia, H.; Aalto, I.; Altman, J.; Doležal, J.; Lembrechts, J.J.; Camargo, J.L.; Aalto, J.; et al. Patterns of Tropical Forest Understory Temperatures. Nat. Commun. 2024, 15, 549. [Google Scholar] [CrossRef] [PubMed]
  27. Sayer, E.J.; Leitman, S.F.; Wright, S.J.; Rodtassana, C.; Vincent, A.G.; Bréchet, L.M.; Castro, B.; Lopez, O.; Wallwork, A.; Tanner, E.V.J. Tropical Forest Above-Ground Productivity Is Maintained by Nutrients Cycled in Litter. J. Ecol. 2024, 112, 690–700. [Google Scholar] [CrossRef]
  28. Vitousek, P.M.; Sanford, R.L. Nutrient Cycling in Moist Tropical Forest. Annu. Rev. Ecol. Syst. 1986, 17, 137–167. [Google Scholar] [CrossRef]
  29. Gao, Y.; Huang, J.; Li, S.; Li, S. Spatial Pattern of Non-Stationarity and Scale-Dependent Relationships between NDVI and Climatic Factors—A Case Study in Qinghai-Tibet Plateau, China. Ecol. Indic. 2012, 20, 170–176. [Google Scholar] [CrossRef]
  30. Gao, J.; Jiao, K.; Wu, S. Investigating the Spatially Heterogeneous Relationships between Climate Factors and NDVI in China during 1982 to 2013. J. Geogr. Sci. 2019, 29, 1597–1609. [Google Scholar] [CrossRef]
  31. Jin, G.; Deng, X.; Zhao, X.; Guo, B.; Yang, J. Spatiotemporal Patterns in Urbanization Efficiency within the Yangtze River Economic Belt between 2005 and 2014. J. Geogr. Sci. 2018, 28, 1113–1126. [Google Scholar] [CrossRef]
  32. Zhang, W.; Randall, M.; Jensen, M.B.; Brandt, M.; Wang, Q.; Fensholt, R. Socio-Economic and Climatic Changes Lead to Contrasting Global Urban Vegetation Trends. Glob. Environ. Change 2021, 71, 102385. [Google Scholar] [CrossRef]
  33. Zhang, W.; Wang, L.; Xiang, F.; Qin, W.; Jiang, W. Vegetation Dynamics and the Relations with Climate Change at Multiple Time Scales in the Yangtze River and Yellow River Basin, China. Ecol. Indic. 2020, 110, 105892. [Google Scholar] [CrossRef]
  34. Wang, B.; Xu, G.; Li, P.; Li, Z.; Zhang, Y.; Cheng, Y.; Jia, L.; Zhang, J. Vegetation Dynamics and Their Relationships with Climatic Factors in the Qinling Mountains of China. Ecol. Indic. 2020, 108, 105719. [Google Scholar] [CrossRef]
  35. Gao, W.; Zheng, C.; Liu, X.; Lu, Y.; Chen, Y.; Wei, Y.; Ma, Y. NDVI-Based Vegetation Dynamics and Their Responses to Climate Change and Human Activities from 1982 to 2020: A Case Study in the Mu Us Sandy Land, China. Ecol. Indic. 2022, 137, 108745. [Google Scholar] [CrossRef]
  36. Guo, E.; Wang, Y.; Wang, C.; Sun, Z.; Bao, Y.; Mandula, N.; Jirigala, B.; Bao, Y.; Li, H. NDVI Indicates Long-Term Dynamics of Vegetation and Its Driving Forces from Climatic and Anthropogenic Factors in Mongolian Plateau. Remote Sens. 2021, 13, 688. [Google Scholar] [CrossRef]
  37. Brunsdon, C.; Fotheringham, A.S.; Charlton, M.E. Geographically Weighted Regression: A Method for Exploring Spatial Nonstationarity. Geogr. Anal. 1996, 28, 281–298. [Google Scholar] [CrossRef]
  38. Yuan, E.; Zhou, Q.; Yan, W.; Peng, D.; Wang, Y.; Yang, X.; Li, P. The Impact of Socioeconomic Factors on Vegetation Restoration in Karst Regions: A Perspective beyond Climate and Ecological Engineering. Ecol. Eng. 2024, 206, 107332. [Google Scholar] [CrossRef]
  39. Basit, I.; Faizi, F.; Mahmood, K.; Faizi, R.; Ramzan, S.; Parvez, S.; Mushtaq, F. Assessment of Vegetation Dynamics under Changed Climate Situation Using Geostatistical Modeling. Theor. Appl. Climatol. 2024, 155, 3371–3386. [Google Scholar] [CrossRef]
  40. He, J.; Shi, X.; Fu, Y. Identifying Vegetation Restoration Effectiveness and Driving Factors on Different Micro-Topographic Types of Hilly Loess Plateau: From the Perspective of Ecological Resilience. J. Environ. Manage. 2021, 289, 112562. [Google Scholar] [CrossRef] [PubMed]
  41. Zhang, W.; Dai, L.; Yan, Y.; Han, X.; Teng, Y.; Li, M.; Zhu, Y.; Zhang, Y. Multiscale Geographically Weighted Regression-Based Analysis of Vegetation Driving Factors and Mining-Induced Quantification in the Fengfeng District, China. Ecol. Inform. 2024, 80, 102506. [Google Scholar] [CrossRef]
  42. Wu, J.; Hou, Y.; Cui, Z. Coupled InVEST–MGWR Modeling to Analyze the Impacts of Changing Landscape Patterns on Habitat Quality in the Fen River Basin. Sci. Rep. 2024, 14, 13084. [Google Scholar] [CrossRef] [PubMed]
  43. Li, C.; Fu, B.; Wang, S.; Stringer, L.C.; Wang, Y.; Li, Z.; Liu, Y.; Zhou, W. Drivers and Impacts of Changes in China’s Drylands. Nat. Rev. Earth Environ. 2021, 2, 858–873. [Google Scholar] [CrossRef]
  44. Xiao, X.; Wang, Q.; Guan, Q.; Zhang, Z.; Yan, Y.; Mi, J.; Yang, E. Quantifying the Nonlinear Response of Vegetation Greening to Driving Factors in Longnan of China Based on Machine Learning Algorithm. Ecol. Indic. 2023, 151, 110277. [Google Scholar] [CrossRef]
  45. Araujo, H.F.P.; Canassa, N.F.; Machado, C.C.C.; Tabarelli, M. Human Disturbance Is the Major Driver of Vegetation Changes in the Caatinga Dry Forest Region. Sci. Rep. 2023, 13, 18440. [Google Scholar] [CrossRef] [PubMed]
  46. Elith, J.; Leathwick, J.R.; Hastie, T. A Working Guide to Boosted Regression Trees. J. Anim. Ecol. 2008, 77, 802–813. [Google Scholar] [CrossRef] [PubMed]
  47. Xiao, X.; Guan, Q.; Zhang, Z.; Liu, H.; Du, Q.; Yuan, T. Investigating the Underlying Drivers of Vegetation Dynamics in Cold-Arid Mountainous. CATENA 2024, 237, 107831. [Google Scholar] [CrossRef]
  48. Jiang, L.; Jiapaer, G.; Bao, A.; Guo, H.; Ndayisaba, F. Vegetation Dynamics and Responses to Climate Change and Human Activities in Central Asia. Sci. Total Environ. 2017, 599–600, 967–980. [Google Scholar] [CrossRef] [PubMed]
  49. Luo, H.; Dai, S.; Li, M.; Liu, E.; Li, Y.; Xie, Z. NDVI-Based Analysis of the Influence of Climate Changes and Human Activities on Vegetation Variation on Hainan Island. J. Indian Soc. Remote Sens. 2021, 49, 1755–1767. [Google Scholar] [CrossRef]
  50. Chen, J.; Yan, F.; Lu, Q. Spatiotemporal Variation of Vegetation on the Qinghai–Tibet Plateau and the Influence of Climatic Factors and Human Activities on Vegetation Trend (2000–2019). Remote Sens. 2020, 12, 3150. [Google Scholar] [CrossRef]
  51. Bai, Y.; Yang, Y.; Jiang, H. Intercomparison of AVHRR GIMMS3g, Terra MODIS, and SPOT-VGT NDVI Products over the Mongolian Plateau. Remote Sens. 2019, 11, 2030. [Google Scholar] [CrossRef]
  52. Gu, Z.; Duan, X.; Shi, Y.; Li, Y.; Pan, X. Spatiotemporal Variation in Vegetation Coverage and Its Response to Climatic Factors in the Red River Basin, China. Ecol. Indic. 2018, 93, 54–64. [Google Scholar] [CrossRef]
  53. Kendall, M.G. Rank Correlation Methods; Griffin: Oxford, UK, 1948. [Google Scholar]
  54. Theil, H. A Rank-Invariant Method of Linear and Polynomial Regression Analysis, 3; Confidence Regions for the Parameters of Polynomial Regression Equations: (Proceedings Knaw, _5_3(1950), Nr 9, Indagationes Mathematicae, _1_2(1950), P 467-482); Stichting Mathematisch Centrum, Statistische Afdeling: Amsterdam, The Netherlands, 1950. [Google Scholar]
  55. Fotheringham, A.S.; Yang, W.; Kang, W. Multiscale Geographically Weighted Regression (MGWR). Ann. Am. Assoc. Geogr. 2017, 107, 1247–1265. [Google Scholar] [CrossRef]
  56. Hu, J.; Zhang, J.; Li, Y. Exploring the Spatial and Temporal Driving Mechanisms of Landscape Patterns on Habitat Quality in a City Undergoing Rapid Urbanization Based on GTWR and MGWR: The Case of Nanjing, China. Ecol. Indic. 2022, 143, 109333. [Google Scholar] [CrossRef]
  57. Guo, P.; Zhao, X.; Shi, J.; Huang, J.; Jia, T.; Zhang, R.; Chen, J.; Wang, Q.; Zeng, J. The Influence of Temperature and Precipitation on the Vegetation Dynamics of the Tropical Island of Hainan. Theor. Appl. Climatol. 2021, 143, 429–445. [Google Scholar] [CrossRef]
  58. Yu, B.; Chao, X.; Zhang, J.; Xu, W.; Ouyang, Z. Effectiveness of Nature Reserves for Natural Forests Protection in Tropical Hainan: A 20 Year Analysis. Chin. Geogr. Sci. 2016, 26, 208–215. [Google Scholar] [CrossRef]
  59. Han, N.; Yu, M.; Jia, P.; Zhang, Y.; Hu, K. Influence of Human Activity Intensity on Habitat Quality in Hainan Tropical Rainforest National Park, China. Chin. Geogr. Sci. 2024, 34, 519–532. [Google Scholar] [CrossRef]
  60. Wang, W.; Pechacek, P.; Zhang, M.; Xiao, N.; Zhu, J.; Li, J. Effectiveness of Nature Reserve System for Conserving Tropical Forests: A Statistical Evaluation of Hainan Island, China. PLoS ONE 2013, 8, e57561. [Google Scholar] [CrossRef] [PubMed]
  61. Li, L.; Tang, H.; Lei, J.; Song, X. Spatial Autocorrelation in Land Use Type and Ecosystem Service Value in Hainan Tropical Rain Forest National Park. Ecol. Indic. 2022, 137, 108727. [Google Scholar] [CrossRef]
  62. Liu, Q.; Yang, Z.; Han, F.; Wang, Z.; Wang, C. NDVI-Based Vegetation Dynamics and Their Response to Recent Climate Change: A Case Study in the Tianshan Mountains, China. Environ. Earth Sci. 2016, 75, 1189. [Google Scholar] [CrossRef]
  63. Zhang, S.; Ye, L.; Huang, C.; Wang, M.; Yang, Y.; Wang, T.; Tan, W. Evolution of Vegetation Dynamics and Its Response to Climate in Ecologically Fragile Regions from 1982 to 2020: A Case Study of the Three Gorges Reservoir Area. CATENA 2022, 219, 106601. [Google Scholar] [CrossRef]
  64. Liu, Y.; Liu, H.; Chen, Y.; Gang, C.; Shen, Y. Quantifying the Contributions of Climate Change and Human Activities to Vegetation Dynamic in China Based on Multiple Indices. Sci. Total Environ. 2022, 838, 156553. [Google Scholar] [CrossRef]
  65. Zhu, L.; Sun, S.; Li, Y.; Liu, X.; Hu, K. Effects of Climate Change and Anthropogenic Activity on the Vegetation Greening in the Liaohe River Basin of Northeastern China. Ecol. Indic. 2023, 148, 110105. [Google Scholar] [CrossRef]
  66. Zhou, Y.; Xu, K.; Feng, Z.; Wu, K. Quantification and Driving Mechanism of Cultivated Land Fragmentation under Scale Differences. Ecol. Inform. 2023, 78, 102336. [Google Scholar] [CrossRef]
  67. Liu, S.; Zhao, X.; Zhang, F.; Qiu, A.; Chen, L.; Huang, J.; Chen, S.; Zhang, S. Spatial Downscaling of NPP-VIIRS Nighttime Light Data Using Multiscale Geographically Weighted Regression and Multi-Source Variables. Remote Sens. 2022, 14, 6400. [Google Scholar] [CrossRef]
  68. Jin, B.; Geng, J.; Ke, S.; Pan, H. Analysis of Spatial Variation of Street Landscape Greening and Influencing Factors: An Example from Fuzhou City, China. Sci. Rep. 2023, 13, 21767. [Google Scholar] [CrossRef]
  69. Akinwumiju, A.S.; Olorunfemi, M.O. Influence of Geochemistry and Topography on Vegetation in Tropical Nigeria: Geochemistry and Soil Thickness Surpass Topographic Position. CATENA 2023, 231, 107277. [Google Scholar] [CrossRef]
  70. Wang, X.; Shi, S.; Zhao, X.; Hu, Z.; Hou, M.; Xu, L. Detecting Spatially Non-Stationary between Vegetation and Related Factors in the Yellow River Basin from 1986 to 2021 Using Multiscale Geographically Weighted Regression Based on Landsat. Remote Sens. 2022, 14, 6276. [Google Scholar] [CrossRef]
  71. Liu, J.; Xie, T.; Lyu, D.; Cui, L.; Liu, Q. Analyzing the Spatiotemporal Dynamics and Driving Forces of Ecological Environment Quality in the Qinling Mountains, China. Sustainability 2024, 16, 3251. [Google Scholar] [CrossRef]
  72. Li, M.; Yan, Q.; Li, G.; Yi, M.; Li, J. Spatio-Temporal Changes of Vegetation Cover and Its Influencing Factors in Northeast China from 2000 to 2021. Remote Sens. 2022, 14, 5720. [Google Scholar] [CrossRef]
  73. Chu, H.; Venevsky, S.; Wu, C.; Wang, M. NDVI-Based Vegetation Dynamics and Its Response to Climate Changes at Amur-Heilongjiang River Basin from 1982 to 2015. Sci. Total Environ. 2019, 650, 2051–2062. [Google Scholar] [CrossRef]
  74. Meng, Z.; Liu, M.; Gao, C.; Zhang, Y.; She, Q.; Long, L.; Tu, Y.; Yang, Y. Greening and Browning of the Coastal Areas in Mainland China: Spatial Heterogeneity, Seasonal Variation and Its Influential Factors. Ecol. Indic. 2020, 110, 105888. [Google Scholar] [CrossRef]
  75. Tian, F.; Liu, L.-Z.; Yang, J.-H.; Wu, J.-J. Vegetation Greening in More than 94% of the Yellow River Basin (YRB) Region in China during the 21st Century Caused Jointly by Warming and Anthropogenic Activities. Ecol. Indic. 2021, 125, 107479. [Google Scholar] [CrossRef]
  76. Zhang, F.; Zhang, Z.; Kong, R.; Chang, J.; Tian, J.; Zhu, B.; Jiang, S.; Chen, X.; Xu, C.-Y. Changes in Forest Net Primary Productivity in the Yangtze River Basin and Its Relationship with Climate Change and Human Activities. Remote Sens. 2019, 11, 1451. [Google Scholar] [CrossRef]
  77. Qu, S.; Wang, L.; Lin, A.; Yu, D.; Yuan, M.; Li, C. Distinguishing the Impacts of Climate Change and Anthropogenic Factors on Vegetation Dynamics in the Yangtze River Basin, China. Ecol. Indic. 2020, 108, 105724. [Google Scholar] [CrossRef]
  78. Restrepo-Coupe, N.; da Rocha, H.R.; Hutyra, L.R.; da Araujo, A.C.; Borma, L.S.; Christoffersen, B.; Cabral, O.M.R.; de Camargo, P.B.; Cardoso, F.L.; da Costa, A.C.L.; et al. What Drives the Seasonality of Photosynthesis across the Amazon Basin? A Cross-Site Analysis of Eddy Flux Tower Measurements from the Brasil Flux Network. Agric. For. Meteorol. 2013, 182–183, 128–144. [Google Scholar] [CrossRef]
  79. Phillips, O.L.; Aragão, L.E.O.C.; Lewis, S.L.; Fisher, J.B.; Lloyd, J.; López-González, G.; Malhi, Y.; Monteagudo, A.; Peacock, J.; Quesada, C.A.; et al. Drought Sensitivity of the Amazon Rainforest. Science 2009, 323, 1344–1347. [Google Scholar] [CrossRef] [PubMed]
  80. Tuoku, L.; Wu, Z.; Men, B. Impacts of Climate Factors and Human Activities on NDVI Change in China. Ecol. Inform. 2024, 81, 102555. [Google Scholar] [CrossRef]
  81. Xu, F.; Hu, B.; Li, J.; Cui, R.; Liu, Z.; Jiang, Z.; Yin, X. Reassessment of Heavy Metal Pollution in Riverine Sediments of Hainan Island, China: Sources and Risks. Environ. Sci. Pollut. Res. 2018, 25, 1766–1772. [Google Scholar] [CrossRef]
  82. Zhang, S.; Ju, H. The regional differences and influencing factors of tourism development on Hainan Island, China. PLoS ONE 2021, 16, e0258407. [Google Scholar] [CrossRef]
Figure 1. Geographic location of Hainan Island (http://www.globallandcover.com (accessed on 8 May 2021)).
Forests 15 01334 g001
Figure 2. Time series trend and correlation of NDVIs: MODIS, SPOT and GIMMS.
Forests 15 01334 g002
Figure 3. Land use on Hainan Island. (ac) are the land use for the years 2000, 2010, and 2020, respectively, and (d) is derived from the other three.
Forests 15 01334 g003
Figure 4. Interannual variation in NDVI from 2000 to 2019.
Forests 15 01334 g004
Figure 5. Spatial distribution of mean NDVI, mean temperature, and precipitation on Hainan Island from 2000 to 2019; (a) NDVI; (b) temperature; (c) precipitation.
Forests 15 01334 g005
Figure 6. (a). The spatial pattern of NDVI changes on Hainan Island from 2000 to 2019 (Gray indicates non-significant changes, yellow indicates areas with a significant decrease in NDVI, and green indicates areas with a significant increase in NDVI); (b). Moran scatter diagram of NDVI.
Forests 15 01334 g006
Figure 7. Local R square map. (a) map of GWR; (b) map of MGWR.
Forests 15 01334 g007
Figure 8. Dominant factors of NDVI based on the MGWR model (a) map of dominant factors; (b) percentage of dominant factors; (c) regression coefficient values of the explanatory variables; (d) effect of explanatory variables.
Forests 15 01334 g008
Figure 9. Spatial pattern of regression coefficients for influencing factors of NDVI based on the MGWR model; (a) TEM: temperature; (b) PRE: precipitation; (c) SM: soil moisture; (d) PAR: photosynthetically active radiation; (e) POP: population; (f) GDP: Gross domestic product.
Forests 15 01334 g009
Figure 10. Percentage contribution explanation variables for NDVI. (TEM: temperature; PRE: precipitation; SM: soil moisture; PAR: photosynthetically active radiation; POP: population; GDP: Gross domestic product).
Forests 15 01334 g010
Figure 11. Nonlinear relationship of vegetation greening with natural and human variables explained by partial dependence plots. (a) TEM: temperature; (b) PRE: precipitation; (c) SM: soil moisture; (d) PAR: photosynthetically active radiation; (e) POP: population; (f) GDP: Gross domestic product.
Forests 15 01334 g011
Figure 12. Projected NDVI under three SSP-RCP scenarios. (ac) the NDVI distribution under the SSP119, SSP245, and SSP585 scenarios, respectively; (d) the comparison of predicted NDVI under different scenarios; (e) the spatial distribution of the difference in NDVI under future climate scenarios, which is the predicted future NDVI minus the current NDVI; (fh) the predicted NDVI changes under the SSP119, SSP245, and SSP585 scenarios, respectively.
Forests 15 01334 g012
Table 1. Description of explanatory variables and data sources.
DatasetsTimeSpatialSource
POP2000, 2005, 2010, 20151 kmhttps://www.resdc.cn/
(accessed on 3 June 2023)
GDP2000, 2005, 2010, 20151 kmhttps://www.resdc.cn/
(accessed on 6 June 2023)
TEM2000–20191 kmhttps://www.geodata.cn/
(accessed on 12 May 2023)
PRE2000–20191 kmhttps://www.geodata.cn/
(accessed on 24 July 2023)
PAR2000–20195 kmhttps://data.tpdc.ac.cn/
(accessed on 16 May 2023)
SM2000–20191 kmhttps://data.tpdc.ac.cn/
(accessed on 5 June 2023)
Table 2. Trend test of forest NDVI on Hainan Island from 2000 to 2019.
NDVI ChangePixelsProportion
Significant increase12,30264.42%
Significant decrease3441.80%
No significant change645133.78%
Table 3. Comparison of the OLS, GWR, and MGWR models.
ModelsAICcR2Adj. R2
OLS28,194.1240.4230.423
GWR10,616.4730.9060.887
MGWR9286.7890.9290.909
Disclaimer/Publisher’s Note: The statements, opinions and data contained in all publications are solely those of the individual author(s) and contributor(s) and not of MDPI and/or the editor(s). MDPI and/or the editor(s) disclaim responsibility for any injury to people or property resulting from any ideas, methods, instructions or products referred to in the content.

